Understanding the Fields in the Interface
Contents
Accessing the TelePresence IX5000 Administrator User Interface
The TelePresence IX5000 Administrator user interface is where you can monitor, configure, setup, troubleshoot, log, and restart or reset your IX system.
To view information about the Cisco TelePresence devices on your system:
Step 1![]() Log in to the Administrator user interface by completing the following steps:
Log in to the Administrator user interface by completing the following steps:
a.![]() Select an Internet browser from the list in the “$paratext>” section.
Select an Internet browser from the list in the “$paratext>” section.
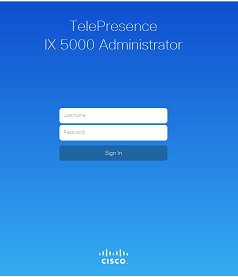
b.![]() Open the browser window, type the IP address of your IX system in the URL field, and click Enter. The Administrator Login screen appears, as shown in Figure 3-1.
Open the browser window, type the IP address of your IX system in the URL field, and click Enter. The Administrator Login screen appears, as shown in Figure 3-1.
Figure 3-1 Administrator Login Screen
c.![]() In the Username field, type admin.
In the Username field, type admin.
d.![]() In the Password field, type cisco.
In the Password field, type cisco.

Note![]() You can change the default password in Unified CM by changing the SSH admin Password field. For more information, see the “SSH Information Area” section of the Configuring Cisco Unified Communications Manager for the IX System document.
You can change the default password in Unified CM by changing the SSH admin Password field. For more information, see the “SSH Information Area” section of the Configuring Cisco Unified Communications Manager for the IX System document.
The Administrator home page opens as shown in Figure 3-2.
Figure 3-2 Administrator Home Page

Step 2![]() From the Administrator home page, you can navigate to and access data fields on various administrator tasks in the following areas:
From the Administrator home page, you can navigate to and access data fields on various administrator tasks in the following areas:
- Fields in the Monitoring Area
- Fields in the Configuration Area
- Fields in the First Time Setup Area
- Fields in the Hardware Area
- Fields in the Logs Area
- Fields in the Restart/Reset Area
Note![]() The Administrator home page always opens in the Monitoring area of the user interface.
The Administrator home page always opens in the Monitoring area of the user interface.
Fields in the Monitoring Area
The Monitoring area contains details about the settings that were configured in the IX system and the Unified CM. This section describes the data fields that display in the Monitoring area. The following system monitoring information is available:
Note![]() After accessing the Monitoring area of the Administrator interface, scroll down the page to view the data fields.
After accessing the Monitoring area of the Administrator interface, scroll down the page to view the data fields.
System Status
View the current operating status of the hardware components of the IX system from the System Status section. Figure 3-3 is an example of the top right section of the interface home page with the System Status component status indicators.
Figure 3-3 Monitoring > System Status Section
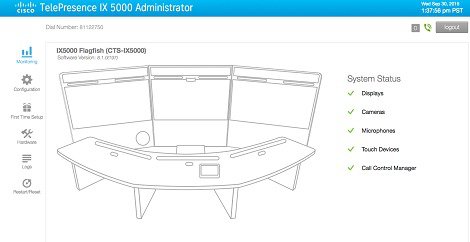
The System Status area shows you the operational statuses of your IX system devices. Configured and operational components are indicated by a green check mark; components not connected or configured are indicated by a red X.
Table 2-1 describes the System Status fields.
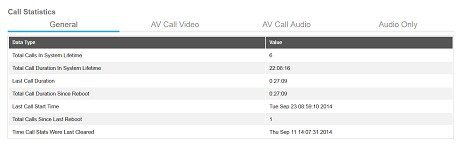
Call Statistics
Use Call Statistics to view audio and video statistics collected by the codecs. The reports include descriptions to help you understand the type of information being collected.
To view Call Statistics, choose Monitoring, and scroll down to Call Statistics. Click the appropriate tab to view a specific set of Call Statistics fields. Table 3-2 describes the Call Statistics fields which provide a history of all of your received and transmitted calls, including streaming video and audio calls.
Figure 3-4 Monitoring > Call Statistics Section
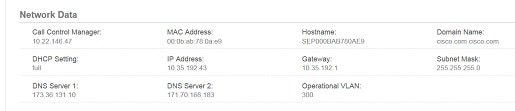
Network Data
View network name and address information in the Network Data section. Figure 3-5 shows the Network Data section in the Monitoring page.
To view Network Data, choose Monitoring, and scroll down to Network Data. The Network Data fields for the IX system are described in Table 3-3 .
Figure 3-5 Monitoring > Network Data Section
Fields in the Configuration Area
The Configuration area is where you configure DHCP and TFTP settings and upload 802.1X authentication certificates for your IX system. This section contains information on the data fields in the Configuration area. The following system configuration information is available:
Note![]() After accessing the Configuration area, you may need to scroll down the page to view the data fields.
After accessing the Configuration area, you may need to scroll down the page to view the data fields.
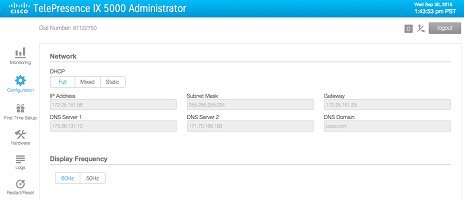
Network
The Network section in the Configuration area is where you can view or configure your IP address settings.
Figure 3-6 is an example of the Network and Display Frequency sections of the user interface. Table 3-5 describes the main Network fields and buttons.
Figure 3-6 Configuration > Network Section
|
|
|
|---|---|
Choose how you would like to set your network addressing by either enabling or not enabling DHCP. Options for setting DHCP addressing are Full, Mixed, or Static. If your system uses DHCP, select either Full or Mixed; if it does not use DHCP, select Static. |
|
These configuration options are available:
For more information about this field, see the “Network Settings” section. |
|
Identifies the location (IP Address) of the router on your network that serves as an access point to another network. |
|
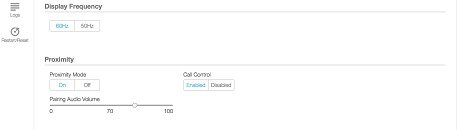
Display Frequency and Proximity
Figure 3-7 shows an example of the Display Frequency and Proximity sections of the user interface. Table 3-5 describes the fields in these sections.
Figure 3-7 Configuration > Display Frequency and Proximity Sections
|
|
|
|---|---|
Radio buttons allow users to choose between 50 Hz and 60 Hz: |
|
Note |
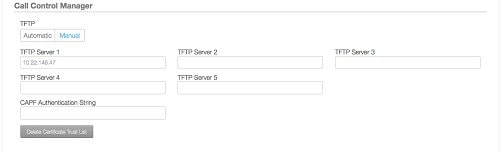
Call Control Manager
To view or configure your TFTP server settings, scroll down to the Call Control Manager section in the Configuration area. Use Call Control Manager to specify TFTP server locations and view a list of available settings for your system. Four TFTP options and a Delete Certificate Trust List button provide additional configuration options for your TFTP servers.
Figure 3-8 is an example of the Call Control Manager section (Manual mode) of the Administrator user interface. Table 3-6 describes the main Call Control Manager fields and buttons.
Figure 3-8 Configuration > Call Control Manager
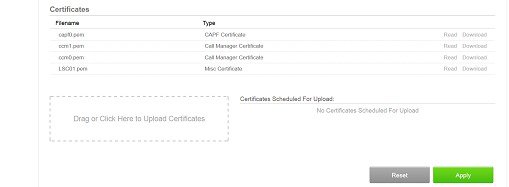
Certificates
To set up and view your 802.1x security authentication, scroll down to the Certificates section in the Configuration area of the user interface. For more information about certificates and configuring 802.1x security, see the “802.1X Authentication” section.
Figure 3-9 is an example of the Certificates section of the user interface. Table 3-7 describes the main Certificates fields and buttons.
Figure 3-9 Configuration > Certificates
|
|
|
|---|---|
Identifies a certificate file currently downloaded for the IX system. |
|
Identifies the type of certificate file downloaded. Includes:
|
|
Allows you to download a MIC or LSC from a source on your local computer. A dimmed Download button indicates the lack of an available certificate. |
|
Drag certificates to this block from the Certificates Scheduled For Upload field, or click to upload a certificate from your local computer to your IX system. |
|
View any certificates that are scheduled for uploading to your system. Displays No Certificates Scheduled For Upload if no certificates have been scheduled. |
|
Click Reset to cancel any changes you have just made to the fields on the Configuration page. The fields will reset to the values they had before you started making any changes. Once Apply is selected to accept the changes, however, Reset will no longer be able to reset or cancel those changes. |
|
Fields in the First Time Setup Area
Click the First Time Setup tab to begin the setup process for your IX system. Figure 3-10 shows the First Time Setup area in the Administrator interface.
Figure 3-10 First Time Setup Section
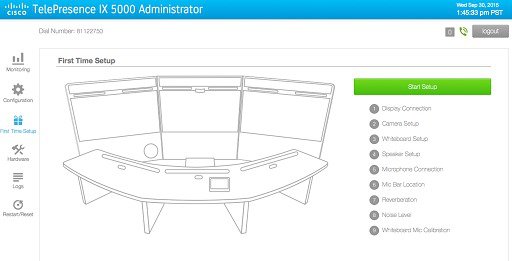
Table 3-8 describes the main setup fields and tests in the First Time Setup area of the Administrator user interface.
For more information about this setup procedure, refer to the IX5000 and IX5200 First-Time Setup document at the following URL:
https://www.cisco.com/c/en/us/td/docs/telepresence/ix5000/first_time_setup/ix5000_first_time_setup.html
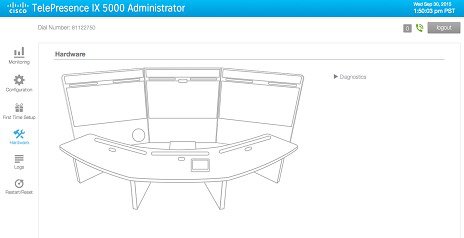
Fields in the Hardware Area
Click the Hardware tab to access the available troubleshooting tests for the IX system.
Figure 3-11 shows the Hardware area in the Administrator interface.
Click on the Diagnostics tab on the Hardware page to see the available diagnostic tests as shown in Figure 3-12:
Figure 3-12 Hardware > Diagnostics Tab
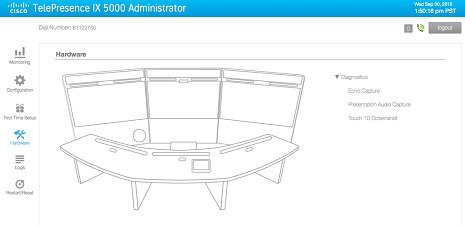
All capture test results and files can be accessed under the Logs > Captures tab.
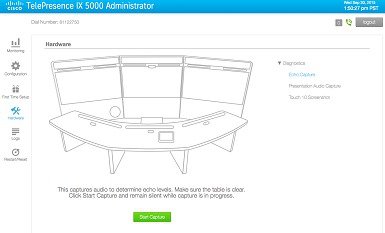
Echo Capture
This test captures audio to determine echo levels. Figure 3-13 shows the Echo Capture test screen.
Figure 3-13 Echo Capture Test Screen
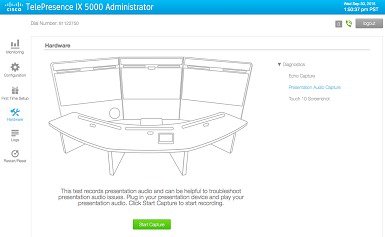
Presentation Audio Capture
This test records presentation audio and can be helpful in troubleshooting presentation audio issues. Figure 3-14 shows the Presentation Audio Capture test screen.
Figure 3-14 Presentation Audio Capture Test Screen
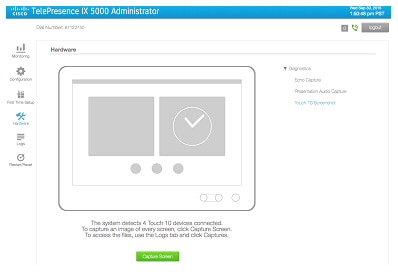
Touch 10 Screenshot
This test displays the number of touch devices that are detected as connected to the system. This test can also capture an image of every screen of the touch device. Figure 3-15 shows the Touch 10 Screenshot test screen.
Figure 3-15 Touch 10 Screenshot Test Screen
Fields in the Logs Area
The Logs area contains details about the configured settings in the IX5000 system and Unified CM. This document section describes the four main tabs in the Logs area. Tables 3-9 and 3-10 describe these tabs and their data fields and action buttons.
Three action buttons also appear on the Logs page tabs:
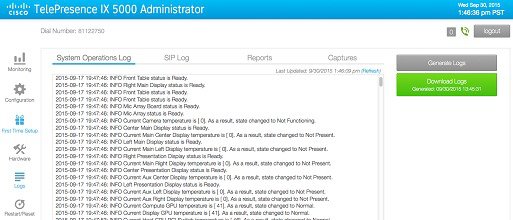
System Operations Log
Click the System Operations Log tab to view an ongoing log of System Operation (sysop) messages, including call information, call statistics, and call errors. Up to 20 individual files can be saved on the IX system, and each file can contain up to 100,000 characters. Figure 3-16 shows a sample System Operations Log window.
For detailed explanations of each of the sysop log messages, refer to the Cisco TelePresence System Message Guide.
To generate a sysop log file, click the Generate Logs button at the top right of the page. To download the sysop log files, click the Download Logs button that is located below Generate Logs. IX5000 Administration software then prompts you to do one of the following:
- Open to view the sysop log files—The last 100,000 bytes of the log are shown. When you download Sysop files, all available Sysop files will be downloaded.
- Save the sysop log files.
Figure 3-16 Logs > System Operations Log Section
|
|
|
|---|---|
Click this button to download a generated system operations log. |
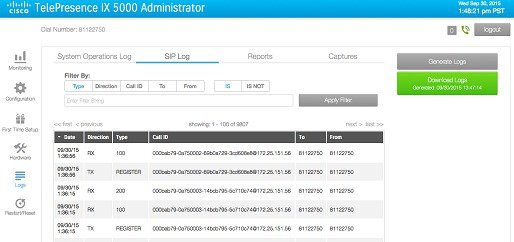
SIP Log
Session Initiation Protocol (SIP) request and response methods are used to establish communications between components in the network and ultimately to establish a call or session between two endpoints.
Click SIP Log to view an ongoing log of messages related to SIP negotiation when setting up and ending a call. Use the log filters to customize the content of your logs by changing the Direction, Type, Call ID, To, and From parameters to create a new SIP Log. Besides applying a filter to your SIP Log, you can also generate and download logs.
Figure 3-17 Logs > SIP Log Section
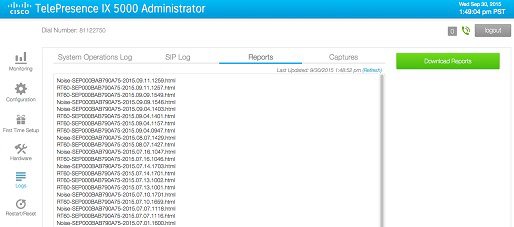
Reports
Click Reports to view generated reports on the noise level and reverberation tests that run during First Time Setup. Figure 3-18 is an example of what report files can be downloaded for review.
Captures
Click Captures to show the log files generated during hardware (troubleshooting) diagnostics. Captured logs include:
Figure 3-19 Logs > Captures Section
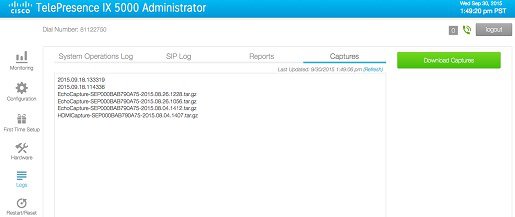
Click Download Captures to copy the captured log files to your device.
Fields in the Restart/Reset Area
The Restart/Reset area is where you can immediately restart your IX system or return the system back to its original factory default configuration.
This section contains information about the two options in the Restart/Reset area: System Restart and Factory Reset.
System Restart
Click System Restart to immediately restart your IX system. If you are in a call, however, note that this action will immediately end that call.
Factory Reset
Click Factory Reset to return your IX system settings to their original factory configuration values. As this reboot process may take up to two hours to complete, you should periodically check the status of the reboot on your Touch device.
Note![]() After the Factory Reset has completed, you MUST rerun First Time Setup and re-register your IX system in Unified CM.
After the Factory Reset has completed, you MUST rerun First Time Setup and re-register your IX system in Unified CM.
For more information on adding your system as a device in Unified CM, refer to the “Adding an IX System to Unified CM” section in the Configuring Cisco Unified Communications Manager for the IX System document.
Where to Go Next
Proceed to Chapter 4, “IX Software Features”, to understand, configure, and implement IX software features.
 Feedback