Administration Guide for Cisco TelePresence Software Release IX 8 and Later
Bias-Free Language
The documentation set for this product strives to use bias-free language. For the purposes of this documentation set, bias-free is defined as language that does not imply discrimination based on age, disability, gender, racial identity, ethnic identity, sexual orientation, socioeconomic status, and intersectionality. Exceptions may be present in the documentation due to language that is hardcoded in the user interfaces of the product software, language used based on RFP documentation, or language that is used by a referenced third-party product. Learn more about how Cisco is using Inclusive Language.
- Updated:
- December 10, 2014
Chapter: Monitoring the System
Monitoring the System
Contents
This chapter contains the following Monitoring page sections:
System Status
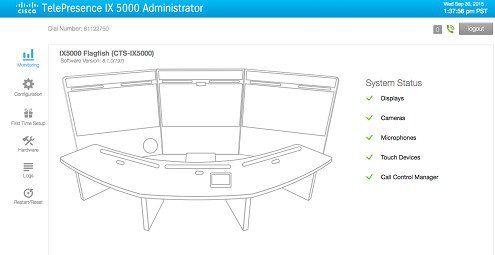
Use the System Status section to view the current operating statuses of the IX system hardware components. Colored icons next to each component indicate whether that component is connected and functional (green checkmark) or not connected or nonfunctional (red x).
Figure 6-1 shows a sample Monitoring page with the System Status section positioned on the right.
Figure 6-1 Monitoring > System Status Section
Call Statistics
Use the Call Statistics section to view audio and video call statistics collected by the codecs. Scroll down the Monitoring page to access this section.
Special Note for Statistics for HD Presentations
If you are sharing an HD presentation, the call statistics will appear in different places depending on whether the call is a point-to-point or multipoint call.
Viewing Call Statistics
Step 1![]() Navigate to Monitoring > Call Statistics to view tabs for the following IX system call statistics:
Navigate to Monitoring > Call Statistics to view tabs for the following IX system call statistics:
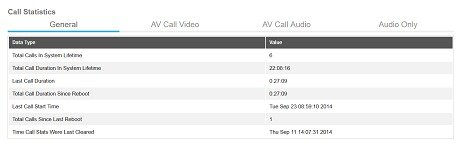
- General —Historical information about all system calls. See the sample Data Types and Values in Figure 6-2.
- AV Call Video —Video stream statistics of an in-progress TelePresence call for the Right, Center, or Left display. See sample statistics in Figure 6-3.
- AV Call Audio —Audio stream statistics of an in-progress TelePresence call.
- Audio Only —Audio add-in data for the in-progress TelePresence call.
Step 2![]() Click a tab for a desired statistics selection.
Click a tab for a desired statistics selection.
Figure 6-2 General Call Statistics
Click any of the three AV stream selections to get their specific statistics as in Figure 6-3.
Figure 6-3 AV Call Video Stream Statistics

Note that in the AV Call Video tab you view statistics for either the Right, Center, or Left system displays. View either transmit or receive statistics by clicking either the Transmit or the Receive button.

Note![]() For more information about jitter and packet loss, see the “Understanding Jitter and Defining Jitter Thresholds” section.
For more information about jitter and packet loss, see the “Understanding Jitter and Defining Jitter Thresholds” section.
Continue to scroll down the Monitoring page to the Network Data section to view your system’s transmission data.
Network Data
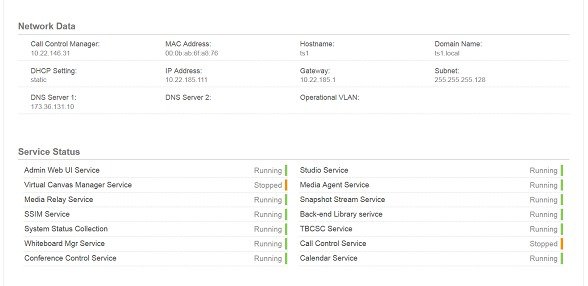
Use the Network Data section to view packet transmission statistics collected from the network. Data is listed in columns labeled as if you were looking at the back of the system. For example, on an IX5000, the labels would indicate statistics from the left, center, and right codecs.
To monitor network statistics:
Step 1![]() In the Monitoring page, scroll down to Network Data. Your network data appears as in Figure 6-4.
In the Monitoring page, scroll down to Network Data. Your network data appears as in Figure 6-4.
Figure 6-4 Network Data Section
Using SNMP Traps to Monitor the System
Cisco provides management information base (MIB) files that monitor your system using the Simple Network Management Protocol (SNMP). For more detail, refer to the “MIBs, RFCs, and SNMP Trap Messages for the Cisco TelePresence System” chapter of the Cisco TelePresence System Message Guide.
Where to Go Next
For more information about system statistics and messages, including System Operations (Sysops) Log messages, see the Cisco TelePresence System Message Guide at Cisco.com.
 Feedback