PDF(7.7 MB) View with Adobe Reader on a variety of devices
Updated:March 31, 2026
Bias-Free Language
The documentation set for this product strives to use bias-free language. For the purposes of this documentation set, bias-free is defined as language that does not imply discrimination based on age, disability, gender, racial identity, ethnic identity, sexual orientation, socioeconomic status, and intersectionality. Exceptions may be present in the documentation due to language that is hardcoded in the user interfaces of the product software, language used based on RFP documentation, or language that is used by a referenced third-party product. Learn more about how Cisco is using Inclusive Language.
First Published: December 1, 2021
Deploy a Cluster for Firewall Threat Defense on the Secure Firewall 3100/4200/6100
Clustering lets you group multiple Firewall Threat Defense nodes together as a single logical device. A cluster provides all the convenience of
a single device (management, integration into a network) while achieving the increased
throughput and redundancy of multiple devices.
About Clustering for the Secure Firewall 3100/4200/6100
This section describes the clustering architecture and how it
works.
How the Cluster Fits into Your Network
The cluster consists of multiple firewalls acting as a single unit. To act
as a cluster, the firewalls need the following infrastructure:
Isolated, high-speed backplane network for intra-cluster communication, known as the cluster control link.
Management access to each firewall for configuration and monitoring.
When you place the cluster in your network, the upstream and downstream
routers need to be able to load-balance the data coming to and from the cluster using
one of the following
methods:
Spanned EtherChannel (Recommended)—Interfaces on multiple
members of the cluster are grouped into a single EtherChannel; the EtherChannel
performs load balancing between units.
Policy-Based Routing (Routed firewall mode only)—The
upstream and downstream routers perform load balancing between units using route
maps and ACLs.
Equal-Cost Multi-Path Routing (Routed firewall mode
only)—The upstream and downstream routers perform load balancing between units
using equal cost static or dynamic routes.
Control and Data Node Roles
One member of the cluster
is the control node. If multiple cluster nodes come online at the same time, the control node
is determined by the priority setting; the priority is set between 1 and 100, where 1 is the highest priority.
All other members are data nodes. When you first create the cluster, you
specify which node you want to be the control node, and it will become the control node
simply because it is the first node added to the cluster.
All nodes in the cluster share the same configuration. The node that
you initially specify as the control node will overwrite the configuration on the data nodes
when they join the cluster, so you only need to perform initial configuration on the control
node before you form the cluster.
Some features do not scale
in a cluster, and the control node handles all traffic for those features.
Cluster Interfaces
You can configure data interfaces as
either
Spanned EtherChannels or as
Individual interfaces. All data interfaces in the cluster must be
one type only. See About Cluster Interfaces for more information.
For Spanned
EtherChannels: You can use regular firewall interfaces or
IPS-only interfaces (inline sets or passive interfaces). For Individual
interfaces: IPS-only interfaces are not supported.
Cluster Control Link
Each unit must dedicate at least one hardware interface as the cluster control link. See Cluster Control Link for more information.
Configuration
Replication
All nodes in the cluster share a single configuration. You can only make
configuration changes on the control node (with the exception of the bootstrap
configuration), and changes are automatically synced to all other nodes in the
cluster.
Management Network
You must manage each node using the Management interface; management from a data
interface is not supported with clustering.
Licenses for clustering
You assign feature licenses to the cluster as a whole, not to individual
nodes. However, each node of the cluster consumes a separate license
for each feature. The clustering feature itself does not require any
licenses.
When you add the control node to the Firewall Management Center, you can specify the feature licenses you want to use for the cluster. Before you create the cluster, it doesn't matter which licenses are assigned to the data nodes; the license settings for the
control node are replicated to each of the data nodes. You can modify licenses for the cluster by clicking Edit Licenses in Administration > Licenses > Smart Licenses or choosing Devices > Device Management, clicking Edit () for the cluster, and then in the License area, clicking Edit ().
Note
If you add the cluster before the Firewall Management Center is licensed (and running in Evaluation mode), then when
you license the Firewall Management Center, you can experience traffic disruption when you deploy
policy changes to the cluster. Changing to licensed mode
causes all data units to leave the cluster and then
rejoin.
Requirements and Prerequisites for Clustering
Model Requirements
Secure Firewall 3100—Maximum 16 nodes
Secure Firewall 4200—Maximum 16 nodes
Secure Firewall 6100—Maximum 4 nodes
User roles
Admin
Access Admin
Network Admin
Hardware and Software Requirements
All units in a cluster:
Must be the same model.
Must include the same interfaces.
The Firewall Management Center access must be from the Management interface; data interface management
is not supported.
Must run the identical software
except at the time of an image upgrade. Hitless upgrade is supported.
Must be in the same firewall mode, routed or
transparent.
Must be in the same domain.
Must be in the same group.
Must not have any deployment pending or in progress.
Data nodes must not have any VPN configured. The control node can have
site-to-site VPN configured.
Switch Requirements
Be sure to complete the switch configuration before you configure
clustering. Make sure the ports connected to the cluster control link have
the correct (higher) MTU configured. By default, the cluster control link
MTU is set to 100 bytes higher than the data interfaces. If the switches
have an MTU mismatch, the cluster formation will fail.
Guidelines for Clustering
Firewall Mode
The firewall mode must match on all units.
High Availability
High Availability is not
supported with clustering.
IPv6
The cluster control link is only
supported using IPv4.
Switches
Make sure connected switches match the MTU for both cluster data interfaces and the cluster
control link interface. You should configure the cluster control link
interface MTU to be at least 100 bytes higher than the data interface
MTU, so make sure to configure the cluster control link connecting
switch appropriately. Because the cluster control link traffic includes
data packet forwarding, the cluster control link needs to accommodate
the entire size of a data packet plus cluster traffic overhead.
In addition, we do not recommend setting the cluster
control link MTU between 2561 and 8362; due to block pool handling, this
MTU size is not optimal for system operation. When a node joins the cluster, the
control node sends a ping to the data node with a payload size of
twice the MTU. This process tests the network's ability to handle
packet fragmentation because the underlying IP layer will fragment
packets that exceed the MTU limit. A successful ping confirms that
the network path supports proper fragmentation and that the cluster
control link can reliably process traffic at the configured MTU
size. If the ping fails, the control node logs the event (see
show cluster history) with
MASTER MASTER Event: CCL MTU test to unit name
                                    									failed
. The following warning is also printed to the
console: WARNING: Unit name is not reachable in CCL
jumbo frame ICMP test, please check cluster interface and switch
MTU configuration. The node is still allowed to join
the cluster despite this failure.To determine the correct MTU, the
joining node checks MTU compatibility by sending a ping to the
control node with a packet size matching the cluster control link
MTU. If the initial ping fails, the node tries a ping using a
smaller packet size (the MTU divided by 2, then by 4, then by 8)
until a ping succeeds. A notification is generated so you can
fix the MTU mismatch on connecting switches and try again.
For Cisco IOS XR systems, if you want to set a non-default MTU, set the IOS XR interface
MTU to be 14 bytes higher than the cluster device MTU. Otherwise, OSPF
adjacency peering attempts may fail unless the mtu-ignore option
is used. Note that the cluster device MTU should match the IOS XR
IPv4 MTU. This adjustment is not required for Cisco Catalyst
and Cisco Nexus switches.
On the switch(es)
for the cluster control link interfaces, you can optionally enable Spanning
Tree PortFast on the switch ports connected to the cluster unit to speed up the
join process for new units.
On the switch, we recommend that you use one of the following
EtherChannel load-balancing algorithms: source-dest-ip or src-dst-mixed-ip-port (see the Cisco Nexus OS and Cisco IOS-XE
port-channel load-balance command). Do
not use a vlan keyword in the load-balance
algorithm because it can cause unevenly distributed traffic to the
devices in a cluster.
If you change the load-balancing algorithm of the EtherChannel
on the switch, the EtherChannel interface on the switch temporarily stops
forwarding traffic, and the Spanning Tree Protocol restarts. There will be a
delay before traffic starts flowing again.
Switches on the cluster control link path should not verify the L4 checksum. Redirected traffic over the cluster control link
does not have a correct L4 checksum. Switches that verify the L4 checksum could cause traffic to be dropped.
Port-channel bundling downtime should not exceed the configured
keepalive interval.
On Supervisor 2T EtherChannels, the default hash distribution algorithm is adaptive. To avoid asymmetric traffic in a VSS
design, change the hash algorithm on the port-channel connected to the cluster device to fixed:
Do not change the algorithm globally; you may want to take
advantage of the adaptive algorithm for the VSS peer link.
You should disable the LACP Graceful Convergence feature on all
cluster-facing EtherChannel interfaces for Cisco Nexus switches.
EtherChannels
In Catalyst 3750-X Cisco IOS software versions earlier than 15.1(1)S2,
the cluster unit did not support connecting an EtherChannel to a switch
stack. With default switch settings, if the cluster unit EtherChannel is
connected cross stack, and if the control unit switch is powered down,
then the EtherChannel connected to the remaining switch will not come
up. To improve compatibility, set the stack-mac persistent
timer command to a large enough value to account
for reload time; for example, 8 minutes or 0 for indefinite. Or, you can
upgrade to more a more stable switch software version, such as
15.1(1)S2.
Spanned vs. Device-Local EtherChannel Configuration—Be sure to
configure the switch appropriately for Spanned EtherChannels vs. Device-local
EtherChannels.
Spanned EtherChannels—For cluster unit
Spanned EtherChannels, which span across all members of the
cluster, the interfaces are combined into a single EtherChannel on the switch.
Make sure each interface is in the same channel group on the switch.
Device-local EtherChannels—For cluster unit
Device-local
EtherChannels including any EtherChannels configured for
the cluster control link, be sure to configure discrete EtherChannels on the
switch; do not combine multiple cluster unit EtherChannels into one
EtherChannel on the switch.
Additional Guidelines
When significant topology changes occur (such as adding or
removing an EtherChannel interface, enabling or disabling an interface on the Firewall Threat Defense or the switch, adding an additional switch to form a VSS or vPC) you should disable
the health check feature and also disable interface monitoring for the disabled
interfaces. When the topology change is complete, and the configuration change is synced
to all units, you can re-enable the interface health check feature.
When adding a unit to an existing cluster, or when reloading a
unit, there will be a temporary, limited packet/connection drop; this is expected
behavior. In some cases, the dropped packets can hang your connection; for example,
dropping a FIN/ACK packet for an FTP connection will make the FTP client hang. In this
case, you need to reestablish the FTP connection.
If you use a Windows 2003 server connected to a Spanned
EtherChannel, when the syslog server port is down and the server does not throttle ICMP
error messages, then large numbers of ICMP messages are sent back to the ASA cluster.
These messages can result in some units of the ASA cluster experiencing high CPU, which
can affect performance. We recommend that you throttle ICMP error messages.
For decrypted TLS/SSL connections, the decryption states are not synchronized, and if
the connection owner fails, then decrypted connections will be reset. New connections
will need to be established to a new unit. Connections that are not decrypted (they
match a do-not-decrypt rule) are not affected and are replicated correctly.
Defaults for Clustering
The cLACP system ID is auto-generated, and the system priority is
1 by default.
The cluster health check feature is enabled by default with the holdtime of 3 seconds.
Interface health monitoring is enabled on all interfaces by default.
The cluster auto-rejoin feature for a failed cluster control link is unlimited attempts
every 5 minutes.
The cluster auto-rejoin feature for a failed data interface is 3 attempts every 5
minutes, with the increasing interval set to 2.
Connection replication delay of 5 seconds is enabled by default for HTTP traffic.
Configure Clustering
To add a cluster to the Firewall Management Center, add each node to the Firewall Management Center as a standalone unit, configure interfaces on the unit you want to make the control
node, and then form the cluster.
About Cluster Interfaces
You can configure data interfaces as either
Spanned EtherChannels or as
Individual interfaces. All data interfaces in the cluster must be
one type only. You cannot configure Ethernet 1/1 as a Spanned
EtherChannel and configure Ethernet 1/2 as an Individual interface
within the same cluster, for example.
For
Spanned EtherChannels: You can use regular firewall interfaces
or IPS-only interfaces (inline sets or passive interfaces). For Individual
interfaces: IPS-only interfaces are not supported.
Each unit must also dedicate at least one hardware
interface as the cluster control link.
Cluster Control Link
Each unit must dedicate at least one hardware interface as the cluster
control link. We recommend using an EtherChannel for the cluster control link if
available.
Cluster Control Link
Traffic Overview
Cluster control link traffic includes both control and data
traffic.
Control traffic includes:
Control node election.
Configuration replication.
Health monitoring.
Data traffic includes:
State replication.
Connection ownership queries and data packet forwarding.
Cluster Control Link Interfaces and Network
You can use any physical interface or EtherChannel for the cluster
control link. You cannot use a VLAN subinterface as the cluster control link. You also
cannot use the Management interface.
Each cluster control link has an IP address on the same subnet.
This subnet should be isolated from all other traffic, and should include only the
cluster control link interfaces.
Note
For a 2-member cluster, do not directly-connect the cluster
control link from one node to the other node. If you directly connect the
interfaces, then when one unit fails, the cluster control link fails, and thus the
remaining healthy unit fails. If you connect the cluster control link through a
switch, then the cluster control link remains up for the healthy unit. If you need
to directly-connect the units (for testing purposes, for example), then you should
configure and enable the cluster control link interface on both nodes before you
form the cluster.
Size the Cluster Control Link
If possible, you should size the cluster control link to match the
expected throughput of each chassis so the cluster control link can handle the
worst-case scenarios.
Cluster control link traffic is comprised mainly of state update
and forwarded packets. The amount of traffic at any given time on the cluster control
link varies. The amount of forwarded traffic depends on the load-balancing efficacy or
whether there is a lot of traffic for centralized features. For example:
NAT results in poor load balancing of connections, and the
need to rebalance all returning traffic to the correct units.
When membership changes, the cluster needs to rebalance a
large number of connections, thus temporarily using a large amount of cluster
control link bandwidth.
A higher-bandwidth cluster control link helps the cluster to
converge faster when there are membership changes and prevents throughput bottlenecks.
Note
If your cluster has large amounts of asymmetric (rebalanced)
traffic, then you should increase the cluster control link size.
Cluster Control Link Redundancy
The following diagram shows how to use an EtherChannel as a cluster
control link in a Virtual Switching System (VSS), Virtual Port Channel (vPC), StackWise,
or StackWise Virtual environment. All links in the EtherChannel are active. When the
switch is part of a redundant system, then you can connect firewall interfaces within
the same EtherChannel to separate switches in the redundant system. The switch
interfaces are members of the same EtherChannel port-channel interface, because the
separate switches act like a single switch. Note that this EtherChannel is device-local,
not a Spanned EtherChannel.
Cluster Control Link Reliability
To ensure cluster control link functionality, be sure the
round-trip time (RTT) between units is less than 20 ms. This maximum latency enhances
compatibility with cluster members installed at different geographical sites. To check
your latency, perform a ping on the cluster control link between units.
The cluster control link must be reliable, with no out-of-order or
dropped packets; for example, for inter-site deployment, you should use a dedicated
link.
Spanned EtherChannels
(Recommended)
You can group one or more interfaces per chassis into an
EtherChannel that spans all chassis in the cluster. The EtherChannel
aggregates the traffic across all the available active interfaces in the
channel.
For regular firewall
interfaces:A Spanned EtherChannel can be configured in both routed
and transparent firewall modes. In routed mode, the EtherChannel is
configured as a routed interface with a single IP address. In transparent
mode, the IP address is assigned to the BVI, not to the bridge group member
interface.
The EtherChannel inherently provides load balancing as
part of basic operation.
Spanned EtherChannel Benefits
The EtherChannel method of load-balancing is recommended over other methods for the following benefits:
Faster failure discovery.
Faster convergence time. Individual interfaces rely on routing protocols to load-balance traffic, and routing protocols often
have slow convergence during a link failure.
Ease of configuration.
Guidelines for Maximum Throughput
To achieve maximum throughput, we recommend the
following:
Use a load-balancing hash algorithm that is “symmetric,” meaning that
packets from both directions will have the same hash and will be sent to the
same Firewall Threat
Defense in the Spanned EtherChannel. We recommend using the source and destination IP
address (the default) or the source and destination port as the hashing
algorithm.
Use the same type of line cards when connecting the Firewall Threat
Defenses to the switch so that hashing algorithms applied to all packets are the
same.
Load Balancing
The EtherChannel link is selected using a proprietary hash algorithm, based on source or destination IP addresses and TCP
and UDP port numbers.
Note
On the switch, we recommend that
you use one of the following algorithms: source-dest-ip
or source-dest-ip-port (see the Cisco Nexus OS or
Cisco IOS port-channel load-balance command). Do not
use a vlan keyword in the load-balance algorithm
because it can cause unevenly distributed traffic to the nodes in a cluster.
The number of links in the EtherChannel affects load balancing.
Symmetric load balancing is not always possible. If you configure NAT, then forward and return packets will have different
IP addresses and/or ports. Return traffic will be sent to a different unit based on the hash, and the cluster will have to
redirect most returning traffic to the correct unit.
EtherChannel Redundancy
The EtherChannel has built-in redundancy. It monitors the line protocol status of all links. If one link fails, traffic is
re-balanced between remaining links. If all links in the EtherChannel fail on a particular unit, but other units are still
active, then the unit is removed from the cluster.
Connecting to a Redundant Switch System
You can include multiple interfaces per Firewall Threat
Defense in the Spanned EtherChannel. Multiple interfaces per Firewall Threat
Defense are especially useful for connecting to both switches in a VSS, vPC, StackWise, or
StackWise Virtual system.
Depending on your switches, you can configure up to 32 active links
in the spanned EtherChannel. This feature requires both switches in the vPC to support
EtherChannels with 16 active links each (for example the Cisco Nexus 7000 with F2-Series
10 Gigabit Ethernet Module).
For switches that support 8 active links in the EtherChannel, you
can configure up to 16 active links in the spanned EtherChannel when connecting to two
switches in a redundant system.
The following figure shows a 16-active-link spanned EtherChannel in
a 4-node cluster and an 8-node cluster.
Individual
Interfaces (Routed Firewall Mode Only)
Individual interfaces are normal routed interfaces, each with their own
Local IP address used for routing. The Main cluster IP address for each interface is a
fixed address that always belongs to the control node. When the control node
changes, the Main cluster IP address moves to the new control node, so
management of the cluster continues seamlessly.
IPS-only interfaces (inline sets and passive interfaces)
are not supported as Individual interfaces.
Because interface configuration must be configured only on the control node, you
configure a pool of IP addresses to be used for a given interface on the cluster
nodes, including one for the control node.
Load balancing must be configured separately on the
upstream switch.
Policy-Based Routing
When using Individual interfaces, each Firewall Threat Defense interface maintains its own IP address and MAC address. One method of load balancing
is Policy-Based Routing (PBR).
We recommend this method if you are already using PBR, and want to
take advantage of your existing infrastructure.
PBR makes routing decisions based on a route map and ACL. You must
manually divide traffic between all Firewall Threat Defenses in a cluster. Because PBR is static, it may not achieve the optimum load balancing
result at all times. To achieve the best performance, we recommend that you configure
the PBR policy so that forward and return packets of a connection are directed to the
same Firewall Threat Defense. For example, if you have a Cisco router, redundancy can be achieved by using Cisco
IOS PBR with Object Tracking. Cisco IOS Object Tracking monitors each Firewall Threat Defense using ICMP ping. PBR can then enable or disable route maps based on reachability of a
particular Firewall Threat Defense. See the following URLs for more details:
When using Individual interfaces, each Firewall Threat Defense interface maintains its own IP address and MAC address. One method of load balancing
is Equal-Cost Multi-Path (ECMP) routing.
We recommend this method if you are already using ECMP, and want to
take advantage of your existing infrastructure.
ECMP routing can forward packets over multiple “best paths” that
tie for top place in the routing metric. Like EtherChannel, a hash of source and
destination IP addresses and/or source and destination ports can be used to send a
packet to one of the next hops. If you use static routes for ECMP routing, then the Firewall Threat Defense failure can cause problems; the route continues to be used, and traffic to the failed
Firewall Threat Defense will be lost. If you use static routes, be sure to use a static route monitoring
feature such as Object Tracking. We recommend using dynamic routing protocols to add and
remove routes, in which case, you must configure each Firewall Threat Defense to participate in dynamic routing.
Cisco Intelligent Traffic Director (Routed Firewall Mode Only)
When using Individual interfaces, each Firewall Threat Defense interface maintains its own IP address and MAC address. Intelligent Traffic Director
(ITD) is a high-speed hardware load-balancing solution for Nexus 5000, 6000, 7000, and
9000 switch series. In addition to fully covering the functional capabilities of
traditional PBR, it offers a simplified configuration workflow and multiple additional
features for a more granular load distribution.
ITD supports IP stickiness, consistent hashing for bi-directional flow symmetry, virtual IP
addressing, health monitoring, sophisticated failure handling policies with N+M
redundancy, weighted load-balancing, and application IP SLA probes including DNS. Due to
the dynamic nature of load-balancing, it achieves a more even traffic distribution
across all cluster nodes as compared to PBR. In order to achieve bi-directional flow
symmetry, we recommend configuring ITD such that forward and return packets of a
connection are directed to the same Firewall Threat Defense. See the following URL for more details:
Cable and Add Devices to the Firewall Management Center
Before configuring clustering, you need to prepare your devices. In particular, the
cluster will not come up unless all nodes can communicate over the cluster control
link. Therefore, before you form the cluster, the cluster control link must be ready
to go.
Procedure
Step 1
Cable the cluster control link network, management network, and data
networks.
Step 2
Configure the upstream and downstream equipment.
For the cluster control link network, set the MTU to be at least 100
bytes higher than the data interface MTU.
By default, the data interface MTU is 1500 bytes, so the cluster
control link MTU on the cluster node will be set to 1600 bytes. If
you use higher MTUs on your data interfaces, increase the cluster
control link MTU on connecting switches accordingly.
Configure cluster control link interfaces on upstream and downstream
equipment, including for an optional EtherChannel.
Add each node to the Firewall Management Center as a standalone device in the same domain and group.
You can
create a cluster with a single device, and then add more nodes later. The
initial settings (licensing, access control policy) that you set when you
add a device will be inherited by all cluster nodes from the control node.
You will choose the control node when forming the cluster.
Step 4
Enable the cluster control link on the device you want to be the control
node.
When you add the other nodes, they will inherit the cluster control link
configuration.
Note
Do not configure the name or IP addressing for the cluster control
link. The MTU of the cluster control link
interface is automatically set to 100 bytes more than the highest
data interface MTU when you form the cluster, so you do not need to
set it now. However, we do not recommend setting
the cluster control link MTU between 2561 and 8362; due to block
pool handling, this MTU size is not optimal for system operation. If
the MTU is set in this range when you add the cluster, we recommend
returning to the Interfaces page and manually
increasing it above 8362.When a node joins the
cluster, it checks MTU compatibility by sending a ping to the
control node with a packet size matching the cluster control link
MTU. If the initial ping fails, the node tries a ping using a
smaller packet size (the MTU divided by 2, then by 4, then by 8)
until a ping succeeds. A notification is generated so you can fix
the MTU mismatch on connecting switches and try again.
On the device you want to be the control node, choose Devices > Device Management, and click Edit ().
Click Interfaces.
Enable the interface. If you are going to use an EtherChannel for the
cluster control link, enable all members.
Figure 1. Enable the Cluster Control Link Interface
(Optional) Add an EtherChannel.
We recommend using the On mode for cluster
control link member interfaces to reduce unnecessary traffic on the
cluster control link (Active mode is the default). The cluster
control link does not need the overhead of LACP traffic because it
is an isolated, stable network. Note:
We recommend setting data
EtherChannels to Active mode.
Click Save and then
Deploy to deploy the interface changes to the
control node.
Create a Cluster
Form a cluster from one or more devices in the Firewall Management Center.
Procedure
Step 1
Choose Devices > Device Management, and then choose Add > Cluster.
The Add Cluster Wizard appears.
Figure 2. Add Cluster Wizard
Step 2
Specify a Cluster Name and an authentication
Cluster Key for control traffic.
Cluster Name—An ASCII string from 1 to 38
characters.
Cluster Key—An ASCII
string from 1 to 63 characters. The Cluster
Key value is used to generate the encryption key.
This encryption does not affect datapath traffic, including
connection state update and forwarded packets, which are always sent
in the clear.
Step 3
For the Control Node, set the following:
Node—Choose the device that you want to be the
control node initially. When the Firewall Management Center forms the cluster, it will add this node to the cluster first so
it will be the control node.
Note
If you see an Error () icon next to the node name, click the icon to view
configuration issues. You must cancel cluster formation, resolve
the issues, and then return to cluster formation. For
example:
Figure 3. Configuration Issues
To resolve the above issues, remove the unsupported VPN license
and deploy pending configuration changes to the device.
Cluster Control Link Network—Specify an IPv4
subnet; IPv6 is not supported for this interface. Specify a
24, 25,
26, or 27
subnet.
Cluster Control Link—Choose the physical
interface or EtherChannel you want to use for the cluster control
link.
Note
The MTU of the cluster control link interface is automatically set to 100 bytes more than the highest data interface MTU;
by default, the MTU is 1600 bytes. We do not recommend setting the cluster control link MTU between 2561 and 8362; due to
block pool handling, this MTU size is not optimal for system operation. If the MTU is set in this range when you add the cluster,
we recommend increasing the MTU above 8362 on the Devices > Device Management and then click on Interfaces page.
Make sure you configure switches connected to the cluster control
link to the correct (higher) MTU; otherwise, cluster formation
will fail. When a node joins the cluster, the
control node sends a ping to the data node with a payload size of
twice the MTU. This process tests the network's ability to handle
packet fragmentation because the underlying IP layer will fragment
packets that exceed the MTU limit. A successful ping confirms that
the network path supports proper fragmentation and that the cluster
control link can reliably process traffic at the configured MTU
size. If the ping fails, the control node logs the event (see
show cluster history) with
MASTER MASTER Event: CCL MTU test to unit name
                                                            									failed
. The following warning is also printed to the
console: WARNING: Unit name is not reachable in CCL
jumbo frame ICMP test, please check cluster interface and switch
MTU configuration. The node is still allowed to join
the cluster despite this failure.To determine the correct MTU, the
joining node checks MTU compatibility by sending a ping to the
control node with a packet size matching the cluster control link
MTU. If the initial ping fails, the node tries a ping using a
smaller packet size (the MTU divided by 2, then by 4, then by 8)
until a ping succeeds. A notification is generated so you can
fix the MTU mismatch on connecting switches and try again.
Cluster Control Link IPv4 Address—This field
will be auto-populated with the first address on the cluster control
link network. You can edit the host address if desired.
Priority—Set the priority of this node for
control node elections. The priority is between 1 and 100, where 1
is the highest priority. Even if you set the priority to be lower
than other nodes, this node will still be the control node when the
cluster is first formed.
Site ID—(FlexConfig feature) Enter the site ID
for this node between 1 and 8. A value of 0 disables inter-site
clustering. Additional inter-site cluster customizations to enhance
redundancy and stability, such as director localization, site
redundancy, and cluster flow mobility, are only configurable using
the FlexConfig feature.
Step 4
For the Cluster Mode, choose Spanned
EtherChannel Mode or Individual Interface
Mode.
Step 5
For Data Nodes (Optional), click Add a data
node to add a node to the cluster.
You can form the cluster with only the control node for faster cluster
formation, or you can add all nodes now. Set the following for each data
node:
Node—Choose the device that you want to
add.
Note
If you see an Error () icon next to the node name, click the icon to view
configuration issues. You must cancel cluster formation, resolve
the issues, and then return to cluster formation.
Cluster Control Link IPv4 Address—This field
will be auto-populated with the next address on the cluster control
link network. You can edit the host address if desired.
Priority—Set the priority of this node for
control node elections. The priority is between 1 and 100, where 1
is the highest priority.
Site ID—(FlexConfig feature) Enter the site ID
for this node between 1 and 8. A value of 0 disables inter-site
clustering. Additional inter-site cluster customizations to enhance
redundancy and stability, such as director localization, site
redundancy, and cluster flow mobility, are only configurable using
the FlexConfig feature.
Step 6
Click Continue. Review the
Summary, and then click
Save.
The cluster name shows on the Devices > Device Management page; expand the cluster to see the cluster nodes.
Figure 4. Cluster Management
A node that is currently registering shows the loading icon.
Figure 5. Node Registration
You can monitor cluster node registration by clicking the
Notifications icon and choosing
Tasks. The Firewall Management Center updates the Cluster Registration task as each node registers.
Step 7
Configure device-specific settings by clicking the Edit () for the cluster.
Most configuration can be applied to the cluster as a whole, and not nodes in
the cluster. For example, you can change the display name per node, but you
can only configure interfaces for the whole cluster.
Step 8
On the Devices > Device Management and then choose Add, Cluster screen, you see General and other settings for the cluster.
Figure 6. Cluster Settings
See the following cluster-specific items in the General area:
General > Name—Change the cluster display name by clicking the Edit ().
Then set the Name field.
General > Cluster Live Status—Click the View link to open the Cluster Status dialog box.
The Cluster Status dialog box also lets you retry data unit registration by clicking Reconcile All. You can also ping the cluster control link from a node. See Perform a Ping on the Cluster Control Link.
General > Troubleshoot—You can generate and download troubleshooting logs, and you can view cluster CLIs. See Troubleshooting the Cluster.
Figure 7. Troubleshoot
Step 9
On the Devices > Device Management and then choose Add, Device, you can choose each member in the cluster from the top right drop-down menu and configure the following settings.
Figure 8. Device Settings
Figure 9. Choose Node
General > Name—Change the cluster member display name by clicking the Edit ().
Then set the Name field.
Management > Host—If you change the management IP address in the device configuration, you must match the new address in the Firewall Management Center so that it can reach the device on the network. First disable the connection, edit the Host address in the Management area, then re-enable the connection.
Configure Interfaces
You can configure data interfaces as either Spanned EtherChannels or as Individual
interfaces. Each method uses a different load-balancing mechanism. You cannot configure
both types in the same configuration.
Configure Spanned EtherChannels
Configure data interfaces as Spanned EtherChannels.
Procedure
Step 1
Choose Devices > Device Management, and click Edit () next to the cluster.
Step 2
Click Interfaces.
Step 3
Configure Spanned EtherChannel data interfaces.
Configure one or more EtherChannels.
You can include one or more member interfaces in the EtherChannel.
Because this EtherChannel is spanned across all of the nodes, you
only need one member interface per node; however, for greater
throughput and redundancy, multiple members are recommended.
(Optional) For regular firewall interfaces, configure VLAN subinterfaces on the
EtherChannel. The rest of this procedure applies to the
subinterfaces.
Click Edit () for the EtherChannel interface.
Configure the name and other parameters.
If the cluster control link interface MTU is not at least 100
bytes higher than the data interface MTU, you will see an
error that you must reduce the MTU of the data interface. By default, the cluster
control link MTU is 1600 bytes. If you want to increase
the MTU of data interfaces, first increase the cluster
control link MTU. Note that we do not recommend setting
the cluster control link MTU between 2561 and 8362; due
to block pool handling, this MTU size is not optimal for
system operation.
For routed mode, DHCP, PPPoE, IPv6 autoconfig and manual
link-local addresses are not supported. For point-to-point
connections, you can specify a 31-bit subnet mask
(255.255.255.254). In this case, no IP addresses are
reserved for the network or broadcast addresses.
Set a unique, manual global MAC address for the EtherChannel. Click
Advanced, and in the Active Mac
Address field, enter a MAC address in H.H.H format,
where H is a 16-bit hexadecimal digit.
For example, the MAC address 00-0C-F1-42-4C-DE would be entered as
000C.F142.4CDE. The MAC address must not have the multicast bit set,
that is, the second hexadecimal digit from the left cannot be an odd
number.
Do not set the Standby Mac Address; it is
ignored.
You must configure a unique MAC address not currently in use on your
network for a Spanned EtherChannel to avoid potential network
connectivity problems. With a manually-configured MAC address, the
MAC address stays with the current control unit. If you do not
configure a MAC address, then if the control unit changes, the new
control unit uses a new MAC address for the interface, which can
cause a temporary network outage.
Click OK. Repeat the above steps for other data
interfaces.
Step 4
Click
Save.
You can now go to Deploy > Deploy and deploy the policy to assigned devices. The changes are not active until you deploy them.
Configure Individual Interfaces
Individual interfaces are normal routed interfaces, each with
their own IP address taken from a pool of IP addresses. The Main cluster IP address
is a fixed address for the cluster that always belongs to the control node.
Individual management interfaces let you SSH directly to each
unit if necessary, while a Spanned EtherChannel interface only allows connection to
the control node.
IPS-only interfaces (inline sets or passive interfaces) are not supported for
Individual interfaces.
Before you begin
You must be in Individual interface mode.
Individual interfaces require you to configure load
balancing on neighbor devices. External load balancing is not required for
the management interface.
(Optional) Configure the interface as a device-local
EtherChannel interface, and/or configure subinterfaces.
For an EtherChannel, this EtherChannel is local to the
unit, and is not a Spanned EtherChannel.
Procedure
Step 1
Choose Objects > Address Pools to add an IPv4 and/or IPv6 address pool.
Include at least as many addresses as there are units in the cluster. The main IP address is not a part of this pool, but
needs to be on the same network. You cannot determine the exact Local address assigned to each unit in advance.
Figure 10. Add Address Pool
Note
Although not common, if you want to set the MAC addresses manually, you can also add a MAC address pool object.
Step 2
On Devices > Device Management and then choose Interfaces, click Edit () for the interface you want to configure.
Step 3
On the IPv4 page, enter the Virtual IP
Address and mask. This main ("virtual") IP address is a fixed
address for the cluster, and always belongs to the control node.
DHCP and PPPoE are not supported. For point-to-point connections, you can
specify a 31-bit subnet mask (255.255.255.254). In this case, no IP
addresses are reserved for the network or broadcast addresses.
Figure 11. IPv4 Page
Step 4
From the IPv4 Address Pool drop-down list, choose
the address pool you created.
Step 5
On IPv6 > Basic, from the IPv6 Address
Pool drop-down list, choose the address pool you
created.
IPv6 autoconfig and manual link-local addresses are not supported.
Step 6
Configure other interface settings as normal.
To set the MAC addresses manually, you can select the MAC address pool from
the interface's Advanced page.
Note
If the cluster control link interface MTU is not at least 100 bytes
higher than the data interface MTU, you will see an error that you must
reduce the MTU of the data interface. By default, the cluster control
link MTU is 1600 bytes. If you want to increase the MTU of data
interfaces, first increase the cluster control link MTU. Note that we do
not recommend setting the cluster control link MTU between 2561 and
8362; due to block pool handling, this MTU size is not optimal for
system operation.
Configure Cluster Health Monitor Settings
The Cluster Health Monitor Settings section of the Cluster page displays the settings described in the table below.
Figure 12. Cluster Health Monitor Settings
Table 1. Cluster Health Monitor Settings Section Table
Fields
Field
Description
Timeouts
Hold Time
Between .3 and 45 seconds; The default is 3 seconds. To determine
node system health, the cluster nodes send heartbeat messages on
the cluster control link to other nodes. If a node does not
receive any heartbeat messages from a peer node within the hold
time period, the peer node is considered unresponsive or
dead.
Interface Debounce Time
Between 300 and 9000 ms. The default is 500
ms. The interface debounce time is the amount of time before the
node considers an interface to be failed, and the node is
removed from the cluster.
Monitored Interfaces
The interface health check monitors for link failures. If all
physical ports for a given logical interface fail on a
particular node, but there are active ports under the same
logical interface on other nodes, then the node is removed from
the cluster. The amount of time before the node removes a member
from the cluster depends on the type of interface and whether
the node is an established node or is joining the cluster.
Service Application
Shows whether the Snort and disk-full processes are monitored.
Unmonitored Interfaces
Shows unmonitored interfaces.
Auto-Rejoin Settings
Cluster Interface
Shows the auto-rejoin settings after a cluster control link
failure.
Attempts
Between -1 and 65535. The default is -1 (unlimited). Sets the
number of rejoin attempts.
Interval Between Attempts
Between 2 and 60. The default is 5 minutes. Defines the interval
duration in minutes between rejoin attempts.
Interval Variation
Between 1 and 3. The default is 1x the interval duration. Defines
if the interval duration increases at each attempt.
Data Interfaces
Shows the auto-rejoin settings after a data interface
failure.
Attempts
Between -1 and 65535. The default is 3. Sets the number of rejoin
attempts.
Interval Between Attempts
Between 2 and 60. The default is 5 minutes. Defines the interval
duration in minutes between rejoin attempts.
Interval Variation
Between 1 and 3. The default is 2x the interval duration. Defines
if the interval duration increases at each attempt.
System
Shows the auto-rejoin settings after internal errors. Internal
failures include: application sync timeout; inconsistent
application statuses; and so on.
Attempts
Between -1 and 65535. The default is 3. Sets the number of rejoin
attempts.
Interval Between Attempts
Between 2 and 60. The default is 5 minutes. Defines the interval
duration in minutes between rejoin attempts.
Interval Variation
Between 1 and 3. The default is 2x the interval duration. Defines
if the interval duration increases at each attempt.
Note
If you disable the system health check, fields that do not apply when the system
health check is disabled will not show.
You can change these settings from this section.
You can monitor any port-channel ID, single physical interface ID, as well as the
Snort and disk-full processes. Health monitoring is not performed on VLAN
subinterfaces or virtual interfaces such as VNIs or BVIs. You cannot configure
monitoring for the cluster control link; it is always monitored.
Procedure
Step 1
Choose Devices > Device Management.
Step 2
Next to the cluster you want to modify, click Edit ().
Step 3
Click Cluster.
Step 4
In the Cluster Health
Monitor Settings section, click Edit ().
Step 5
Disable the system health check by clicking the Health
Check slider .
Figure 13. Disable the System Health Check
When any topology changes occur (such as adding or removing a data interface, enabling or disabling an interface on the node
or the switch, or adding an additional switch to form a VSS or vPC or VNet) you should disable the system health check feature
and also disable interface monitoring for the disabled interfaces. When the topology change is complete, and the configuration
change is synced to all nodes, you can re-enable the system health check feature and monitored interfaces.
Step 6
Configure the hold time and interface debounce time.
Hold Time—Set the hold time to determine the
amount of time between node heartbeat status messages, between .3
and 45 seconds; The default is 3 seconds.
Interface Debounce Time—Set the debounce time
between 300 and 9000 ms. The default is 500 ms. Lower values allow
for faster detection of interface failures. Note that configuring a
lower debounce time increases the chances of false-positives. When
an interface status update occurs, the node waits the number of
milliseconds specified before marking the interface as failed, and
the node is removed from the cluster. In the case of an EtherChannel
that transitions from a down state to an up state (for example, the
switch reloaded, or the switch enabled an EtherChannel), a longer
debounce time can prevent the interface from appearing to be failed
on a cluster node just because another cluster node was faster at
bundling the ports.
Step 7
Customize the auto-rejoin cluster settings after a health check failure.
Figure 14. Configure Auto-Rejoin Settings
Set the following values for the Cluster Interface, Data Interface, and System (internal failures include: application sync timeout; inconsistent application statuses; and so on):
Attempts—Sets the number of rejoin attempts, between -1 and 65535. 0 disables auto-rejoining. The default for the Cluster Interface is -1 (unlimited). The default for the Data Interface and System is 3.
Interval Between Attempts—Defines the interval duration in minutes between rejoin attempts, between 2 and 60. The default value is 5 minutes. The maximum
total time that the node attempts to rejoin the cluster is limited to 14400 minutes (10 days) from the time of last failure.
Interval Variation—Defines if the interval duration increases. Set the value between 1 and 3: 1 (no change); 2 (2 x the previous duration), or 3 (3 x the previous duration). For example, if you set the interval duration to 5 minutes, and set the variation to 2, then
the first attempt is after 5 minutes; the 2nd attempt is 10 minutes (2 x 5); the 3rd attempt 20 minutes (2 x 10), and so on.
The default value is 1 for the Cluster Interface and 2 for the Data Interface and System.
Step 8
Configure monitored interfaces by moving interfaces in the Monitored
Interfaces or Unmonitored Interfaces
window. You can also check or uncheck Enable Service Application
Monitoring to enable or disable monitoring of the Snort and
disk-full processes.
Figure 15. Configure Monitored Interfaces
The interface health check monitors for link failures. If all physical ports
for a given logical interface fail on a particular node, but there are
active ports under the same logical interface on other nodes, then the node
is removed from the cluster. The amount of time before the node removes a
member from the cluster depends on the type of interface and whether the
node is an established node or is joining the cluster. Health check is
enabled by default for all interfaces and for the Snort and disk-full
processes.
You might want to disable health monitoring of non-essential interfaces.
When any topology changes occur (such as adding or removing a data interface, enabling or disabling an interface on the node
or the switch, or adding an additional switch to form a VSS or vPC or VNet) you should disable the system health check feature
and also disable interface monitoring for the disabled interfaces. When the topology change is complete, and the configuration
change is synced to all nodes, you can re-enable the system health check feature and monitored interfaces.
Step 9
Click Save.
Step 10
Deploy configuration changes.
Configure Distributed Site-to-Site VPN
By default, the cluster uses centralized site-to-site VPN mode. To take advantage of the
scalability of clustering, you can enable distributed site-to-site VPN
mode.
About Distributed Site-to-Site VPN
In distributed mode, site-to-site IPsec IKEv2 VPN connections are distributed across
nodes of a cluster. Distributing VPN connections across the nodes of a cluster
allows both the capacity and throughput of the cluster to be fully utilized,
significantly scaling VPN support beyond centralized VPN capabilities.
Distributed VPN Connection Roles
Connections can be load-balanced to multiple nodes of the cluster. Connection roles
determine how connections are handled in both normal operation and in a high
availability situation. When running in distributed VPN mode, the following roles are
assigned to the cluster nodes:
Active Session Owner—The node that initially receives the connection or that has
transitioned a backup session to an active session. The owner maintains the
state and processes packets for the complete session, including the IKE and
IPsec tunnels and all traffic associated with them.
Backup Session Owner—The node that is handling the backup session for an existing
active session. If the active session
owner fails, the backup session owner becomes the active session owner, and a
new backup session is established on a different node.
Forwarder—If traffic associated with a VPN session is sent to a node that does
not own the VPN session, that node will use the cluster control link to forward
the traffic to the node that owns the VPN session.
Orchestrator—The orchestrator (always the control node of the cluster) is
responsible for calculating which sessions will move and where they will move to
when executing an Active Session Redistribution (ASR). It sends a request to the
owner node X to move N sessions to node Y. Node X will respond back to the
orchestrator when complete, specifying how many sessions it was able to
move.
Distributed VPN Session Characteristics
Distributed site-to-site VPN Sessions have the following characteristics. Otherwise,
VPN connections behave as they normally do if not on a cluster.
VPN sessions are distributed across the cluster at the session level. Meaning
the same cluster node handles the IKE and IPsec tunnels and all their
traffic for a VPN connection. If VPN session traffic is sent to a cluster
node that does not own that VPN session, traffic is forwarded to the cluster
node that owns the VPN session.
VPN sessions have a Session ID that is unique across the cluster. Using the
session ID, traffic is validated, forwarding decisions are made, and IKE
negotiation is completed.
In a site-to-site VPN hub and spoke configuration, when clients connect
through the cluster (called hair-pinning), the session traffic flowing in
and the session traffic flowing out may be on different cluster nodes.
Distributed VPN Handling of Cluster Events
Event
Distributed VPN
Node failure
For all active sessions on this failed node, the backup sessions (on
another node) become active, and backup sessions are reallocated on
another node.
Inactivate a cluster node
For all active sessions on the cluster node being inactivated, backup
sessions (on another node) become active and reallocate backup
sessions on another node according to the backup strategy.
Cluster node join
If the VPN cluster mode on the new node is not set to distributed,
the control node will request a mode change.
After the VPN mode is compatible, the cluster node will be assigned
active and backup sessions in the flow of normal operations.
IPsec IKEv2 Modifications
IKEv2 is modified while in distributed site-to-site VPN mode in the following ways:
An identity is used in place of IP/port tuples. This allows for proper
forwarding decisions on the packets, and cleanup of previous connections that
may be on other cluster members.
The (SPI) identifiers that identify a single IKEv2 session are locally generated,
random 8-byte values that are unique across the cluster. An SPI embeds a time
stamp and a cluster node ID. Upon receipt of an IKE negotiation packet, if the
time stamp or cluster node ID check fails, the packet is dropped and a message
is logged indicating the reason.
IKEv2 processing has been modified to prevent NAT-T negotiations from failing by
being split across cluster members. A new ASP classify domain,
cluster_isakmp_redirect, and rules are added when IKEv2 is enabled on
an interface.
CMPv2
The CMPv2 ID certificate and key pairs are synchronized across the cluster nodes.
However, only the control node in the cluster automatically renews and rekeys the CMPv2
certificate. The control node synchronizes these new ID certificates and keys to all
cluster nodes on a renewal. In this way, all nodes in the cluster utilize the CMPv2
certificates for authentication, and also any node is capable of taking over as the
control node.
Licensing for Distributed Site-to-Site VPN
A Carrier license is required for distributed site-to-site
VPN, on each member of the cluster.
Prerequisites for Distributed Site-to-Site VPN
Model Support
Secure Firewall 4200
Secure Firewall 6100
Cluster Requirements
Spanned EtherChannel mode.
Routed firewall mode.
Maximum VPN Sessions
Each VPN connection requires two sessions, one for the active session and one for the
backup session. The maximum VPN session capacity of the cluster can be no more than
half of the listed capacity due to using two licenses for each session.
Table 2. Maximum VPN Sessions
Model
Maximum VPN Sessions
4215
10,000
4225
12,500
4245
15,000
6160
280,000
6170
350,000
Guidelines for Distributed Site-to-Site VPN
Firewall Mode
Distributed site-to-site VPN is supported in routed mode only.
Additional Guidelines
Only IKEv2 IPsec site-to-site VPN is supported in distributed site-to-site
VPN mode. IKEv1 is not supported. IKEv1 site-to-site is supported in
centralized VPN mode.
Inter-site clustering is not supported.
Interface PAT is not available while in distributed site-to-site VPN
mode.
To view FlexConfig features that are also not supported with clustering, for
example many inspections, see the ASA general operations configuration guide.
FlexConfig lets you configure many ASA features that are not present in the
Firewall Management Center GUI.
Enable Distributed Site-to-Site VPN
Enable distributed site-to-site VPN to take advantage of the scalability of
clustering for VPN sessions. This procedure requires CLI access to the control
node.
Before you begin
Configure site-to-site VPN.
Apply the Carrier license to the control node.
Procedure
Step 1
Add a Spanned-EtherChannel-mode cluster according to Create a Cluster,
including all data nodes.
Step 2
After the cluster is formed and stable, remove each of the data nodes according
to Disable Clustering, and then remove the control node.
Clustering needs to be disabled to change the VPN mode. The bootstrap
configuration remains intact, as well as the last configuration synched from
the control node, so that you can later re-add the nodes without losing your
configuration.
In the Firewall Management Center, reenable clustering on the control node and then for each data node. See
Rejoin the Cluster.
The VPN mode is synched to the data nodes.
Redistribute Distributed S2S VPN Sessions
Active session redistribution redistributes the active VPN session load across the
cluster nodes. Due to the dynamic nature of beginning and ending sessions, active
session redistribution is a best effort balancing of the sessions across all cluster
nodes. Repeated redistribution actions will optimize the balance.
Redistribution can be run at any time, should be run after any topology change in the
cluster, and is recommended after a new node joins the cluster. The goal of
redistribution is to create a stable VPN cluster. A stable VPN cluster has an almost
equal number of active and backup sessions across the nodes.
To move a session, the backup session becomes the active one and another node is
selected to host a new backup session. Moving sessions is dependent on the location
of the active session's backup and the number of active sessions already on that
particular backup node. If the backup session node is unable to host the active
session for some reason, the original node remains owner of the session.
This procedure requires CLI access to the control node.
Before you begin
Enable system logs if you would like to monitor redistribution activity.
View the cluster on Devices > Device Management to see which device is the control node.
Step 2
View how active and backup sessions are distributed across the cluster.
show cluster vpn-sessiondb distribution
Example:
Distribution information displays as follows:
> show cluster vpn-sessiondb distribution
Member 0 (unit-1-1): active: 209; backups at: 1(111), 2(98)
Member 1 (unit-1-3): active: 204; backups at: 0(108), 2(96)
Member 2 (unit-1-2): active: 0
Each row contains the member ID, member name, number of active sessions, and
on which members the backup sessions reside. For the example above, one
would read the information as:
Member 0 has 209 active sessions, 111 sessions are backed up on
member 1, 98 sessions are backed up on member 2
Member 1 has 204 active sessions, 108 sessions are backed up on
member 0, 96 sessions are backed up on member 2
Member 2 has NO active sessions; therefore, no cluster members are
backing up sessions for this node. This member has recently joined
the cluster.
Step 3
Redistribute sessions.
cluster redistribute vpn-sessiondb
Example:
> cluster redistribute vpn-sessiondb

Session redistribution initiated.
Use 'show cluster vpn-sessiondb distribution' to view distribution.

>
Depending on the number of sessions to redistribute and the load on the cluster, this may take some time. Syslogs containing
the following phrases (and other system details not shown here) are provided as redistribution activity occurs:
Syslog Phrase
Notes
VPN session redistribution started
Control node only
Sent request to move number sessions from orig-member-name to dest-member-name
Control node only
Failed to send session redistribution message to member-name
Control node only
Received request to move number sessions from orig-member-name to dest-member-name
Data node only
Moved number sessions to member-name
The number of active sessions moved to the named cluster.
Failed to receive session move response from dest-member-name
Re-enter the show cluster vpn-sessiondb distribution
command to view the results.
Manage Cluster Nodes
After you deploy the cluster, you can change the configuration and manage cluster nodes.
Add a New Cluster Node
You can add one or more new cluster nodes to an existing cluster.
Procedure
Step 1
Choose Devices > Device Management, click More () for the cluster, and choose Add Nodes.
Figure 16. Add Nodes
The Manage Cluster Wizard appears.
Step 2
From the Node menu, choose a device, adjust the IP
address, priority, and Site ID if desired.
Figure 17. Manage Cluster Wizard
Step 3
To add additional nodes, click Add a data node.
Step 4
Click Continue. Review the
Summary, and then click
Save
The node that is currently registering shows the loading icon.
Figure 18. Node Registration
You can monitor cluster node registration by clicking the
Notifications icon and choosing
Tasks.
Break a Node
You can remove a node from the cluster so that it becomes a standalone device. You
cannot break the control node unless you break the entire cluster. The data node has
its configuration erased.
Procedure
Step 1
Choose Devices > Device Management, click More () for the node you want to break, and choose Break Node.
Figure 19. Break a Node
You can optionally break one or more nodes from the cluster More menu by choosing Break Nodes.
Step 2
You are prompted to confirm the break; click Yes.
Figure 20. Confirm Break
You can monitor the cluster node break by clicking the
Notifications icon and choosing
Tasks.
Break the Cluster
You can break the cluster and convert all nodes to standalone devices. The control
node retains the interface and security policy configuration, while data nodes have
their configuration erased.
Procedure
Step 1
Make sure all cluster nodes are being managed by the Firewall Management Center by reconciling nodes. See Reconcile Cluster Nodes.
Step 2
Choose Devices > Device Management, click More () for the cluster, and choose Break Cluster.
Figure 21. Break Cluster
Step 3
You are prompted to break the cluster; click Yes.
Figure 22. Confirm Break
You can monitor the cluster break by clicking the
Notifications icon and choosing
Tasks.
Disable Clustering
You may want to deactivate a node in preparation for deleting the node, or
temporarily for maintenance. This procedure is meant to temporarily deactivate a
node; the node will still appear in the Firewall Management Center device list. When a node becomes inactive, all data interfaces are shut down.
Procedure
Step 1
For the unit you want to disable, choose Devices > Device Management, click More (), and choose Disable Node Clustering.
Figure 23. Disable Clustering
If you disable clustering on the control node, one of the data nodes will become the new control node. Note that for centralized
features, if you force a control node change, then all connections are dropped, and you have to re-establish the connections
on the new control node. You cannot disable clustering on the control node if it is the only node in the cluster.
Step 2
Confirm that you want to disable clustering on the node.
The node will show (Disabled) next to its name in the Devices > Device Management list.
If a node was removed from the cluster, for example for a failed interface or if you manually disabled clustering, you must
manually rejoin the cluster. Make sure the failure is resolved before you try to rejoin the cluster. See Rejoining the Cluster for more information about why a node can be removed from a cluster.
Procedure
Step 1
For the unit you want to reactivate, choose Devices > Device Management, click More (), and choose Enable Node Clustering.
Step 2
Confirm that you want to enable clustering on the unit.
Change the Control Node
Caution
The best method to change the control node is to disable
clustering on the control node, wait for a new control election, and then
re-enable clustering. If you must specify the exact unit you want to
become the control node, use the procedure in this section. Note that for
centralized features, if you force a control node change using either method,
then all connections are dropped, and you have to re-establish the connections
on the new control node.
To change the control node, perform the following steps.
Procedure
Step 1
Open the Cluster Status dialog box by choosing Devices > Device ManagementMore ()Cluster Live Status.
Figure 24. Cluster Status
Step 2
For the unit you want to become the control unit, choose More ()Change Role to Control.
Step 3
You are prompted to confirm the role change. Check the checkbox, and click
OK.
Edit the Cluster Configuration
You can edit the cluster configuration. If you change the cluster key, cluster
control link interface, or cluster control link network, the cluster will be broken
and reformed automatically. Until the cluster is reformed, you may experience
traffic disruption. If you change the cluster control link IP address for a node,
node priority, or site ID, only the affected nodes are broken and readded to the
cluster.
Procedure
Step 1
Choose Devices > Device Management, click More () for the cluster, and choose Edit Configuration.
Figure 25. Edit Configuration
The Manage Cluster Wizard appears.
Step 2
Update the cluster configuration.
Figure 26. Manage Cluster Wizard
If the cluster control link is an EtherChannel, you can edit the interface
membership and LACP configuration by clicking Edit () next to the interface drop-down menu.
Step 3
Click Continue. Review the
Summary, and then click
Save
Reconcile Cluster Nodes
If a cluster node fails to register, you can reconcile the cluster membership from
the device to the Firewall Management Center. For example, a data node might fail to register if the Firewall Management Center is occupied with certain processes, or if there is a network issue.
Procedure
Step 1
Choose Devices > Device ManagementMore () for the cluster, and then choose Cluster Live Status to open the Cluster Status dialog box.
Unregister the Cluster or Nodes and Register to a New Firewall Management Center
You can unregister the cluster from the Firewall Management Center, which keeps the cluster intact. You might want to unregister the cluster if you
want to add the cluster to a new Firewall Management Center.
You can also unregister a node from the Firewall Management Center without breaking the node from the cluster. Although the node is not visible in
the Firewall Management Center, it is still part of the cluster, and it will continue to pass traffic and could
even become the control node. You cannot unregister the current control node. You
might want to unregister the node if it is no longer reachable from the Firewall Management Center, but you still want to keep it as part of the cluster while you troubleshoot
management connectivity.
Unregistering a cluster:
Severs all communication between the Firewall Management Center and the cluster.
Removes the cluster from the Device Management page.
Returns the cluster to local time management if the cluster's platform
settings policy is configured to receive time from the Firewall Management Center using NTP.
Leaves the configuration intact, so the cluster continues to process traffic.
Policies, such as NAT and VPN, ACLs, and the interface configurations remain
intact.
Registering the cluster again to the same or a different Firewall Management Center causes the configuration to be removed, so the cluster will stop processing
traffic at that point; the cluster configuration remains intact so you can add the
cluster as a whole. You can choose an access control policy at registration, but you
will have to re-apply other policies after registration and then deploy the
configuration before it will process traffic again.
Before you begin
This procedure requires CLI access to one of the nodes.
Procedure
Step 1
Choose Devices > Device Management, click More () for the cluster or node, and choose Unregister.
Figure 29. Unregister Cluster or Node
Step 2
You are prompted to unregister the cluster or node;
click Yes.
Step 3
You can register the cluster to a new (or the same) Firewall Management Center by adding one of the cluster members as a new device.
You only need to add one of the cluster nodes as a device, and the rest of
the cluster nodes will be discovered.
Connect to one cluster node's CLI, and identify the new Firewall Management Center using the configure manager add command.
Choose Devices > Device Management, and then click Add > Device.
You can monitor the cluster in the Firewall Management Center and at the Firewall Threat Defense CLI.
Cluster Status dialog box, which is available from the Devices > Device ManagementMore () icon or from the Devices > Device Management > Cluster page General area Cluster Live Status link.
Figure 30. Cluster Status
The Control node has a graphic indicator identifying its role.
Cluster member Status includes the following states:
In Sync.—The node is registered with the Firewall Management Center.
Pending Registration—The node is part of the cluster, but has
not yet registered with the Firewall Management Center. If a node fails to register, you can retry registration by clicking
Reconcile All.
Clustering is disabled—The node is registered with the Firewall Management Center, but is an inactive member of the cluster. The clustering
configuration remains intact if you intend to later re-enable it, or you
can delete the node from the cluster.
Joining cluster...—The node is joining the cluster on the chassis, but
has not completed joining. After it joins, it will register with the Firewall Management Center.
For each node, you can view the Summary or the
History.
Figure 31. Node Summary
Figure 32. Node History
System () > Tasks page.
The Tasks page shows updates of the Cluster Registration
task as each node registers.
Devices > Device Managementcluster_name.
When you expand the cluster on the devices listing page, you can see all member
nodes, including the control node shown with its role next to the IP address.
For nodes that are still registering, you can see the loading
icon.
show cluster {access-list [acl_name] |
conn [count] | cpu [usage] |
history | interface-mode | memory |
resource usage | service-policy |
traffic | xlate count}
To view aggregated data for the entire cluster or other information, use the
show cluster command.
show cluster info [auto-join | clients |
conn-distribution | flow-mobility counters |
goid [options] | health |
incompatible-config | loadbalance |
old-members | packet-distribution |
trace [options] | transport {
asp | cp}]
To view cluster information, use the show cluster info
command.
Cluster Health Monitor Dashboard
Cluster Health Monitor
When a Firewall Threat Defense is the control node of a cluster, the Firewall Management Center collects various metrics periodically from the device metric data collector. The cluster health monitor is comprised of the
following components:
Overview dashboard―Displays information about the cluster topology, cluster
statistics, and metric charts:
The topology section displays a cluster's live status, the health of
individual threat defense, threat defense node type (control node or
data node), and the status of the device. The status of the device
could be Disabled (when the device leaves the cluster),
Added out of box (in a public cloud cluster, the
additional nodes that do not belong to the Firewall Management Center), or Normal (ideal state of the node).
The cluster statistics section displays current metrics of the
cluster with respect to the CPU usage, memory usage, input rate,
output rate, active connections, and NAT translations.
Note
The CPU and memory metrics display the individual average of the
data plane and snort usage.
The metric charts, namely, CPU Usage, Memory Usage, Throughput, and
Connections, diagrammatically display the statistics of the cluster
over the specified time period.
Load Distribution dashboard―Displays load distribution across the cluster
nodes in two widgets:
The Distribution widget displays the average packet and connection
distribution over the time range across the cluster nodes. This data
depicts how the load is being distributed by the nodes. Using this
widget, you can easily identify any abnormalities in the load
distribution and rectify it.
The Node Statistics widget displays the node level metrics in table
format. It displays metric data on CPU usage, memory usage, input
rate, output rate, active connections, and NAT translations across
the cluster nodes. This table view enables you to correlate data and
easily identify any discrepancies.
Member Performance dashboard―Displays current metrics of the cluster nodes.
You can use the selector to filter the nodes and view the details of a
specific node. The metric data include CPU usage, memory usage, input rate,
output rate, active connections, and NAT translations.
CCL dashboard―Displays, graphically, the cluster control link data namely,
the input, and output rate.
Troubleshooting and Links ― Provides convenient links to frequently used
troubleshooting topics and procedures.
Time range―An adjustable time window to constrain the information that
appears in the various cluster metrics dashboards and widgets.
Custom Dashboard―Displays data on both cluster-wide metrics and node-level
metrics. However, node selection only applies for the threat defense metrics
and not for the entire cluster to which the node belongs.
Viewing Cluster Health
You must be an Admin, Maintenance, or Security Analyst user to perform this
procedure.
The cluster health monitor provides a detailed view of the
health status of a cluster and its nodes. This cluster health monitor provides
health status and trends of the cluster in an array of dashboards.
Before you begin
Ensure you have created a cluster from one or more devices in the Firewall Management Center.
Procedure
Step 1
Choose Troubleshooting > Health > Monitor.
Use the Monitoring navigation pane to access node-specific health
monitors.
Step 2
In the device list, click Expand() and Collapse () to expand and collapse the list of managed cluster devices.
Step 3
To view the cluster health statistics, click on the cluster name. The cluster
monitor reports health and performance metrics in several predefined dashboards
by default. The metrics dashboards include:
Overview ― Highlights key metrics from the other predefined
dashboards, including its nodes, CPU, memory, input and output
rates, connection statistics, and NAT translation information.
Load Distribution ― Traffic and packet distribution across the
cluster nodes.
Member Performance ― Node-level statistics on CPU usage, memory
usage, input throughput, output throughput, active connection, and
NAT translation.
CCL ― Interface status and aggregate traffic statistics.
You can configure the time range from the drop-down in the upper-right corner.
The time range can reflect a period as short as the last hour (the default) or
as long as two weeks. Select Custom from the drop-down to
configure a custom start and end date.
Click the refresh icon to set auto refresh to 5 minutes or to toggle off auto
refresh.
Step 5
Click on deployment icon for a deployment overlay on the trend graph, with
respect to the selected time range.
The deployment icon indicates the number of deployments during the selected
time-range. A vertical band indicates the deployment start and end time. For
multiple deployments, multiple bands/lines appear. Click on the icon on top
of the dotted line to view the deployment details.
Step 6
(For node-specific health monitor) View the Health
Alerts for the node in the alert notification at the top of
page, directly to the right of the device name.
Hover your pointer over the Health Alerts to view the
health summary of the node. The popup window shows a truncated summary of
the top five health alerts. Click on the popup to open a detailed view of
the health alert summary.
Step 7
(For node-specific health monitor) The device monitor reports health and
performance metrics in several predefined dashboards by default. The metrics
dashboards include:
Overview ― Highlights key metrics from the other predefined
dashboards, including CPU, memory, interfaces, connection
statistics; plus disk usage and critical process information.
CPU ― CPU utilization, including the CPU usage by process and by
physical cores.
Memory ― Device memory utilization, including data plane and Snort
memory usage.
Interfaces ― Interface status and aggregate traffic statistics.
Connections ― Connection statistics (such as elephant flows, active
connections, peak connections, and so on) and NAT translation
counts.
Snort ― Statistics that are related to the Snort process.
ASP drops ― Statistics related to the dropped packets against various
reasons.
Click the plus sign Add New Dashboard() in the upper right corner of the health monitor to create a custom dashboard by building your own variable set from the available
metric groups.
For cluster-wide dashboard, choose Cluster metric group, and then choose the metric.
Cluster Metrics
The cluster health monitor tracks statistics that are related to a cluster and its
nodes, and aggregate of load distribution, performance, and CCL traffic statistics.
Table 3. Cluster Metrics
Metric
Description
Format
CPU
Average of CPU metrics on the nodes of a cluster (individually
for data plane and snort).
percentage
Memory
Average of memory metrics on the nodes of a cluster (individually
for data plane and snort).
percentage
Data Throughput
Incoming and outgoing data traffic statistics for a cluster.
bytes
CCL Throughput
Incoming and outgoing CCL traffic statistics for a cluster.
bytes
Connections
Count of active connections in a cluster.
number
NAT Translations
Count of NAT translations for a cluster.
number
Distribution
Connection distribution count in the cluster for every second.
number
Packets
Packet distribution count in the cluster for every second.
number
Monitoring Distributed Site-to-Site VPN
Use the following commands to monitor status and distribution of the VPN
sessions:
The overall distribution of sessions is provided using show
cluster vpn-sessiondb distribution. If running in a
multiple context environment, this command must be run in the system
execution space.
This show command provides a quick view of the sessions, rather than
having to execute show vpn-sessiondb summary on
each node.
A unified view of the VPN connections on the cluster using the
show cluster vpn-sessiondb summary command
is also available.
Individual device monitoring using the show
vpn-sessiondb command shows the number of active and
backup sessions on a device in addition to the usual VPN information.
Troubleshooting the Cluster
You can use the CCL Ping tool to make sure the cluster control
link is operating correctly. You can also use the
following tools that are available for devices and clusters:
Troubleshooting files—If a node fails to join the cluster, a troubleshooting file is automatically generated. You can also
generate and download troubleshooting files from the Devices > Device Management and then choose Add, ClusterGeneral area.
You can also generate files from the Device Management
page by clicking More () and choosing Troubleshoot Files.
CLI output—From the Devices > Device Management and then choose Add, ClusterGeneral area, you can view a set of pre-defined CLI outputs that can help you troubleshoot the cluster. The following commands are
automatically run for the cluster:
show running-config cluster
show cluster info
show cluster info health
show cluster info transport cp
show version
show asp drop
show counters
show arp
show int ip brief
show blocks
show cpu detailed
show interfaceccl_interface
pingccl_ipsizeccl_mturepeat 2
You can also enter any show command in the Command field.
Perform a Ping on the Cluster Control Link
When a node joins the cluster, it
checks MTU compatibility by sending a ping to the control node with a packet size
matching the cluster control link MTU. If the initial ping fails, the node tries a
ping using a smaller packet size (the MTU divided by 2, then by 4, then by 8) until
a ping succeeds. A notification is generated so you can fix the MTU mismatch on
connecting switches and try again. This tool lets you manually ping all nodes that
have already joined the cluster in case you are having cluster control link
connectivity problems.
Procedure
Step 1
Choose Devices > Device Management, click the More () icon next to the cluster, and choose Cluster Live Status.
Figure 33. Cluster Status
Step 2
Expand one of the nodes, and click CCL Ping.
Figure 34. CCL Ping
The node sends a ping on the cluster control link to every other node using a
packet size that matches the maximum MTU.
Troubleshooting Distributed Site-to-Site VPN
Distributed VPN Notifications
You will be notified with messages containing the identified phrases when the
following error situations occur on a cluster running distributed VPN:
Situation
Notification
If an existing or joining cluster data node is not in distributed
VPN mode when attempting to join the cluster:
New cluster member (member-name)
rejected due to vpn mode mismatch.
and
Master
(control-name) rejects enrollment
request from unit (unit-name) for the reason: the vpn mode
capabilities are not compatible with the master
configuration
If licensing is not properly configured on a cluster member for
Distributed VPN:
ERROR: Master requested
cluster vpn-mode change to distributed. Unable to change
mode due to missing Carrier License.
If the time stamp or member ID is invalid in the SPI of a
received IKEv2 packet:
Expired SPI received
or
Corrupted SPI detected
If the cluster is unable to create a backup session:
Failed to create the backup for an IKEv2 session.
IKEv2 Initial Contact (IC) processing error:
IKEv2 Negotiation aborted due to ERROR: Stale
backup session found on backup
Redistribution problems:
Failed to send session redistribution message to
member-name
Failed to receive
session move response from member-name
(master only)
If the topology changes during redistribution of the sessions:
You may be encountering one of the following situations:
Site-to-site VPN sessions are being distributed to only one of the chassis in
a cluster when the Nexus 7K switch is configured with a layer 4 port as a
load-balancing algorithm using the port-channel load-balance
src-dst l4port command. An example of the cluster
session allocation looks like below:
SSP-Cluster/slave(cfg-cluster)# show cluster vpn-sessiondb distribution
Member 0 (unit-1-3): active: 0
Member 1 (unit-2-2): active: 13295; backups at: 0(2536), 2(2769), 3(2495), 4(2835), 5(2660)
Member 2 (unit-2-3): active: 12174; backups at: 0(2074), 1(2687), 3(2207), 4(3084), 5(2122)
Member 3 (unit-2-1): active: 13416; backups at: 0(2419), 1(3013), 2(2712), 4(2771), 5(2501)
Member 4 (unit-1-1): active: 0
Member 5 (unit-1-2): active: 0
Since site-to-site IKEv2 VPN uses port 500 for both source and destination
ports, IKE packets are only sent to one of the links in the port channel
connected between the Nexus 7K and the chassis.
Change the Nexus 7K load balancing algorithm to IP and Layer 4 port using the
port-channel load-balance src-dst
ip-l4port. Then the IKE packets are sent to all the links
and thus all nodes.
For a more immediate adjustment, on the control node of the cluster, execute:
cluster redistribute vpn-sessiondb to
redistribute active VPN sessions to the cluster nodes of the other
chassis.
Examples for Clustering
These examples include examples for typical deployments.
Firewall on a
Stick
Data traffic from different security domains are associated with
different VLANs, for example, VLAN 10 for the inside network and VLAN 20 for the
outside network. Each has a single
physical port connected to the external switch or router. Trunking is enabled so
that all packets on the physical link are 802.1q encapsulated. The is the firewall between VLAN 10 and VLAN
20.
When using Spanned EtherChannels, all data links are grouped into one
EtherChannel on the switch side. If the
becomes unavailable, the switch will rebalance traffic between the remaining units.
Traffic
Segregation
You may prefer physical separation of traffic between the
inside and outside network.
As shown in the diagram above, there is one Spanned
EtherChannel on the left side that connects to the inside switch, and the other on
the right side to outside switch. You can also create VLAN subinterfaces on each
EtherChannel if desired.
Reference for Clustering
This section includes more information about how clustering operates.
Firewall Threat Defense Features and Clustering
Some Firewall Threat Defense features are not supported with clustering, and some are only supported on the
control unit. Other features might have caveats for proper usage.
Unsupported Features with Clustering
These features cannot be configured with clustering enabled, and the commands
will be rejected.
Note
To view FlexConfig features that are also not supported with clustering, for
example WCCP inspection, see the ASA general operations configuration guide.
FlexConfig lets you configure many ASA features that are not present in the
Firewall Management Center GUI.
Remote access VPN (SSL VPN and IPsec VPN)
Site-to-site VPN (Policy-based and route-based) is not supported in public clouds.
DHCP client, server, and proxy. DHCP relay is supported.
Virtual Tunnel Interfaces (VTIs)
High Availability
Integrated Routing and Bridging
Firewall Management Center UCAPL/CC mode
DHCP client, server, and proxy. DHCP relay is supported.
Centralized Features for Clustering
The following features are only supported on the control node, and are
not scaled for the cluster.
Note
Traffic for centralized features is forwarded from member
nodes to the control node over the cluster control link.
If you use the rebalancing feature, traffic for centralized
features may be rebalanced to non-control nodes before the traffic is classified
as a centralized feature; if this occurs, the traffic is then sent back to the
control node.
For centralized features, if the control node fails, all
connections are dropped, and you have to re-establish the connections on the new
control node.
Note
To view FlexConfig features that are also centralized with clustering, for example RADIUS inspection, see the ASA general operations configuration guide. FlexConfig lets you configure many ASA features that are not present in the Firewall Management Center GUI.
The following application inspections:
DCERPC
ESMTP
NetBIOS
PPTP
RSH
SQLNET
SUNRPC
TFTP
XDMCP
Static route monitoring
Site-to-site VPN
IGMP multicast control plane protocol processing (data
plane forwarding is distributed across the cluster)
PIM multicast control plane protocol processing (data
plane forwarding is distributed across the cluster)
Dynamic routing (Spanned EtherChannel mode
only)
Connection Settings and Clustering
Connection limits are enforced cluster-wide. Each node has an
estimate of the cluster-wide counter values based on broadcast messages. Due to
efficiency considerations, the configured connection limit across the cluster
might not be enforced exactly at the limit number. Each node may overestimate or
underestimate the cluster-wide counter value at any given time. However, the
information will get updated over time in a load-balanced cluster.
FTP and
Clustering
If FTP data channel and control channel flows are owned by
different cluster members, then the data channel owner will periodically send
idle timeout updates to the control channel owner and update the idle timeout
value. However, if the control flow owner is reloaded, and the control flow is
re-hosted, the parent/child flow relationship will not longer be maintained;
the control flow idle timeout will not be updated.
Multicast Routing in
Individual Interface Mode
In Individual interface mode, units do not act independently with
multicast. All data and routing packets are processed and forwarded by the control unit,
thus avoiding packet replication.
Multicast Routing in
Individual Interface Mode
In Individual interface mode, units do not act independently with
multicast. All data and routing packets are processed and forwarded by the control unit,
thus avoiding packet replication.
NAT and
Clustering
NAT can affect the overall throughput of the cluster. Inbound and
outbound NAT packets can be sent to different Firewall Threat Defenses in the cluster, because the load balancing algorithm relies on IP addresses
and ports, and NAT causes inbound and outbound packets to have different IP
addresses and/or ports. When a packet arrives at the Firewall Threat Defense that is not the NAT owner, it is forwarded over the cluster control link to
the owner, causing large amounts of traffic on the cluster control link. Note
that the receiving node does not create a forwarding flow to the owner, because
the NAT owner may not end up creating a connection for the packet depending on
the results of security and policy checks.
If you still want to use NAT in clustering, then consider the
following guidelines:
No Proxy ARP—For Individual interfaces, a proxy ARP reply is never
sent for mapped addresses. This prevents the adjacent router from
maintaining a peer relationship with a node that may no longer be in the
cluster. The upstream router needs a static route or PBR with Object
Tracking for the mapped addresses that points to the Main cluster IP
address. This is not an issue for a Spanned EtherChannel, because there
is only one IP address associated with the cluster interface.
No interface PAT on an Individual
interface—Interface PAT is not supported for Individual interfaces.
PAT with Port Block Allocation—See the following guidelines for this
feature:
Maximum-per-host limit is not a cluster-wide limit, and is enforced on each node
individually. Thus, in a 3-node cluster with the
maximum-per-host limit configured as 1, if the traffic from a
host is load-balanced across all 3 nodes, then it can get
allocated 3 blocks with 1 in each node.
Port blocks created on the backup node from the backup pools are not accounted for when
enforcing the maximum-per-host limit.
On-the-fly PAT rule modifications, where the PAT pool is modified with a completely new
range of IP addresses, will result in xlate backup creation
failures for the xlate backup requests that were still in
transit while the new pool became effective. This behavior is
not specific to the port block allocation feature, and is a
transient PAT pool issue seen only in cluster deployments where
the pool is distributed and traffic is load-balanced across the
cluster nodes.
When operating in a cluster, you cannot simply change the block allocation size. The new
size is effective only after you reload each device in the
cluster. To avoid having to reload each device, we recommend
that you delete all block allocation rules and clear all xlates
related to those rules. You can then change the block size and
recreate the block allocation rules.
NAT pool address distribution for dynamic PAT—When you configure a PAT pool, the cluster
divides each IP address in the pool into port blocks. By default, each
block is 512 ports, but if you configure port block allocation rules,
your block setting is used instead. These blocks are distributed evenly
among the nodes in the cluster, so that each node has one or more blocks
for each IP address in the PAT pool. Thus, you could have as few as one
IP address in a PAT pool for a cluster, if that is sufficient for the
number of PAT’ed connections you expect. Port blocks cover the
1024-65535 port range, unless you configure the option to include the
reserved ports, 1-1023, on the PAT pool NAT rule.
Reusing a PAT pool in multiple rules—To use the same PAT pool in multiple
rules, you must be careful about the interface selection in the rules.
You must either use specific interfaces in all rules, or "any" in all
rules. You cannot mix specific interfaces and "any" across the rules, or
the system might not be able to match return traffic to the right node
in the cluster. Using unique PAT pools per rule is the most reliable
option.
No round-robin—Round-robin for a PAT pool is not supported with
clustering.
No extended PAT—Extended PAT is not supported with clustering.
Dynamic NAT xlates managed by the control node—The control node
maintains and replicates the xlate table to data nodes. When a data node
receives a connection that requires dynamic NAT, and the xlate is not in
the table, it requests the xlate from the control node. The data node
owns the connection.
Stale xlates—The xlate idle time on the connection owner does not get
updated. Thus, the idle time might exceed the idle timeout. An idle
timer value higher than the configured timeout with a refcnt of 0 is an
indication of a stale xlate.
No static PAT for the following inspections—
FTP
RSH
SQLNET
TFTP
XDMCP
SIP
If you have an extremely large number of NAT rules, over ten thousand, you should enable
the transactional commit model using the asp rule-engine
transactional-commit nat command in the device
CLI. Otherwise, the node might not be able to join the cluster.
Dynamic Routing
The routing process only runs on the control node, and routes are learned
through the control node and replicated to data nodes. If a routing packet
arrives at a data node, it is redirected to the control node.
Figure 35. Dynamic Routing in Spanned EtherChannel Mode
After the data node learn the routes from the control node, each node
makes forwarding decisions independently.
The OSPF LSA database is not synchronized from the control node to data
nodes. If there is a control node switchover, the neighboring router will detect
a restart; the switchover is not transparent. The OSPF process picks an IP
address as its router ID. Although not required, you can assign a static router
ID to ensure a consistent router ID is used across the cluster. See the OSPF
Non-Stop Forwarding feature to address the interruption.
Dynamic Routing in
Individual Interface Mode
In Individual interface mode, each node runs the routing protocol as a
standalone router, and routes are learned by each node independently.
Figure 36. Dynamic Routing in Individual Interface Mode
In the above diagram, Router A learns that there are 4 equal-cost paths
to Router B, each through a node. ECMP is used to load balance traffic between
the 4 paths. Each node picks a different router ID when talking to external
routers.
You must configure a cluster pool for the router ID so that each node has
a separate router ID.
EIGRP does not
form neighbor relationships with cluster peers in individual interface mode.
Note
If the cluster has multiple adjacencies to the same router for redundancy purposes,
asymmetric routing can lead to unacceptable traffic loss. To avoid
asymmetric routing, group all of these node interfaces into the same traffic
zone.
SIP Inspection and
Clustering
A control flow can be created on any node (due to load balancing); its
child data flows must reside on the same node.
SNMP and
Clustering
You should always use the Local address, and not the Main cluster IP
address for SNMP polling. If the SNMP agent polls the Main cluster IP address,
if a new control node is elected, the poll to the new control node will fail.
When using SNMPv3 with clustering, if you add a new
cluster node after the initial cluster formation, then SNMPv3 users are not
replicated to the new node. You must remove the users, and
re-add them, and then redeploy your configuration to force the users to
replicate to the new node.
Syslog and Clustering
Each node in the cluster generates
its own syslog messages. You can configure logging so that each node
uses either the same or a different device ID in the syslog message
header field. For example, the hostname configuration is replicated and
shared by all nodes in the cluster. If you configure logging to use the
hostname as the device ID, syslog messages generated by all nodes look
as if they come from a single node. If you configure logging to use the
local-node name that is assigned in the cluster bootstrap configuration
as the device ID, syslog messages look as if they come from different
nodes.
Cisco TrustSec and
Clustering
Only the control node learns security group tag (SGT) information. The
control node then populates the SGT to data nodes, and data nodes can make a
match decision for SGT based on the security policy.
VPN and
Clustering
Site-to-site VPN is a centralized feature; only the control node supports
VPN connections.
Note
Remote access VPN is not supported with clustering.
VPN functionality is limited to the control node and does not take
advantage of the cluster high availability capabilities. If the control node fails, all
existing VPN connections are lost, and VPN users will see a disruption in service. When
a new control node is elected, you must reestablish the VPN connections.
When you connect a VPN tunnel to a Spanned EtherChannel address,
connections are automatically forwarded to the control node. For connections to an
Individual interface when using PBR or ECMP, you must always connect to the Main
cluster IP address, not a Local address.
VPN-related keys and certificates are replicated to all nodes.
Performance Scaling Factor
When you combine multiple units into a cluster, you can expect the total cluster
performance to be approximately 80% of the maximum combined throughput.
For example, if your model can handle approximately 10 Gbps of traffic when running
alone, then for a cluster of 8 units, the maximum combined throughput will be
approximately 80% of 80 Gbps (8 units x 10 Gbps): 64 Gbps.
Control Node Election
Nodes of the cluster communicate over the cluster control link to
elect a control node as follows:
When you enable clustering for a node (or when it first
starts up with clustering already enabled), it broadcasts an election request
every 3 seconds.
Any other nodes with a higher priority respond to the
election request; the priority is set between 1 and 100, where 1 is the highest
priority.
If after 45 seconds, a node does not receive a response
from another node with a higher priority, then it becomes the control node.
Note
If multiple nodes tie for the highest priority, the
cluster node name and then the serial number is used to determine the
control node.
If a node later joins the cluster with a higher priority,
it does not automatically become the control node; the existing control node
always remains as the control node unless it stops responding, at which point a
new control node is elected.
In a "split brain" scenario when there are temporarily multiple control nodes,
then the node with highest priority retains the role while the other nodes
return to data node roles.
Note
You can manually force a node to become the control node. For
centralized features, if you force a control node change, then all connections are
dropped, and you have to re-establish the connections on the new control node.
High Availability Within the Cluster
Clustering provides high availability by monitoring node and interface
health and by replicating connection states between nodes.
Node Health Monitoring
Each node periodically sends a broadcast heartbeat packet over the cluster control link. If the control node
does not receive any heartbeat packets
or other packets from a data node within the configurable timeout period, then the
control node removes the data node from the cluster. If the data nodes do not
receive packets from the control node, then a new control node is elected from
the remaining nodes.
If nodes cannot reach each other over the cluster control link because of a
network failure and not because a node has actually failed, then the cluster may
go into a "split brain" scenario where isolated data nodes will elect their own
control nodes. For example, if a router fails between two cluster locations,
then the original control node at location 1 will remove the location 2 data
nodes from the cluster. Meanwhile, the nodes at location 2 will elect their own
control node and form their own cluster. Note that asymmetric traffic may fail
in this scenario. After the cluster control link is restored, then the control
node that has the higher priority will keep the control node’s role.
Each node monitors the link status of all named hardware interfaces in use,
and reports status changes to the control node.
Spanned EtherChannel—Uses cluster Link Aggregation Control Protocol
(cLACP). Each node monitors the link status and the cLACP protocol messages to
determine if the port is still active in the EtherChannel. The status is
reported to the control node.
Individual interfaces (Routed mode only)—Each node
self-monitors its interfaces and reports interface status to the control node.
When you enable health monitoring, all physical interfaces (including the main EtherChannel) are monitored by default; you can optionally disable monitoring per interface. Only named interfaces can be monitored. For example, the named EtherChannel must fail to be considered failed, which means
all member ports of an EtherChannel must fail to trigger cluster removal.
A node is removed from the cluster if its monitored interfaces fail. The
amount of time before the Firewall Threat
Defense removes a member from the cluster depends on the type of interface
and whether the node is an established member or is joining the cluster. For EtherChannels
(spanned or not): If the interface is down on an established member, then the
Firewall Threat
Defense removes the member after 9 seconds. The Firewall Threat
Defense does not monitor interfaces for the first 90 seconds that a node joins the cluster.
Interface status changes during this time will not cause the Firewall Threat
Defense to be removed from the cluster. For
non-EtherChannels, the node is removed after 500 ms, regardless of the member state.
Status After
Failure
When a node in the cluster fails, the connections hosted by that node are
seamlessly transferred to other nodes; state information for traffic flows is
shared over the control node's cluster control link.
If the control node fails, then another member of the cluster with the
highest priority (lowest number) becomes the control node.
The Firewall Threat Defense automatically tries to rejoin the cluster, depending on the failure event.
Note
When the Firewall Threat Defense becomes inactive and fails to automatically rejoin the cluster, all data
interfaces are shut down; only the Management interface
can send and receive traffic.
Rejoining the Cluster
After a cluster member is removed from the cluster, how it can rejoin the cluster
depends on why it was removed:
Failed cluster control link when initially joining—After
you resolve the problem with the cluster control link, you must manually rejoin
the cluster by re-enabling clustering.
Failed cluster control link after joining the cluster—The Firewall Threat Defense automatically tries
to rejoin every 5 minutes, indefinitely.
Failed data interface—The Firewall Threat Defense automatically tries to rejoin at 5 minutes, then at 10 minutes, and finally
at 20 minutes. If the join is not successful after 20 minutes, then the Firewall Threat Defense application disables clustering. After you resolve the problem with the data
interface, you have to manually enable clustering.
Failed node—If the node was removed from the cluster because of a node health
check failure, then rejoining the cluster depends on the source of the failure.
For example, a temporary power failure means the node will rejoin the cluster
when it starts up again as long as the cluster control link is up. The Firewall Threat Defense application attempts to rejoin the cluster every 5 seconds.
Internal error—Internal failures include: application sync timeout; inconsistent
application statuses; and so on.
Failed configuration deployment—If you deploy a new configuration from Firewall Management Center, and
the deployment fails on some cluster members but succeeds on others, then the
nodes that failed are removed from the cluster. You must manually rejoin the
cluster by re-enabling clustering. If the deployment fails on the control node,
then the deployment is rolled back, and no members are removed. If the deployment fails on all data nodes, then the
deployment is rolled back, and no members are removed.
Data Path Connection
State Replication
Every connection has one owner and at least one backup owner in
the cluster. The backup owner does not take over the connection in the event of
a failure; instead, it stores TCP/UDP state information, so that the connection
can be seamlessly transferred to a new owner in case of a failure. The backup
owner is usually also the director.
Some traffic requires state information above the TCP or UDP
layer. See the following table for clustering support or lack of support for
this kind of traffic.
Table 4. Features Replicated Across the Cluster
Traffic
State Support
Notes
Up time
Yes
Keeps track of the system up time.
ARP Table
Yes
—
MAC address table
Yes
—
User Identity
Yes
—
IPv6 Neighbor database
Yes
—
Dynamic routing
Yes
—
SNMP Engine ID
No
—
How the Cluster Manages Connections
Connections can be load-balanced to multiple nodes of the cluster.
Connection roles determine how connections are handled in both normal operation
and in a high availability situation.
Connection
Roles
See the following roles defined for each connection:
Owner—Usually, the node that initially receives the connection. The
owner maintains the TCP state and processes packets. A connection has
only one owner. If the original owner fails, then when new nodes receive
packets from the connection, the director chooses a new owner from those
nodes.
Backup owner—The node that stores TCP/UDP state information received from the owner, so that
the connection can be seamlessly transferred to a new owner in case of a
failure. The backup owner does not take over the connection in the event
of a failure. If the owner becomes unavailable, then the first node to
receive packets from the connection (based on load balancing) contacts
the backup owner for the relevant state information so it can become the
new owner.
As long as the director (see below) is not the same node as the owner, then the director is
also the backup owner. If the owner chooses itself as the director, then
a separate backup owner is chosen.
For clustering on the Firepower 9300, which can include up to 3 cluster nodes in one chassis, if the backup owner is on the
same chassis as the owner, then an additional backup owner will be chosen from another chassis to protect flows from a chassis
failure.
Director—The node that handles owner lookup requests from forwarders.
When the owner receives a new connection, it chooses a director based on
a hash of the source/destination IP address and ports (see below for
ICMP hash details), and sends a message to the director to register the
new connection. If packets arrive at any node other than the owner, the
node queries the director about which node is the owner so it can
forward the packets. A connection has only one director. If a director
fails, the owner chooses a new director.
As long as the director is not the same node as the owner, then the director is also the
backup owner (see above). If the owner chooses itself as the director,
then a separate backup owner is chosen.
ICMP/ICMPv6 hash details:
For Echo packets, the source port is the ICMP identifier, and the
destination port is 0.
For Reply packets, the source port is 0, and the destination port
is the ICMP identifier.
For other packets, both source and destination ports are 0.
Forwarder—A node that forwards packets to the owner. If a forwarder
receives a packet for a connection it does not own, it queries the
director for the owner, and then establishes a flow to the owner for any
other packets it receives for this connection. The director can also be
a forwarder. Note that if a forwarder receives the SYN-ACK packet, it can derive
the owner directly from a SYN cookie in the packet, so it does not need
to query the director. (If you disable TCP sequence randomization, the
SYN cookie is not used; a query to the director is required.) For
short-lived flows such as DNS and ICMP, instead of querying, the
forwarder immediately sends the packet to the director, which then sends
them to the owner. A connection can have multiple forwarders; the most
efficient throughput is achieved by a good load-balancing method where
there are no forwarders and all packets of a connection are received by
the owner.
Note
We do not recommend disabling TCP sequence randomization when using
clustering. There is a small chance that some TCP sessions won't be
established, because the SYN/ACK packet might be dropped.
Fragment Owner—For fragmented packets, cluster nodes that receive a fragment determine a
fragment owner using a hash of the fragment source IP address,
destination IP address, and the packet ID. All fragments are then
forwarded to the fragment owner over the cluster control link. Fragments
may be load-balanced to different cluster nodes, because only the first
fragment includes the 5-tuple used in the switch load balance hash.
Other fragments do not contain the source and destination ports and may
be load-balanced to other cluster nodes. The fragment owner temporarily
reassembles the packet so it can determine the director based on a hash
of the source/destination IP address and ports. If it is a new
connection, the fragment owner will register to be the connection owner.
If it is an existing connection, the fragment owner forwards all
fragments to the provided connection owner over the cluster control
link. The connection owner will then reassemble all fragments.
Port Address Translation Connections
New Connection Ownership
Traffic redirection is not supported in this release. When a new connection is directed to a node of the cluster via load
balancing, that node owns both directions of the connection. All the subsequent packets for the same connection should arrive
the same node. If any connection packets arrive at a different node, they will be dropped. If a reverse flow arrives at a
different node, it will be dropped as well. For centralized features, if the connections do not arrive on the control node,
they will be dropped.
By default, AWS GWLB uses 5-tuple to maintain flow stickiness. It is recommended to enable 2-tuple or 3-tuple stickiness on
AWS GWLB to ensure the same flows are sent to the same node.
Sample Data Flow for TCP
The following example shows the establishment of a new
connection.
The SYN packet originates from the client and is delivered to one Firewall Threat Defense (based on the load balancing method), which becomes the owner. The
owner creates a flow, encodes owner information into a SYN cookie, and
forwards the packet to the server.
The SYN-ACK packet originates from the server and is delivered to a
different Firewall Threat Defense (based on the load balancing method). This Firewall Threat Defense is the forwarder.
Because the forwarder does not own the connection, it decodes
owner information from the SYN cookie, creates a forwarding flow to the owner,
and forwards the SYN-ACK to the owner.
The owner sends a state update to the director, and forwards the
SYN-ACK to the client.
The director receives the state update from the owner, creates a
flow to the owner, and records the TCP state information as well as the owner.
The director acts as the backup owner for the connection.
Any subsequent packets delivered to the forwarder will be
forwarded to the owner.
If packets are delivered to any additional nodes, it will query the
director for the owner and establish a flow.
Any state change for the flow results in a state update from the
owner to the director.
Sample Data Flow for ICMP and UDP
The following example shows the establishment of a new connection.
Figure 37. ICMP and UDP Data Flow
The first UDP packet originates from the client and is delivered
to one Firewall Threat Defense (based on the load balancing method).
The node that received the first packet queries the director node that is chosen based on a
hash of the source/destination IP address and ports.
The director finds no existing flow, creates a director flow and forwards the packet back
to the previous node. In other words, the director has elected an owner
for this flow.
The owner creates the flow, sends a state update to the director, and
forwards the packet to the server.
The second UDP packet originates from the server and is delivered to the
forwarder.
The forwarder queries the director for ownership information. For
short-lived flows such as DNS, instead of querying, the forwarder
immediately sends the packet to the director, which then sends it to the
owner.
The director replies to the forwarder with ownership information.
The forwarder creates a forwarding flow to record owner information and
forwards the packet to the owner.
The owner forwards the packet to the client.
History for Clustering
Feature
Minimum Firewall Management Center
Minimum Firewall Threat Defense
Details
Clustering for the Secure Firewall 6100
10.0.0
10.0.0
The Secure Firewall 6100 supports Spanned EtherChannel and
Individual interface clustering for up to 4 nodes.
Distributed site-to-site VPN with clustering on the Secure
Firewall 4200
10.0.0
10.0.0
A cluster on the Secure Firewall 4200 supports site-to-site VPN
in distributed mode. Distributed mode provides the ability to
have many site-to-site IPsec IKEv2 VPN connections distributed
across members of a cluster, not just on the control node (as in
centralized mode). This significantly scales VPN support beyond
centralized VPN capabilities and provides high availability.
Added/modified commands: cluster redistribute
vpn-sessiondb, show cluster vpn-sessiondb,
cluster vpn-mode , show cluster resource
usage, show vpn-sessiondb , show conn detail,
show crypto ikev2 stats
Cluster redirect: flow offload support for the Secure Firewall
4200 asymmetric cluster traffic
10.0.0
10.0.0
For asymmetric flows, cluster redirect lets the forwarding node
offload flows to hardware. This feature is enabled by default
but can be configured using FlexConfig.
When traffic for an existing flow is sent to a different node,
then that traffic is redirected to the owner node over the
cluster control link. Because asymmetric flows can create a lot
of traffic on the cluster control link, letting the forwarder
offload these flows can improve performance.
Added/modified commands: flow-offload
cluster-redirect (FlexConfig),
show conn, show
flow-offload flow, show
flow-offload info.
IPsec flow offload for traffic on the cluster control link on the
Firewall Management Center in distributed site-to-site VPN mode
10.0.0
10.0.0
For asymmetric flows in distributed site-to-site VPN mode, IPsec
flow offload now lets the flow owner decrypt IPsec traffic in
hardware that was forwarded over the cluster control link. This
feature is not configurable and is always available with IPsec
flow offload.
Added/modified commands: show crypto ipsec sa
detail.
MTU ping test on cluster node join provides more information by
trying smaller MTUs
10.0.0
10.0.0
When a node joins the cluster, it checks MTU compatibility by
sending a ping to the control node with a packet size matching
the cluster control link MTU. If the ping fails, it tries the
MTU divided by 2 and keeps dividing by 2 until an MTU ping is
successful. A notification is generated so you can fix the MTU
to a working value and try again. We recommend increasing the
switch MTU size to the recommended value, but if you can't
change the switch configuration, a working value for the cluster
control link will let you form the cluster.
Added/modified commands: show cluster
history.
Improved cluster control link health check with high CPU
10.0.0
10.0.0
When a cluster node CPU usage is high, the health check will be
suspended, and the node will not be marked as unhealthy. This
feature is enabled by default when the CPU usage reaches 90% but
can be configured using FlexConfig.
16-node clusters for the Secure Firewall
3100/4200.
7.6.0
7.6.0
For the Secure Firewall 3100 and 4200, the maximum nodes were
increased from 8 to 16.
Individual interface mode for
Secure Firewall 3100/4200 clusters.
7.6.0
7.6.0
Individual interfaces are normal routed interfaces, each with
their own local IP address used for routing. The main
cluster IP address for each interface is a fixed address
that always belongs to the control node. When the control
node changes, the main cluster IP address moves to the new
control node, so management of the cluster continues
seamlessly. Load balancing must be configured separately on
the upstream switch.
Restrictions: Not supported for container instances.
Objects > Object Management > Address Pools > MAC Address Pool
MTU ping test on cluster node
join
7.6.0
7.6.0
When a node joins the cluster, it checks MTU compatibility by
sending a ping to the control node with a packet size
matching the cluster control link MTU. If the ping fails, a
notification is generated so you can fix the MTU mismatch on
connecting switches and try again.
Cluster control link ping
tool.
7.2.6
7.4.1
Any
You can check to make sure all the cluster nodes can reach
each other over the cluster control link by performing a
ping. One major cause for the failure of a node to join the
cluster is an incorrect cluster control link configuration;
for example, the cluster control link MTU may be set higher
than the connecting switch MTUs.
New/modified screens: Devices > Device Management > More > Cluster Live Status.
Troubleshooting file generation
and download available from Device and Cluster
pages.
7.4.1
7.4.1
You can generate and download troubleshooting files for each device on the Device page and also for all cluster nodes on the
Cluster page. For a cluster, you can download all files as a single compressed file. You can also include cluster logs for
the cluster for cluster nodes. You can alternatively trigger file generation from the Devices > Device Management > More > Troubleshoot Files menu.
New/modified screens:
Devices > Device Management > Device > General
Devices > Device Management > Cluster > General
Automatic generation of a
troubleshooting file on a node when it fails to join the
cluster.
7.4.1
7.4.1
If a node fails to join the cluster, a troubleshooting file
is automatically generated for the node. You can download
the file from Tasks or from the
Cluster page.
View CLI output for a device or device
cluster.
7.4.1
Any
You can view a set of pre-defined CLI outputs that can help
you troubleshoot the device or cluster. You can also enter
any show command and see the
output.
New/modified screens: Devices > Device Management > Cluster > General
Clustering for the Secure Firewall 4200
7.4.0
7.4.0
The Secure Firewall 4200 supports Spanned EtherChannel clustering
for up to 8 nodes.
If you previously configured these settings using FlexConfig,
be sure to remove the FlexConfig configuration before you
deploy. Otherwise the FlexConfig configuration will
overwrite the management center configuration.
Cluster health monitor dashboard
7.3.0
Any
You can now view cluster health on the cluster health monitor
dashboard.
New/modified screens: System > Health > Monitor
Automatic configuration of the cluster control link MTU
7.2.0
7.2.0
The MTU of the cluster control link interface is now
automatically set to 100 bytes more than the highest data
interface MTU; by default, the MTU is 1600 bytes.
Clustering for the Secure Firewall 3100
7.1.0
7.1.0
The Secure Firewall 3100 supports Spanned EtherChannel clustering
for up to 8 nodes.

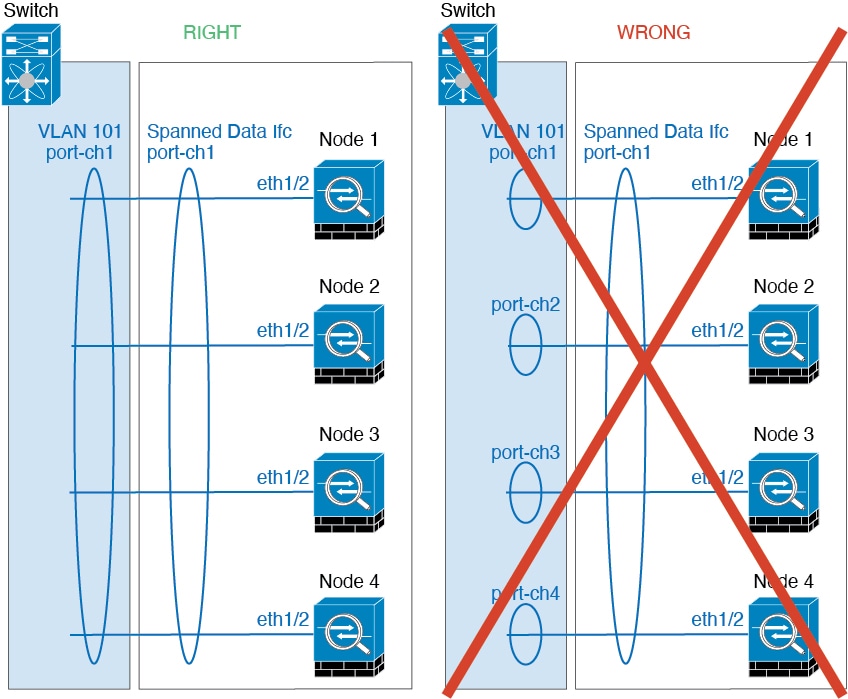
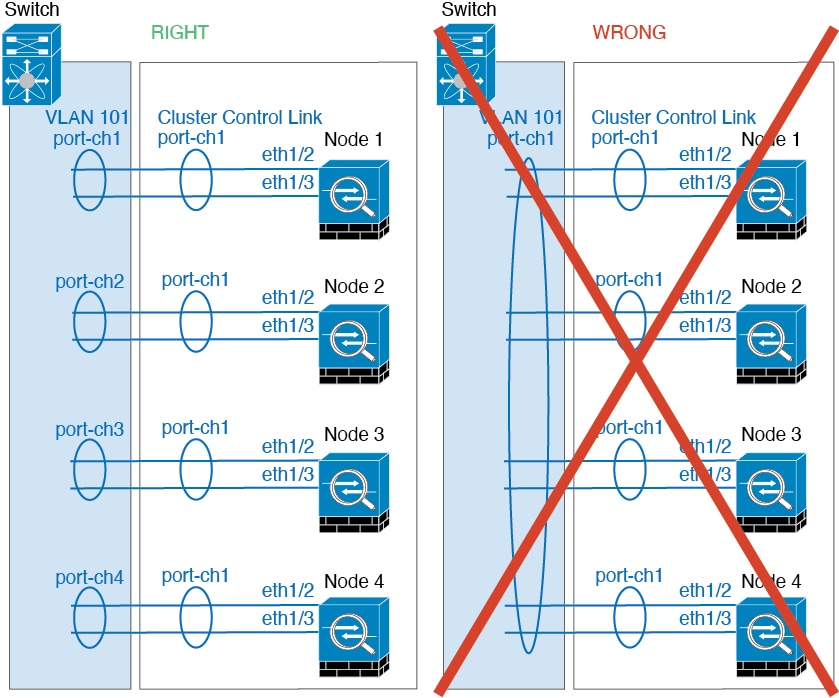
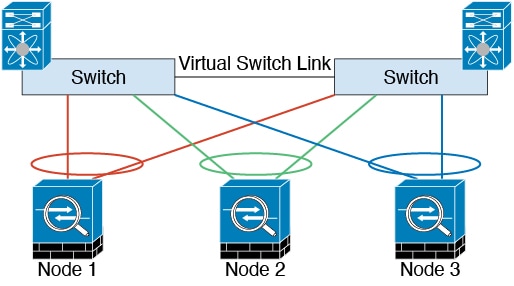
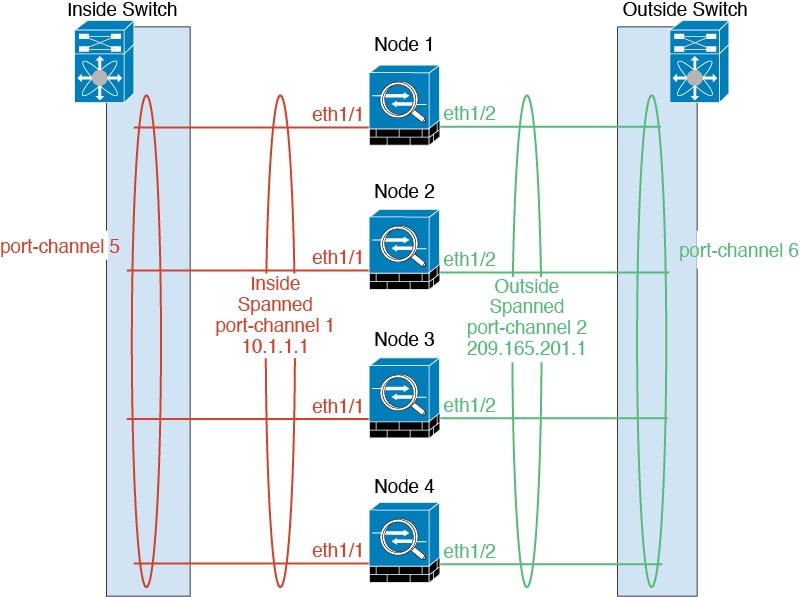
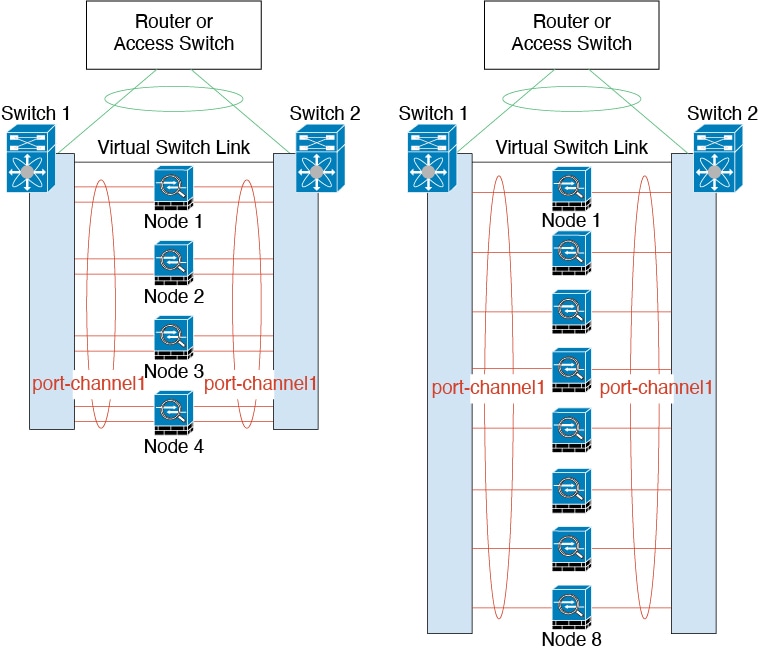
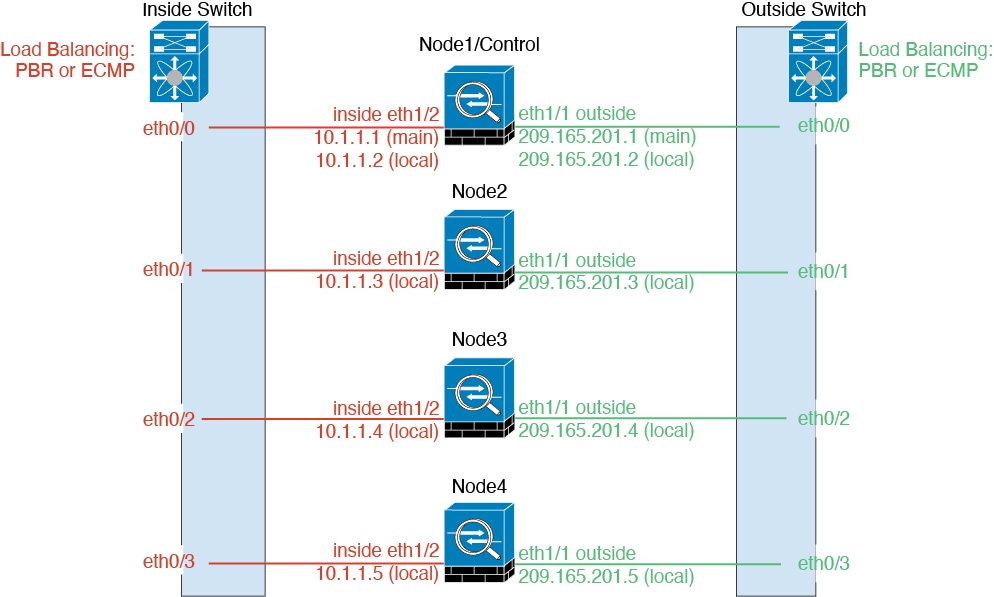
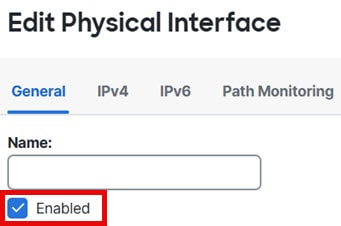
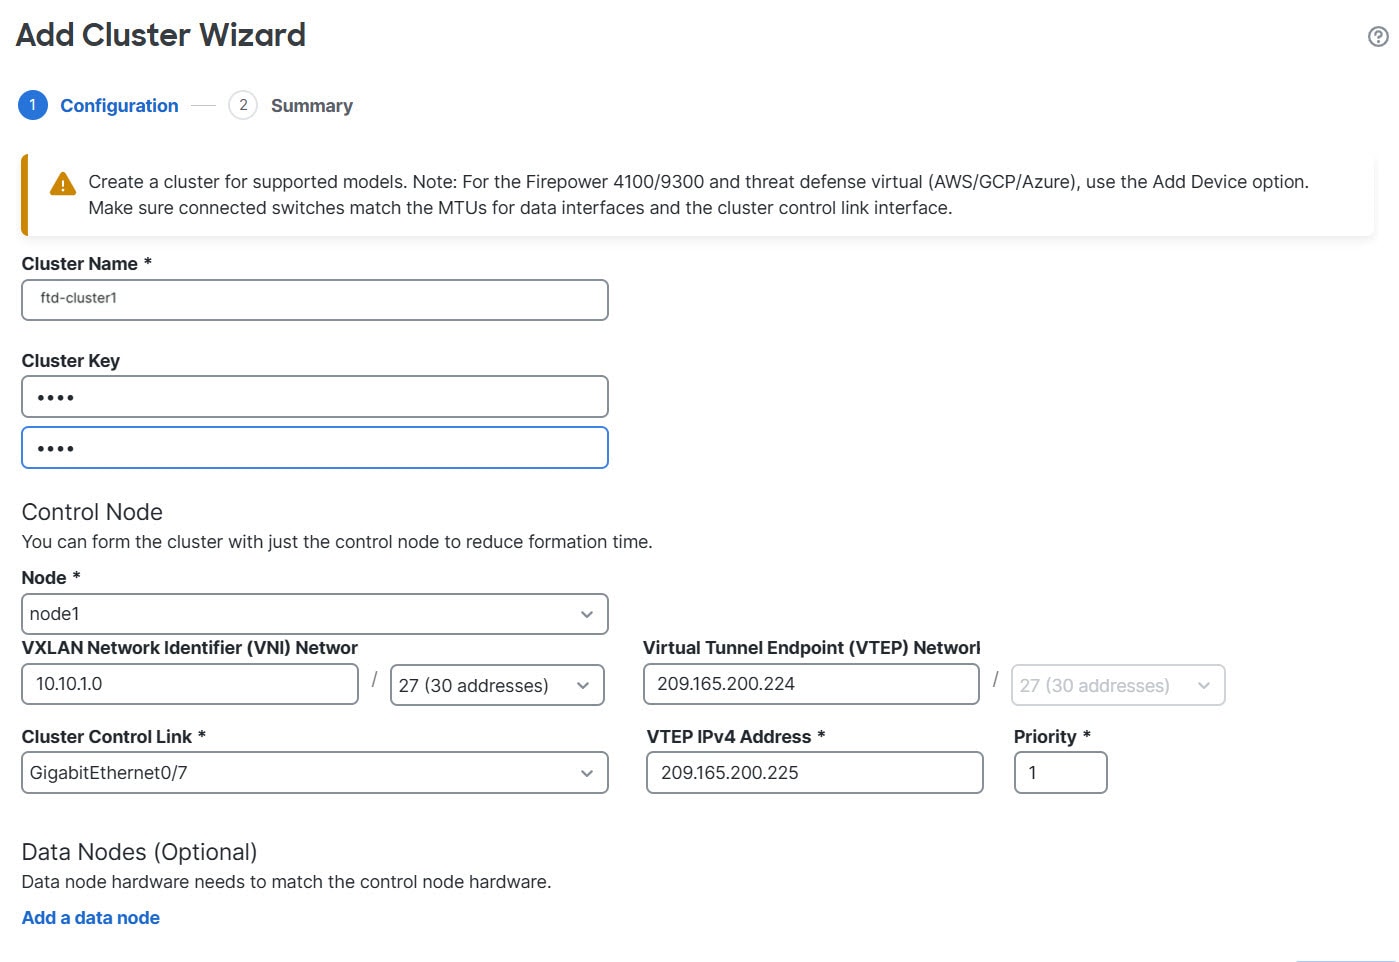
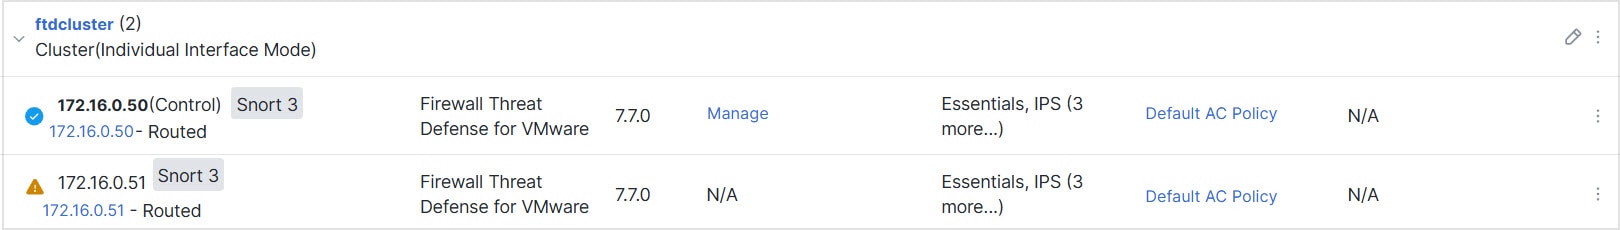
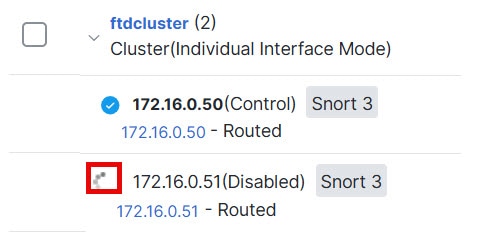
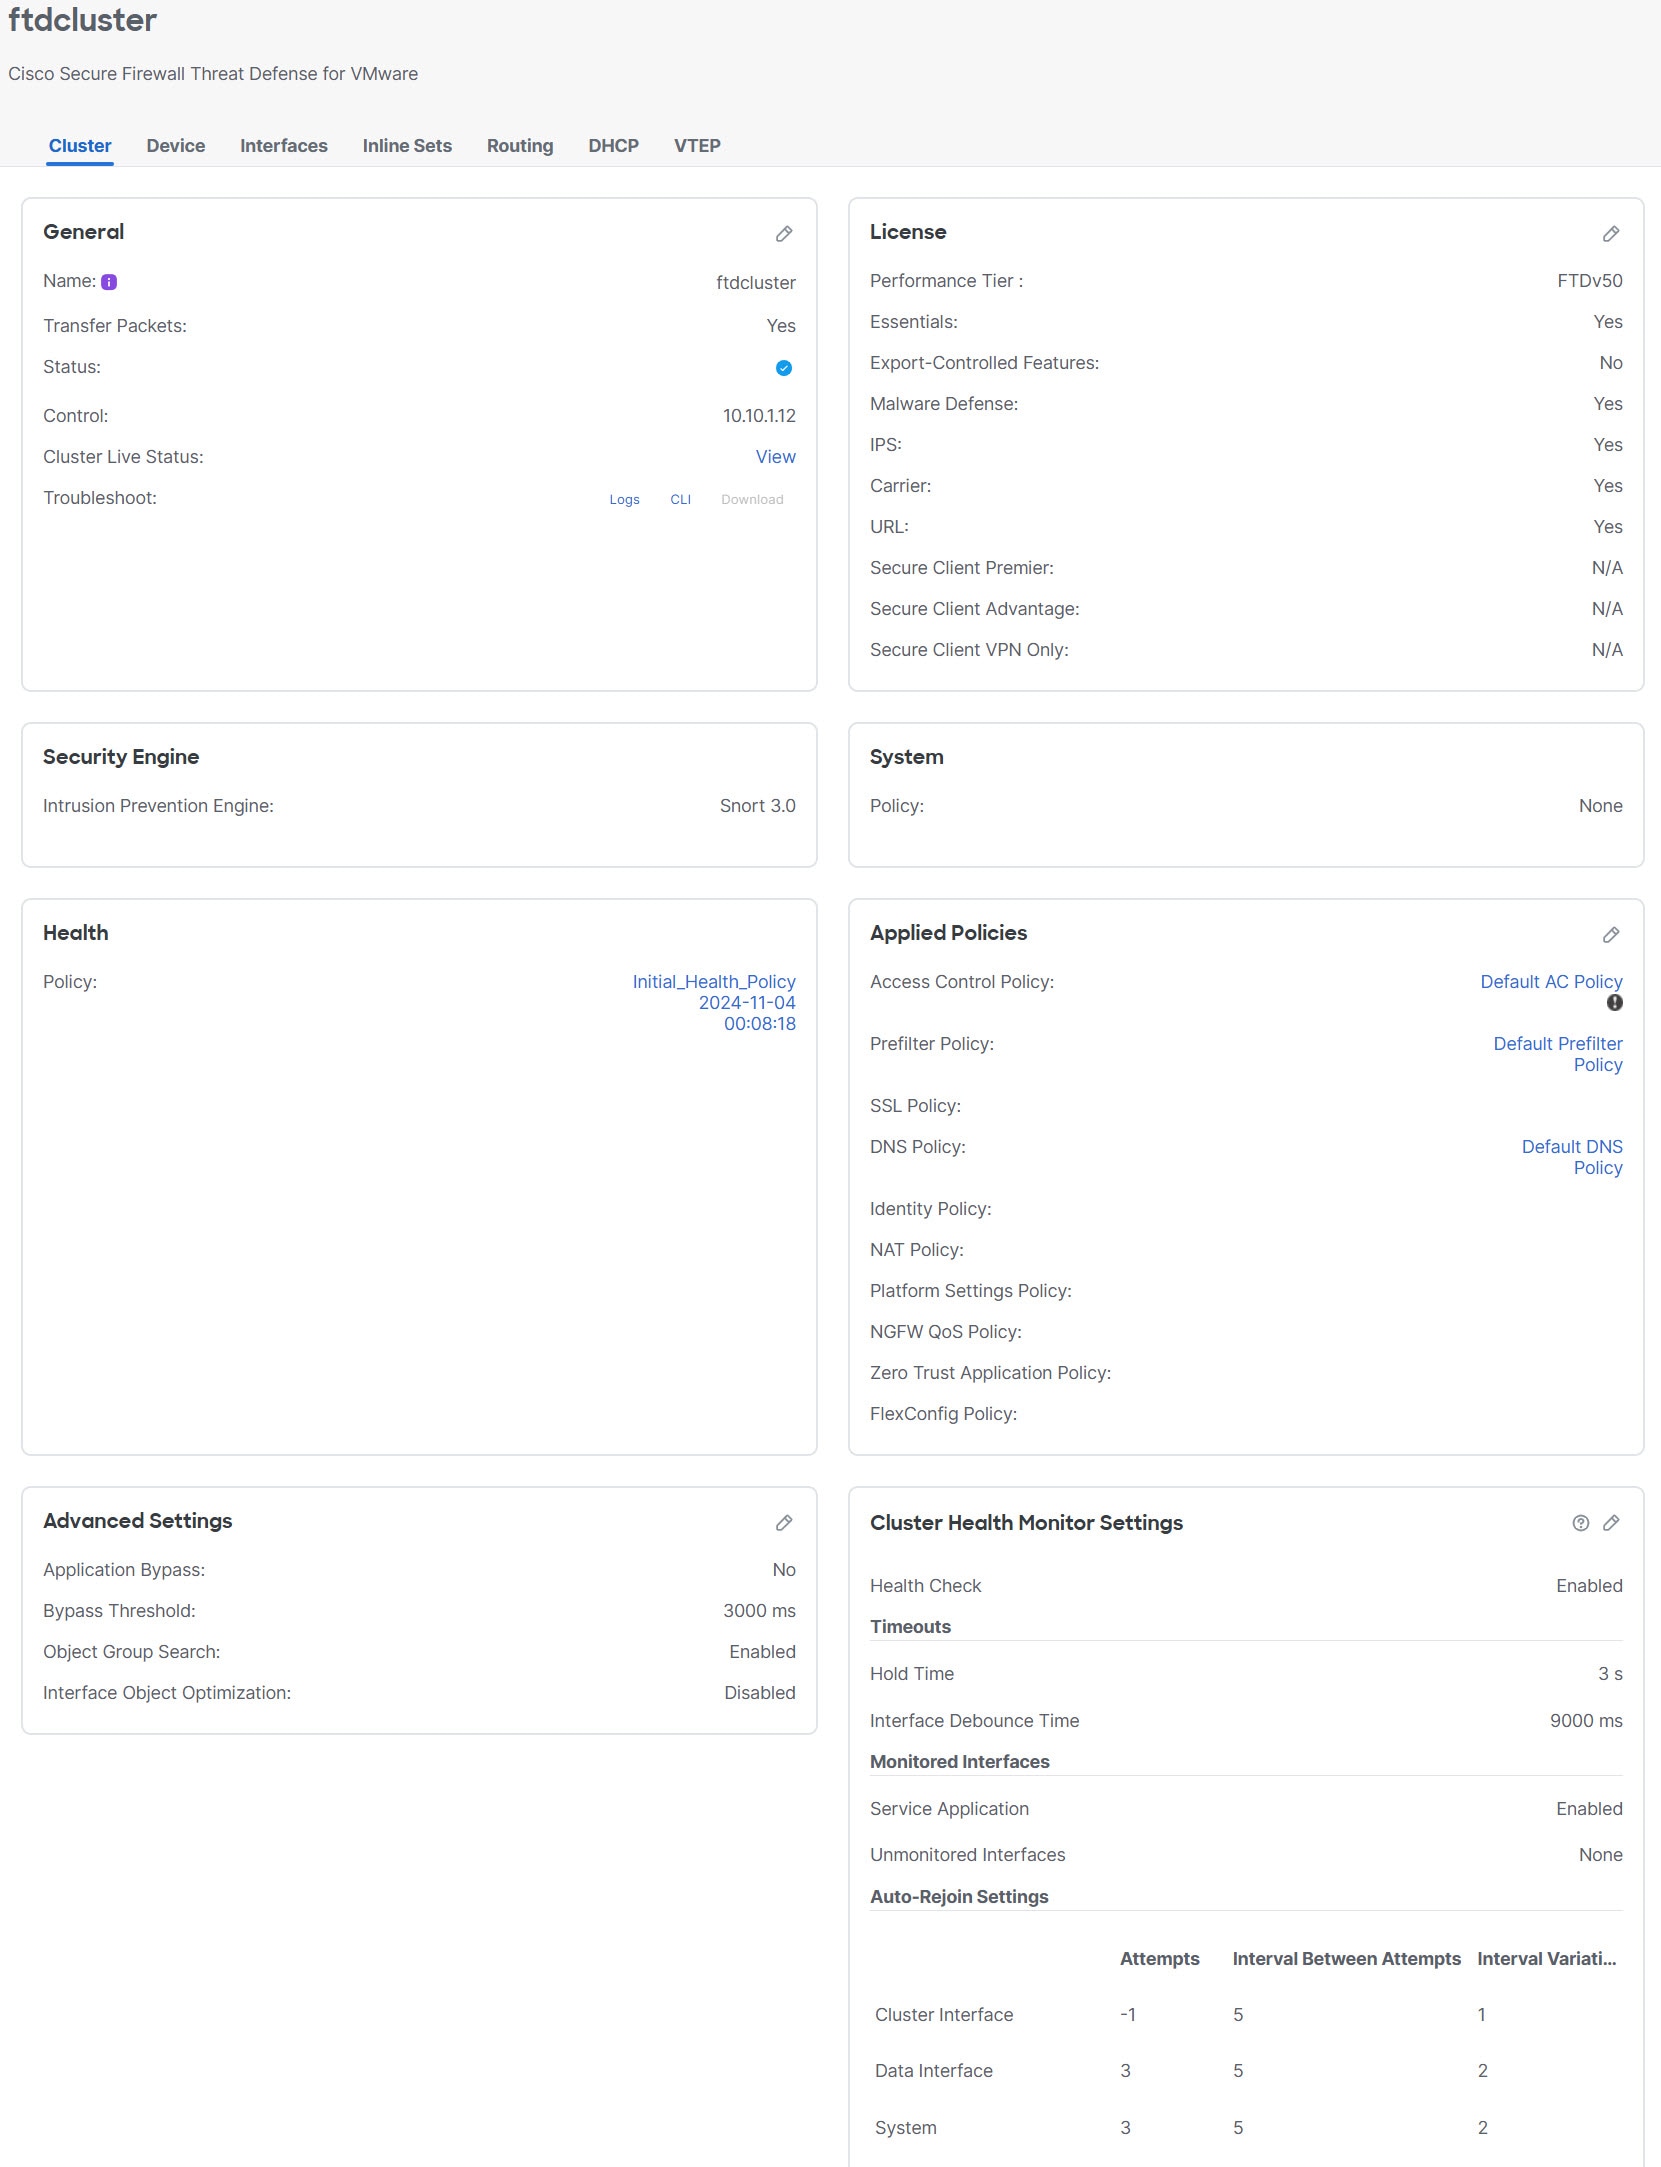
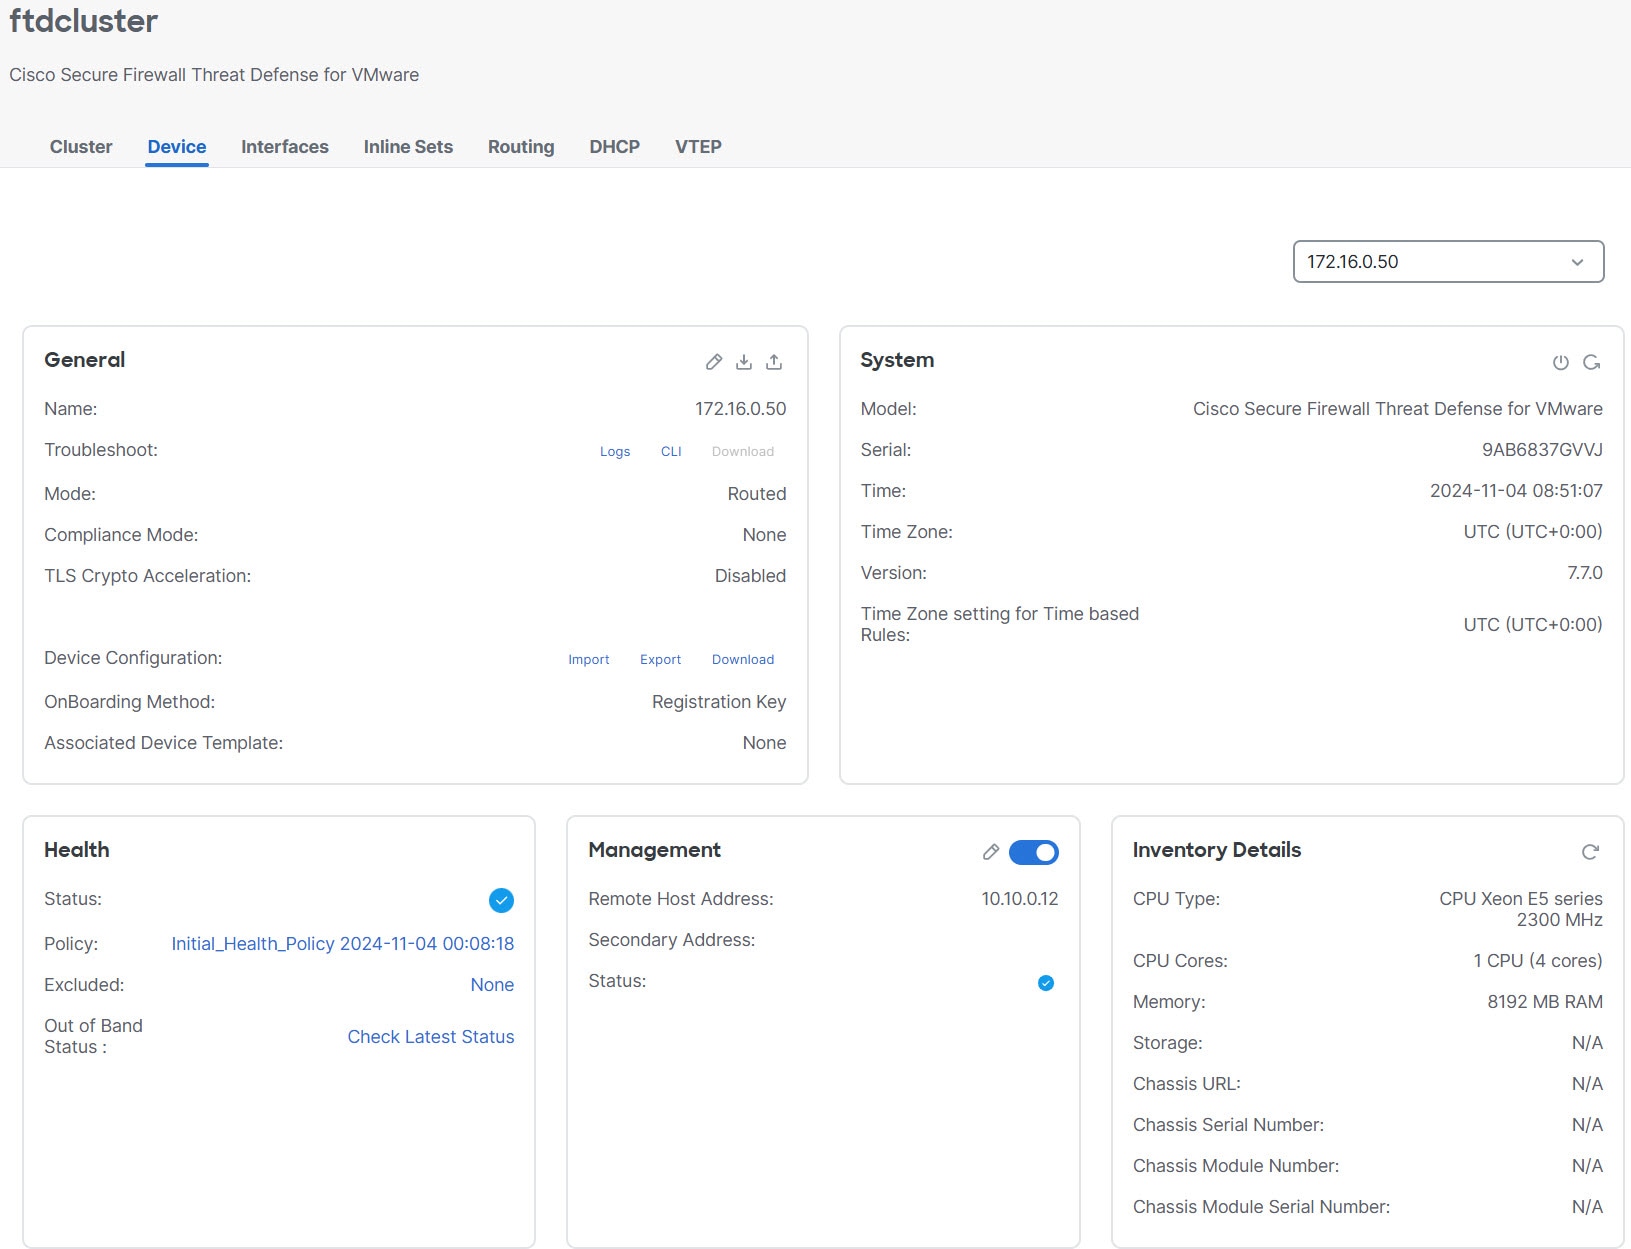
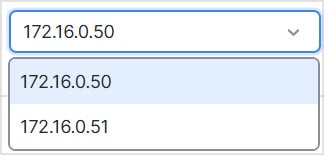

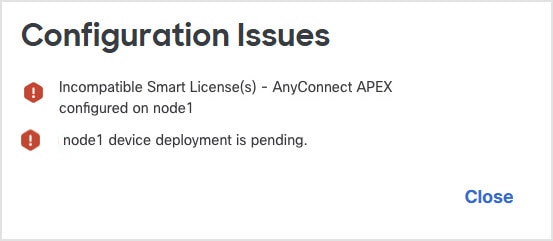
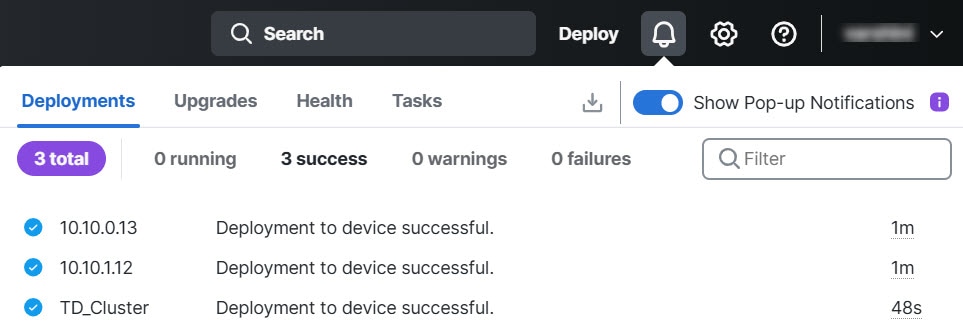
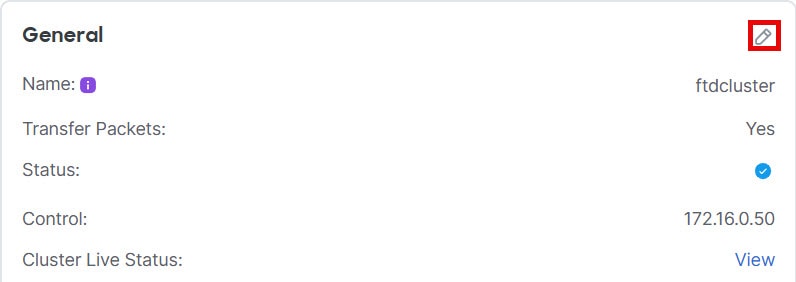
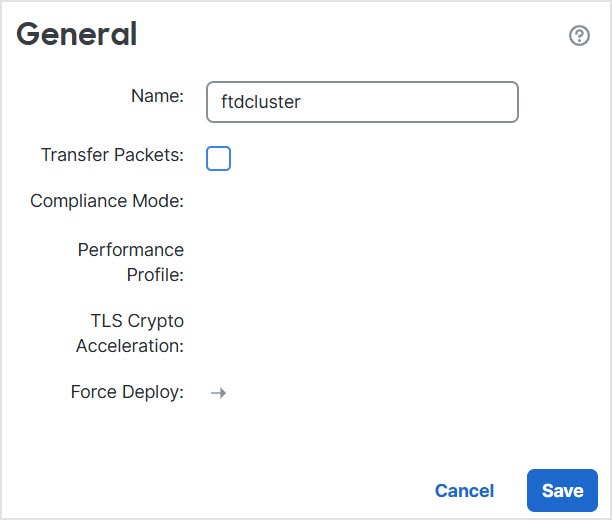
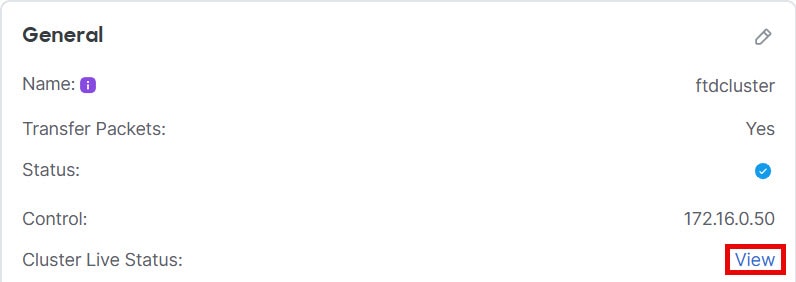
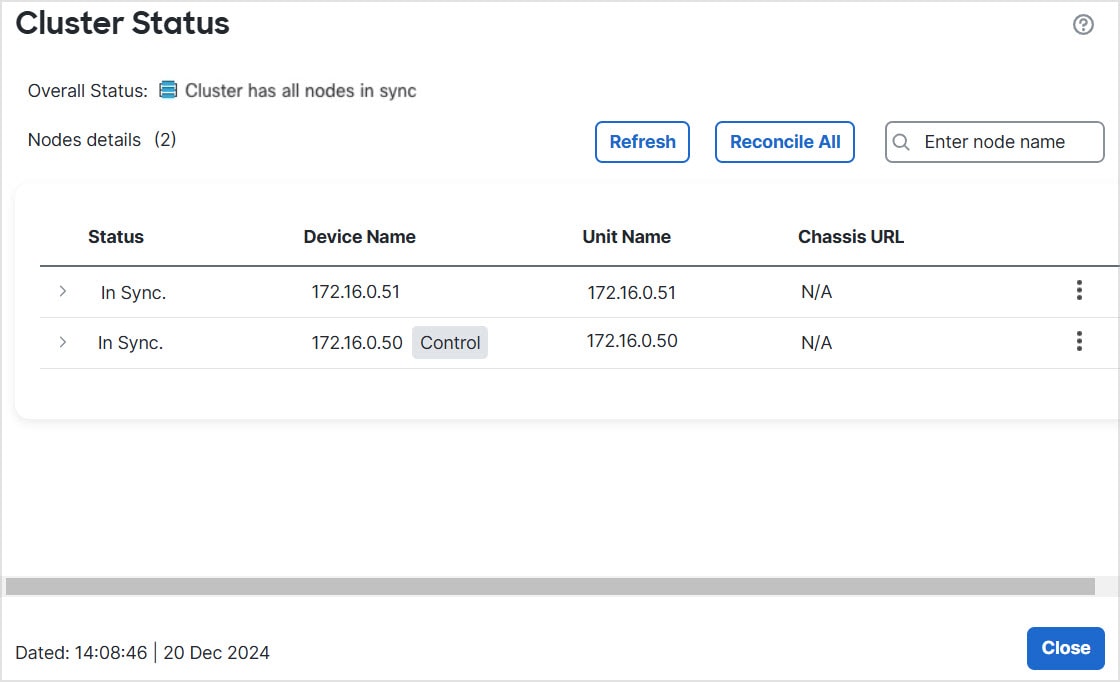
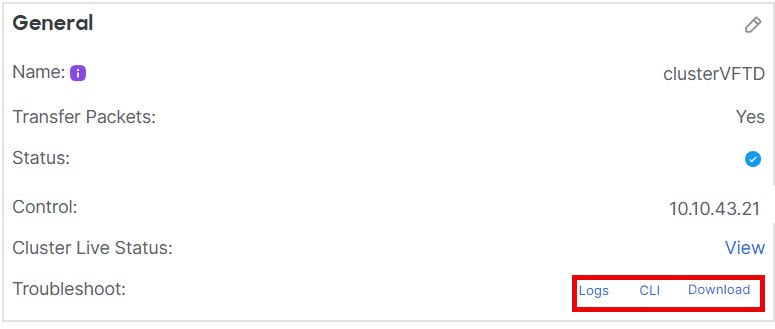
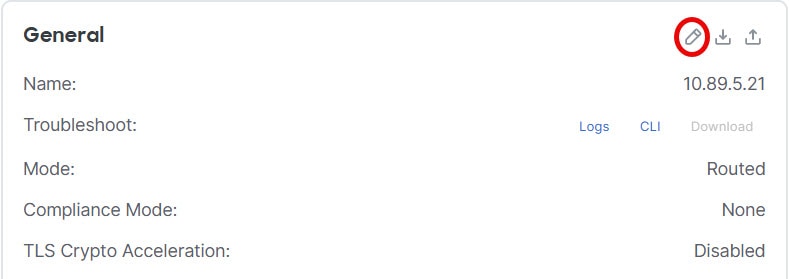
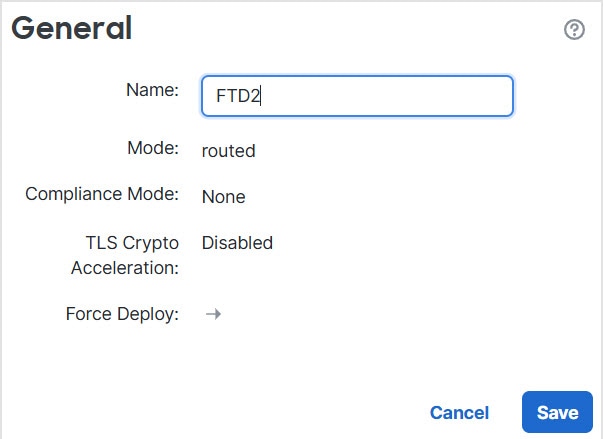
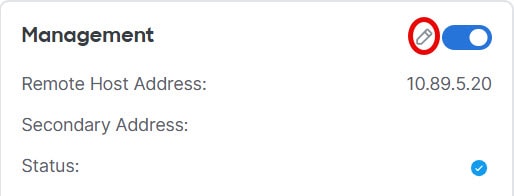
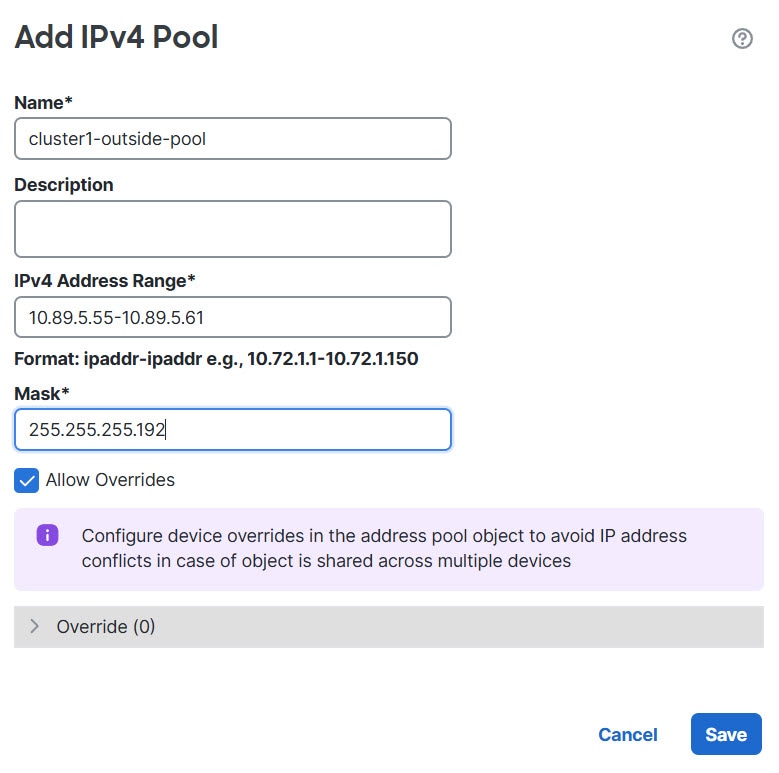
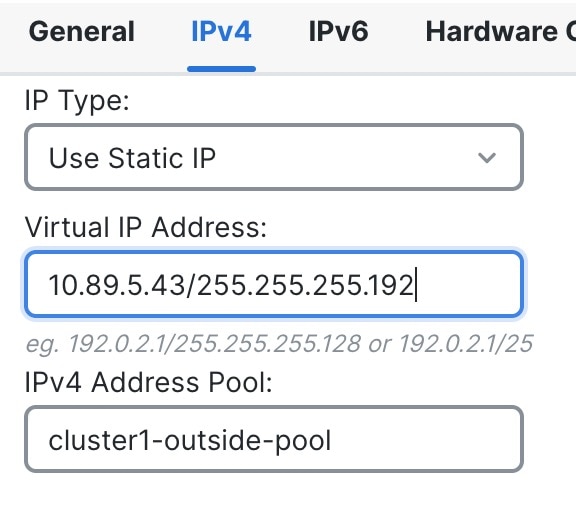
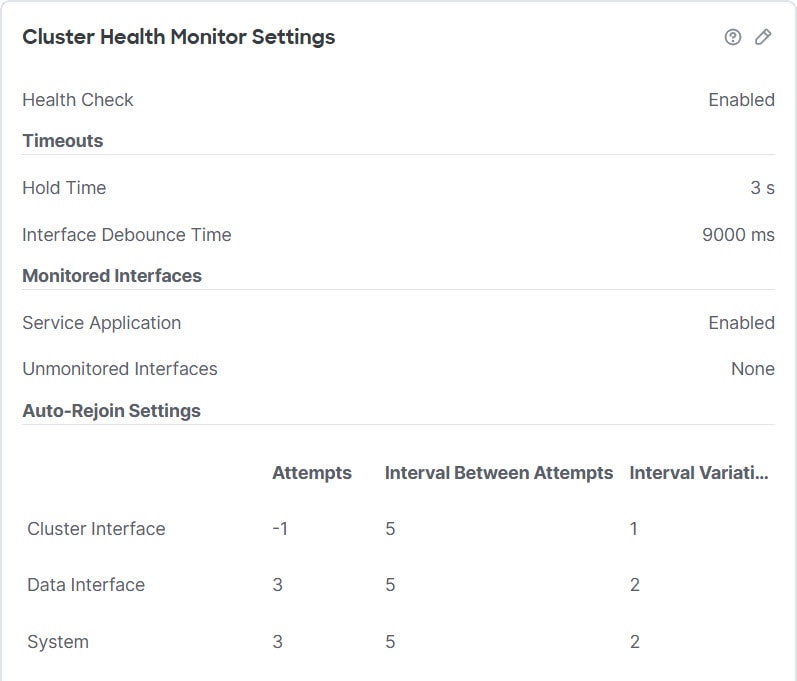
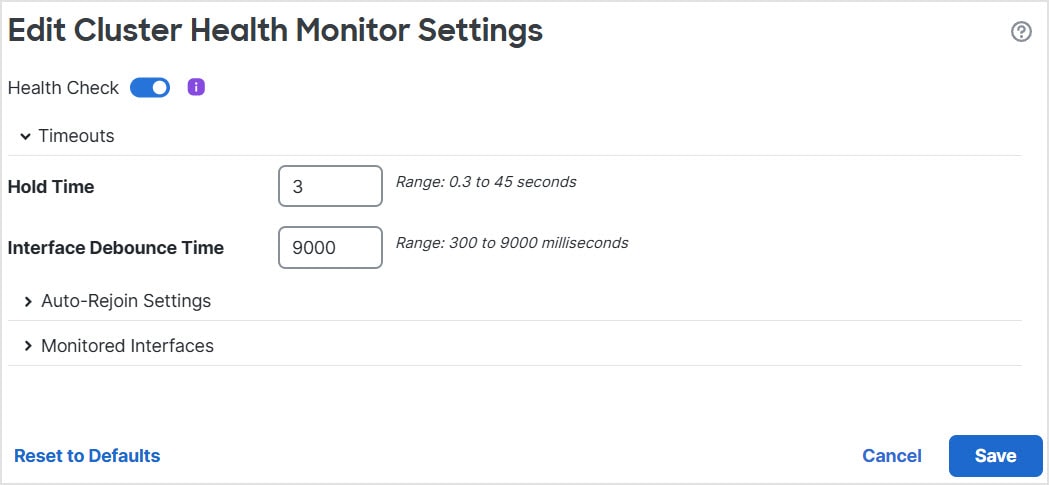
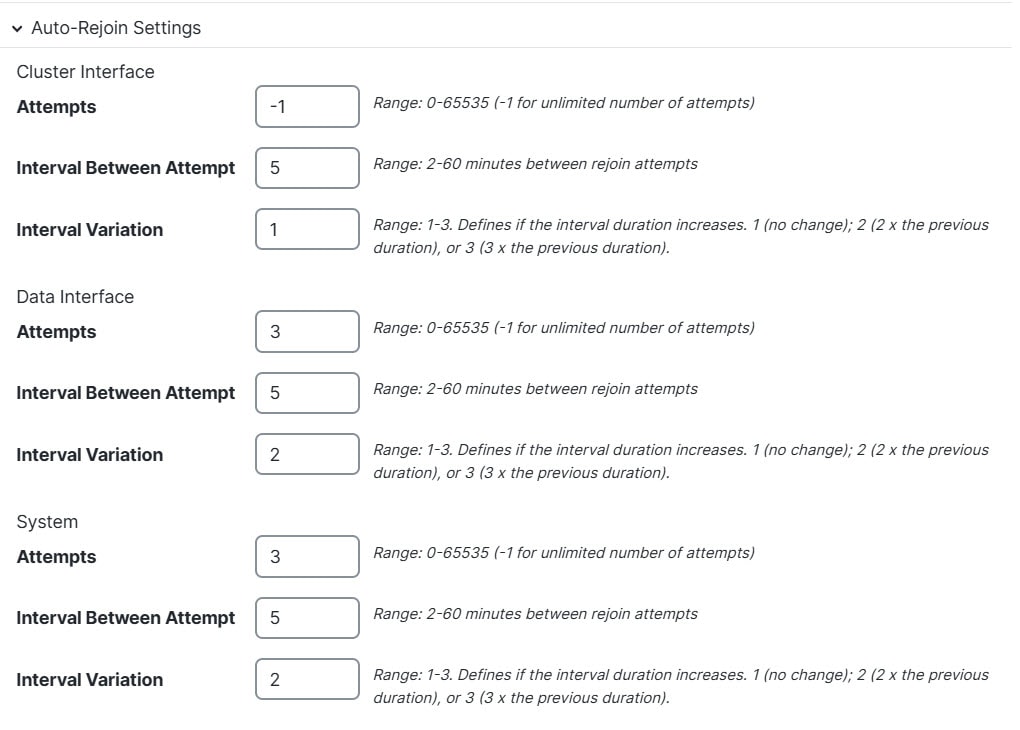
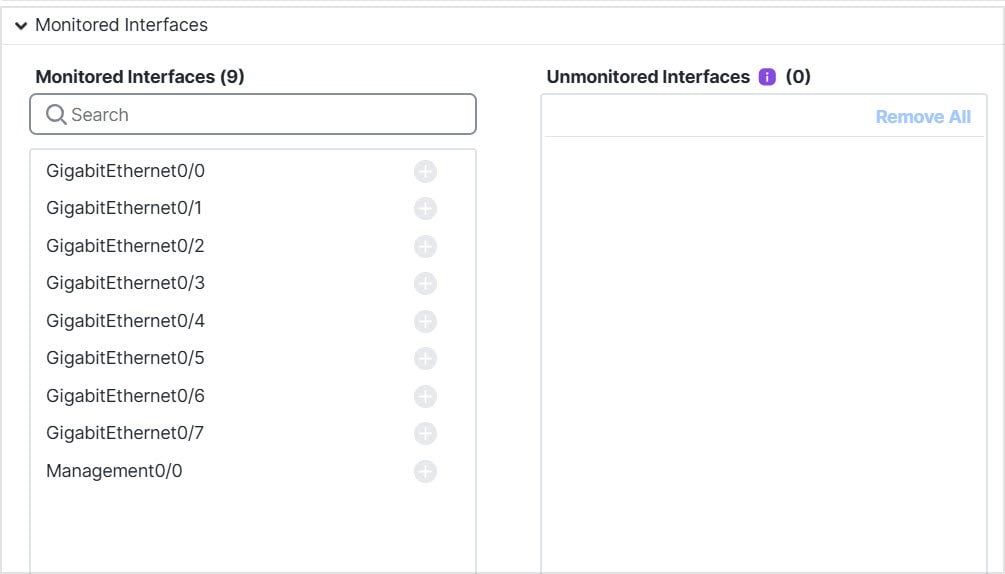
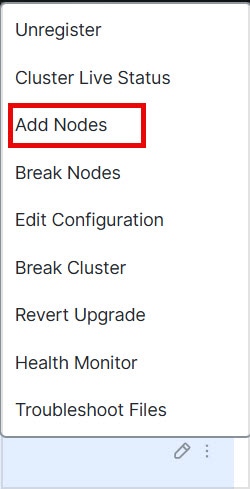
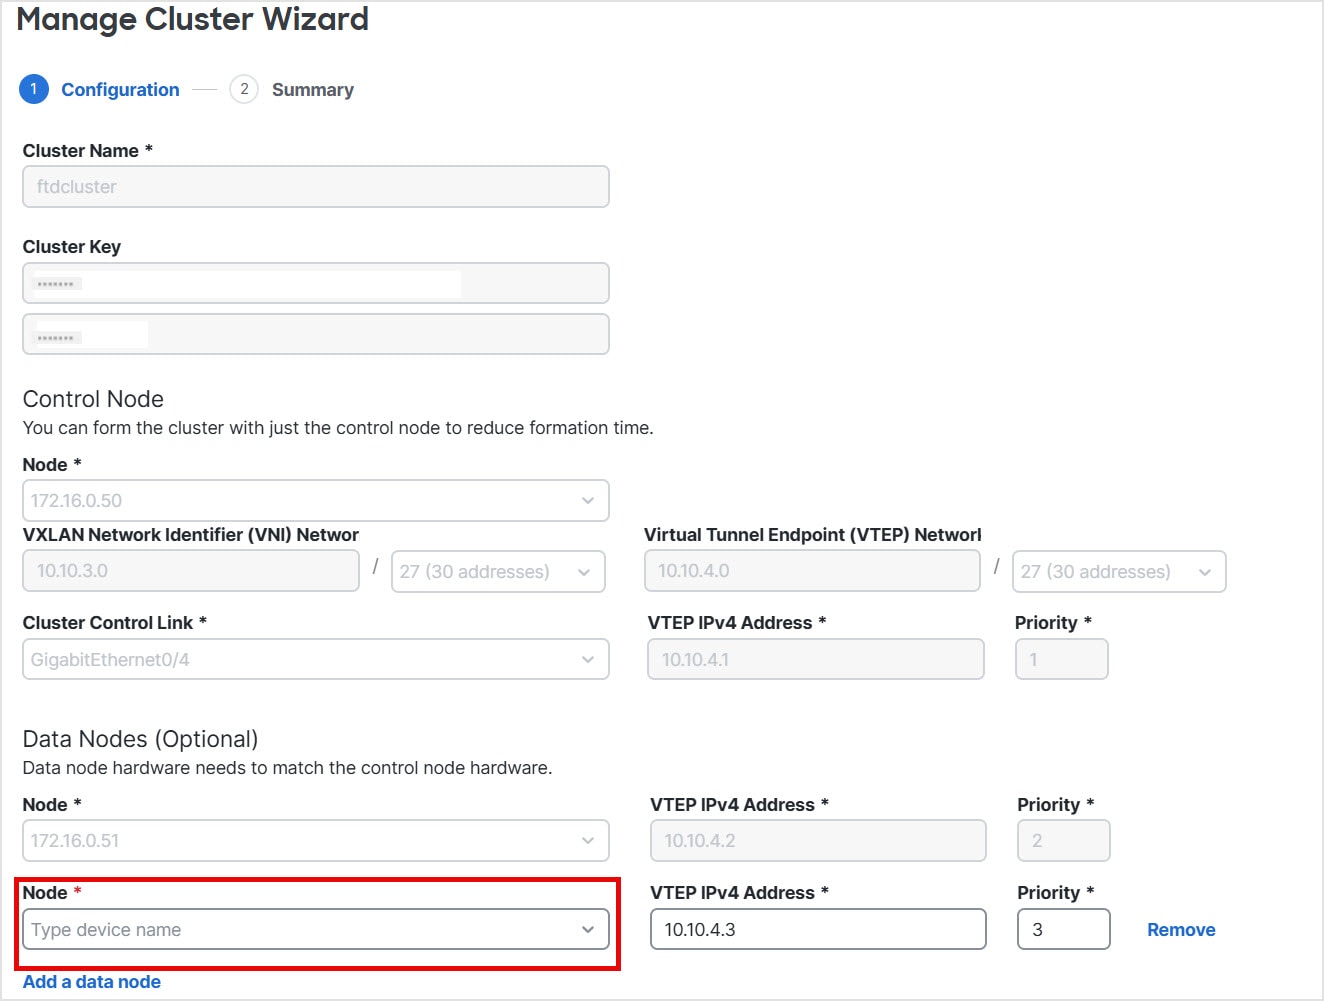
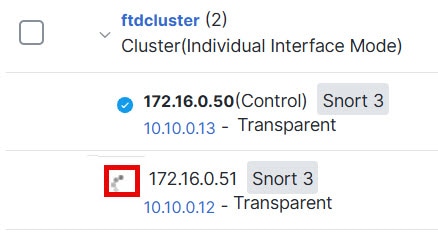
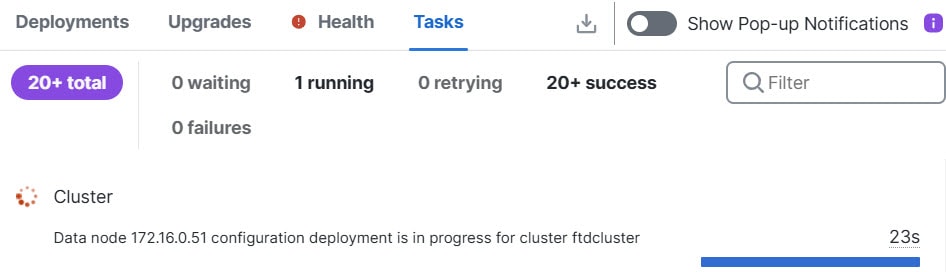
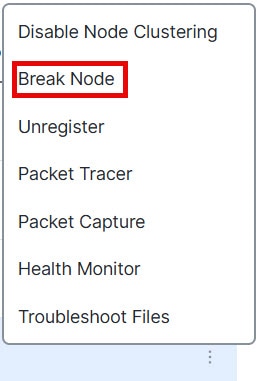
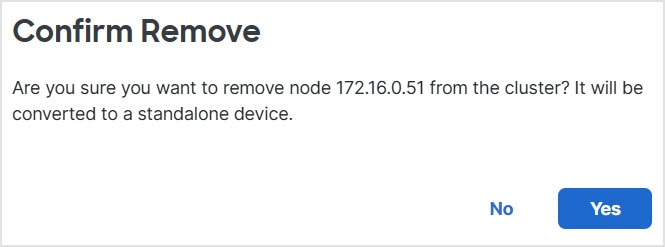
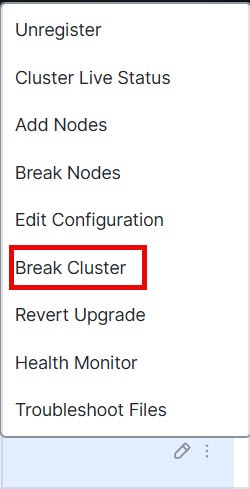
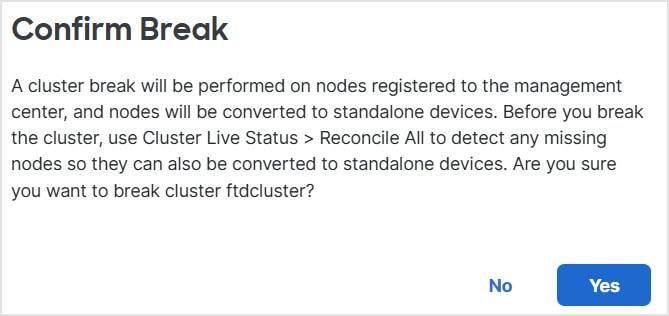
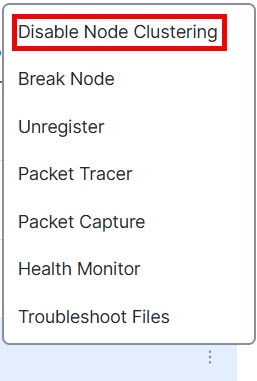

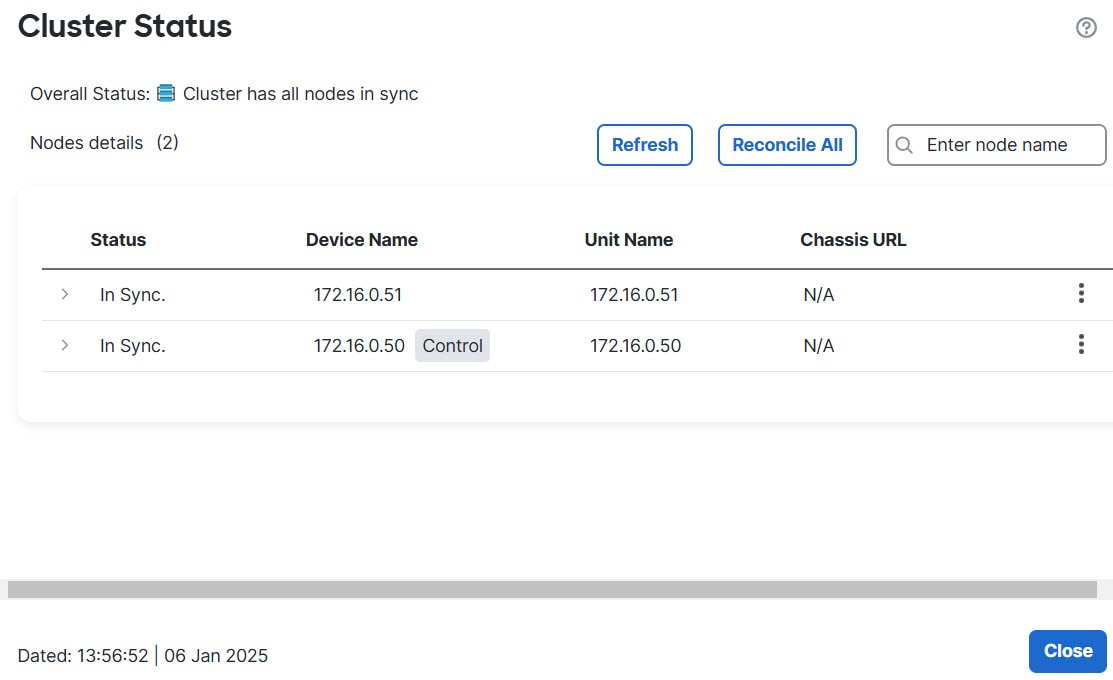
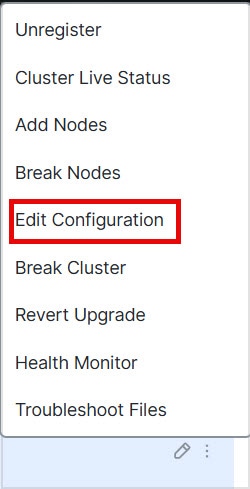
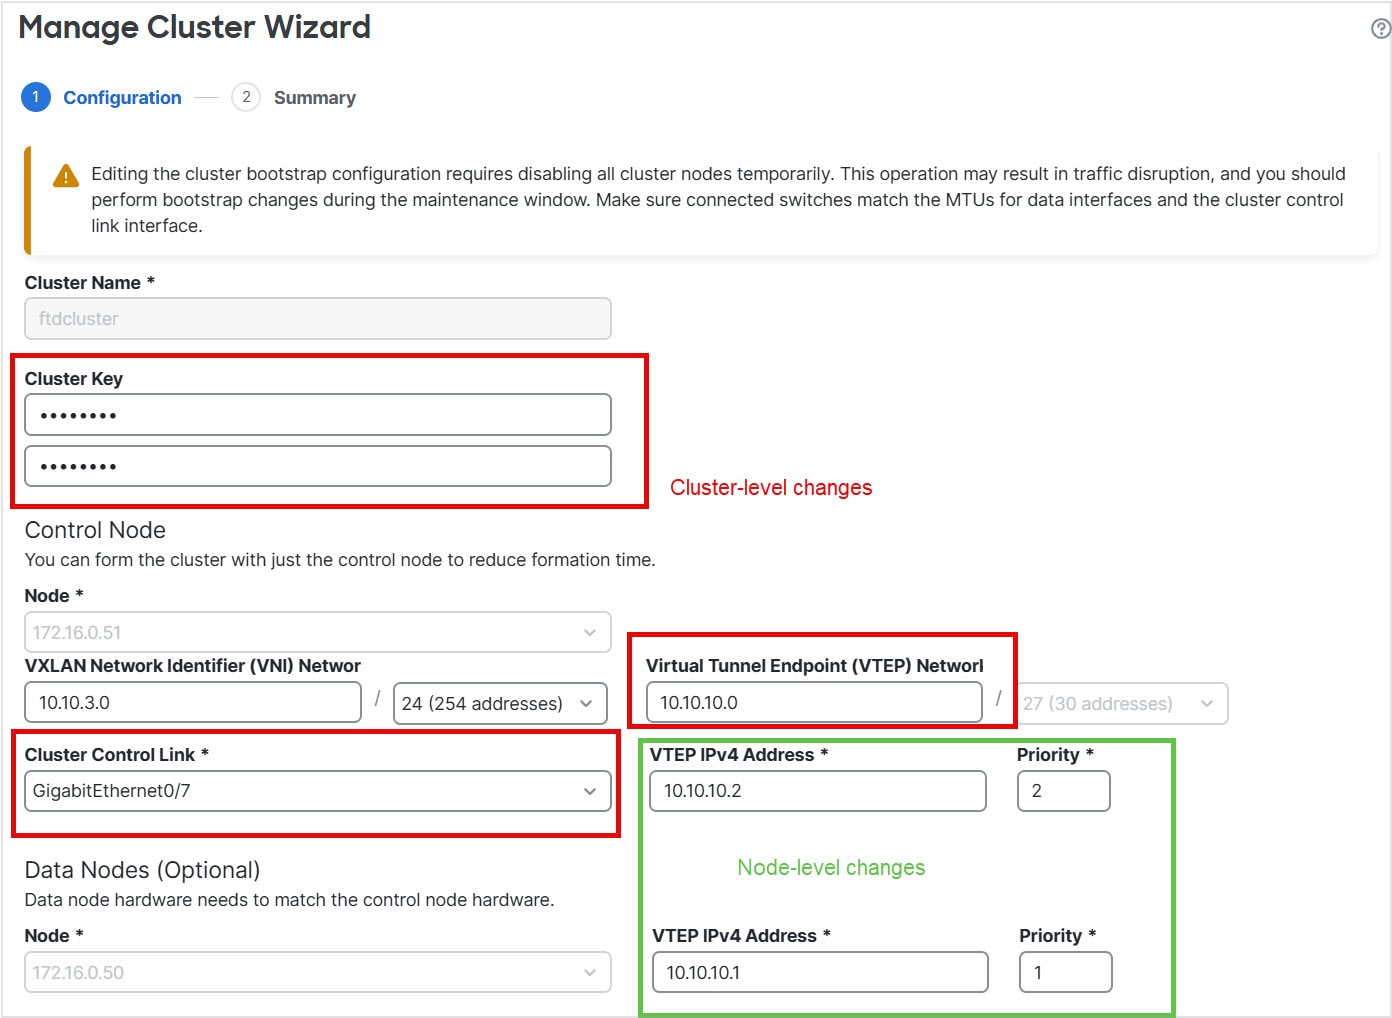
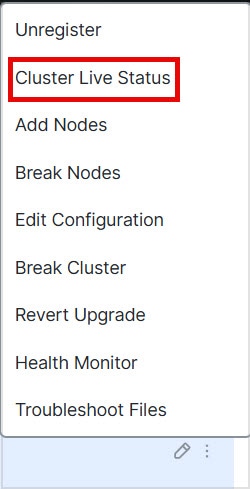
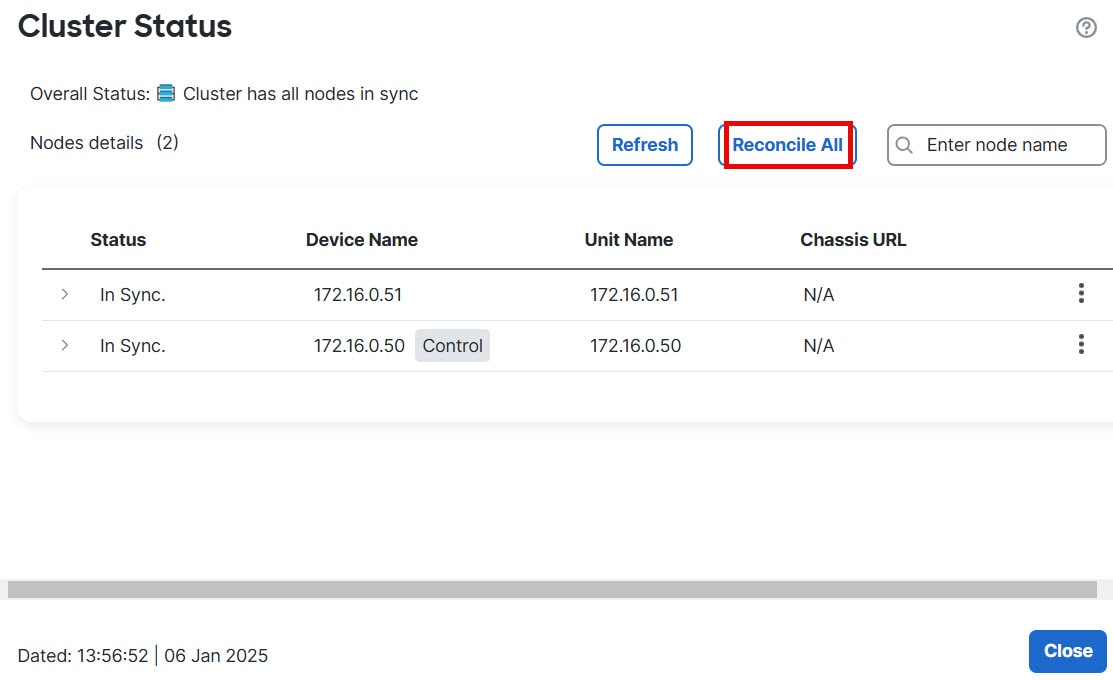
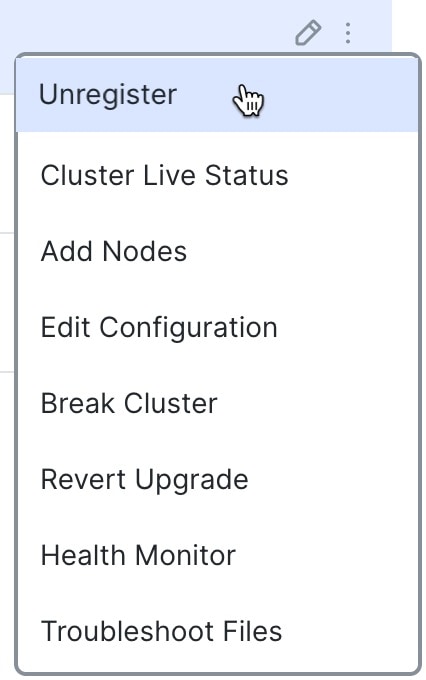
 ) icon or from the page General area Cluster Live Status link.
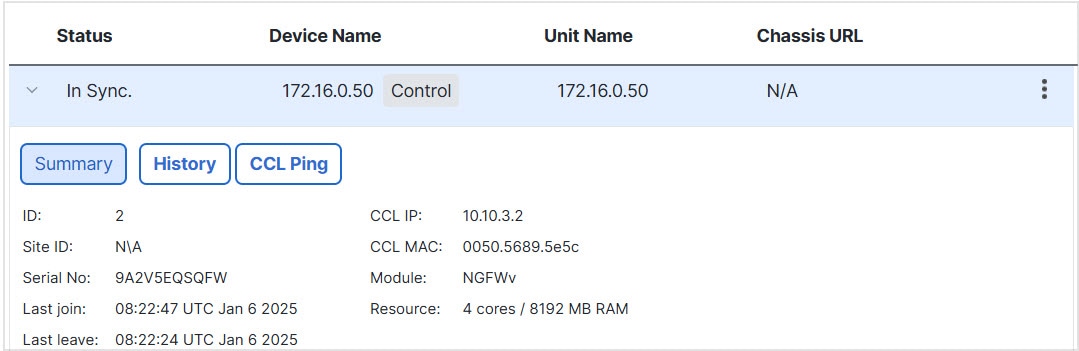
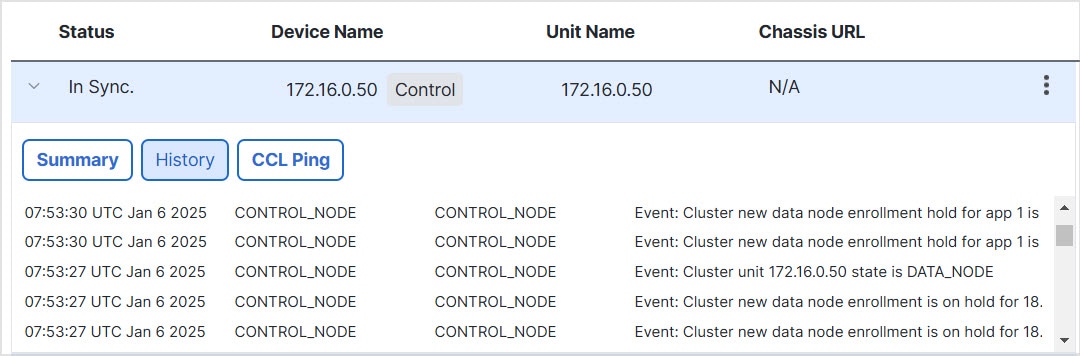
 ) > Tasks page.


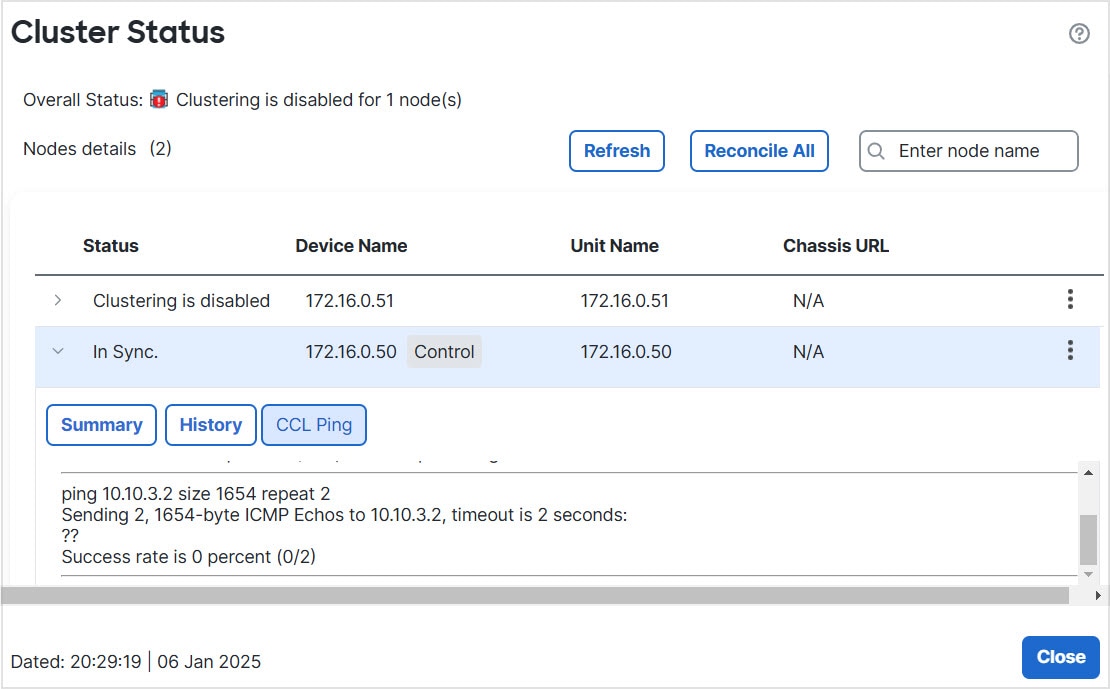
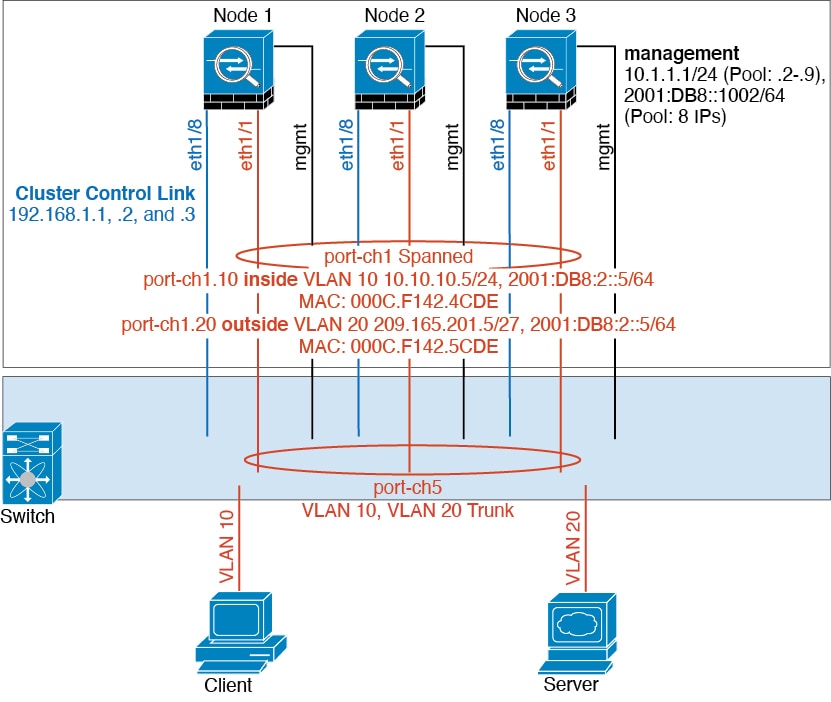
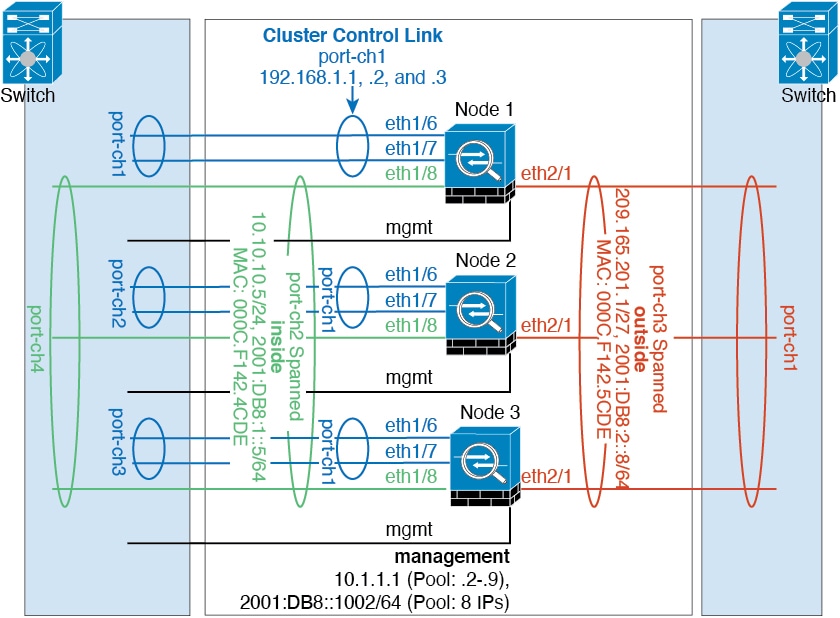
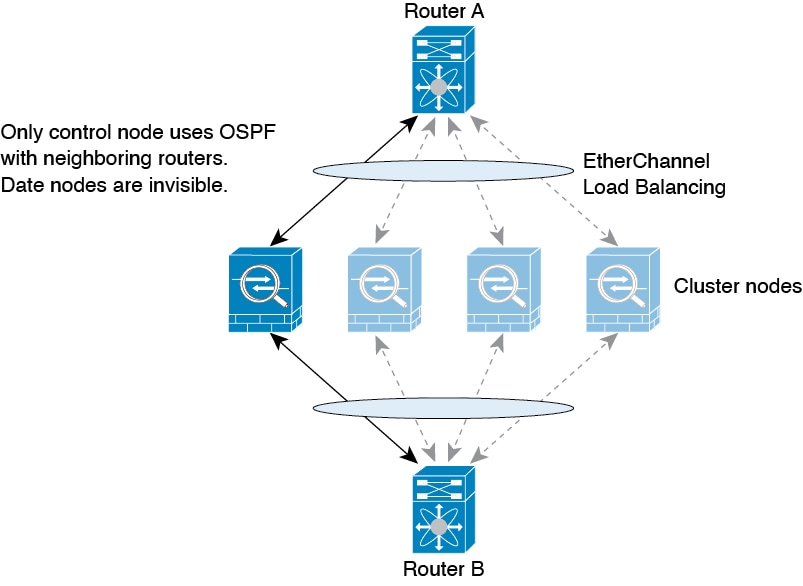
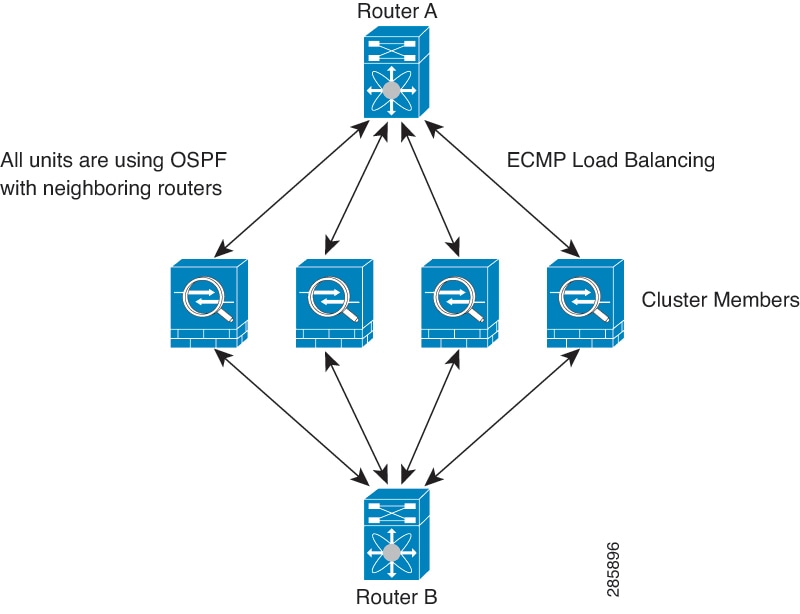
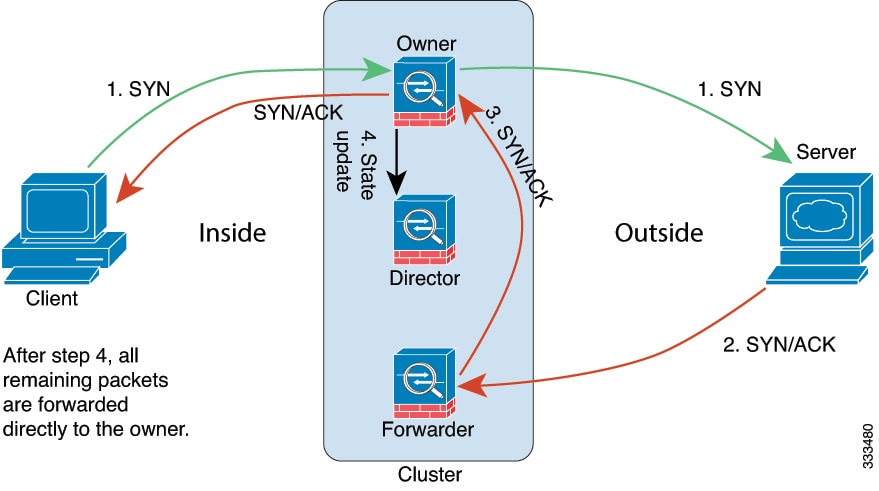
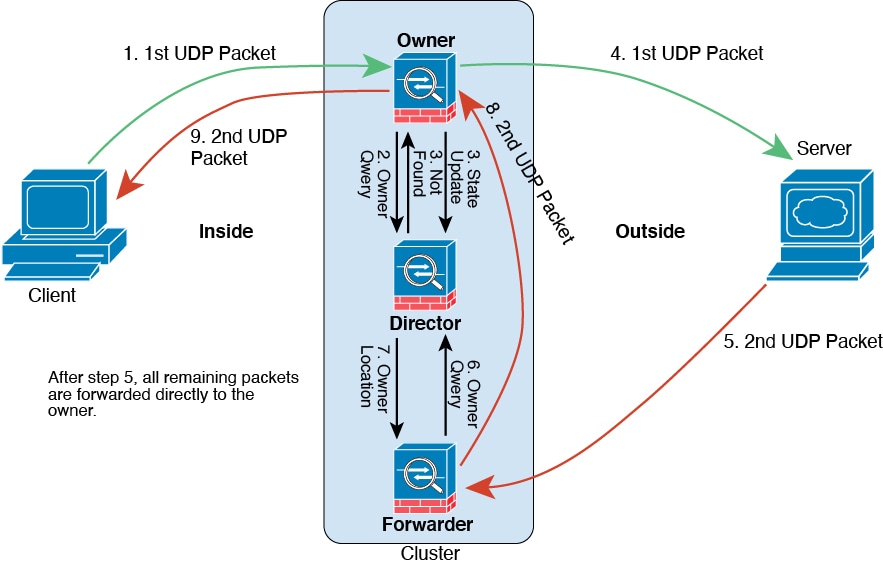
 Feedback