Fault Monitoring
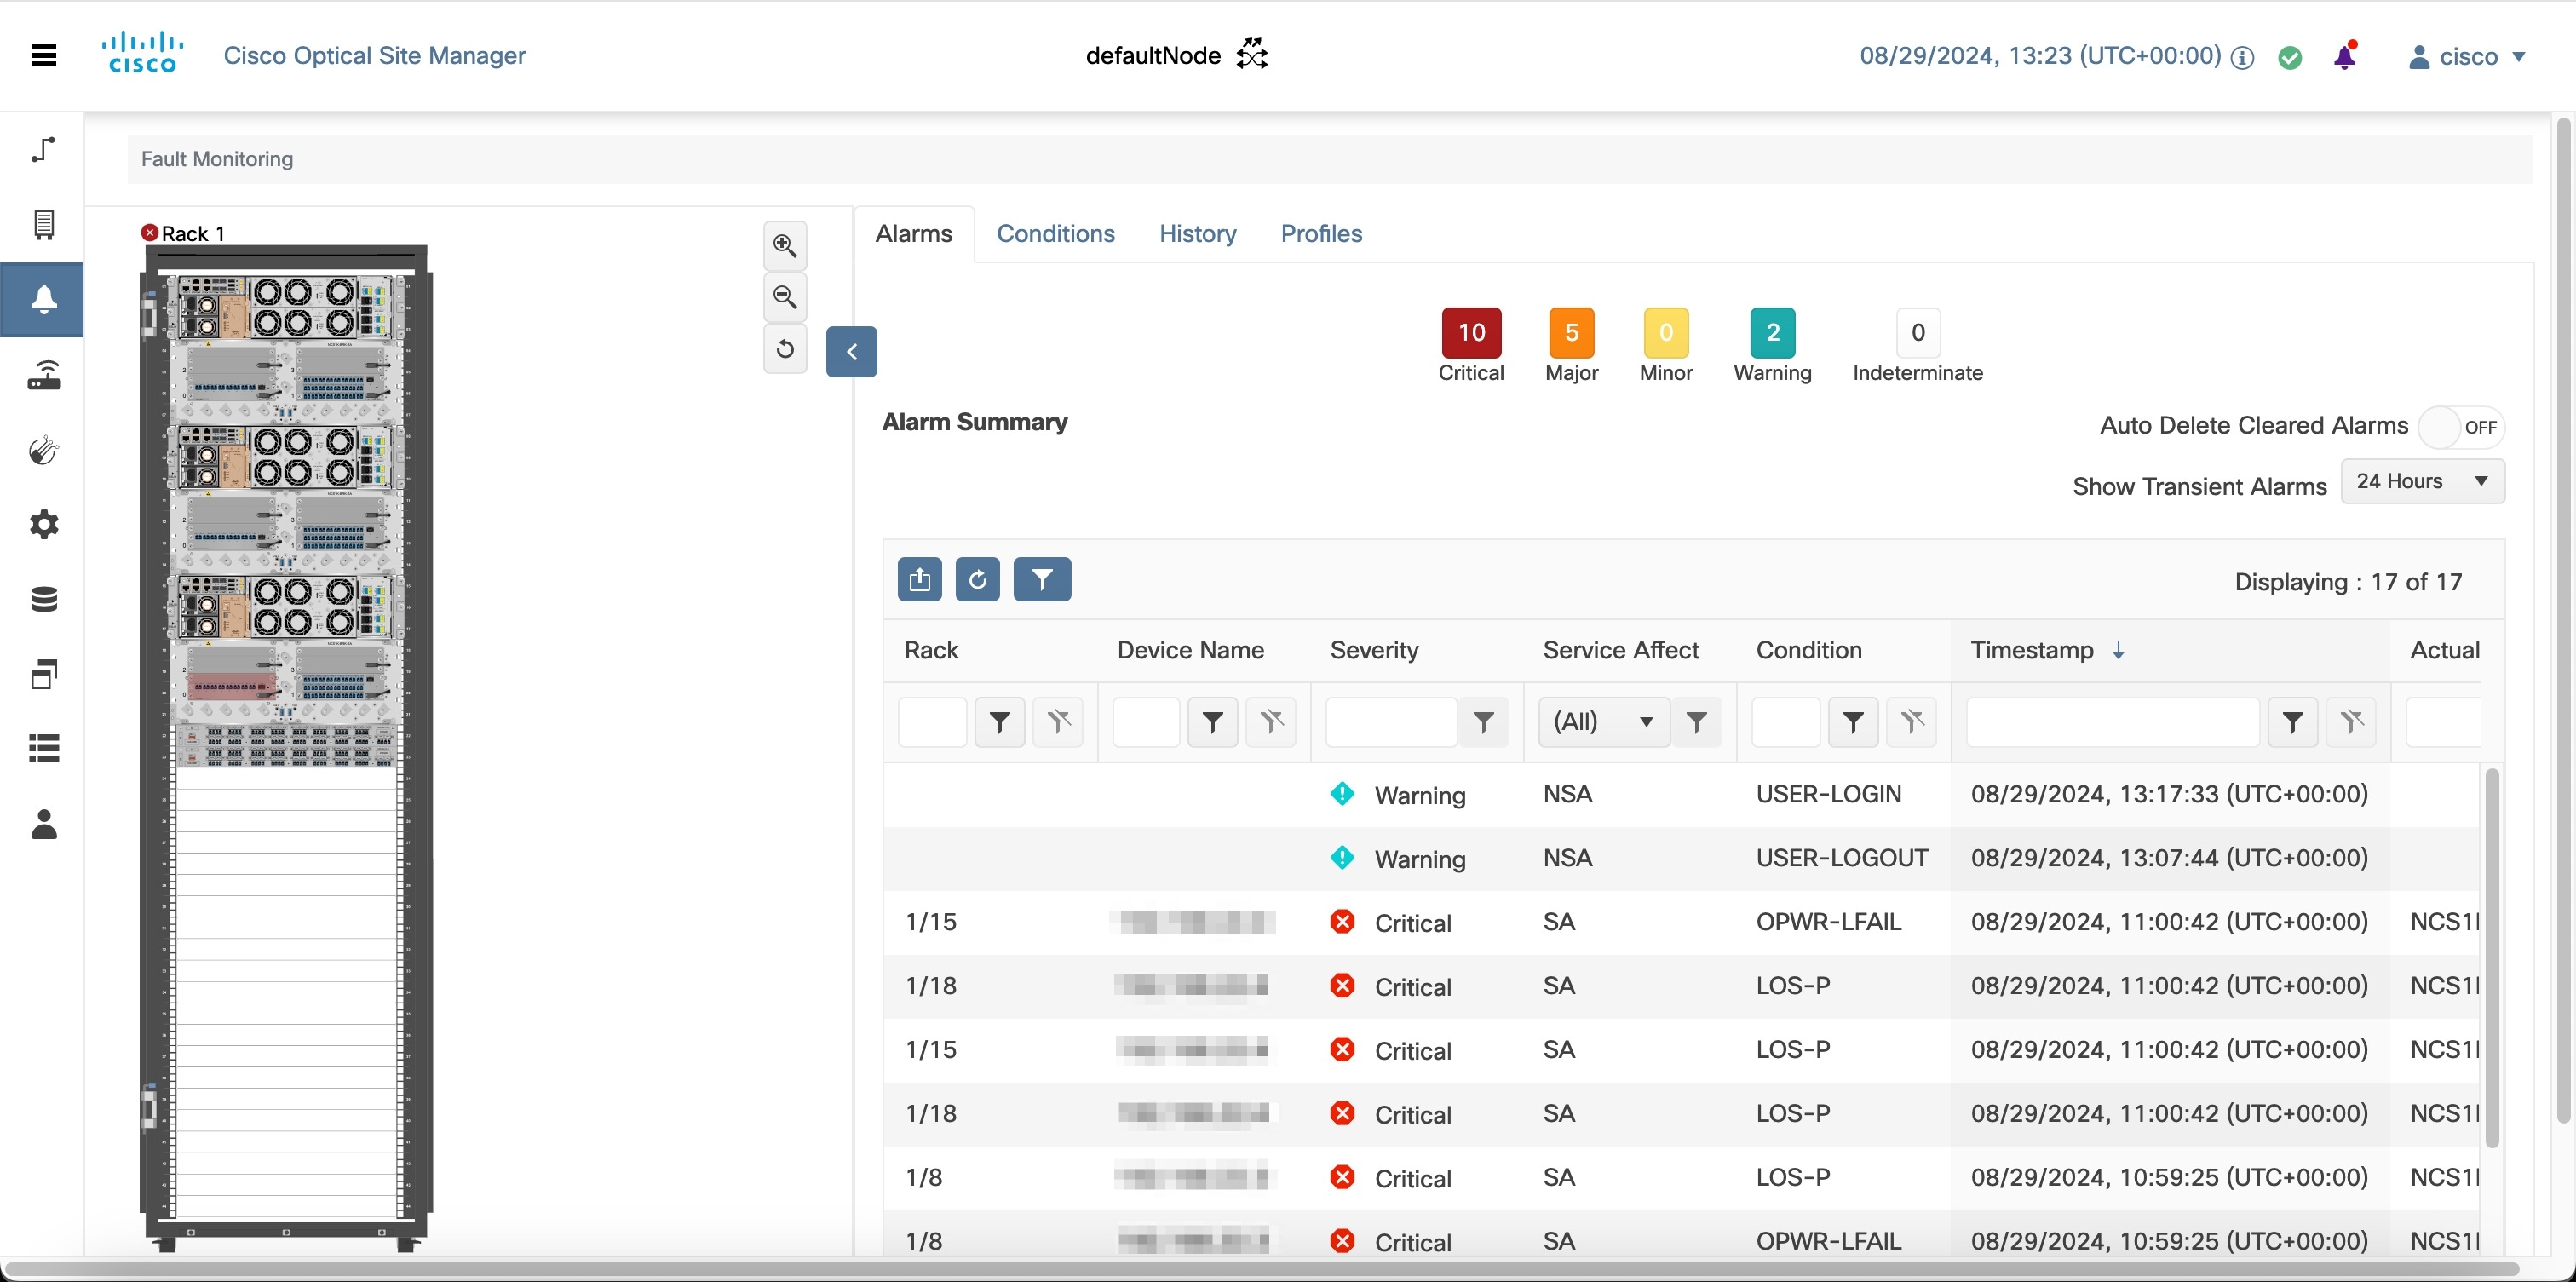
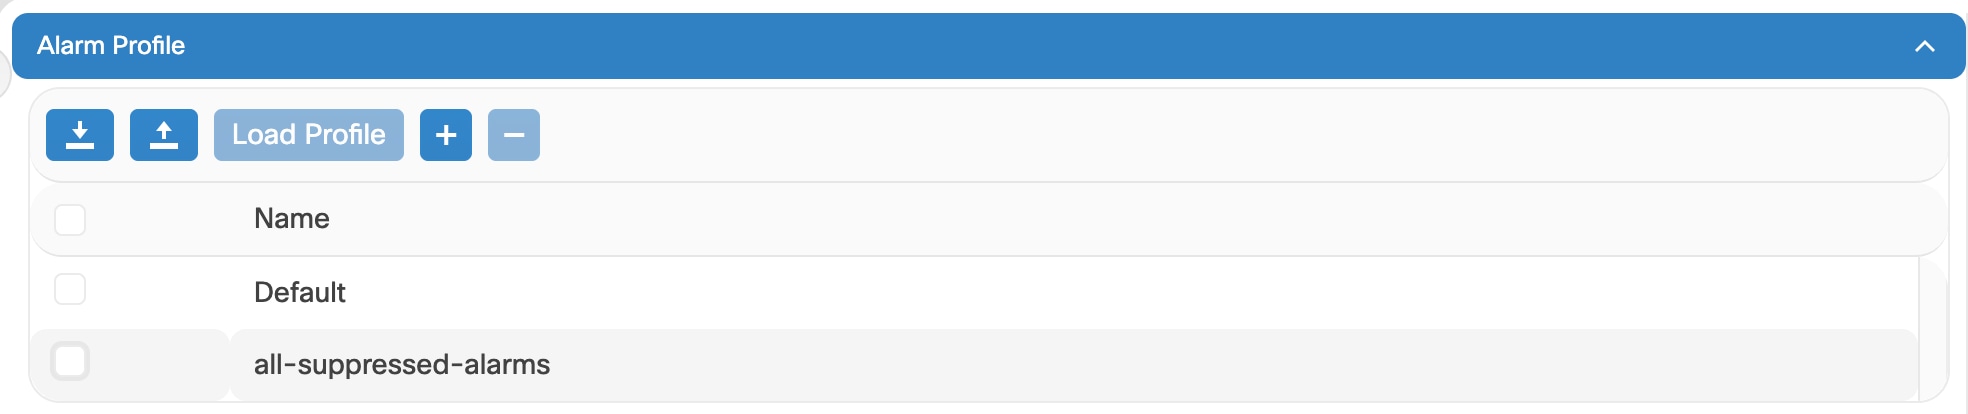
The Fault Monitoring panel displays a summary of all encountered alarms and conditions. It displays the number of Critical (CR), Major (MJ), Minor (MN), Warnings (W), and Non-applicable (NA) alarms. It displays the alarms, transient conditions, and historical alarms that are related to chassis, passive devices, pluggables, line cards, amplifier cards, and control cards. You can also create custom alarm profiles and apply them on the node using this pane.
 Note |
The Cisco Optical Site Manager UI begins capturing XR alarms only after the Cisco Optical Site Manager package is activated. As a result, any alarms generated on the device before this activation are not synchronized with the Cisco Optical Site Manager UI. This leads to a discrepancy where the IOS-XR CLI may show a more complete set of alarms compared to what is available in the Cisco Optical Site Manager UI. |
 Feedback