Get Started With Cisco Prime Infrastructure

This section contains the following topics:

Prime Infrastructure Organization

The Prime Infrastructure web interface is organized into a lifecycle workflow that includes the high-level task areas described in the following table. This document follows the same general organization.


Caution

You are strongly advised not to enable third-party browser extensions. In Internet Explorer, you can disable third-party browser extensions by choosing Tools > Internetoption and unselecting the Enable third-party browser extensions check box in the Advanced tab.


Table 1. Prime Infrastructure Task Areas

Task Area

Description

Used By

Dashboard

Dashboard gives you a quick view of devices, performance information, and various incidents.

Network Operators and Network Engineers

Monitor

Monitor your network on a daily basis and perform other day-to-day or ad hoc operations related to network device inventory and configuration management. The Monitor tab includes dashboards and tools that you need for day-to-day monitoring, troubleshooting, maintenance, and operations.

Network Engineers, Designers, and Architects

Configuration

Design feature or device patterns, or templates. You create reusable design patterns, such as configuration templates, in the Design area. You may use predefined templates or create your own. Patterns and templates are used in the deployment phase of the lifecycle. You can also design Plug and Play profiles and mobility services.

Network Engineers, Designers, and Architects

Inventory

Perform all device management operations such as adding devices, running discovery, managing software images, configuring device archives, and auditing configuration changes on devices.

Network Engineers, NOC Operators and Service Operators

Maps

View network topology and wireless maps.

Network Engineers, NOC Operators, and Service Operators

Services

Access mobility services, Application Visibility and Control services, and IWAN features.

Network Engineers, NOC Operators and Service Operators

Report

Create reports, view saved report templates, and run scheduled reports.

Network Engineers, NOC Operators, and Service Operators

Administration

Specify system configuration settings and data collection settings, and manage access control. You can view and approve jobs, specify health rules, and manage licenses. You can also perform software updates and configure high availability.

Network Engineers

Setup Tasks to Complete Before Using

Before you can use the features, these tasks should be completed by an administrator:

Table 2. Setup Tasks and References

Tasks to complete before using

For information, see:

Set up and configure the server.

Add devices to and create device groups to simplify device and network management.

Enable monitoring for interfaces and technologies used by the network.

Customize alarm and event behavior for your deployment (for example, alarm and event refresh rates and e-mail and trap receivers).

Set Alarm and Event Management Preferences

Log In and Out

To log into the GUI, enter the following in your web browser address field, where server-ip is the IP address of the server:

https:// server-ip

Depending on your network configuration, the first time your browser connects to the web server, you may have to update your client browser to trust the server’s security certificate. This ensures the security of the connection between your client and the web server.

To log out, click at the top right of the window and choose Log Out .

For information on users and the actions they can perform, see:

  • How to Transition Between the CLI User Interfaces in—Describes all classes of users supported by , including the various CLI user accounts.

  • Types of User Groups—Describes the user group mechanism which allows you to control the functions that everyday web GUI users can perform. What you can see and do in the user interface is controlled by your user account privileges. This topic also describes the virtual domain mechanism, which manages Role-Based Access Control (RBAC) for devices.

Change Your Password

You can change your password at any time by clicking at the top right of the window and choosing Change Password . Click the ? (help) icon to review the password policy.

(Optional) Click the Generate New Password button to set a secured system-generated password. On clicking this button, a new password will be displayed in the adjacent text box. The same is also displayed in the New Password and Confirm Password text boxes. Click the eye icon in the text box to view or hide the password. You can also copy the password to clipboard by clicking the Copy button.

Click the Reset button to clear the values in the text box.

Use the Main Window Controls

The top left of the title bar provides the following controls.

Menu button—Toggles the main navigation menu on the left (also called the left sidebar menu)

Home button—Returns you to the home page (normally the Overview Dashboard)

The right side of the title bar displays your user name and the virtual domain you are working in. A virtual domain is a logical grouping of devices. Virtual domains are used to control who has access to devices and areas of the network. To switch between virtual domains that are assigned to you, see Work In a Different Virtual Domain.

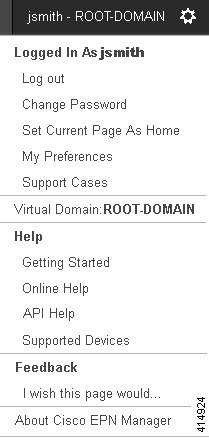
Web GUI global settings button—Log out, change password, view your Cisco.com account profile, adjust your GUI preferences, check a Cisco.com support case, launch online help

When you click on the right side of the title bar, the window settings menu opens.
Figure 1. Window Settings

Finally, the Alarm Summary gives you a visual indicator of number of alarms in your network. The color indicates the highest severity alarm.

Alarm Summary—Provides a visual count of alarms in the categories you specify. Clicking this area opens the Alarm Summary popup window.

Change Your Default Home Page

You can specify which page you want to display when you perform either of the following tasks:

  • You click from the left side of the web GUI title bar.

  • You log in to the web GUI.

This setting is saved on a per-user basis. You can change it at any time without affecting other users.

Procedure


Step 1

While you have the page you want displayed, click at the top right of the web GUI.

Step 2

Choose Set Current Page as Home.


Set Up and Use the Dashboards

Dashboards provide at-a-glance views of the most important data in your network. They provide status as well as alerts, monitoring, performance, and reporting information. You can customize these dashboards so they contain only the information that is important to you. It may be helpful to set the Network Summary dashboard as your default home page. By doing so, this dashboard is displayed after you log in and you can quickly check overall network health before you do anything else. To set any dashboard as your default home page, see Change Your Default Home Page.

Use the following dashboards to monitor and manage your network:

  • Network Summary dashboard—To check the health of the entire network. .

Users with administrator privileges can also use the following dashboards:

Note the following:

How to Use the Dashboards

The following figure illustrates the key parts of a dashboard window and the controls you can use to adjust them.

Table 3. Dashboard Elements

1

Dashboard filters—Filters all dashlets in the dashboard according to the selection. In this example, a time-based filter is used. The filters displayed depend on the dashboard type. For example, in the performance dashboards, you must select a specific interface, device, circuit, or VC.

2

Metric dashlets—Provides quick metrics for alarms, available devices, and so forth.

3

Dashboard settings and controls:

  • Dashboard icons—Allows you to launch online help, refresh the entire dashboard, and open the Dock window.

  • Dashboard Settings menu—Allows you to add or rename a dashboard tab, add new dashlets (both standard and metric), adjust the dashboard's layout, reset all dashboards to their default settings, and export data from the selected dashlets.

    Note 

    The newly added or a renamed dashboard tab can be viewed only in the Tab view.This change is not reflected in the Dashboard menu.

4

Standard dashlets—Provides at-a-glance data that is relevant to the dashboard.

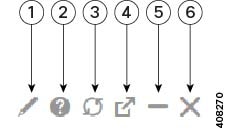
In the top right corner of each dashlet are icons that are activated when you use that dashlet. The dashlet type determines the icons that are available. The most common icons are displayed in the following figure:

See these topics for additional information on dashboards:

Customize the Dock Window

Use the Dock window for quick navigation to frequently used web GUI pages and pop-up windows (such as the 360 view for a particular device). From here, you can also access links to the 15 most recently visited pages and training materials. To open this window, click the Dock icon (located in the top right area of the page).

Complete the following procedure to update the links provided in the Dock window:

Procedure

Step 1

Add a web GUI page link to the Favorites tab (Dock icon > Links Visited > Favorites):

  1. Open the web GUI page you want to add.

  2. Click its star (Favorite) icon, which is located in the top left area of the page.

Step 2

Add a pop-up window link to the Docked Items area (Dock icon > Docked Items):

  1. Open the pop-up window you want to add, then open its 360 view.

  2. From the top right corner of the pop-up window, click the Add to Dock icon.


Types of Dashboards

Check the Health of the Entire Network Using the Network Summary Dashboard

The Network Summary dashboard alerts you to the most important network issues. It provides alarm, status, and usage information for all devices and interfaces in the network, including wireless devices like controllers and APs. You can also display a small network topology dashlet on this dashboard.

To understand the types of information provided by the Metrics dashlets at the top of the dashboard, hover your mouse cursor over a Metrics dashlet and when the popup help button (? ) appears, click it to open the dashlet help. For descriptions of the other dashlets on the page, click the popup help button shown with the dashlet controls in the upper right corner of each dashlet.

To open and customize the Network Summary dashboard:

Procedure

Step 1

Choose Dashboard > Network Summary, then click:

  • The Overview tab to check all devices.

    Note 

    Users will now be able to view the description of ports by hovering over the interface names for the Top N Interface Utilization and Top N WAN Interfaces by Utilization interface dashlets.

  • The Incidents tab to focus on alarms and events, including syslogs.

  • The Site Summary tab to check all devices at particular sites.

  • The Network Health tab to check network health against a set of health rules.

Step 2

Adjust the dashboard as needed. You can drag dashlets to different locations on the dashboard, or use the Settings menu to add new dashlets, change the dashboard style, and so forth. If you want to add dashlets to the dashboard, see Add a Predefined Dashlet To a Dashboard.

Step 3

Select the time frame you want to view from the Filters Time Frame drop-down list, then click Apply. Selected time frame will be updated in all dashlets.


Check the Health of All Devices or All Interfaces Using the Overview Dashboard

The Overview dashboard helps you maintain the health of your network by providing summarized and aggregated data on the health of all network devices, interfaces, clients, and application services, including their availability, status, utilization, and the alarms and events affecting them.

To understand the types of information provided by the Metrics dashlets at the top of the dashboard, hover your mouse cursor over a Metrics dashlet and when the popup help button (? ) appears, click it to open the dashlet help. For descriptions of the other dashlets on the page, click the popup help button shown with the dashlet controls in the upper right corner of each dashlet.

To open and customize the Overview dashboard:

Procedure

Step 1

Choose Dashboard > Overview, then click:

  • The General tab to check on the health of all devices and interfaces, including coverage areas, which devices are reachable, and top users of CPU and memory.

  • The Incidents tab to focus on alarms and events, including sites with the most alarms, device reachability, types of alarms, and syslog details.

  • The Client tab to focus on the health of network clients. This tab hosts a variety of client-oriented dashlets, including a troubleshooting tool, distribution and speed graphs for wired and wireless clients, and client posture.

  • The Network Devices tab to check device availability, CPU and memory use, and temperature issues.

  • The Network Interfaces tab to check interface availability, status, CPU and memory use, and interfaces with the most errors and discards.

  • The Service Assurance tab to check on identified network services and the applications, servers, and Netflow-monitored resources that support them, as well as the clients consuming them.

Note 

Users will now be able to view the description of ports by hovering over the interface names for the Top N Interface Utilization, Top N WAN Interfaces by Utilization, and Top N Interface Errors and Discards interface dashlets.

Step 2

Adjust the dashboard as needed. You can drag dashlets to different locations on the dashboard, or use the Settings menu to add new dashlets, change the dashboard style, and so forth. If you want to add dashlets, see Add a Predefined Dashlet To a Dashboard.

Step 3

Select the time frame you want to view from the Filters Time Frame drop-down list, then click Apply.


Check the Health of Wireless Networks Using the Wireless Dashboard

The Wireless dashboard helps you maintain the health of your wireless network by providing aggregated data on network security status and attacks, mesh network efficiency, air quality, interferers, and so on.

To understand the types of information provided by the Metrics dashlets at the top of the dashboard, hover your mouse cursor over a Metrics dashlet and when the popup help button (? ) appears, click it to open the dashlet help. For descriptions of the other dashlets on the page, click the popup help button shown with the dashlet controls in the upper right corner of each dashlet.

To open and customize the Wireless dashboard:

Procedure

Step 1

Choose Dashboard > Wireless, then click:

  • The Security tab to check on top security issues, detected rogues of all types, CleanAir security, and rogue containment, and Cisco Adaptive Wireless Intrusion Prevention (wIPS) data.

  • The Mesh tab to focus on mesh network alarms, and links with the worst SNR, number of node hops and packet errors.

  • The CleanAir tab to focus on non-802.11 interference sources, including the total count of and worst interferers, CAS interferer notifications, and general air quality.

  • The ContextAware tab to focus on Cisco Context-Aware Mobility data supported by Mobility Service Engines, including MSE tracking counts, location-assisted client troubleshooting, and detected rogue elements.

Step 2

Adjust the dashboard as needed. You can drag dashlets to different locations on the dashboard, or use the Settings menu to add new dashlets, change the dashboard style, and so forth. If you want to add dashlets, see Add a Predefined Dashlet To a Dashboard.

Step 3

Select the time frame you want to view from the Filters Time Frame drop-down list, then click Apply.


Procedure

Step 1

Adjust the dashboard as needed. You can drag dashlets to different locations on the dashboard, or use the Settings menu to add new dashlets, change the dashboard style, and so forth. If you want to add dashlets, see Add Dashlets to Dashboards.

Step 2

Select the time frame you want to view from the Filters Time Frame drop-down list, then click Go.


Add Dashlets to Dashboards

  • Prepackaged dashlets that are provided with —Some of the dashlets are displayed on dashboards by default; others are listed in the Settings menu, and you can add them as needed. These dashlets provide information you will likely monitor (for example, device CPU utilization, interface errors and discards, and traffic statistics). See Add a Predefined Dashlet To a Dashboard.

  • Customized dashlets that you create to monitor device performance—These dashlet types can only be added to the Device Trends dashboard. See Add a Customized Dashlet to the Device Trends Dashboard.

Add a Predefined Dashlet To a Dashboard

provides a predefined set of dashlets that will provide you with commonly-sought network data. By default, a subset of these dashlets is already included in the dashboards, to help you get started. Complete the following procedure to add another of these predefined dashlets to your dashboards.


Note

To edit or remove a dashlet, click the appropriate icon from the top right corner of that dashlet. (See How to Use the Dashboards.)


Procedure

Step 1

From the sidebar menu, choose Dashboard, then select the dashboard you want to add a dashlet to.

For example, to add a Device Memory Utilization dashlet to the Device Trends dashboard, choose Dashboard > Device Trends > Device.

Step 2

Identify the dashlet you want to add, then add it:

  1. From the top right corner of the dashboard, click Settings and then click Add Dashlet(s). lists the dashlets that can be added to that dashboard.

  2. To open a pop-up window that provides an overview of a particular dashlet, hover your cursor over dashlet's name. The pop-up window also lists the sources for the data the dashlet provides and the filters you can apply to the dashlet, as shown in the following illustration.

  3. Click Add to add the selected dashlet to the dashboard.

Step 3

Verify that the dashlet is populated with data.

If it is not, check whether the required monitoring policy is enabled. (Only the Device Health monitoring policy is enabled by default. It checks device availability, CPU and memory pool utilization, and environmental temperature.)

  1. From the top right corner of the dashlet, click its ? (Help) icon to open the dashlet's pop-up window.

  2. Check the information provided in the Data Sources area. If it lists a monitoring policy, check whether the policy is activated. See Check What Is Monitoring.


Add a Customized Dashlet to the Device Trends Dashboard

If none of the dashlets in the Device Trends dashboard provide the device performance information you need, you can add a dashlet that uses a customized template to poll devices for their SNMP MIB attributes. Complete the following procedure to add this dashlet to the dashboard.

Before you begin

Check the available monitoring policies to determine which policy collects the information you need. You will have to specify a policy during the dashlet creation process. If none of the policies meet your needs, you can create a policy that polls new parameters. See Create a Monitoring Policy for Unsupported Parameters and Third-Party Devices.

Procedure

Step 1

Choose Dashboard > Device Trends > Device.

Step 2

From the top right corner of the dashboard, click Settings and then click Add Dashlet(s).

Step 3

Expand the Device Dashlets list.

Step 4

Locate Generic Dashlet, then click Add .

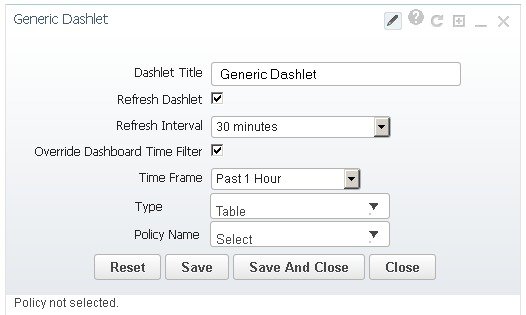
adds a blank generic dashlet to the Device Trends dashboard.
Step 5

Configure the new dashlet as needed.

At a minimum, you should:
  • Enter a meaningful title in the Dashlet Title field.

  • Check the Override Dashboard Time Filter check box if you do not want to apply the time filters to all of the dashlets in the dashboard.

  • In the Type drop-down list, choose whether the dashlet will display its data as a table or line chart. (Regardless of your choice, will display a toggle at the bottom of the dashlet that allows you to change the format.)

  • In the Policy Name drop-down list, choose the monitoring policy that will collect the data for this dashlet.

Step 6

Click Save And Close.


Add a New Dashboard

Use this procedure to create a new dashboard. Your new dashboard will appear as a new tab under one of the dashboards listed in Types of Dashboards.

Procedure


Step 1

Open the relevant existing dashboard.

For example, if you want to create a new tab under the Performance dashboard, click any tab under Dashboard > Performance.

Step 2

Click the + (Add New Dashboard) tab.

The Settings menu opens.

Step 3

Enter a name for the new dashboard, then click Apply .

Step 4

Click the new dashboard tab, then add dashlets as described in Add a Predefined Dashlet To a Dashboard.


Troubleshoot Network Health Using Dashboards

Prime Infrastructure provides a quick way to view the health of your network and sites by choosing Dashboard > Network Summary > Nework Health. You must create location groups and then add devices to the locations. Prime Infrastructure displays a map indicating the overall health of all the sites. The Network Health page allows you to toggle the view between wired and wireless devices. By default, all locations and a maximum of 500 APs per location group are displayed. If you choose Wired view, the Network Health page shows the WAN Inteface Utilizatoin details and a map indicating the overall health status of the wired devices of all the locations. If you choose Wireless view, the Network Health page shows the Wireless Client Count details and a map indicating the overall health status of the wireless devices of all the sites. In the Wireless view, click the Executive View expand icon to choose any one of the client, access points, environment (clean air), and application dashboards. The Network Health page displays the dashlets corresponding to the selected dashoard. You can click the settings icon to add more dashlets. Click more to cross launch the Dashboard.

Define Health Rules

You can specify rules and threshold values for your sites. The rules you specify determine the notifications that appear in Dashboard > Network Summary > Network Health.

Procedure


Step 1

Choose Services > Application Visibility & Control > Health Rule. There are 3 tabs where you can specify health rules:

  • Service Health—Define health rules for services such as Jitter, MOS score, Network Time, Packet Loss, Traffic Rate, etc.
  • Infrastructure Health—Define health rules for wired devices.
  • Wireless Health—Define health rules for wireless devices.
Note 
The default critical and warning threshold set for client count is 40 and 36 respectively. The maximum critical threshold for client count can be set as 1000.
Step 2

To add a new health rule, click the plus icon, then specify the location, metric, and threshold. You can add new Infrastructure Health and Wireless Health rules only.

Step 3

To edit an existing health rule, select the health rule you want to modify, then click Edit.

Step 4

Enter the details for the health rule, then click Save.

The values you enter apply to all devices and interfaces in the location group for which the health rule applies.


Define QoS and Interface Settings

The Health Rule page allows you the define the QoS and Interface settings for the heatmap displayed in the Network Health page.

Procedure


Step 1

Choose Services > Application Visibility & Control > Health Rule.

Alternately, click the Launch Health Rules link in the Network Health page.

Step 2

Click the Infrastructure Health tab.

Step 3

Check the QoS Settings check boxes which you want to exclude from the heatmap. By default, the Exclude Scavenger check box will be checked and not shown in the heatmap.

Step 4

Uncheck the Exclude Admin Down Interface if you want to include the Admin down interfaces in the heatmap. By default, the Exclude Admin Down Interface will be checked and not shown in the heatmap.

Step 5

Click Save.

The QoS and Interface settings will get immediately applied to the heatmap in the Network Health page. The corresponding health rule job will get updated after 30 minutes.

Network Health Map Features

When you choose Dashboard > Network Summary > Network Health, the map displays all the location groups with geographic attributes that you previously added. By default, a maximum of 500 APs per location group are displayed.

The location groups are colored according to the overall health of the location:

  • Red—indicates there are critical issues in the specified location.
  • Yellow—indicates there are warnings in the specified location.
  • Green—indicates there are no errors or warnings.
  • Gray—indicates there are no devices or data in the specified location.

In addition to the color indicating the health, the icon can be:

  • Solid—indicates a parent site, meaning there are children locations associated with the site.
  • Outlined—indicates there are no children associated with this location.

Hover your mouse over any location on the map to view a popup window that lists the sites in that location and the corresponding errors or warnings, by device type, in each location.

Click on a site name to view in a zoomed-in map of the site.

Network Health Display Options

When you choose Dashboard > Network Summary > Network Health, display options appear on the right side of the page as show in the below figure.


Table 4. Network Health Display

1

Filter options. The options you select affect what is displayed in the map and the Health Summary pane. Click Clear > Selection to remove all filters.

2

Time frame. By default, information from the last 6 hours is displayed in the Site Visibility map and Health Summary pane.

3

Displays the map in the left pane.

4

Displays the Network Health summary details in the Health Index view.

5

Displays the Network Health summary details in a table format.

6

Shows or hides the Health Summary pane on the right.

Network Health Summary

The Health Summary pane displays errors and threshold violations for all devices across all locations. Prime Infrastructure aggregates health data from the devices and services to the site summary every 15 minutes. Click on any of the sites or devices listed in the Health Summary pane to view more information. For example, click on the site(s) listed under Service Health Issues. A new pane opens listing the sites with service health issues where you can easily see in which area(s) the errors or warnings are occurring.

: Displays the areas in which service health related errors or warnings are occurring.

Click on a site name to have the map zoom in on that particular site and display additional information specific to that site. You can edit the health rule settings of a site by clicking the settings icon next to the site name. The modified health rule settings will get automatically updated in the Health Rules page. If a site doesn't have assinged health rules, then the health rules displayed for that site represent the health rules of its parent site.

QoS Metrics

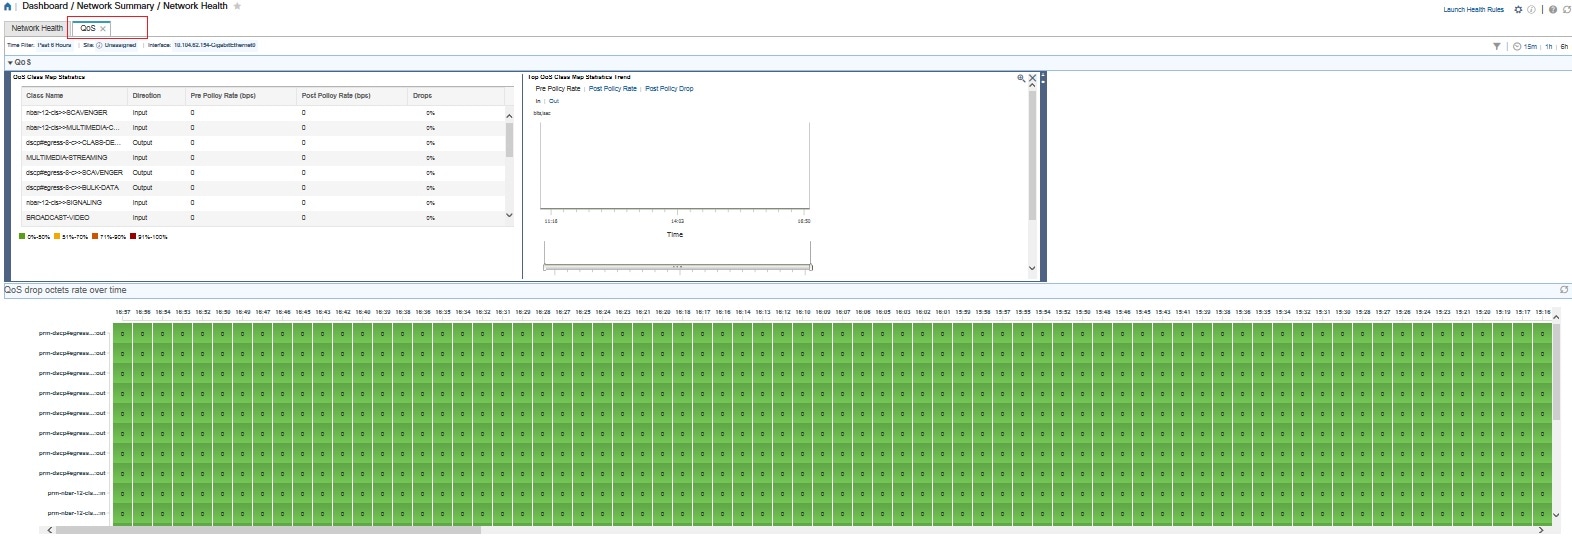
The Network Health page shows the QoS metrics for routers and switches. You can launch the QoS tab for routers, switches and interfaces in the Network Health page by clicking the QoS hyperlink in the heatmap, the Health summary view, Health index view, and Table view. The heatmap for routers and switches, shows the aggregated QoS data per interface level and the average of dropOctetsRate across all QoS classes and all directions for each interface.

Click the QoS tab in the Network Health page to view more granular data per class map for the chosen interface. The QoS tab shows the following details:

  • QoS class Map Statistics

  • Top QoS class Map statistics Trend

  • QoS drop Octets rate over time

The QoS tab shows more granular and is shown per class map for a given interface.

Traffic Conversation

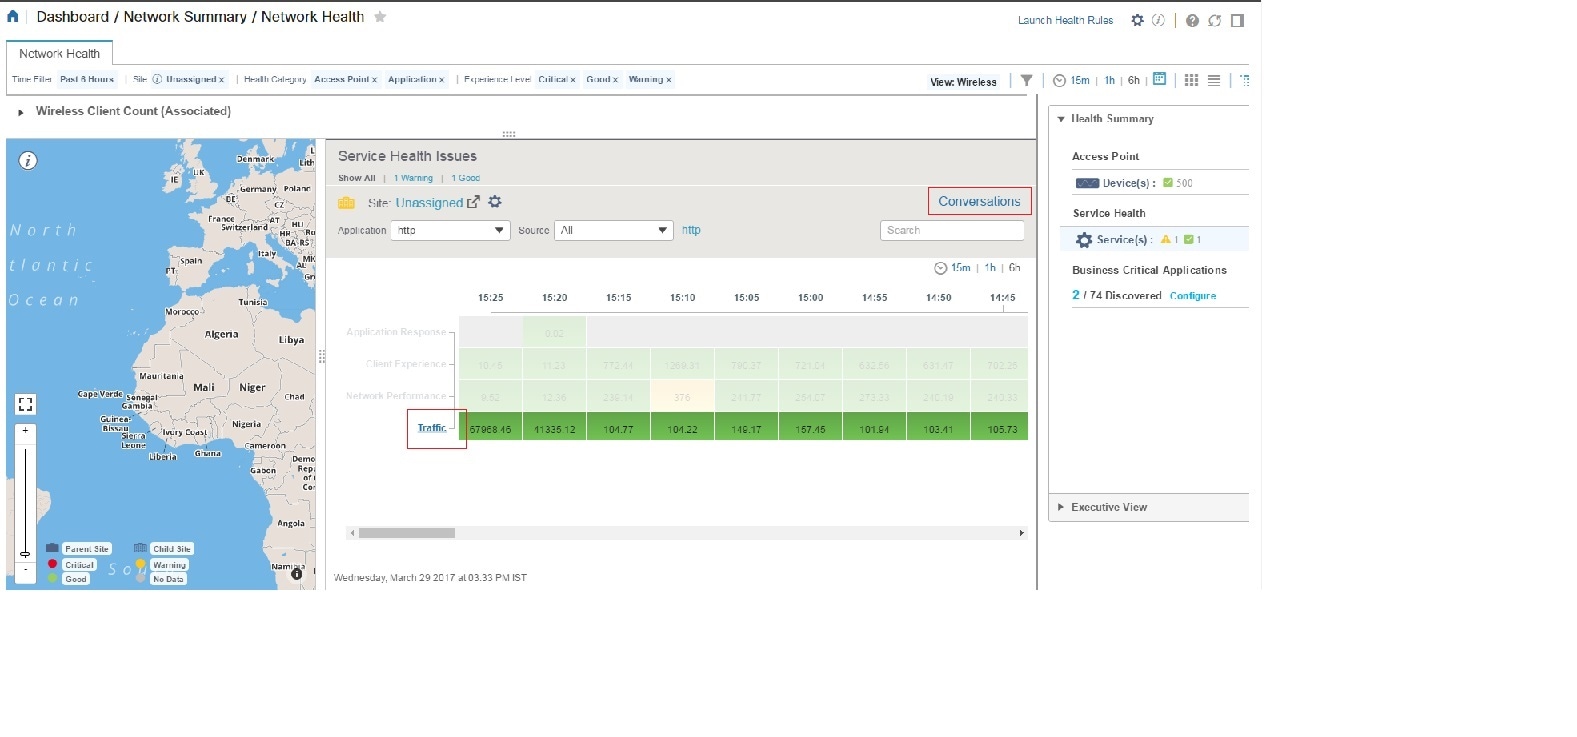
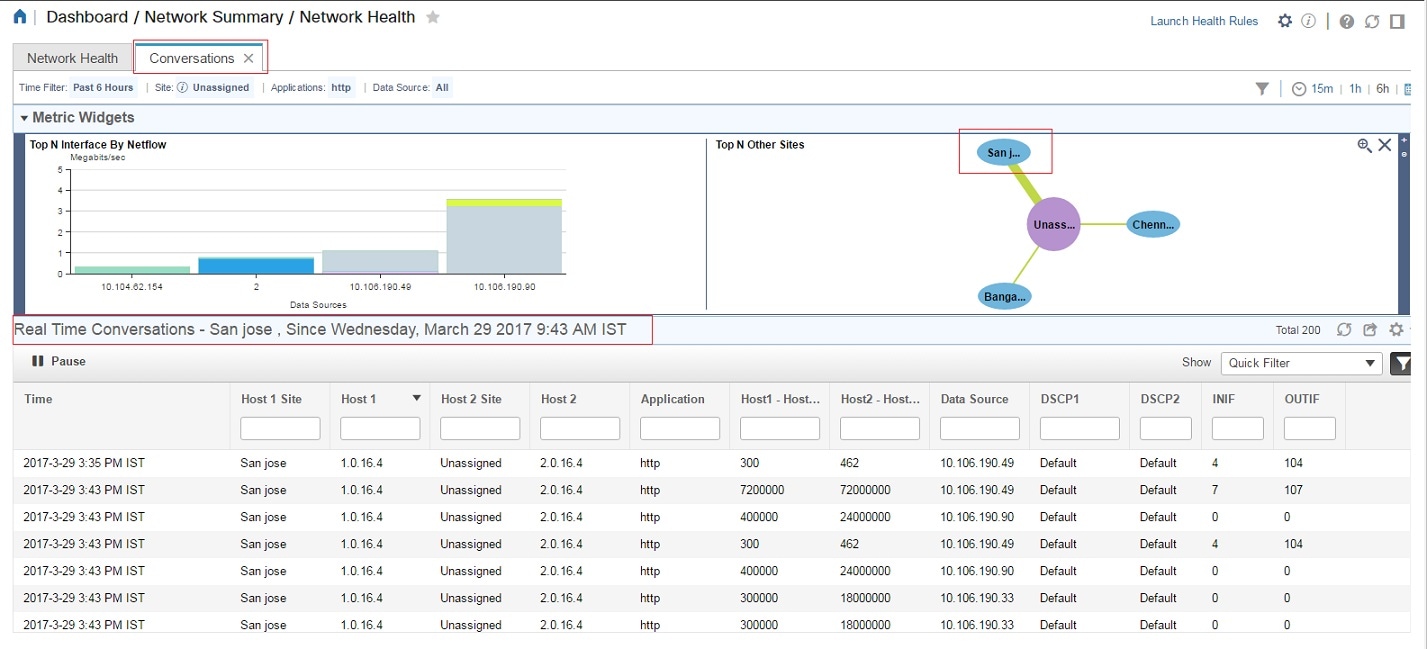
You can launch the Conversation tab in the Network Health page by clicking the traffic hyperlink in the heatmap or the Conversations hyperlink as shows in the below image.

The conversation tab shows the following details:

  • Top N Interface By Netflow chart
  • Top N Other Sites graph
  • Real Time Conversation table

The Real Time Conversation table shows the conversations based on the global filters (Site, Application Data Source, and Time filter). If you want to view the real time conversations of a particular site or an interface, click the site in the Top N Other Sites graph or the interface in the Top N Interface By Netflow chart. You can view up to 4000 records in the Real Time Conversation table and the records get automatically refreshed every minute.

Work In a Different Virtual Domain

Virtual domains are logical groupings of devices and are used to control your access to specific sites and devices. Virtual domains can be based on physical sites, device types, user communities, or any other designation the administer chooses. All devices belong to ROOT-DOMAIN, which is the parent domain for all new virtual domains. For more information about virtual domains, see .

If you are allowed access to more than one virtual domain, you can switch to a different domain by completing the following procedure:

Procedure


Step 1

Click from the right side of the title bar.

Step 2

Choose Virtual Domain: current-domain .

Step 3

From the Virtual Domain drop-down list, choose a different domain.

immediately changes your working domain.


Manage Jobs Using the Jobs Dashboard

If you have the appropriate user account privileges, you can manage jobs using the Jobs dashboard. To view the Jobs dashboard, choose Administration > Dashboards > Job Dashboard. From here, you can quickly see if a job was successful, partially successful, or failed.

If too many jobs are already running, will hold other jobs in the queue until resources are available. If this delays a scheduled job past its normal starting time, the job will not run. You will have to run it manually.

Some jobs may require approval. If this is the case, sends an email to users with Administrator privileges notifying them that a job was scheduled and needs approval. The job will only run after it is approved.

The following table describes the buttons displayed in the Jobs dashboard.

Table 5. Jobs Dashboard Buttons

Button

Description

Delete Job

Removes a job from the Jobs dashboard.

Edit Job

Edit the settings configured for the selected job.

Edit Schedule

Displays the series schedule and lets you edit it (start time, interval, and end time).

Note 

Editing the schedule of an already-scheduled job will change the status of that job to Pending for Approval since each edit requires an approval from the user who created the job.

Run

Runs a new instance of the selected job. Use this to rerun partially successful or failed jobs; the job will only run for the failed or partially successful components.

Abort

Stops a currently-running job, but allows you to rerun it later. Not all jobs can be aborted; will indicate when this is the case.

Cancel Series

Stops a currently-running job and does not allow anyone to rerun it. If the job is part of a series, future runs are not affected.

Pause Series

Pauses a scheduled job series. When a series is paused, you cannot run any instances of that series (using Run).

Resume Series

Resumes a scheduled job series that has been paused.


Note

The Delete Job, Abort, and Cancel Series buttons are not available for system and poller jobs.


To view the details of a job, follow these steps:

Procedure


Step 1

Choose Administration > Dashboards > Job Dashboard.

Step 2

From the Jobs pane, choose a job series to get basic information (such as job type, status, job duration, and next start time).

Step 3

To view the job interval, click a job instance hyperlink.

At the top of the job page, the Recurrence field indicates how often the job recurs. Job interval details will be added for every jobs that triggers.

Step 4

To get details about a failed or partially successful job, click the job instance hyperlink and expand the entries provided on the resulting page.

This is especially helpful for inventory-related jobs. For example, if a user imported devices using a CSV file (a bulk import), the job will be listed in the Jobs sidebar menu under User Jobs > Device Bulk Import. The job details will list the devices that were successfully added and the devices that were not.


Example

To troubleshoot a failed software image import job:

  1. Choose User Jobs > Software Image Import from the Jobs sidebar menu.

  2. Locate the failed job in the table and then click its hyperlink.

  3. Expand the job's details (if not already expanded) to view the list of devices associated with the job and the status of the image import for each device.

  4. To view the import details for a specific device, click that device's i (information) icon in the Status column. This opens an Image Management Job Results pop-up window.

  5. Examine each step and its status. For example, the Collecting image with Protocol: SFTP column might report that SFTP is not supported on the device.

Extend Functions

Advanced users can extend functions and manage administrative options using the REST API.

To get information about this tool, click at the top right of the web GUI, and then choose Help > REST APIs. You can also download the Cisco Prime Infrastructure API Reference Guide directly from Cisco.com.

Check Cisco.com for the Latest Documentation

Refer to for information about and links to all of the documentation that is provided with .


Note

We sometimes update the documentation after original publication. Therefore, you should also review the documentation on Cisco.com for any updates.