Monitor Network Clients and Users

What is a Network Wired/Wireless Client

A client is a device that is connected to an access point or a switch. supports both wired and wireless clients. After you add controllers and switches to , the client discovery process starts. Wireless clients are discovered from managed controllers or autonomous access points. The controllers are polled during regular client status poll. The wireless client count includes autonomous clients as well. In the case of switches, polls for clients immediately after the device is added and updates the device information in the database. For wired clients, the client status polling to discover client associations occurs every two hours (by default). A complete polling happens twice every day to poll complete information of all wired clients connected to all switches.

uses background tasks to perform the data polling operations. There are three tasks associated with clients:

  1. Autonomous AP Client Status
  2. Lightweight Client Status
  3. Wired Client Status

You can refresh the data collection tasks (such as polling interval) from the Administration > Settings > Background Tasks page. See Managing Data Collection and Retention

Client status (applicable only for wired clients) is noted as connected, disconnected, or unknown:

  • Connected clients—Clients that are active and connected to a wired switch.
  • Disconnected clients—Clients that are disconnected from the wired switch.
  • Unknown clients—Clients that are marked as unknown when the SNMP connection to the wired switch is lost.

For the clients of autonomous access point managed by and for the clients authenticated using Local Extensible Authentication Protocol (LEAP), the username is not registered and is displayed as unknown.

supports both identity and non-identity wired clients. The support for wired clients is based on the identity service. The identity service provides secure network access to users and devices and it also enables the network administrators to provision services and resources to the users based on their job functions.

do not poll end hosts connected through VLAN 1000-1024.

does not support VRF. Therefore, if a client is connected to a VRF-configured device, you cannot view client information.


Note

If Prime Infrastructure is unable to retrieve information about wired devices with SNMPv3, apply SNMPv2.


Monitor Network Users and Clients Using Client Summary Dashboard

You can monitor the network users and clients using the Client Summary Dashboard.

Client Summary Dashboard

The Client dashboard (Dashboard > Overview > Client Summary) page displays the client-related dashlets. These dashlets enable you to monitor the clients on the network. The data for graphs is also polled/updated periodically and stored in database. On the other hand, most of the information in the Client Details page are polled directly from the controller/switch.

When you log into , the Client Summary dashboard displays a few client-related dashlets.

  • Client Count By Association/Authentication—Displays the total number of clients by Association and authentication in over the selected period of time.

    • Associated client—All clients connected regardless of whether it is authenticated or not.

    • Authenticated client—All clients connected and passed authentication, authorization and other policies, and ready to use the network.

  • Client Distribution—Shows the count of client based on current distribution, such as protocol, EAP type used, and authentication type.

  • Client Count By Wireless/Wired—Displays the total number of wired and wireless clients in over the selected period of time.

  • Client Traffic—Shows traffic for wired and wireless clients over a period of time.

  • Client Posture Status—Shows client count for each postrure status.

How Do I View Network Clients and Users

Choose Monitor > Monitoring Tools > Clients and Users to view all the wired and wireless clients in your network. In addition, you can view the client association history and statistical information. These tools are useful when users complain of network performance as they move throughout a building with their laptop computers. The information might help you assess what areas experience inconsistent coverage and which areas have the potential to drop coverage.

Access the Client Detail page by clicking on a MAC Address to help you identify, diagnose, and resolve client issues.

Filtering Clients and Users

The Monitor > Monitoring Tools > Clients and Users page lists all associated clients by default. There are preset filters that allow you to view a subset of clients.

The WGB, Wired Guest, and Office Extended Access Point 600 (OEAP 600) are tracked as wireless clients. only remembers sorting column which is indexed including MAC Address, IP Address, Username, AP MAC Address and SSID. Sorting on non-indexed column causes serious performance issue when loading the client list page.You can still sort the table by any column. But after you leave this page, will not remember the last used sorting column if it is not indexed.

In addition, you can use the filter icon to filter the records that match the filter rules. If you want to specify a filter rule, chooseAll from the Show drop-down list before you click .

When you select a preset filter and click the filter icon, the filter criteria is dimmed. You can only see the filter criteria but cannot change it. When the All option is selected to view all the entries, clicking the filter icon shows the quick filter options, where you can filter the data using the filterable fields. You can also enter text in the free form text box for table filtering.

You can use the advanced search feature to narrow the client list based on specific categories and filters.

Filtering on IP Addresses

When you perform advanced client filtering on IPv6 addresses, each octet that you specify must be a complete octet. If you specify a partial octet, the filtering might not show correct results.

The following example shows how the advanced client filtering works on IPv6 addresses. This example assumes that you have the following IP addresses in the system: 10.10.40.110.10.40.210.10.40.310.10.240.1Fec0::40:20Fe80::240:20. If you search for all IP addresses containing 40, you get the following result: 10.10.40.110.10.40.210.10.40.3Fec0::40:20. The IP addresses that contain 240 are not filtered because the filtering feature expects you to enter a complete octet.

Viewing Clients and Users

To view complete details in the Monitor > Monitoring Tools > Clients and Users page and to perform operations such as Radio Measurement, users in User Defined groups should have the required permission before they access the Monitor Clients, View Alerts & Events, Configure Controllers, and Client Location pages.

The following attributes are populated only when the ISE is added to :

  • ISE
  • Endpoint Type
  • Posture
  • Authorization Profile Name

queries the ISE for client authentication records for the last 24 hours to populate this data. If the client is connected to the network 24 hours before it is discovered in , you might not see the ISE-related data in the table. You might see the data in client details page. To work around this, reconnect the client to the network. The ISE information is shown in the table after the next client background task run.

To view clients and users, follow these steps:

Procedure


Step 1

Choose Monitor > Monitoring Tools > Clients and Users to view both wired and wireless clients information. The Clients and Users page appears.

The Clients and Users table displays a few columns by default. If you want display the additional columns that are available, click , and then click Columns. The available columns appear. Select the columns that you want to show in the Clients and Users table. When you click anywhere in a row, the row is selected and the client details are shown.

Note 
The user name of the client will not be displayed when the client is roaming and if the selected Protocol is "Mobile".
Step 2

Choose a client or user. The following information appears depending on the selected client/user.

  • Client Attributes
  • Client Statistics
  • Client Statistics.
  • Client Association History
  • Client Event Information
  • Client Location Information
  • Wired Location History
  • Client CCXv5 Information

Export the List of Network Clients and Users to CSV Files

You can quickly export your clients and users list into a CSV file (spreadsheet format with comma-separated values).

The columns that are shown in the Clients and Users table are only exported to the CSV file.

To export the clients and users list, follow these steps:

SUMMARY STEPS

  1. Choose Monitor > Monitoring Tools > Clients and Users.
  2. Click the export icon on the toolbar. A dialog box appears.
  3. In the File Download dialog box, click Save.

DETAILED STEPS


Step 1

Choose Monitor > Monitoring Tools > Clients and Users.

Step 2

Click the export icon on the toolbar. A dialog box appears.

Step 3

In the File Download dialog box, click Save.


Launch the Network Client Troubleshooting Tool

You can launch the Client Troubleshooting tool for any client from the Clients and Users page.

Procedure


Step 1

Choose Monitor > Monitoring Tools > Clients and Users. The Clients and Users page lists all the clients the system knows (including those not currently associated).

Step 2

Click the MAC Address for the client having connection problems that you want to troubleshoot.

You may find it handy to narrow the client list first, by using the Search feature.

Step 3

Click Troubleshoot and Debug.


About the Client Troubleshooting Page

The Client Troubleshooting page provides:

  • Details on the current or last session for a selected wired or wireless client.
  • The client’s current/last connection status, shown as a series of graphic icons.
  • If connection problems are detected:
    • The nature of the connection problem (also indicated by graphic icons).
    • Advice on how to troubleshoot that problems.

Note

If a client is connected to a switch through Port Channel, interprets the MAC Address of the port channel as VLAN or normal port. Hence the Client Troubleshooting page may not display the correct switch information.

By default the client data is fetched from the Prime Infrastructure database. There is an option to refresh from device by clicking the Refresh from Device link in the upper right corner of the page. It also shows the date and time when the data was last refreshed on the Prime Infrastructure. If the Auto Refresh is turned on, then the Refresh from Devices option is disabled.

By default, the Auto Refresh is enabled. The device automatically refreshes every minute to collect the live data. It also shows when the client was discovered. You can disable this by clicking the Auto Refresh button in the upper right corner of the page.

The Client Troubleshooting page provides:

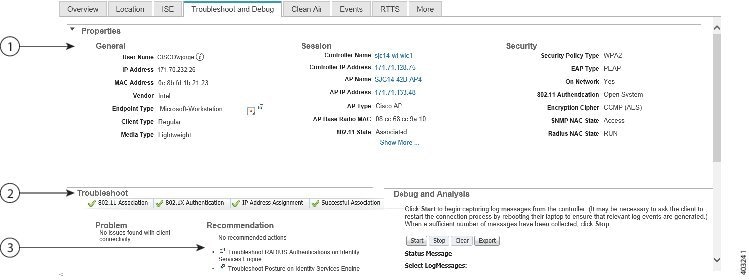
The following figure shows the complete Client Troubleshooting page for a wireless client that has connected successfully. The upper Properties section of the page provides the same session details for a successfully connected client that you would see on the Clients and Users page.

Also note that, as this is a successful connection, the lower Troubleshoot section shows green check marks as the status for each stage of the wireless connection process, and provides no advice on troubleshooting the connection.

Note

Troubleshooting is not supported for clients connected to the Wireless Controllers of Cisco Catalyst 9800 Series.
Figure 1. Client Troubleshooting page for Successful Wireless Client


1

Properties

2

Troubleshoot

3

Recommendation

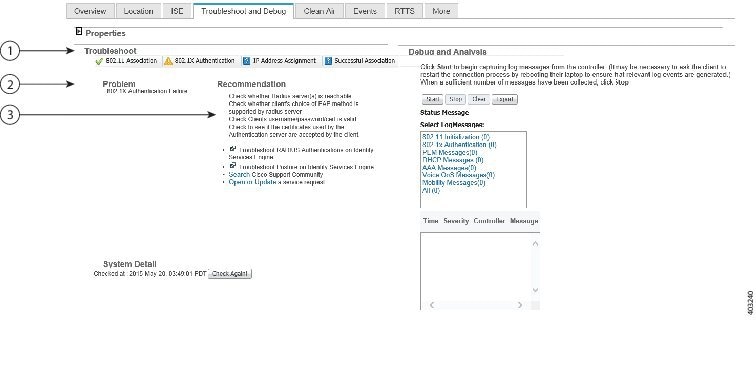
The following figure shows the Troubleshoot section of the Client Troubleshooting page for a different wireless client (for simplicity, we have collapsed the Properties section by clicking on the section’s right arrow icon). This client had trouble connecting. As you can see, there is an alert on the 802.1X Authentication portion of the connection process and a list of steps to try to determine exactly why this was a problem.

This number and type of connection status icons, and advice in the Troubleshoot section, will vary according to the kind of client, the stage of the connection process that had problems, and the likely sources of the problem. For more information, see “How the Client Troubleshooting Tool Gives Advice” in Related Topics.

Figure 2. Client Troubleshooting page for Unsuccessful Wireless Client


1

Troubleshoot

2

Problem

3

Recommendation

How the Client Troubleshooting Tool Gives Advice

determines the number of connection areas and the type of troubleshooting advice to present on the Client Troubleshooting page based on the stages the client passes through when establishing connection and connectivity protocols involved at each stage. The following table summarizes these stages and protocols involved at each stage.

Table 1. Client Connection Stages and Protocols

Connection Stage

Link Connectivity

802.1X Authentication

MAC Authentication

Web Authentication

IP Connectivity

Authorization

802.1X

X

X

X

X

MAC Authentication

X

X

X

X

Web Authentication

X

X

X

X

The following table details the troubleshooting advice presented for each kind of problem detected during the stages of connection building.

Table 2. Troubleshooting Advice for Each Connection Stage and Problem

Client State

Problem

Suggested Action

Link Connectivity

Cannot find the client in the network

  • Check whether the client cable is plugged into the network.
  • Check whether the client is using the proper cable to connect to the network.
  • Ensure that the port to which the client is connected is not disabled administratively.
  • Ensure that the port to which the client is connected is not error disabled.
  • Check whether the speed and duplex are set to Auto on the port to which the client is connected.

Authentication in progress

  • If the client has been in this state for a long time, check the following:
    • Check whether the supplicant on the client is configured properly as required.
    • Modify the timers related to the authentication method and try again.
    • Use the fall back authentication feature if you are not sure which authentication method works with the client.
    • Try disconnecting and reconnecting.

802.1X Authentication

802.1X Authentication Failure

  • Check whether the RADIUS server(s) is reachable from the switch.
  • Check whether the client choice of EAP is supported by the RADIUS server(s).
  • Check whether the username/password/certificate of the client is valid.
  • Ensure that the certificates used by the RADIUS server are accepted by the client.

MAC Authentication

MAC Authentication Failure

  • Check whether the RADIUS server(s) is reachable from the switch.
  • Check whether the MAC address of the client is in the list of known clients on the RADIUS server.
  • Check whether the MAC address of the client is not in the list of excluded clients.

Web Authentication

Client could not be authenticated through web/guest interface

  • Check whether the guest credentials are valid and have not expired.
  • Check whether the client can be redirected to the login page.
  • Check whether the RADIUS server is reachable.
  • Ensure that pop-ups are not blocked.
  • Check whether the DNS resolution on the client is working.
  • Ensure that the client is not using any proxy settings.
  • Check whether the client can access https://<virtual-ip>/login.html
  • Check whether the browser of the client accepts the self-signed certificate offered by the controller.

IP Connectivity

Client could not complete DHCP interaction

  • Check whether the DHCP server is reachable.
  • Check whether the DHCP server is configured to serve the WLAN.
  • Check whether the DHCP scope is exhausted.
  • Check whether multiple DHCP servers are configured with overlapping scopes.
  • Check whether the local DHCP server is present. If the DHCP bridging mode is enabled (move it to second), the client is configured to get the address from the DHCP server.
  • Check if the client has the static IP configured and ensure that the client generates IP traffic.

Authorization

Authorization Failure

  • Ensure that the VLAN defined for authorization is available on the switch.
  • Ensure that the default port ACL is configured for ACL authorization.

Successful Connection

None

None. This indicates that all previous stages were completed successfully.

How To Use the Network Client Troubleshooting Tool

Launch the Client Troubleshooting Tool for the client you want to analyze. See "Launch the Network Client Troubleshooting Tool” in Related Topics. The following table explains the usage of the troubleshooting tabs in the Client Troubleshooting page.

Task

Action

Analyzing client connection logs

  • Click the Log Analysis tab to view log messages logged against the client.
  • Click Start to begin capturing log messages about the client from the controller.
  • Click Stop to stop log message capture.
  • Click Clear to clear all log messages. Log messages are captured for ten minutes and then automatically stopped. Click Start to continue.
  • Click one of the links under Select Log Messages to display log messages (the number between parentheses indicates the number of messages)

Viewing Client Event History and Event Logs

  • Click the Events tab to display the event history of a client.
  • Click the Event Log tab to view the event log.
  • Click Start to begin capturing log messages from the client.
  • Click Stop when a sufficient number of messages have been collected.
  • The Client Troubleshooting Event log and Messaging features are available to CCX Version 6 clients only if the Management Service version is 2 and later.

Checking Client ISE Authentication History and Identity Services

  • Click the Identity Services Engine tab to view information about ISE authentication.
  • Enter the date and time ranges to retrieve historical authentication and authorization information, and then click Submit. The results of the query are displayed in the Authentication Records portion of the page.
  • Click the Identity Services Engine tab to view information about the identity services parameters. You must configure the Identity Services Engine (ISE) before you access this tab.
  • If the ISE is not configured, it provides a link to add an ISE to . The ISE provides authentication records to via REST API. The network administrator can choose a time period for retrieving authentication records from the ISE.

Checking Client Clean Air Environment

  • Click the CleanAir tab to view information about the air quality parameters and active interferer for the CleanAir-enabled access point.
  • Click CleanAir Details to know more about the air quality index.

Running Diagnostic Tests on Problem Clients

  • Click the Test Analysis tab if Cisco-compatible Extension Version 5 or Version 6 clients are available.
  • Check the check box for the applicable diagnostic test, enter any appropriate input information, and click Start. The Test Analysis tab allows you to run a variety of diagnostic tests on the client.

The following diagnostic tests are available on the Test Analysis tab:

  • DHCP—Executes a complete DHCP Discover/Offer/Request/ACK exchange to determine that the DHCP is operating properly between the controller and client.
  • IP Connectivity—Causes the client to execute a ping test of the default gateway obtained in the DHCP test to verify that IP connectivity exists on the local subnet.
  • DNS Ping—Causes the client to execute a ping test of the DNS server obtained in the DHCP test to verify that IP connectivity exists to the DNS server.
  • DNS Resolution—Causes the DNS client to attempt to resolve a network name known to be resolvable to verify that name resolution is functioning correctly.
  • 802.11 Association—Directs an association to be completed with a specific access point to verify that the client is able to associate properly with a designated WLAN.
  • 802.1X Authentication—Directs an association and 802.1X authentication to be completed with a specific access point to verify that the client is able to properly complete an 802.1x authentication.
  • Profile Redirect—At any time, the diagnostic system might direct the client to activate one of the configured WLAN profiles and to continue operation under that profile.
  • To run the profile diagnostic test, the client must be on the diagnostic channel. This test uses the profile number as the input. To indicate a wildcard redirect, enter 0. With this redirect, the client is asked to disassociate from the diagnostic channel and associate with any profile. You can also enter a valid profile ID. Because the client is on the diagnostic channel when the test is run, only one profile is returned in the profile list. You should use this profile ID in the profile redirect test (when wildcard redirecting is not desired).

Pinging Problem Clients with Text Messages

For Cisco-compatible Extension Version 5 or Version 6 clients, a Messaging tab will appear which can be used to send an instant text message to the user of this client. From the Message Category drop-down list, choose a message, and click Send.

Viewing Real Time Troubleshooting (RTTS) Details

Click the RTTS tab to view the Real Time Troubleshooting (RTTS) details.

Select modules to debug and debug level.

Click Run. The RTTS manager executes a set of commands in the controllers connected to the client based on the selected debug modules and debug level and displays the RTTS details.

Click the Filter tab to filter the RTTS details based on debug time, controller name, controller IP, severity, and debug message.

Click the Export tab to export the debug details as a csv file.

You can also debug other controllers based on the selected debug modules and debug levels by using the Choose different controllers option.

The RTTS Manager supports five concurrent RTTS debug sessions and each debug session is limited to five devices.

Viewing Voice Metrics for a Client

To view traffic stream metrics for this client, follow these steps:

  • Choose Monitor > Monitoring Tools > Clients and Users.
  • Select a client.
  • From the More drop-down list, choose Voice Metrics.
  • Click Go.

The following information appears:

  • Time—Time that the statistics were gathered from the access point(s).

  • QoS

  • AP Ethernet MAC Radio

  • QoS

  • AP Ethernet MAC

  • Radio

  • Time—Time that the statistics were gathered from the access point(s).

  • QoS

  • AP Ethernet MA

  • QoS

  • Radio

  • AP Ethernet MAC

  • Radio

  • % PLR (Downlink)—Percentage of packets lost on the downlink (access point to client) during the 90 second interval.

  • % PLR (Uplink)—Percentage of packets lost on the uplink (client to access point) during the 90 second interval.

  • Avg Queuing Delay (ms) (Uplink)—Average queuing delay in milliseconds for the uplink. Average packet queuing delay is the average delay of voice packets traversing the voice queue. Packet queue delay is measured beginning when a packet is queued for transmission and ending when the packet is successfully transmitted. It includes time for re-tries, if needed.

  • % Packets > 40 ms Queuing Delay (Downlink)—Percentage of queuing delay packets greater than 40 ms.

  • % Packets 20ms—40ms Queuing Delay (Downlink)—Percentage of queuing delay packets greater than 20 ms.

  • Roaming Delay—Roaming delay in milliseconds. Roaming delay, which is measured by clients, is measured beginning when the last packet is received from the old access point and ending when the first packet is received from the new access point after a successful roam.

Debug Commands for RTTS

The following table contains the list of debug commands for Legacy controllers and Converged Access Controllers 5760/3850/3650 Wireless LAN Controllers (WLCs).

Table 3. List of Debug Commands for Legacy Controllers and NGWC Controllers

Controller

Modules to Debug

Debug Level

Commands

Legacy

All

debug capwap info enable

debug dot1x all enable

debug mobility directory enable

Dot1.x

Detail

debug dot1x all enable

Error

debug dot1x events enable

High Level

debug dot1x states enable

Legacy

Mobility

Detail

debug mobility packet enable

debug mobility keepalive enable

Error

debug mobility directory enable

debug mobility config enable

High Level

debug mobility handoff enable

Wireless Client

Join

Detail

debug client <macAddress>

debug aaa all enable

debug dot1x all enable

Error

debug client <macAddress>

High Level

debug client <macAddress>

NGWC

All

debug capwap ap error

debug dot1x events

debug capwap ios detail

Dot1.x

Detail

debug wcm-dot1x detail

debug wcm-dot1x all

debug dot1x all

Error

debug wcm-dot1x errors

debug dot1x errors

High Level

debug wcm-dot1x trace

debug wcm-dot1x event

debug wcm-dot1x error

debug client mac-address <macAddress>

Mobility

Detail

debug mobility all

Error

debug mobility error

High Level

debug mobility handoff

Wireless Client

Join

Detail

debug wcdb error

debug wcdb event

debug wcdb db

debug ip dhcp snooping events

debug ip dhcp server events

debug client mac <macAddress>

Error

debug client mac <macAddress>

High Level

debug client mac <macAddress>

Find Out When Network Clients Connect

This feature enables you to track clients and be notified when they connect to a network.

SUMMARY STEPS

  1. Choose Monitor > Monitoring Tools > Clients and Users.
  2. Click Track Clients. The Track Clients dialog box appears listing the currently tracked clients.
  3. Click Add to track a single client, and then enter the following parameters:
  4. If you have a long list of clients, click Import to track multiple clients. This allows you to import a client list from a CSV file. Enter the MAC address and username.

DETAILED STEPS


Step 1

Choose Monitor > Monitoring Tools > Clients and Users.

Step 2

Click Track Clients. The Track Clients dialog box appears listing the currently tracked clients.

This table supports a maximum of 2000 rows. To add or import new rows, you must first remove some older entries.

Step 3

Click Add to track a single client, and then enter the following parameters:

  • Client MAC address

  • Expiration—Choose Never or enter a date.

Step 4

If you have a long list of clients, click Import to track multiple clients. This allows you to import a client list from a CSV file. Enter the MAC address and username.

A sample CSV file can be downloaded that provides data format:

Example:


# MACAddress, Expiration: Never/Date in MM/DD/YYYY format, Note
00:40:96:b6:02:cc, 10/07/2010, Sample Test Client
00:02:8a:a2:2e:60, Never, NA

A maximum of 2000 clients can be tracked. If you have reached the limit, you will have to remove some clients from the list before you can add more.


Set Up Notifications About Clients Connecting to the Network

SUMMARY STEPS

  1. Choose Monitor > Monitoring Tools > Clients and Users.
  2. Click Track Clients. The Track Clients dialog box appears listing the currently tracked clients.
  3. Select the tracked client(s) for which you want to specify notification settings.
  4. Select a notification settings option from the following:
  5. Enter the email address.
  6. Click Save.

DETAILED STEPS


Step 1

Choose Monitor > Monitoring Tools > Clients and Users.

Step 2

Click Track Clients. The Track Clients dialog box appears listing the currently tracked clients.

Step 3

Select the tracked client(s) for which you want to specify notification settings.

Step 4

Select a notification settings option from the following:

  • Purged Expired Entries—You can set the duration to keep tracked clients in database. Clients can be purged as follows:
    • after 1 week
    • after 2 weeks
    • after 1 month
    • after 2 months
    • after 6 months
    • kept indefinitely
  • Notification Frequency—You can specify when s ends a notification of a tracked client:
    • on first detection
    • on every detection
  • Notification Method—You can specify that the tracked client event generates an alarm or sends an email message.
Step 5

Enter the email address.

Step 6

Click Save.


Identify Unknown Network Users

Not all users or devices are authenticated via 802.1x (for example, printers). In such a case, a network administer can assign a username to a device.

If a client device is authenticated to the network through web auth, might not have username information for the client (applicable only for wired clients).

Clients are marked as Unknown when the NMSP connection to the wired switch is lost. A client status (applicable only for wired client) is noted as connected, disconnected, or unknown:

  • Connected clients—Clients that are active and connected to a wired switch.
  • Disconnected clients—Clients that are disconnected from the wired switch.
  • Unknown clients—Clients that are marked as unknown when the NMSP connection to the wired switch is lost.

To add users to the list of Unknown users manually, follow these steps:

SUMMARY STEPS

  1. Choose Monitor > Monitoring Tools > Clients and Users.
  2. Click Identify Unknown Users.
  3. Click Add to add a user.
  4. Enter the MAC address and username and click Add.
  5. Repeat Step 3 to Step 4 to enter a MAC Address and its corresponding username for each client.
  6. Click Save.

DETAILED STEPS


Step 1

Choose Monitor > Monitoring Tools > Clients and Users.

Step 2

Click Identify Unknown Users.

Step 3

Click Add to add a user.

Step 4

Enter the MAC address and username and click Add.

Once a username and MAC address have been added, uses this data for client lookup by matching the MAC address.

Step 5

Repeat Step 3 to Step 4 to enter a MAC Address and its corresponding username for each client.

Step 6

Click Save.

Note 
  • The username is updated only when the next association of the client occurs.
  • This table supports a maximum of 10,000 rows. To add or import new rows, you must first remove some older entries.

Import List Of Unknown Network Users

To import a list of Unknown users, follow these steps:

SUMMARY STEPS

  1. Choose Monitor > Monitoring Tools > Clients and Users.
  2. Click Identify Unknown Users.
  3. Click Choose File to open the file import wizard.
  4. Navigate to the required .csv file and click Choose.
  5. Click Import to import the list.

DETAILED STEPS

  Command or Action Purpose
Step 1

Choose Monitor > Monitoring Tools > Clients and Users.

Step 2

Click Identify Unknown Users.

Step 3

Click Choose File to open the file import wizard.

Step 4

Navigate to the required .csv file and click Choose.

You can dowload a sample csv file for the data format:

Example:

# MacAddress, Username

00:11:22:33:44:55, username

Step 5

Click Import to import the list.

Export List Of Unknown Network Users

To export a list of Unknown users, follow these steps:

SUMMARY STEPS

  1. Choose Monitor > Monitoring Tools > Clients and Users.
  2. Click Identify Unknown Users and then click Export.

DETAILED STEPS

  Command or Action Purpose
Step 1

Choose Monitor > Monitoring Tools > Clients and Users.

Step 2

Click Identify Unknown Users and then click Export.

This exports a .csv file to your system.

Customize the Controller Client and Users Page

You can add, remove, or reorder columns in the Clients table.

SUMMARY STEPS

  1. Choose Monitor > Monitoring Tools > Clients and Users.
  2. Click the settings icon, then click Columns.
  3. Select the columns to show.
  4. Click Reset to restore the default view.
  5. Click Close to confirm the changes.

DETAILED STEPS


Step 1

Choose Monitor > Monitoring Tools > Clients and Users.

Step 2

Click the settings icon, then click Columns.

Step 3

Select the columns to show.

Step 4

Click Reset to restore the default view.

Step 5

Click Close to confirm the changes.


Set Up Automatic Controller Client Troubleshooting on a Diagnostic Channel

In the Settings > Client page, you can enable automatic client troubleshooting on a diagnostic channel. This feature is available only for Cisco-compatible Extension clients Version 5.

To enable automatic client troubleshooting, follow these steps:

Procedure


Step 1

Choose Administration > Settings > System Settings.

Step 2

From the left sidebar menu, choose Client.

Step 3

Check the Automatically troubleshoot client on diagnostic channel check box.

When the check box is selected, processes the diagnostic association trap. When it is not selected, raises the trap, but automated troubleshooting is not initiated.

Step 4

Click Save.


Obtain Radio Measurements for Wireless Network Clients

In the client page, you can obtain radio measurements only if the client is Cisco-compatible Extensions v2 (or higher) and in the associated state (with a valid IP address). If the client is busy when asked to do the measurement, it determines whether to honor the measurement or not. If it declines to make the measurement, it shows no data from the client.

This feature is available to CCX Version 6 clients only if the Foundation service version is 1 or later.

To receive radio measurements, follow these steps:

Procedure


Step 1

Choose Monitor > Monitoring Tools > Clients and Users.

Step 2

Click the circle next to a client.

You can also perform a search for a specific client using Search feature.

Step 3

From the Test drop-down list, choose Radio Measurement.

The Radio Measurement option only appears if the client is Cisco-compatible Extensions v2 (or higher) and is in the associated state (with a valid IP address).

Step 4

Check the check box to indicate if you want to specify beacon measurement, frame measurement, channel load, or noise histogram.

Click Initiate. The different measurements produce differing results. See “View Results of Network Client Radio Measurements” in Related Topics.

The measurements take about 5 milliseconds to perform. A message from indicates the progress. If the client chooses not to perform the measurement, that is communicated.


View Results of Network Client Radio Measurements

Depending on the measurement type requested, the following information might appear:

  • Beacon Response
  • Frame Measurement
  • Channel Load
  • Noise Histogram

For more details on the measurement parameters, see the Field Reference for Monitor pages.

Run a Test to Display Network Client V5 Statistics

To access the Statistics request page, follow these steps:

SUMMARY STEPS

  1. Choose Monitor > Monitoring Tools > Clients and Users.
  2. Select a client.
  3. From the Test drop-down list, choose CCX statistics.
  4. Click Go.
  5. Select the desired type of stats (Dot11 Measurement or Security Measurement).
  6. Click Initiate to initiate the measurements.
  7. Depending on the V5 Statistics request type, the following counters are displayed in the results page:

DETAILED STEPS


Step 1

Choose Monitor > Monitoring Tools > Clients and Users.

Step 2

Select a client.

Step 3

From the Test drop-down list, choose CCX statistics.

This menu is shown only for CCX v5 and later clients.

Step 4

Click Go.

Step 5

Select the desired type of stats (Dot11 Measurement or Security Measurement).

Step 6

Click Initiate to initiate the measurements.

The duration of measurement is five seconds.

Step 7

Depending on the V5 Statistics request type, the following counters are displayed in the results page:

  • Dot11 Measurement
    • Transmitted Fragment Count
    • Multicast Transmitted Frame Count
    • Failed Count
    • Retry Count
    • Multiple Retry Count
    • Frame Duplicate Count
    • Rts Success Count
    • Rts Failure Count
    • Ack Failure Count
    • Received Fragment Count
    • Multicast Received Frame Count
    • FCS Error Count—This counter increments when an FCS error is detected in a received MPDU.
    • Transmitted Frame Count
  • Security
    • Pairwise Cipher
    • Tkip ICV Errors
    • Tkip Local Mic Failures
    • Tkip Replays
    • Ccmp Replays
    • Ccmp Decryp Errors
    • Mgmt Stats Tkip ICV Errors
    • Mgmt Stats Tkip Local Mic Failures
    • Mgmt Stats Tkip Replays
    • Mgmt Stats Ccmp Replays
    • Mgmt Stats Ccmp Decrypt Errors
    • Mgmt Stats Tkip MHDR Errors
    • Mgmt Stats Ccmp MHDR Errors
    • Mgmt Stats Broadcast Disassociate Count
    • Mgmt Stats Broadcast Deauthenticate Count
    • Mgmt Stats Broadcast Action Frame Count

Run a Test to Display Network Client Operational Parameters

To view specific client operational parameters, follow these steps:

SUMMARY STEPS

  1. Choose Monitor > Monitoring Tools > Clients and Users.
  2. Select a client.
  3. From the Test drop-down list, choose Operational Parameters.

DETAILED STEPS


Step 1

Choose Monitor > Monitoring Tools > Clients and Users.

Step 2

Select a client.

Step 3

From the Test drop-down list, choose Operational Parameters.

The following information is displayed:

Operational Parameters:

  • Device Name—User-defined name for device.
  • Client Type—Client type can be any of the following:
    • laptop(0)
    • pc(1)
    • pda(2)
    • dot11mobilephone(3)
    • dualmodephone(4)
    • wgb(5)
    • scanner(6)
    • tabletpc(7)
    • printer(8)
    • projector(9)
    • videoconfsystem(10)
    • camera(11)
    • gamingsystem(12)
    • dot11deskphone(13)
    • cashregister(14)
    • radiotag(15)
    • rfidsensor(16)
    • server(17)
    • SSID—SSID being used by the client.
    • IP Address Mode—The IP address mode such as static configuration or DHCP.
    • IPv4 Address—IPv4 address assigned to the client.
    • IPv4 Subnet Address—IPv4 subnet address assigned to the client.
    • IPv6 Address—IPv6 address assigned to the client.
    • IPv6 Subnet Address—IPv6 address assigned to the client.
    • Default Gateway—The default gateway chosen for the client.
    • Operating System—Identifies the operating system that is using the wireless network adapter.
    • Operating System Version—Identifies the version of the operating system that is using the wireless network adapter.
    • WNA Firmware Version—Version of the firmware currently installed on the client.
    • Driver Version
    • Enterprise Phone Number—Enterprise phone number for the client.
    • Cell Phone Number—Cell phone number for the client.
    • Power Save Mode—Displays any of the following power save modes: awake, normal, or maxPower.
    • System Name
    • Localization

Radio Information:

  • Radio Type—The following radio types are available:
    • unused(0)
    • fhss(1)
    • dsss(2)
    • irbaseband(3)
    • ofdm(4)
    • hrdss(5)
    • erp(6)
  • Radio Channel—Radio channel in use.

DNS/WNS Information:

  • DNS Servers—IP address for DNS server.
  • WNS Servers—IP address for WNS server.

Security Information:

  • Credential Type—Indicates how the credentials are configured for the client.
  • Authentication Method—Method of authentication used by the client.
  • EAP Method—Method of Extensible Authentication Protocol (EAP) used by the client.
  • Encryption Method—Encryption method used by the client.
  • Key Management Method—Key management method used by the client.

View Network Client Details

To view specific client profile information, follow these steps:

SUMMARY STEPS

  1. Choose Monitor > Monitoring Tools > Clients and Users.
  2. Select a client.
  3. From the More drop-down list, choose Profiles.

DETAILED STEPS


Step 1

Choose Monitor > Monitoring Tools > Clients and Users.

Step 2

Select a client.

Step 3

From the More drop-down list, choose Profiles.

The following information is displayed:

  • Profile Name—List of profile names as hyperlinks. Click a hyperlink to display the profile details.

  • SSID—SSID of the WLAN to which the client is associated.


Disable Network Clients

To disable a current client, follow these steps:

SUMMARY STEPS

  1. Choose Monitor > Monitoring Tools > Clients and Users.
  2. Select a client.
  3. Click Disable. The Disable Client page appears.
  4. Enter a description in the Description text box.
  5. Click OK.

DETAILED STEPS


Step 1

Choose Monitor > Monitoring Tools > Clients and Users.

Step 2

Select a client.

Step 3

Click Disable. The Disable Client page appears.

Step 4

Enter a description in the Description text box.

Step 5

Click OK.

Once a client is disabled, it cannot join any network/ssid on controller(s). To enable the client again, choose Configuration > Network > Network Devices > Wireless Controller > Device Name > Security > Manually Disabled Clients, and remove the client entry.


Remove Network Clients From Prime Infrastructure

To remove a current client, follow these steps:

SUMMARY STEPS

  1. Choose Monitor > Monitoring Tools > Clients and Users.
  2. Select a client.
  3. Choose Remove.
  4. Click Remove to confirm the deletion.

DETAILED STEPS


Step 1

Choose Monitor > Monitoring Tools > Clients and Users.

Step 2

Select a client.

Step 3

Choose Remove.

Step 4

Click Remove to confirm the deletion.


Locate Network Clients on a Wireless Map

To display a high-resolution map of the client location, follow these steps:

SUMMARY STEPS

  1. Choose Monitor > Monitoring Tools > Clients and Users.
  2. Choose a client from the Client Username column.
  3. From the More drop-down list:
  4. Click Go.

DETAILED STEPS


Step 1

Choose Monitor > Monitoring Tools > Clients and Users.

Step 2

Choose a client from the Client Username column.

Step 3

From the More drop-down list:

  • Choose Recent Map,to view the recent location of the client.

  • Choose Present Map, to view a high-resolution map of the client current location.

  • Choose Client Sessions Report, to view the most recent client session report results for a client.

    Note 
    Prime Infrastructure 3.3 onwards, recent and current client locations are not displayed in Site Maps.
Step 4

Click Go.


View Network Client Roaming Using Reports

To view the most recent roam report for this client, follow these steps:

SUMMARY STEPS

  1. Choose Monitor > Monitoring Tools > Clients and Users.
  2. Select a client.
  3. From the More drop-down list, choose Roam Reason.
  4. Click Go.

DETAILED STEPS


Step 1

Choose Monitor > Monitoring Tools > Clients and Users.

Step 2

Select a client.

Step 3

From the More drop-down list, choose Roam Reason.

Step 4

Click Go.

This page displays the most recent roam report for the client. Each roam report has the following information:

  • New AP MAC address

  • Old (previous) AP MAC address

  • Previous AP SSID

  • Previous AP channel

  • Transition time—Time that it took the client to associate to a new access point.

  • Roam reason—Reason for the client roam.


Identify Access Points That Can Hear a Network Client

To display details of access points that can hear the client including the signal strength/SNR, follow these steps:

SUMMARY STEPS

  1. Choose Monitor > Monitoring Tools > Clients and Users.
  2. Select a client.
  3. From the More drop-down list, choose Detecting APs.
  4. Click Go.

DETAILED STEPS


Step 1

Choose Monitor > Monitoring Tools > Clients and Users.

Step 2

Select a client.

Step 3

From the More drop-down list, choose Detecting APs.

Step 4

Click Go.


View the Location History for a Network Client

To display the history of the client location based on RF fingerprinting, follow these steps:

SUMMARY STEPS

  1. Choose Monitor > Monitoring Tools > Clients and Users.
  2. Select a client.
  3. From the More drop-down list, choose Location History.
  4. Click Go.

DETAILED STEPS


Step 1

Choose Monitor > Monitoring Tools > Clients and Users.

Step 2

Select a client.

Step 3

From the More drop-down list, choose Location History.

Step 4

Click Go.