User Interface Reference
is a web-based application.
If any of your installed Cisco Prime products are not yet enabled through licensing, the menu items or options for those features are not displayed in the web interface.
About the User Interface
is a web-based application.
If any of your installed Cisco Prime products are not yet enabled through licensing, the menu items or options for those features are not displayed in the web interface.
When you first log in to , an overlay window shows you the major components of the graphical interface. To view this overlay window again, click your login name at the top-right of the screen, then choose .
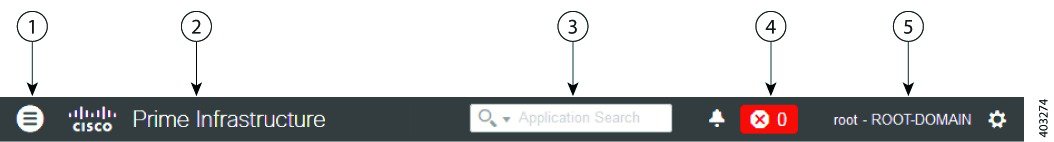
The toolbar shown in Figure 58-1 is at the top of every page
|
1 |
Click to open the menu. |
|
2 |
Click to go to the product page on cisco.com. |
|
3 |
Type to search for data within . You can enter any text string such as a partial or complete IP address, a user name, an application name, or configuration archives. The search results display information such as Access Points, Alarms, Change Audit, Configuration Archives, Devices, etc. You can export the search results in CSV and PDF formats by clicking the export icon in the right corner. |
|
4 |
Displays the number of alarms, and the color corresponds to the highest severity level alarm in your network. Click to display the alarm summary window, displaying all alarms and the number of critical, major, and minor alarms. |
|
5 |
Displays login name and the virtual domain to which you are assigned. Click to change your user preferences, change your password, log out, access help, and submit product feedback. |
Dock Window
If you typically visit a small subsection of pages in , the Dock window provides a quick way to navigate quickly to those pages. From any page in , you can click the Dock icon (in the upper right corner) to quickly view:
- Links to videos relevant to the current page
- Links to pages you recently visited (up to a maximum of 15)
- Links to pages you marked as favorites (up to a maximum of 15)
- Pinned items
The Dock window stays open until you close it.
Pin Devices to a Dock Window
If there are specific devices that you want to watch closely, you can pin the devices to the Dock window. You can have a maximum of 15 pinned items.
Procedure
| Step 1 |
From the Device 360° view, click the Add to Doc icon. The device appears under the Pinned Items section of the Dock window. |
| Step 2 |
Click on the device link in the Dock window from anywhere in , and the Device 360° view appears with updated information. |
| Step 3 |
To remove an item from the Dock window, click the Trash icon next to the item. It is removed from Pinned Items. |
Filters
You can use the Filter feature to display specific information about the interface. The Filter icon is provided wherever the data is displayed in a tabular format. The following types of filters are available:
- Quick Filter—See Quick Filters.
- Advanced Filter—See Advanced Filters.
- Dashboard Filter—See Dashboard Filters.
Quick Filters
This filter allows you to narrow down the data inside a table by applying a filter to a specific table column or columns. To apply different operators, use the Advanced Filter option (see Advanced Filters).
To launch the quick filter, choose Quick Filter from the Filter drop-down list.
To clear the Quick Filter, click Filter.
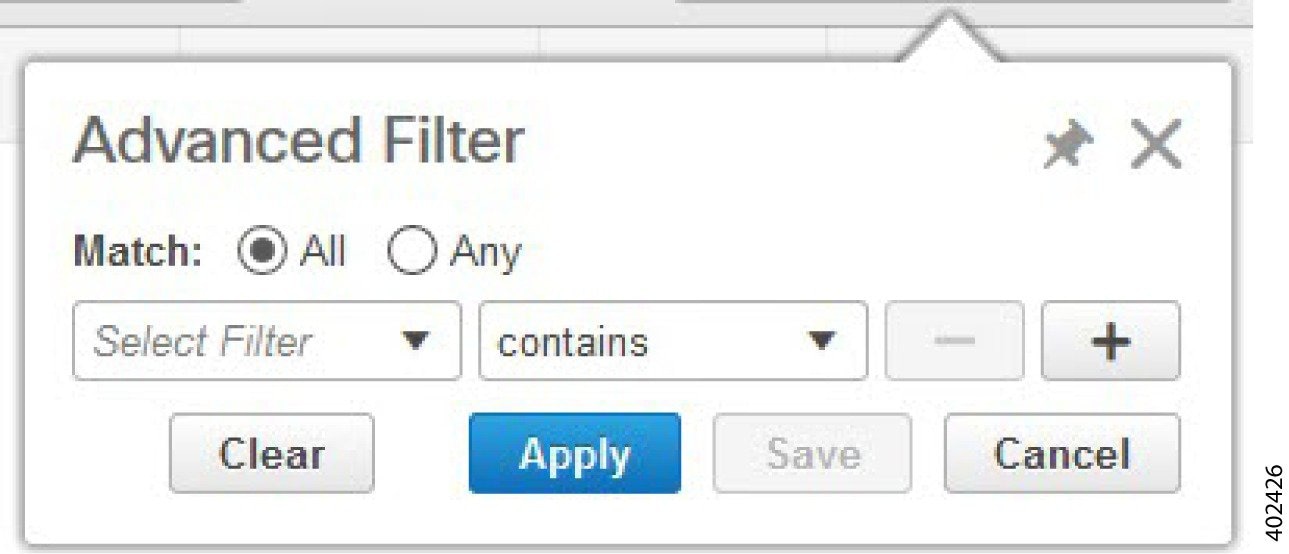
Advanced Filters
This filter allows you to narrow down the data in a table by applying a filter using multiple operators such as Does not contain, Does not equal, Ends with, Is empty, and so on. For example, you can choose the filter pattern by table column names and the operator from the drop-down list. In addition, you must enter filter criteria based on the data available in the database.
To launch advanced filtering, choose Advanced Filters from the Filter drop-down list.
To save the filter criteria used in the Advanced filter, follow these steps:
Procedure
| Step 1 |
Enter the advanced filter criteria, then click Go. The data is filtered based on the filter criteria. |
| Step 2 |
After the data is filtered, click the Save icon. |
| Step 3 |
In the Save Preset Filter dialog box, enter a name for the preset filter and click Save. |
Dashboard Filters
The Filters toolbar allows you to narrow down the data that is displayed in all of the dashlets in a dashboard. Use this toolbar to filter the dashlets data by:
-
Time frame—Select one of the preset options or create a custom time frame.
- Client —Select or enter the client atttribute.
You can also use special characters except " (double quote).
Note
Client username field supports special characters except " (double quotes).
-
Applications—Select a service, up to 10 individual applications, or all applications.
-
Network Aware—Select wired, wireless, or all networks.
- Site—Select a site, unassigned sites, or all sites.

To filter the data for all dashlets in a dashboard, follow these steps:
Procedure
| Step 1 |
Open a dashboard (for example, choose ). |
| Step 2 |
Change the settings in any of the Filters toolbar options, then click Go. |
Data Entry Features
In addition to the check boxes, drop-down lists and data entry fields common in most user interfaces, uses some specialized data-entry features. These features are designed to keep your view of the network as uncluttered as possible, while still making it possible for you to add, update, and save your settings when needed. These specialized data-entry features include:
- Edit Tables
- Data Popups
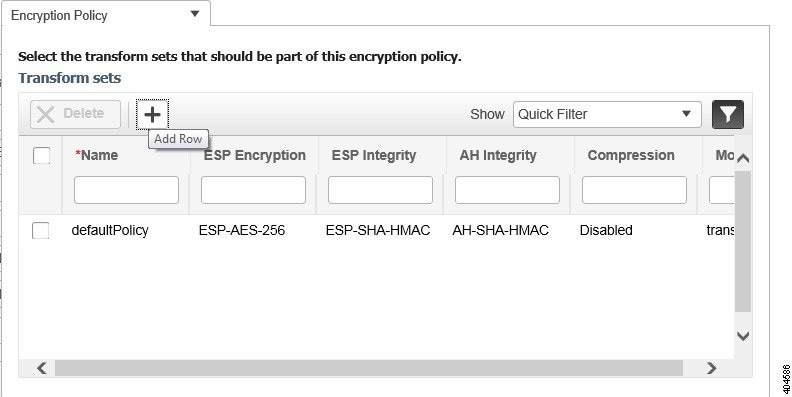
Edit Tables
uses tables to display many kind of data, including lists of sites, devices, and events. The data is arranged in rows and columns, much like a spreadsheet.
An edit table differs from other tables in that you can add, edit, or delete the data it contains. Some edit tables also give you access to filters (see Filters). Edit tables are often displayed in data popups that are triggered by check boxes.
To use edit tables:
- To add a new row in the edit table:
Click the (+) icon, complete the fields in the new row, and click Save.
- To delete one or more existing rows in an edit table:
Select the row header check box (at the extreme left of each row), then click Delete.
- To update an entry in any field in any edit table row:
Click the row header or on the field itself, edit the contents, then click Save.
Data Pop-ups
A data popup is a window associated with a check box, anchored field, or other data-entry feature. It is displayed automatically when you select a feature, so that you can view or update the data associated with that feature. In addition to containing check boxes, drop-down lists, and data-entry fields, data popups can also contain edit tables.
To use a data popup:
-
Select the feature that triggers the data popup, such as an anchored field or a check box.
-
With the associated popup displayed, view or update the fields as needed.
-
When you are finished, click anywhere outside the data popup. If you entered new information or changed existing information, your changes are saved automatically.
Interactive Graphs
provides interactive line, area, pie, and stacked bar graphs of both time-based and non time-based data. Interactive graph features include the following:
- Support for automatic refresh—The graphs refresh automatically within a predetermined time interval.
- Two graph views:
- Graph (Chart) view (this is the default)
- Table (Grid) view
- Graph enlargement
Related Topics
How to Use Interactive Graphs
The following table summarizes how to use interactive graphs.
|
To do this: |
Do this: |
|---|---|
|
Get help with the graph buttons |
Hover your mouse cursor over the button. displays a popup tooltip describing the button. |
|
View the data as a graph or chart. |
Click View in Chart. |
|
View the data in grid or table form |
Click View in Grid. |
|
Enlarge the graph |
Click the button located at the bottom right side of the graph. displays an enlarged version of the graph in a separate page. The View in Chart and View in Grid toggle buttons are available in the new page, so you can change the type of enlarged graph displayed. |
Related Topics
Time-based Graphs
Some graphs display time-based data. For these time-based graphs, provides a link bar at the top of the graph. The link bar contains a set of links representing standard time-frames (such as the last six hours, one day, and so on) appropriate for the type of data in the chart. When you select one of these time-frame links, the data for that time frame is retrieved and the graph is refreshed to show only the data for that time-frame.
The time-frame links displayed in time-based graphs include the following:
- 6h—Denotes the last six hours of data from the current time. The data is gathered from the current database table.
- 1d—Denotes the last day (24 hours) of data from the current time. The data is gathered from the current database table.
- 1w—Denotes the last week (seven days) of data from the current time. The data is gathered from the hourly aggregated table.
- 2w—Denotes the last two weeks of data from the current time. The data is gathered from the hourly aggregated table.
- 4w—Denotes the last four weeks of data from the current time. The data is gathered from the hourly aggregated table.
- 3m—Denotes the last three months of data from the current time. The data is gathered from the daily aggregated table.
- 6m—Denotes the last six months of data from the current time. The data is gathered from the weekly aggregated table.
- 1y—Denotes the past year (12 months) of data from the current time. The data is gathered from the weekly aggregated table.
- Custom—User-selected time period. You can set the day and time for the start and end dates. The use of a current or hourly, daily, or weekly aggregated source for data depends upon the selected start date.
The default, maximum and minimum retention periods for the aggregated data displayed in time-based graphs are controlled by administrators. For details, see “About Historical Data Retention” in Related Topics.
Related Topics
Common UI Tasks
You can perform the following actions from nearly any window:
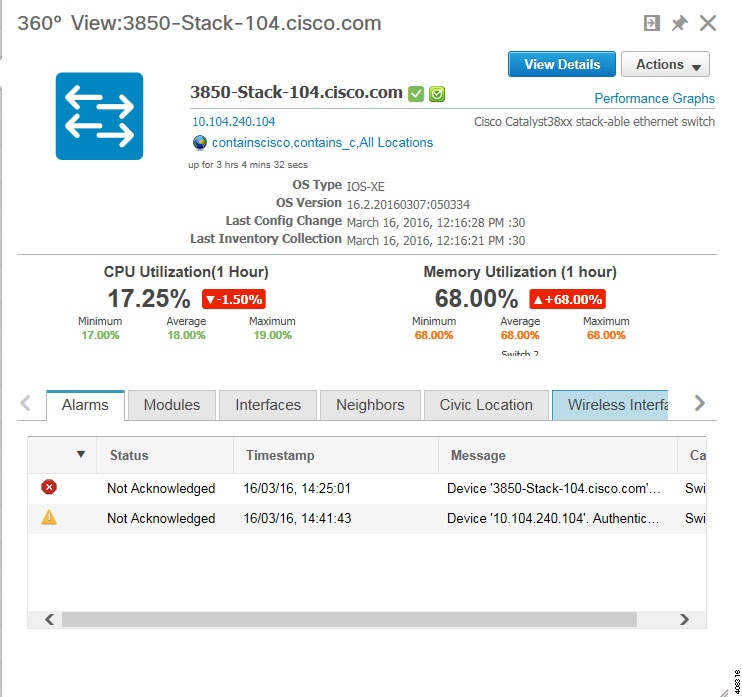
Get Device Details from Device 360° View
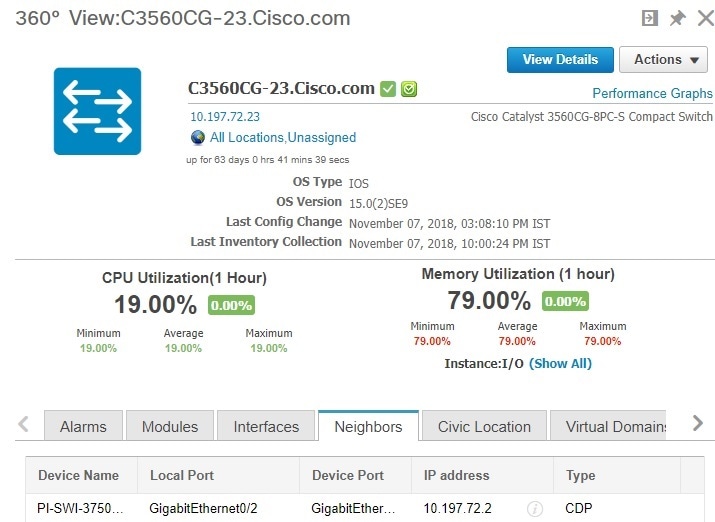
The Device 360° View provides detailed device information including device status, interface status, and associated device information. You can see the device 360° view from nearly all pages in which device IP addresses are displayed.
To launch the 360° view of any device, click the info icon next to the device IP address.
Note |
In the 360° View dialog, navigate to the Neighbors tab and click the info icon beside the IP address to view the 360 views of the looped devices. |
Figure 58-5 shows a sample of the Device 360° View.
Note |
The features that appear in the Device 360° View differ depending on the device type. |
|
Device 360° View Feature |
Description |
||
|---|---|---|---|
|
Device status |
Indicates whether the device is reachable, is being managed, and is synchronized with the . |
||
|
Action drop-down list |
Choose one of the following options from the Action drop-down list at the top right of the device 360° view.
|
||
|
Alarms |
Lists alarms on the device, including the alarm status, time stamp, and category. |
||
|
Modules |
Lists the device modules and their name, type, state, and ports. |
||
|
Interfaces |
Lists the device interfaces and the top three applications for each interface. Shows the configured VRFs (only for routers and nexus devices). |
||
|
Neighbors |
Lists the device neighbors, including their index, port, duplex status, and IP address. If the neighbor devices are managed in , the device name will have link to the device details page and the info icon allows to lauch the device 360° view. |
||
|
Civic Location |
Lists the Network Mobility Services Protocol (NMSP) status, civic address and location details of the device. |
||
|
Wireless Interfaces |
Lists the interface names, associated WLANs, VLAN IDs and IP addresses. |
||
|
WLAN |
Lists the WLAN names, SSIDs, security policies, and number of clients. |
||
|
Recent Changes |
Lists the last five audit changes made by user on the selected device. These changes are categorized as:
|
Related Topics
Connect to Devices Using Telnet and SSH With Internet Explorer and Google Chrome
Before You Begin
Ensure that you have the Telnet and SSH browser plug-ins installed in Internet Explorer and Chrome.
Enable Telnet Client Functionality in Internet Explorer
To enable Telnet client functionality in 64 bit Windows operating System with 32 bit Internet Explorer, follow these steps:
Procedure
| Step 1 |
Open the Telnet client in control panel.
|
||
| Step 2 |
Copy the 64 bit version of telnet.exe from System32 in Windows directory to SysWOW64 in the same directory. |
||
| Step 3 |
Add the following registry key for the 32 bit version of Internet Explorer.
Example:
|
||
| Step 4 |
Copy the file System32\en-US\telnet.exe.mui to the folder SysWOW64\en-US. |
Enable SSH
Follow these steps to start SSH session in Internet Explorer.
Procedure
| Step 1 |
Create a file called ssh.reg with the following content: Example: |
||
| Step 2 |
Run this file to add the information to the Windows Registry.
|
Get User Details from the User 360° View
The User 360° View provides detailed information about an end user, including:
- End user network connection and association
- Authentication and authorization
- Possible problems with the network devices associated with the user’s network attachment
- Application-related issues
- Other issues in the broader network
To access the 360° view for a user, follow these steps:
Procedure
| Step 1 |
Choose . |
||||||||||||||
| Step 2 |
Click the expand icon next to a user name under the UserName column. You can view the User 360° View. The following figure shows a sample of the User 360° View. 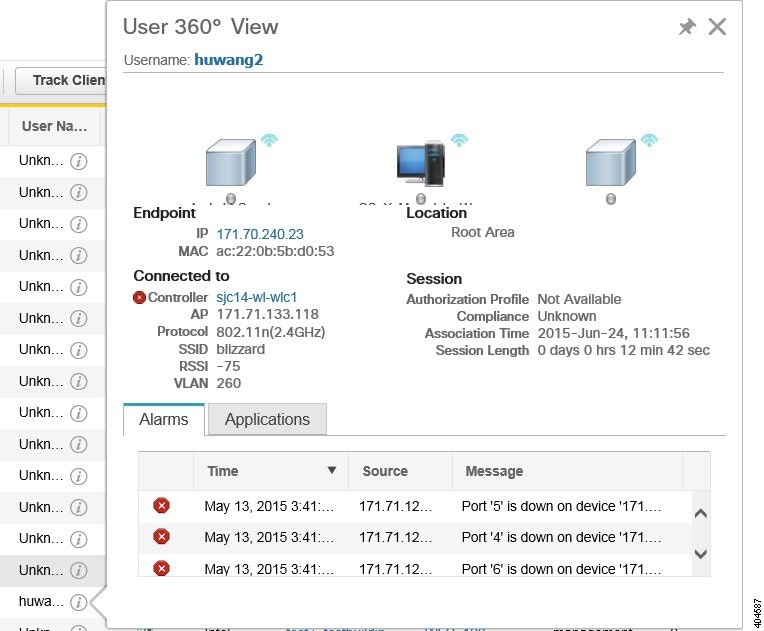
|
Get VRF Details from Router 360° View
The router 360° view provides the VRF details for the following routing protocols:
- BGP Routes
- BGP Neighbors
- EIGRP Routes
- EIGRP Neighbors
To view the VRF details using the router 360° view, follow these steps:
Procedure
| Step 1 |
Choose . |
| Step 2 |
Choose in the Device Groups pane. |
| Step 3 |
Choose the router that you want to view the details. The router details are displayed in a tabular form in the right pane. |
| Step 4 |
Click the info icon next to the router IP address. |
| Step 5 |
Choose in the 360° view of the router. |
| Step 6 |
Choose the VRF from the Select a VRF drop-down list and choose the protocol that you want to view the routing details. |
Search Methods
provides the following search methods:
- Application Search—See Use Application Search
- Advanced Search—See Use Advanced Search.
- Saved Search—See Use Saved Search
You can access the search options from any page within .
Use Application Search
To quickly search for data within , you can enter any text string such as a partial or complete IP address or a username if you are searching for a client.
Procedure
| Step 1 |
Click the Search icon at the top-right of the screen. |
||
| Step 2 |
In the Search text box, enter a search string and click Search . Entering multiple strings in the Application Search text box will return all the results matching every keyword provided. You can also search for Managed Devices, Clients, Alarms, Config Archive, Change Audit, and Maps apart from applications.
|
||
| Step 3 |
Click View List to view the matching devices from the Monitor or Configuration page. |
Use Advanced Search
Procedure
| Step 1 |
Click the Search icon at the top-right of the screen. |
||
| Step 2 |
From the Search pulldown menu, select Advanced Search. |
||
| Step 3 |
In the Advanced Search dialog box, choose a category from the Search Category drop-down list. |
||
| Step 4 |
Choose all applicable filters or parameters for your search.
|
||
| Step 5 |
To save this search, select the Save Search check box, enter a unique name for the search in the text box, and click Go.
The Search categories include the following:
|
Find Alarms
You can configure the following parameters when performing an advanced search for alarms.
|
Field |
Options |
||
|---|---|---|---|
|
Severity |
Choose All Severities, CriticalMajor, Major, Minor, Warningor Clear. |
||
|
Alarm Category |
Choose All Types, System, Access Points,Controllers, Coverage Hole, , Config Audit, Mobility Service,Context Aware Notifications, SE Detected Interferers, Mesh Links, Rogue AP, Adhoc Rogue, Security, Performance, Application Performance, Routers, Switches and Hubs, or Cisco Interfaces and Modules. |
||
|
Condition |
Use the drop-down list to choose a condition. Also, you can enter a condition by typing it in this drop-down list.
|
||
|
Time Period |
Choose a time increment from Any Time to Last 7 days. The default is Any Time. |
||
|
Acknowledged State |
Select this check box to search for alarms with an Acknowledged or Unacknowledged state. If this check box is not selected, the acknowledged state is not taken into search criteria consideration. |
||
|
Assigned State |
Select this check box to search for alarms with an Assigned or Unassigned state or by Owner Name. If this check box is not selected, the assigned state is not part of the search criteria.
|
Find Jobs
You can configure the following parameters when performing an advanced search for jobs (see Table 58-5).
|
Field |
Options |
|---|---|
|
Job Name |
Type the name of the job that you want to search. |
|
Job Type |
Type the job type that you want to search. |
|
Job Status |
Choose All Status, Power, or Scheduled. |
Note |
You can use wildcards such as *,? in the Job Name and Job Type text box to narrow or broaden your search. |
Find Access Points
You can configure the following parameters when performing an advanced search for access points (see the following table).
|
Field |
Options |
||
|---|---|---|---|
|
Search By |
Choose All APs, Base Radio MAC, Ethernet MAC, AP Name, AP Model, AP Location, IP Address, Device Name, Controller IP, All Unassociated APs, Floor Area, Outdoor Area, Unassigned APs or Alarms.
|
||
|
AP Type |
Choose All Types, LWAPP, or Autonomous. |
||
|
AP Mode |
Choose All Modes, Local, Monitor, FlexConnect, Rogue Detector, Sniffer, , Bridge, or SE-Connect. |
||
|
Radio Type |
Choose All Radios, 802.11a, or 802.11b/g. |
||
|
802.11n Support |
Select this check box to search for access points with 802.11n support. |
||
|
OfficeExtend AP Enabled |
Select this check box to search for Office Extend access points. |
||
|
CleanAir Support |
Select this check box to search for access points which support CleanAir. |
||
|
CleanAir Enabled |
Select this check box to search for access points which support CleanAir and which are enabled. |
||
|
Items per page |
Configure the number of records to be displayed in the search results page. |
Find Controller Licenses
You can configure the following parameters when performing an advanced search for controller licenses.
|
Field |
Options |
|---|---|
|
Controller Name |
Type the controller name associated with the license search. |
|
Feature Name |
Choose All, Plus or Base depending on the license tier. |
|
Type |
Choose All, Evaluation, Extension, Grace Period, or Permanent. |
|
% Used or Greater |
Choose the percentage of the license use from this drop-down list. The percentages range from 0 to 100. |
|
Items per page |
Configure the number of records to be displayed in the search results page. |
Find Controllers
You can configure the following parameters when performing an advanced search for controllers.
|
Field |
Options |
||
|---|---|---|---|
|
Search for controller by |
Choose All Controllers, IP Address, and Controller Name.
|
||
|
Enter Controller IP Address |
This text box appears only if you choose IP Address from the Search for controller by drop-down list. |
||
|
Enter Controller Name |
This text box appears only if you choose Controller Name from the Search for controller by drop-down list. |
||
|
Audit Status |
Choose one of the following from the drop-down list:
|
||
|
Items per page |
Configure the number of records to be displayed in the search results page. |
Find Switches
You can configure the following parameters when performing an advanced search for switches.
|
Field |
Options |
|---|---|
|
Search for Switches by |
Choose All Switches, IP Address, or Switch Name. You can use wildcards (*). For example, if you select IP Address and enter 172*, returns all switches that begin with IP address 172. |
|
Items per page |
Configure the number of records to be displayed in the search results page. |
Find Clients
You can configure the following parameters when performing an advanced search for clients (see Table 58-10).
|
Field |
Options |
||
|---|---|---|---|
|
Media Type |
Choose All, Wireless Clients or Wired Clients. |
||
|
Wireless Type |
Choose All, Lightweight, or Autonomous Clients if you chose Wireless Clients from the Media Type list. |
||
|
Search By |
Choose All Clients, All Excluded Clients, All Wired Clients, All Logged in Guests, IP Address,, User Name, MAC Address, Asset Name, Asset Category, Asset Group, AP Name, Controller Name, Controller IP, MSE IP, Floor Area, Outdoor Area, Switch Name, or Switch Type.
|
||
|
Clients Detected By |
Choose Prime Infrastructure or MSEs. Clients detected by —Clients stored in databases. Clients detected by MSE—Clients located by Context Aware service in the MSE directly communicating with the controllers. |
||
|
Client States |
Choose All States, Idle, Authenticated, Associated, Probing, or Excluded. |
||
|
Posture Status |
Choose All, Unknown, Passed, Failed if you want to know if the devices are clean or not. |
||
|
Restrict By Radio Band |
Select the check box to indicate a specific radio band. Choose 5 GHz or 2.4 GHz from the drop-down list. |
||
|
Restrict By Protocol |
Select the check box to indicate a specific protocol. Choose 802.11a, 802.11b, 802.11g, 802.11n, or Mobile from the drop-down list. |
||
|
SSID |
Select the check box and choose the applicable SSID from the drop-down list. |
||
|
Profile |
Select the check box to list all of the clients associated to the selected profile.
|
||
|
CCX Compatible |
Select the check box to search for clients that are compatible with Cisco Client Extensions.
|
||
|
E2E Compatible |
Select the check box to search for clients that are end–to–end compatible.
|
||
|
NAC State |
Select the check box to search for clients identified by a certain Network Admission Control (NAC) state.
|
||
|
Include Disassociated |
Select this check box to include clients that are no longer on the network but for which has historical records. |
||
|
Items per page |
Configure the number of records to be displayed in the search results page. |
Find Chokepoints
You can configure the following parameters when performing an advanced search for chokepoints.
|
Field |
Options |
||
|---|---|---|---|
|
Search By |
Choose MAC Address or Chokepoint Name.
|
Find Events
You can configure the following parameters when performing an advanced search for events .
|
Field |
Options |
||
|---|---|---|---|
|
Severity |
Choose All Severities, Critical, Major, Minor, Warning, Clear, or Info. Color coded. |
||
|
Event Category |
Choose All Types, Access Points, Controller, Security, Coverage Hole, Rogue AP, Adhoc Rogue, Interference, Mesh Links,Client, Mobility Service, Mobility Service, Location Notifications, re Coverage Hole, or Prime Infrastructure. |
||
|
Condition |
Use the drop-down list to choose a condition. Also, you can enter a condition by typing it in this drop-down list.
|
||
|
Search All Events |
Configure the number of records to be displayed in the search results page. |
Find Interferers
You can configure the following parameters when performing an advanced search for interferers detected by access points.
|
Field |
Options |
||
|---|---|---|---|
|
Search By |
Choose
All
Interferers,
Interferer ID,
Interferer Category,
Interferer Type,
Affected Channel,
Affected AP,
Severity,
Power, or
Duty
Cycle.
|
||
|
Detected By |
Choose All Spectrum Experts or a specific spectrum expert from the drop-down list. |
||
|
Detected within the last |
Choose the time range for the interferer detections. The times range from 5 minutes to 24 hours to All History. |
||
|
Interferer Status |
From this drop-down list, choose All, Active, or Inactive. |
||
|
Restrict by Radio Bands/Channels |
Configure the search by radio bands or channels. |
||
|
Items per page |
Configure the number of records to be displayed in the search results page. |
Find Wi-Fi TDOA Receivers
You can configure the following parameters when performing an advanced search for Wi-Fi TDOA receivers.
|
Field |
Options |
||
|---|---|---|---|
|
Search By |
Choose MAC Address or Wi-Fi TDOA Receivers Name.
|
Find Maps
You can configure the following parameters when performing an advanced search for maps.
|
Field |
Options |
|---|---|
|
Search for |
Choose All Maps, Campuses, Buildings, Floor Areas, or Outdoor Areas. |
|
Map Name |
Search by Map Name. Enter the map name in the text box. |
|
Items per page |
Configure the number of records to be displayed in the search results page. |
Find Rogue Clients
You can configure the following parameters when performing an advanced search for rogue clients.
|
Field |
Options |
|---|---|
|
Search for clients by |
Choose All Rogue Clients, , MAC Address, Controller, MSE, Floor Area, or Outdoor Area. |
|
Search In |
Choose MSEs or Prime Infrastructure Controllers. |
|
Status |
Select the check box and choose Alert, Contained, or Threat from the drop-down list to include status in the search criteria. |
Find Shunned Clients
Note |
When a Cisco IPS sensor on the wired network detects a suspicious or threatening client, it alerts the controller to shun this client. |
You can configure the following parameters when performing an advanced search for shunned clients.
|
Field |
Options |
||
|---|---|---|---|
|
Search By |
Choose All Shunned Clients, Controller, or IP Address.
|
Find Tags
You can configure the following parameters when performing an advanced search for tags.
|
Field |
Options |
||
|---|---|---|---|
|
Search for tags by |
Choose
All
Tags,Asset Name,
Asset
Category,
Asset
Group,
MAC
Address,
Controller,
|
||
|
Search In |
Choose MSEsor Prime Infrastructure Controllers. |
||
|
Last detected within |
Choose a time increment from 5 minutes to 24 hours. The default is 15 minutes. |
||
|
Tag Vendor |
Select the check box and choose Aeroscout, G2, PanGo, or WhereNet. |
||
|
Telemetry Tags only |
Select the Telemetry Tags only check box to search tags accordingly. |
||
|
Items per page |
Configure the number of records to be displayed in the search results page. |
Find Device Types
You can configure the following parameters when performing an advanced search for device type.
|
Field |
Options |
|---|---|
|
Select Device Type |
Choose All Switches and Hubs, Wireless Controller, Unified AP, Autonomous AP, Unmanaged AP, or Routers. |
|
Enter Device IP |
Enter the IP address of the device selected in the Select Device Type field. |
Find Configuration Versions
You can configure the following parameter when performing an advanced search for configuration versions.
|
Field |
Options |
|---|---|
|
Enter Tag |
Enter the tag name. |
Use Saved Search
Note |
Saved searches apply only to the current partition. |
To access and run a previously saved search, follow these steps:
Procedure
| Step 1 |
Click the icon in the Application Search box, then click Saved Search. |
| Step 2 |
Choose a category from the Search Category drop-down list, then choose a saved search from the Saved Search List drop-down list. |
| Step 3 |
If necessary, change the current parameters for the saved search, then click Go. |
 Feedback