Monitoring Data
Available Languages
Table Of Contents
Overview of Data Collection and Data Sources
Configuring Multiple Collections
NDE Flow Masks and V8 Aggregation Caches
Viewing the Monitor Overview Charts
Viewing the Applications Current Rates Table
Displaying Details from the Applications Table
Capturing Application Protocol Data from the Application Table
Viewing Real-Time Data from the Application Table
Viewing Reports from the Applications Table
Viewing the Top N Applications Chart
Viewing the Applications Cumulative Data Table
Displaying Details from the Applications Table
Viewing the Voice Protocol Overview
Displaying Protocol Details From the Aggregate Statistics Table
Displaying Phone Details From the Known Phones Table
Displaying Call Details From the Active Calls Table
Viewing the Network Hosts Current Rates Table
Capturing Network Host Data from the Network Host Table
Viewing Real-Time Traffic Statistics from the Hosts Table
Viewing Reports from the Network Hosts Table
Viewing the Network Hosts Top N Chart
Viewing the Network Hosts Cumulative Data Table
Viewing the MAC Stations Current Rates Table
Viewing the MAC Stations Top N Chart
Viewing the MAC Stations Cumulative Data Table
Viewing the Network Host Conversations Current Rates Table
Viewing Network Host Conversation Details
Capturing Network Host Conversation Data from the Network Host Conversations Table
Viewing Real-Time Traffic Statistics from the Network Host Conversations Table
Viewing Reports from the Network Host Conversations Table
Viewing the Network Host Conversations Top N Chart
Viewing the Network Host Conversations Cumulative Data Table
Viewing Network Host Conversation Details
Viewing the MAC Station Conversations Current Rates Table
Viewing the MAC Conversations Top N Chart
Viewing the MAC Station Conversations Cumulative Data Table
Viewing the VLAN Traffic Statistics Current Rates Table
Viewing Reports from the VLAN Traffic Statistics Table
Viewing the VLAN Traffic Statistics Top N Chart
Viewing VLAN Traffic Statistics Cumulative Data Table
Viewing the VLAN Priority (COS) Statistics Current Rates Table
Viewing the VLAN Priority (COS) Statistics Top N Chart
Viewing the VLAN Priority (COS) Statistics Cumulative Data Table
Viewing the DiffServ Traffic Statistics Current Rates Table
Viewing Real-Time Traffic Statistics from the DiffServ Traffic Statistics Table
Viewing Reports from the DiffServ Traffic Statistics Table
Viewing the DiffServ Traffic Top N Chart
Viewing the DiffServ Traffic Statistics Cumulative Data Table
Viewing the DiffServ Application Statistics Current Rates Table
Displaying Application Conversation Details From Application Statistics Table
Viewing Real-Time Traffic Statistics from the DiffServ Application Statistics Table
Viewing Reports from the DiffServ Application Statistics Table
Viewing the DiffServ Application Statistics Top N Chart
Viewing the DiffServ Application Statistics Cumulative Data Table
Viewing the DiffServ Host Statistics Current Rates Table
Displaying Host Conversation Details From the DiffServ Host Statistics Table
Viewing Real-Time Data from the DiffServ Host Statistics Table
Viewing Reports from the DiffServ Host Statistics Table
Viewing the DiffServ Host Statistics Top N Chart
Viewing the DiffServ Host Statistics Cumulative Data Table
Viewing the Server Response Time Table
Viewing Server Response Time Details
Capturing Server Protocol Data from the Server Response Time Table
Viewing Reports from the Server Response Time Table
Viewing the Server Response Time Top N Chart
Viewing the Client/Server Response Time Table
Viewing Client/Server Response Time Details
Capturing Protocol Data from the Client/Server Response Time Table
Viewing Reports from the Client/Server Response Time Table
Viewing the Client/Server Response Time Top N Chart
Viewing Port/Interface Statistics Data
Viewing the Port Stats Current Rates Table
Viewing the Interface Stats Current Rates Table
Viewing Port/Interface Details
Viewing Real-Time Traffic Data from the Port/Interface Stats Table
Viewing Reports from the Port/Interface Stats Table
Viewing the Top N Port Stats Chart
Viewing the Top N Interface Stats Chart
Viewing the Port Stats Cumulative Data Table
Viewing the Interface Stats Cumulative Data Table
Monitoring Data
The Monitor tab provides options for viewing various types of monitored data. There are options for:
•
Viewing the Monitor Overview Charts

Note
•
•
Overview of Data Collection and Data Sources
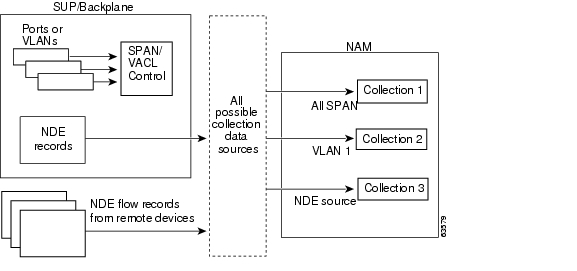
All statistics and monitoring data produced by the NAM are generated by various types of collections. A collection operates on a stream of packets and produces output based on the input stream. In most cases, a collection corresponds directly to MIB tables such as RMON or SMON.
The Collection Definitions table (Table 4-1) defines the different collection types.
The stream of packets on which a collection operates is called the collection data source. It might be different for each collection. The data produced by a collection is called the collection data.
Note
The NAM can support simultaneous combinations of different collections, each operating on different collection data sources.
•
•
Configuring Multiple Collections
You can configure multiple collections (such as host, conversation, protocol, ART, and voice) simultaneously on the NAM. Collections are always configured on separate data sources.
Associated with each collection is a specific collection data source that might or might not correspond directly with the SPAN/VACL traffic stream that was configured. Examples of collection data sources include:
•
•
VLAN (VLAN x).•
Note
•
Individual collection instances process only those packets in the traffic streams that correspond to their configured data sources. For example, a host collection configured with a data source of VLAN 12 will not be populated with any received NDE flow records. Nor will it be populated with packets in the SPAN/VACL traffic stream that are not tagged for VLAN 12.
Similarly, a conversation collection configured with a data source specifying NDE records from a remote router will not be populated with any packets arriving in the SPAN/VACL traffic stream.
Scenario
You configured the SPAN/VACL traffic stream source to include VLANs 1, 2, and 3. You now want to start an application collection that counts the packets and bytes monitored for each application protocol.
You must specify a collection data source for this collection. The data source could be VLAN 1, VLAN 2, or VLAN 3, or any combination of the three.
If you configure the data source as VLAN 2, the collection generates statistics for those packets received on VLAN 2. However, if you were to specify VLAN 10 as the collection data source, even if VLAN 10 were a valid VLAN ID, the collection would never get populated with data because VLAN 10 was not configured as part of the SPAN/VACL traffic stream.
Note
Each possible collection data source is represented as an ifEntry in the NAM ifTable (MIB-II). The Data Collection Sources table (Table 4-2) describes the valid collection data sources.
The SPAN, VACL, NDE Traffic Streams and Collection Data Sources illustration (Figure 4-1) shows the relationships between SPAN and NDE data sources and collection data sources.
Figure 4-1 SPAN, VACL, NDE Traffic Streams and Collection Data Sources
You can view real-time data from collections that were configured on the NAM. For more information on setting up collections on the NAM, see the "Configuring Capture Settings" section.
Protocol Auto Discovery
Traffic Analyzer can automatically discover up to 100 unknown protocols. The protocols are displayed according to the parent type and an identifier.
The Auto-Discovered Protocol Types table (Table 4-3) lists the type of protocols that can be automatically discovered and how they are displayed.
Note
You can also clear the auto-discovered protocols without rebooting by entering the command no monitor protocol auto-learned in the NAM CLI.
NDE Flow Masks and V8 Aggregation Caches
Depending on the flow mask or aggregation configured at the device, some data fields might not be available in the NDE data structure. As a result, some windows will not display data for a NetFlow data source or will display specific conditions. The Flow Mask and Aggregation Window Conditions table (Table 4-4) lists the display conditions for the windows under the Monitor tab and the flow-mask or aggregation that causes them.
Viewing the Monitor Overview Charts
The Monitor Overview charts allow you to take a quick look, in graphical format, at the TopN protocol suites, active hosts, active applications, and application response times monitored on your network. To view the Monitor Overview charts, click the Monitor tab.
The following charts are displayed:
•
•
•
•
Figure 4-2 Most Active Applications Chart
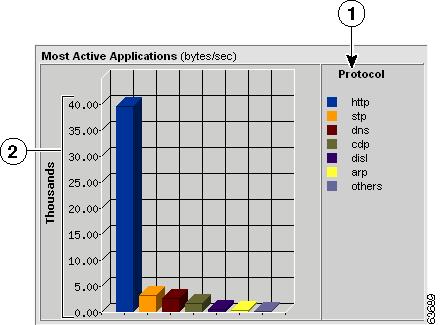
Figure 4-3 Most Active Hosts Chart
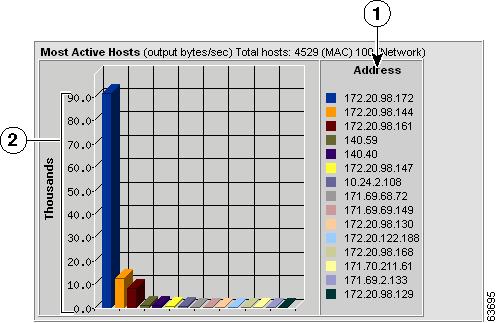
Figure 4-4 Server Response Times Chart
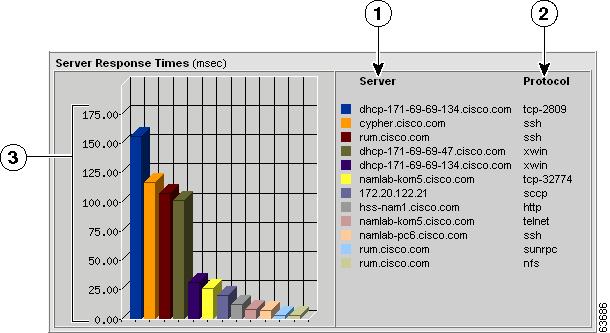
Figure 4-5 Protocol Suites Chart
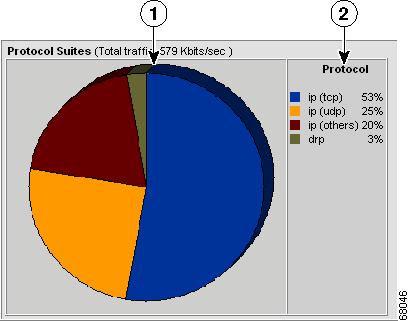
Viewing Application Data
To view the distribution of packets and bytes based on the application protocol, click the Monitor tab, then click Apps. The Applications table is displayed with three radio buttons on top.
You can select a radio button for:
•
•
•
Viewing the Applications Current Rates Table
The Applications Current Rates table allows you to view the number of packets and bytes collected for each application protocol. The data displayed is the number of packets and bytes collected per second over the last time interval. For information on setting the time interval, see the "Setting Global Preferences for All Users" section.
Note
Step 1
The Applications Current Rates Table (Table 4-5) is displayed.
Table 4-5 Applications Current Rates Table
Protocol
Name of the application protocol.
Packets/s
Number of packets collected per second.
Bytes/s
Number of bytes collected per second.
Step 2
Step 3
Any matching protocols are displayed.

Tip
Tip
Displaying Details from the Applications Table
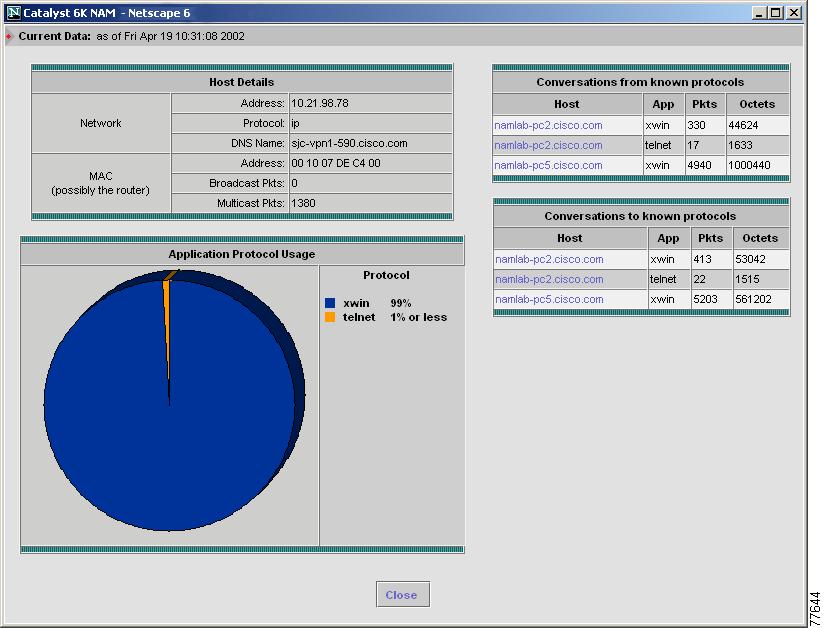
To view details for a specific application protocol, select the protocol and click Details, or click on the protocol name in the Protocol column. The Application Protocol Detail Window (Figure 4-6) is displayed, showing all network hosts using this protocol. The displayed data is specific to the selected data source.
Figure 4-6 Application Protocol Detail Window
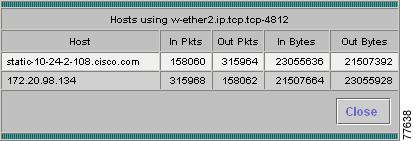
The Applications Protocol Detail Window displays the following information.
Capturing Application Protocol Data from the Application Table
You can capture data for a specific application protocol directly from the Application table.
Select the protocol from the table, then click Capture. The Packet Browser is displayed. For more information on viewing packets using the Packet Browser, see the "Viewing Protocol Decode Information" section.
If a capture is already running, a message window is displayed. Click Yes to stop the current capture or No to disregard your selection.
Viewing Real-Time Data from the Application Table
You can view real-time data in a graphical format for a specific application protocol.
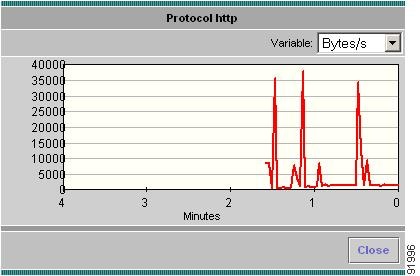
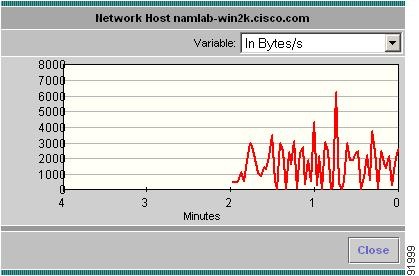
Select the protocol from the table, then click Real-Time. The Real-Time Graph (Figure 4-7) is displayed.
Figure 4-7 Real-Time Graph
Viewing Reports from the Applications Table
You can view reports directly from the Applications table. Select the application protocol for which to view a report, then click Report. The Basic Reports graph is displayed. If a report is not configured, one will be created based on the selected application and data source.
For more information on viewing and creating reports, see "Creating and Viewing Reports."
Viewing the Top N Applications Chart
The TopN Applications Chart allows you to view the number of packets and bytes collected for the Top N application protocols in a graphical format. The data displayed is the number of packets and bytes collected per second over the last time interval. For information on setting the time interval, see the "Setting Global Preferences for All Users" section.
Step 1
The TopN Applications Chart (Figure 4-8) is displayed.
Figure 4-8 TopN Applications Chart
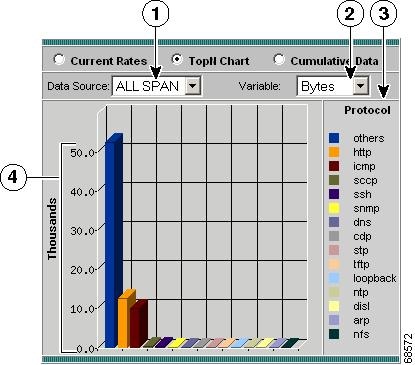
Data Source list.
Top N application protocols.
Variable list.
Number of bytes or packets collected per second on each Top N protocol.
Step 2
Step 3
•
•
Tip
•
Viewing the Applications Cumulative Data Table
The Applications Cumulative Data Table allows you to view the number of packets and bytes collected for each application protocol. The data displayed is the total number of packets and bytes collected since the collection was created or since the NAM was restarted.
Step 1
The Applications Cumulative Data Table (Table 4-7) is displayed.
Step 2
Step 3
Step 4
Any matching protocols are displayed.
Tip
Tip
Displaying Details from the Applications Table
To view details for a specific application protocol, click on the protocol name in the Protocol column. The Protocol Detail Window (Figure 4-9) is displayed.
Figure 4-9 Protocol Detail Window
The Protocol Detail Window displays the following information:
Viewing Voice Data
You can use the NAM Traffic Analyzer to view troubleshooting data collected from any enabled voice protocols on the NAM. This allows you to identify potential problems with your voice network.
There are menu items for:
•
Viewing the Voice Protocol Overview
The Aggregate Statistics table contains basic troubleshooting information for the voice protocols implemented in your network.
Step 1
Step 2
The Aggregate Statistics Table (Table 4-9) is displayed.
Displaying Protocol Details From the Aggregate Statistics Table
To view the voice protocol details window, select the radio button of the protocol name and click Details, or click the protocol name.
The Worst Quality Calls Tables (Table 4-10) are displayed:
•
•
To clear the information in the tables, click Clear.
Viewing Known Phones
You can view basic and detailed information on all known monitored phones in your network.
If you are using MGCP gateways in your network, the MGCP endpoint and endpoint IDs represent the ports of the MGCP gateway that are used to establish connections with the specified call.
Step 1
Step 2
The Aggregate Statistics table is displayed.
Step 3
The Phones Table (Table 4-11) is displayed.
Step 4
Step 5
The specified variable is displayed.
Tip
Displaying Phone Details From the Known Phones Table
To view details for a specific phone, click on the phone number in the Phone column of the Phones table. The Phone Details, Aggregate Statistics, and Last N Calls tables (Table 4-12 through Table 4-14) are displayed.
Displaying Call Details From the Last N Calls Table
To view the details of a specific call from the Last N Calls Table, select the radio button, then click Details.
For phones using SCCP, the SCCP Call Detail Table (Table 4-15) is displayed.
For phones using H.323, the H.323 Call Detail Table (Table 4-16) is displayed.
For phones using MGCP, the MGCP Call Detail Table (Table 4-17) is displayed.
Note
Note
Viewing Active Calls
The Active Calls table displays information for all calls currently being monitored.
Step 1
Step 2
The Aggregate Statistics table is displayed.
Step 3
The Active Calls Table (Table 4-18) is displayed.
Step 4
Step 5
The specified variable is displayed.
Step 6
Tip
Displaying Call Details From the Active Calls Table
To display details of a specific call from the Active Calls table, click the phone number in the Caller Number column. The Active Call Detail window is displayed.
For phones using SCCP, the SCCP Call Detail Table (Table 4-15) is shown.
For phones using H.323, the H.323 Call Detail Table (Table 4-16) is shown.
For phones using MGCP, the MGCP Call Detail Table (Table 4-17) is shown.
Monitoring Hosts Data
You can view results from any active hosts collections in the RMON1 and RMON2 host tables on the NAM.
Step 1
Step 2
The Network Hosts table is displayed with three radio buttons above it. You can select a radio button for:
•
•
•
Step 3
Note
The Mac Stations table is displayed with three radio buttons above it. You can select a radio button for:
•
•
•
Viewing the Network Hosts Current Rates Table
The Network Current Rates table allows you to view the various data collected for each host. The information displayed represents the data collected per second over the last time interval. For information on setting the time interval, see the "Setting Global Preferences for All Users" section.
Step 1
Step 2
The Network Hosts Current Rates Table (Table 4-19) is displayed.
Step 3
Step 4
The specified address is displayed.
Tip
Tip
Viewing Network Host Details
To view details for a specific host, click on the address in the Address column of the Network Hosts table. The Network Hosts Detail Window (Figure 4-10) is displayed.
Figure 4-10 Network Hosts Detail Window
•
•
•
•
Note
Capturing Network Host Data from the Network Host Table
You can capture data for a specific host directly from the Network Host table.
Select the host from the table, then click Capture. The Packet Browser is displayed. For more information on viewing packets using the Packet Browser, see the "Viewing Protocol Decode Information" section.
If a capture is already running, a message window is displayed. Click Yes to stop the current capture or No to disregard your selection.
The Capture button is available only for a subset of reported protocols. For protocols such as IP, IPv6, and GRE, you must set up a custom filter. For more information on setting up custom filters, see the "Creating Custom Capture Filters" section.
Note
Viewing Real-Time Traffic Statistics from the Hosts Table
You can view real-time traffic statistics in a graphical format for a specific host.
Select the host from the table, then click Real-Time. The Real-Time Graph (Figure 4-11) is displayed.
Note
Figure 4-11 Real-Time Graph
Viewing Reports from the Network Hosts Table
You can view reports directly from the Network Hosts table. Select the host for which to view a report, then click Report. The Basic Reports graph is displayed. If a report is not configured, the Basic Reports screen appears and a new report is created for the selected host and data source.
For more information on viewing and creating reports, see "Creating and Viewing Reports."
Viewing the Network Hosts Top N Chart
The Network Hosts Top N Chart allows you to various data for the TopN hosts in a graphical format. The information displayed represents the data collected per second over the last time interval. For information on setting the time interval, see the "Setting Global Preferences for All Users" section.
Step 1
Step 2
The Top N Network Hosts Chart (Figure 4-12) is displayed.
Figure 4-12 Top N Network Hosts Chart
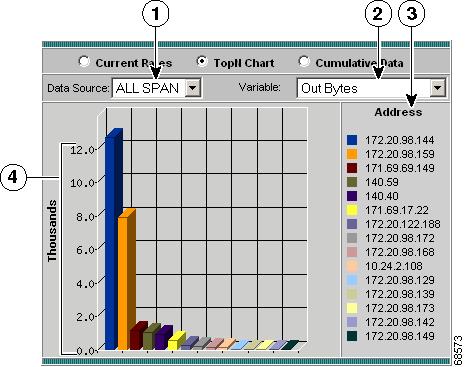
Data Source list.
Top N network host addresses.
Variable list.
Number of packets/bytes input/output per second for each Top N host.
Step 3
Step 4
•
•
•
•
•
Tip
Viewing the Network Hosts Cumulative Data Table
The Network Hosts Cumulative Data Table allows you to view various data collected for each host. The information displayed represents the total data collected since the collection was created or since the NAM was restarted.
Step 1
Step 2
The Network Hosts Cumulative Data Table (Table 4-20) is displayed.
Step 3
Step 4
Any matching addresses are displayed.
Tip
Tip
Viewing the MAC Stations Current Rates Table
Note
The MAC Stations Current Rates table allows you to view the various data collected for each host. The information displayed represents the data collected per second over the last time interval. For information on setting the time interval, see the "Setting Global Preferences for All Users" section.
Step 1
Step 2
The MAC Stations Table (Table 4-21) is displayed.
Step 3
Step 4
The specified address is displayed.
Tip
Tip
Viewing the MAC Stations Top N Chart
Note
The MAC Stations Top N chart allows you to view the various data collected for each host in a graphical format. The information displayed represents the data collected per second over the last time interval. For information on setting the time interval, see the "Setting Global Preferences for All Users" section.
Step 1
Step 2
The Top N MAC Stations Chart (Figure 4-13) is displayed.
Figure 4-13 Top N MAC Stations Chart
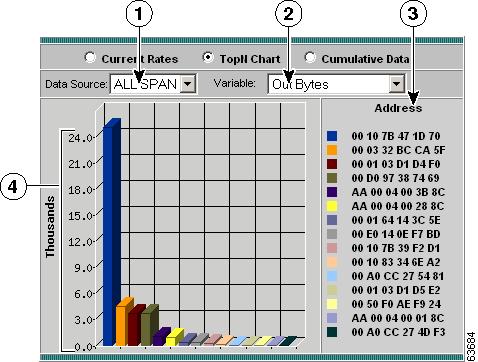
Data Source list.
Top N MAC host addresses.
Variable list.
Number of packets/bytes input/output per second for each Top N host.
Step 3
Step 4
•
•
•
•
•
•
Tip
Viewing the MAC Stations Cumulative Data Table
Note
The MAC Stations Cumulative Data Table allows you to view the various data collected for each host. The information displayed represents the total data collected since the collection was created or since the NAM was restarted.
Step 1
Step 2
The MAC Stations Cumulative Data Table (Table 4-21) is displayed.
Step 3
Step 4
The specified address is displayed.
Tip
Tip
Viewing Conversations Data
You can view conversations data collected on the NAM. Conversations data represents the number of packets and bytes collected between two hosts.
Step 1
Step 2
The Network Hosts Conversations table is displayed with three radio buttons above it. You can select a radio button for:
•
•
•
Step 3
Note
The MAC Station Conversations table is displayed with three radio buttons above it. You can select a radio button for:
•
•
•
Viewing the Network Host Conversations Current Rates Table
The Network Host Conversations Current Rates table allows you to view the number of packets and bytes collected for each host conversation. The data displayed is the number of packets and bytes collected per second over the last time interval. For information on setting the time interval, see the "Setting Global Preferences for All Users" section.
Step 1
Step 2
The Network Host Conversations Current Rates Table (Table 4-23) is displayed.
Step 3
Step 4
Step 5
Any matching source or destination addresses are displayed.
Tip
Tip
Viewing Network Host Conversation Details
To view conversation details for a specific network conversation, click the network address in the Source or Destination column. The following tables are displayed:
•
•
•
•
Note
Capturing Network Host Conversation Data from the Network Host Conversations Table
You can capture data for a specific network host conversation directly from the Network Host Conversations table.
Select the conversation from the table, then click Capture. The Packet Browser is displayed. For more information on viewing packets using the Packet Browser, see the "Viewing Protocol Decode Information" section.
If a capture is already running, a message window is displayed. Click Yes to stop the current capture or No to disregard your selection.
The Capture button is available only for a subset of reported protocols. For protocols such as IP, IPv6, and GRE, you must set up a custom filter. For more information on setting up custom filters, see the "Creating Custom Capture Filters" section.
Note
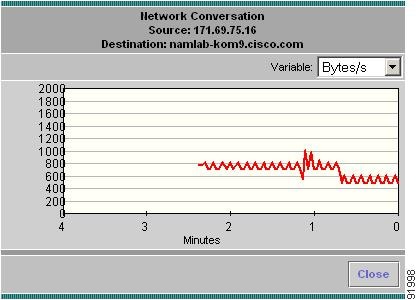
Viewing Real-Time Traffic Statistics from the Network Host Conversations Table
You can view real-time traffic statistics in a graphical format for a specific host conversation.
Select the conversation from the table, then click Real-Time. The Real-Time Graph (Figure 4-11) is displayed.
Note
Figure 4-14 Real-Time Graph
Viewing Reports from the Network Host Conversations Table
You can view reports directly from the Network Hosts Conversations table. Select the conversation you wish to view a report on, then click Report. The Basic Reports graph is displayed. If a report is not configured, the Basic Reports screen appears and a new report is created for the selected host and data source.
For more information on viewing and creating reports, see "Creating and Viewing Reports."
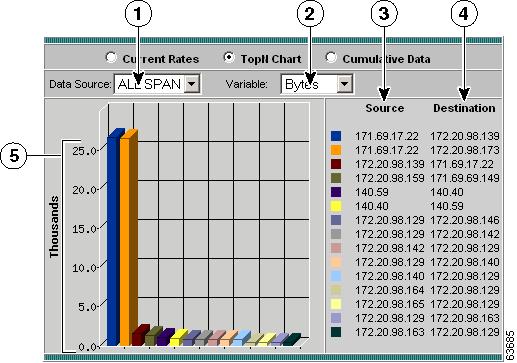
Viewing the Network Host Conversations Top N Chart
The Top N Network Host Conversations Chart allows you to view the number of packets and bytes collected for the Top N network host conversations in a graphical format. The data displayed is the number of packets and bytes collected per second over the last time interval. For information on setting the time interval, see the "Setting Global Preferences for All Users" section.
Step 1
Step 2
The Top N Network Host Conversations Chart(Figure 4-15) is displayed.
Figure 4-15 Top N Network Host Conversations Chart
Data Source list.
Top N destination network addresses.
Variable list.
Number of packets or bytes collected per second.
Top N source network addresses.
Step 3
Step 4
•
•
Tip
Viewing the Network Host Conversations Cumulative Data Table
The Network Host Conversations Cumulative Data Table allows you to view the number of packets and bytes collected for each host conversation. The data displayed is the total number of packets and bytes collected since the collection was created or since the NAM was restarted.
Step 1
Step 2
The Network Host Conversations Cumulative Data Table (Table 4-24) is displayed.
Step 3
Step 4
The specified address is displayed.
Step 5
Tip
Viewing Network Host Conversation Details
To view conversation details for a specific network conversation, click the network address in the Source or Destination column. The following tables are displayed:
•
•
•
•
Viewing the MAC Station Conversations Current Rates Table
Note
The MAC Station Conversations Current Rates table allows you to view the number of packets and bytes collected for each host conversation. The data displayed is the number of packets and bytes collected per second over the last time interval. For information on setting the time interval, see the "Setting Global Preferences for All Users" section.
Step 1
Step 2
The MAC Station Conversations Current Rates Table (Table 4-25) is displayed.
Step 3
Step 4
Any matching addresses are displayed.
Tip
Viewing the MAC Conversations Top N Chart
Note
The Top N MAC Station Conversations Chart allows you to view the number of packets and bytes collected for the Top N MAC station conversations in a graphical format. The data displayed is the number of packets and bytes collected per second over the last time interval. For information on setting the time interval, see the "Setting Global Preferences for All Users" section.
Step 1
Step 2
The Top N MAC Station Conversations Chart (Figure 4-16) is displayed.
Figure 4-16 Top N MAC Station Conversations Chart
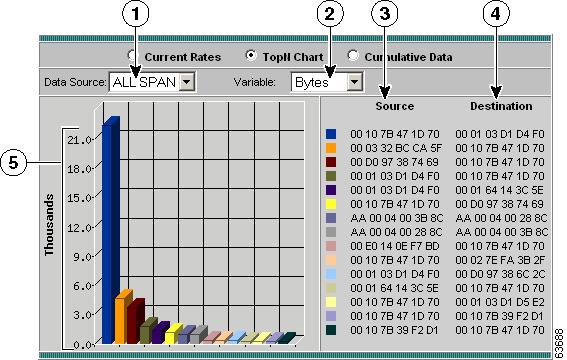
Data Source list.
Top N destination MAC addresses.
Variable list.
Number of packets, bytes, or errors collected per second.
Top N source MAC addresses.
Step 3
Step 4
•
•
•
Tip
Viewing the MAC Station Conversations Cumulative Data Table
Note
The MAC Station Conversations Cumulative Data Table allows you to view the number of packets and bytes collected for each MAC station conversation. The data displayed is the total number of packets and bytes collected since the collection was created or since the NAM was restarted.
Step 1
Step 2
The MAC Station Conversations Cumulative Data Table (Table 4-26) is displayed.
Step 3
Step 4
The specified address is displayed.
Step 5
Tip
Viewing VLAN Data
Note
You can view VLAN traffic statistics or VLAN priority (COS) statistics collected on the NAM. Supervisor engine module collections are done independent of any collections done on the NAM.
Note
Step 1
Step 2
The VLAN Traffic Statistics table is displayed with three radio buttons above it. You can select a radio button for:
•
•
•
Step 3
The VLAN Priority (COS) Statistics table is displayed with three radio buttons above it. You can select a radio button for:
•
•
•
Viewing the VLAN Traffic Statistics Current Rates Table
Note
The VLAN Traffic Statistics Current Rates table allows you to view various data collected for each VLAN ID. The information displayed represents the data collected per second over the last time interval. For information on setting the time interval, see the "Setting Global Preferences for All Users" section.
To view the VLAN Traffic Statistics Current Rates table, click the Current Rates radio button.
The VLAN Traffic Statistics Table (Table 4-27) is displayed.
Tip
Tip
Viewing Reports from the VLAN Traffic Statistics Table
You can view reports directly from the VLAN Traffic Statistics table. Select the VLAN ID you wish to view a report on, then click Report. The Basic Reports graph is displayed. If a report is not configured, the Basic Reports screen appears and a new report is created for the selected VLAN and data source.
For more information on viewing and creating reports, see "Creating and Viewing Reports."
Viewing the VLAN Traffic Statistics Top N Chart
Note
The Top N VLAN Traffic Statistics Chart allows you to view the various data collected for the top N VLAN IDs in a graphical format. The information displayed represents the data collected per second over the last time interval. For information on setting the time interval, see the "Setting Global Preferences for All Users" section.
Step 1
The Top N VLAN Traffic Statistics Chart (Figure 4-17) is displayed.
Figure 4-17 Top N VLAN Traffic Statistics Chart
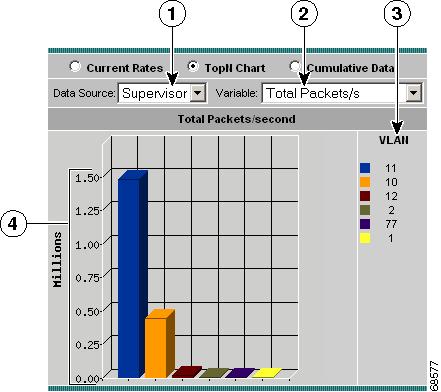
Data source list.
Top N VLAN IDs.
Variable list.
Number of packets/bytes collected per second.
Step 2
Step 3
•
•
•
•
Tip
Viewing VLAN Traffic Statistics Cumulative Data Table
Note
The VLAN Traffic Statistics Cumulative Data table allows you to view various data collected for each VLAN ID. The information displayed represents the total data collected since the collection was created or since the NAM was restarted.
To view the VLAN Traffic Statistics Cumulative Data table, click the Cumulative Data Table radio button.
The VLAN Traffic Statistics Cumulative Data Table (Table 4-28) is displayed.
Tip
Viewing the VLAN Priority (COS) Statistics Current Rates Table
Note
The VLAN Priority (COS) Statistics Current Rates table allows you to view user priority distributions per data source. The displayed information represents the data collected each second during the last time interval. For information on setting the time interval, see the "Setting Global Preferences for All Users" section.
Step 1
The VLAN Priority (COS) Statistics Current Rates Table (Table 4-29) is displayed.
Step 2
Tip
Tip
Viewing the VLAN Priority (COS) Statistics Top N Chart
Note
The Top N VLAN Priority (COS) Statistics Chart allows you to view user priority distributions per data source in a graphical format. The information displayed represents the data collected per second over the last time interval. For information on setting the time interval, see the "Setting Global Preferences for All Users" section.
Step 1
Step 2
The Top N VLAN Priorities (COS) Statistics Chart(Figure 4-18) is displayed.
Figure 4-18 Top N VLAN Priorities (COS) Statistics Chart
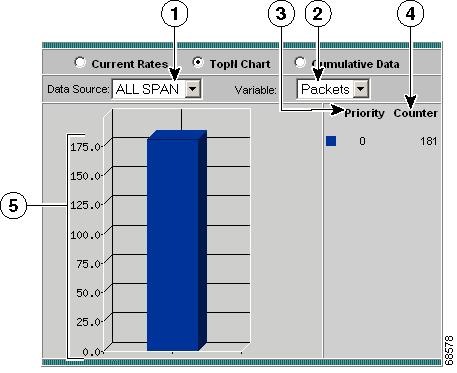
Data Source list.
VLAN counter.
Variable list.
Number of packets/bytes collected per second.
Top N VLAN priorities.
Step 3
Step 4
•
•
Tip
Viewing the VLAN Priority (COS) Statistics Cumulative Data Table
Note
The VLAN Priority (COS) Statistics Cumulative Data table allows you to view user priority distributions per data source. The information displayed represents the total data collected since the collection was created or since the NAM was restarted. For information on setting the time interval, see the "Setting Global Preferences for All Users" section.
Step 1
Step 2
The VLAN Priority (COS) Statistics Cumulative Data Table (Table 4-30) is displayed.
Step 3
Tip
Viewing DiffServ Data
You can view the distribution of packets and bytes based on the Differential Services (DiffServ) data collected on the NAM.
Note
Step 1
Step 2
The DiffServ Traffic Statistics table is displayed with three radio buttons above it. You can select a radio button for:
•
•
•
Step 3
The DiffServ Applications Statistics table is displayed with three radio buttons above it. You can select a radio button for:
•
•
•
Step 4
The DiffServ Host Statistics table is displayed with three radio buttons above it.
You can select a radio button for:
•
•
•
Viewing the DiffServ Traffic Statistics Current Rates Table
Step 1
Step 2
The DiffServ Traffic Statistics Current Rates Table (Table 4-31) is displayed.
Step 3
Step 4
The specified aggregation group is displayed.
Tip
Tip
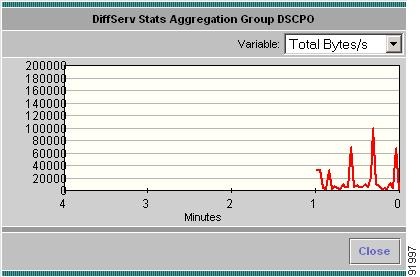
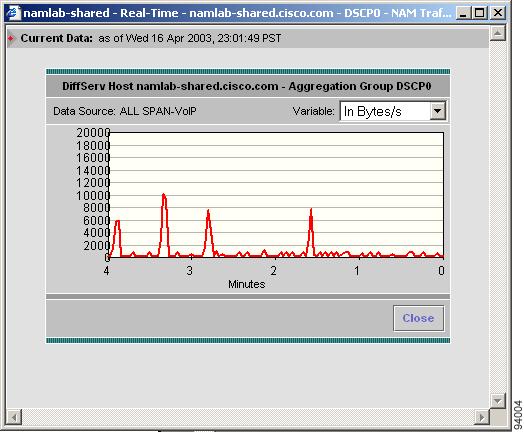
Viewing Real-Time Traffic Statistics from the DiffServ Traffic Statistics Table
You can view real-time traffic statistics in a graphical format for a specific aggregation group in the DiffServ Traffic Statistics table.
Select the aggregation group from the table, then click Real-Time. The Real-Time Graph (Figure 4-11) is displayed.
Note
Figure 4-19 Real-Time Graph
Viewing Reports from the DiffServ Traffic Statistics Table
You can view reports directly from the DiffServ Traffic Statistics table. Select the aggregation group you wish to view a report on, then click Report. The Basic Reports graph is displayed. If a report is not configured, the Basic Reports screen appears and a new report is created for the selected data source.
For more information on viewing and creating reports, see "Creating and Viewing Reports."
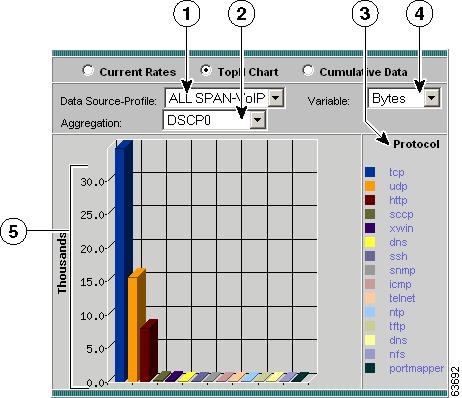
Viewing the DiffServ Traffic Top N Chart
Step 1
Step 2
The Top N DiffServ Aggregation Group Chart (Figure 4-20) is displayed.
Figure 4-20 Top N DiffServ Aggregation Group Chart
Data Source-Profile list.
Variable list.
Top N aggregation groups.
Number of packets/bytes collected per second.
Step 3
Step 4
•
•
Tip
Viewing the DiffServ Traffic Statistics Cumulative Data Table
Step 1
Step 2
The DiffServ Traffic Statistics Cumulative Data (Table 4-32) is displayed.
Step 3
Step 4
The specified aggregation group is displayed.
Tip
Tip
Viewing the DiffServ Application Statistics Current Rates Table
Step 1
Step 2
The DiffServ Application Statistics Current Rates(Table 4-33) is displayed.
Step 3
Step 4
Step 5
click Filter.The specified protocol is displayed.
Tip
Tip
Tip
Displaying Application Conversation Details From Application Statistics Table
To view the Application Conversations details table, click the protocol name in the Protocol Name column. The Application Conversations Table (Table 4-34) is displayed.
Tip
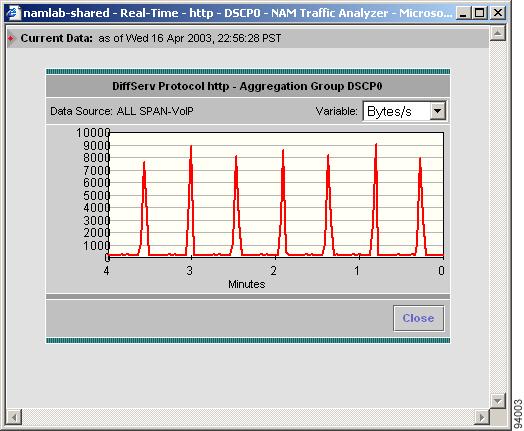
Viewing Real-Time Traffic Statistics from the DiffServ Application Statistics Table
You can view real-time traffic statistics in a graphical format for a specific application protocol in the DiffServ Application Statistics table.
Select the application protocol from the table, then click Real-Time. The Real-Time Graph (Figure 4-11) is displayed.
Note
Figure 4-21 Real-Time Graph
Viewing Reports from the DiffServ Application Statistics Table
You can view reports directly from the DiffServ Application Statistics table. Select the application protocol you wish to view a report on, then click Report. The Basic Reports graph is displayed. If a report is not configured, the Basic Reports screen appears and a new report is created for the selected application and data source.
For more information on viewing and creating reports, see "Creating and Viewing Reports."
Viewing the DiffServ Application Statistics Top N Chart
Step 1
Step 2
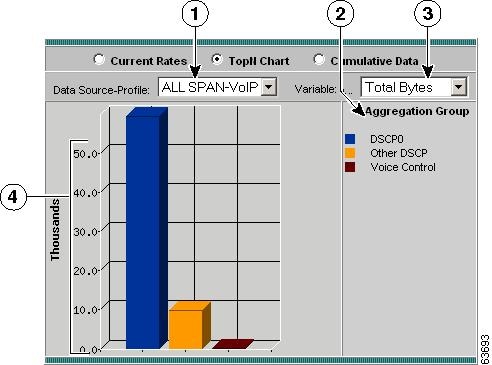
The Top N DiffServ Application Statistics Chart (Figure 4-22) is displayed.
Figure 4-22 Top N DiffServ Application Statistics Chart
Data Source-Profile list.
Variable list.
Aggregation group list.
Total packets/bytes collected per second for each protocol.
Top N protocols sorted by color.
Step 3
Step 4
Step 5
•
•
Tip
To view the full protocol name, move the cursor over the protocol name
Viewing the DiffServ Application Statistics Cumulative Data Table
Step 1
Step 2
The DiffServ Application Statistics Cumulative Data Table (Table 4-35) is displayed.
Step 3
Step 4
Step 5
click Filter.The specified protocol is displayed.
Tip
Tip
Tip
Viewing the DiffServ Host Statistics Current Rates Table
Step 1
Step 2
The DiffServ Host Statistics Current Rates Table (Table 4-36) is displayed.
Step 3
Step 4
Step 5
click Filter.The specified address is displayed.
Tip
Tip
Displaying Host Conversation Details From the DiffServ Host Statistics Table
To view the Host Conversations details table, click the address name in the Address column. The Host Conversations Table (Table 4-37) is displayed.
Tip
Viewing Real-Time Data from the DiffServ Host Statistics Table
You can view real-time data in a graphical format for a specific host in the DiffServ Host Statistics table.
Select the host from the table, then click Real-Time. The Real-Time Graph (Figure 4-11) is displayed.
Note
Figure 4-23 Real-Time Graph
Viewing Reports from the DiffServ Host Statistics Table
You can view reports directly from the DiffServ Host Statistics table. Select the host you wish to view a report on, then click Report. The Basic Reports graph is displayed. If a report is not configured, the Basic Reports screen appears and a new report is created for the selected host and data source.
For more information on viewing and creating reports, see "Creating and Viewing Reports."
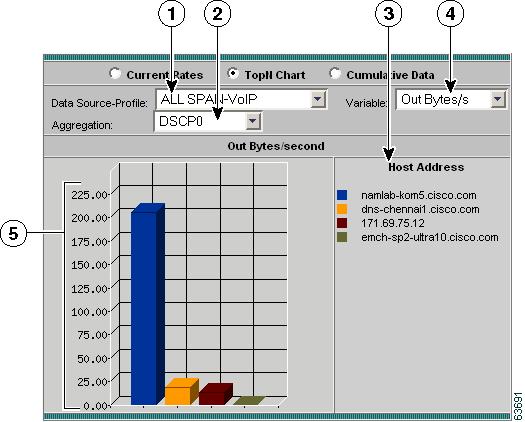
Viewing the DiffServ Host Statistics Top N Chart
Step 1
Step 2
The DiffServ Top N Host Statistics Chart (Figure 4-24) is displayed.
Figure 4-24 DiffServ Top N Host Statistics Chart
Data Source-Profile list.
Variable list.
Aggregation group list.
Total packets/bytes collected per second for each address.
Top N host addresses sorted by color.
Step 3
Step 4
Step 5
•
•
Tip
Viewing the DiffServ Host Statistics Cumulative Data Table
Step 1
Step 2
The DiffServ Host Statistics Cumulative Data Table (Table 4-38) is displayed.
Step 3
Step 4
Step 5
click Filter.The specified address is displayed.
Tip
Tip
Monitoring Response Time Data
Response time data provides TCP response time distributions for TCP protocols. You can view this data for each server or between clients and servers.
Step 1
Step 2
The Response Time Server Table is displayed with two radio buttons above it. You can select a radio button for:
•
•
Step 3
The Client/Server Response Time Table is displayed with two radio buttons above it. You can select a radio button for:
•
•
Viewing the Server Response Time Table
Step 1
The Server Response Time Table (Table 4-39) is displayed.
Step 2
Step 3
Step 4
The specified server addresses or protocol names are displayed.
Tip
To view the full protocol name, move the cursor over the protocol name in the Protocol column of the table.
Viewing Server Response Time Details
To view details for a specific server, click the radio button in the Select column, then click Details. The Response Time Server Detail window is displayed. You can view detailed information from the server as well as a chart displaying the response time distribution.
Capturing Server Protocol Data from the Server Response Time Table
You can capture data from a specific server protocol directly from the Server Response Time table.
Select the server protocol from the table, then click Capture. The Packet Browser is displayed. For more information on viewing packets using the Packet Browser, see the "Viewing Protocol Decode Information" section.
If a capture is already running, a message window is displayed. Click Yes to stop the current capture or No to disregard your selection.
The Capture button is only available for a subset of reported protocols. For protocols such as IP, IPv6, and GRE, you must set up a custom filter. For more information on setting up custom filters, see the "Creating Custom Capture Filters" section.
Note
Viewing Reports from the Server Response Time Table
You can view reports directly from the Server Response Time table. Select the server you wish to view a report on, then click Report. The Basic Reports graph is displayed. If a report is not configured, the Basic Reports screen appears and a new report is created for the selected server and data source.
For more information on viewing and creating reports, see "Creating and Viewing Reports."
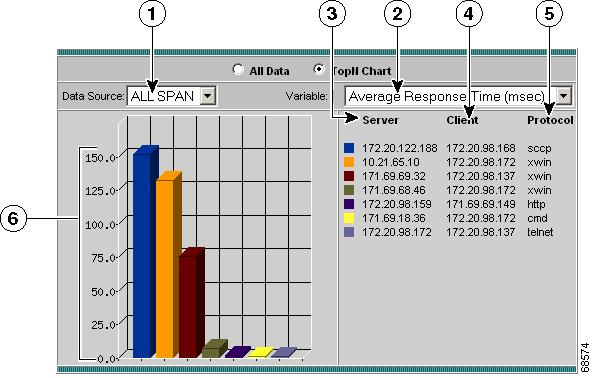
Viewing the Server Response Time Top N Chart
Step 1
The Server Response Time Top N Chart (Figure 4-25) is displayed.
Figure 4-25 Server Response Time Top N Chart
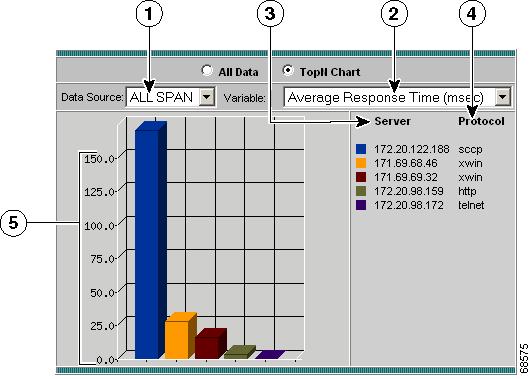
Data Source list.
Protocol used by server.
Variable list.
Variable value displayed per second.
Top N server addresses sorted by color.
Step 2
Step 3
The specified option is displayed in the chart.
Tip
•
Viewing the Client/Server Response Time Table
Step 1
Step 2
The Client/Server Response Time Table(Table 4-40) is displayed.
Step 3
Step 4
Step 5
The specified variable is displayed.
Tip
•
Viewing Client/Server Response Time Details
To view details for a specific client/server conversation, click the radio button in the Select column, and click Details. The Response Time Client/Server Detail window is displayed. You can view detailed information from the client/server conversation as well as a chart displaying the response time distribution.
Capturing Protocol Data from the Client/Server Response Time Table
You can capture data for a specific protocol directly from the Client/Server Response Time table.
Select the server protocol from the table, then click Capture. The Packet Browser is displayed. For more information on viewing packets using the Packet Browser, see the "Viewing Protocol Decode Information" section.
The Capture button is available only for a subset of reported protocols. For protocols such as IP, IPv6, and GRE, you must set up a custom filter. For more information on setting up custom filters, see the "Creating Custom Capture Filters" section.
Note
Viewing Reports from the Client/Server Response Time Table
You can view reports directly from the Client/Server Response Time table. Select the protocol you wish to view a report on, then click Report. The Basic Reports graph is displayed. If a report is not configured, the Basic Reports screen appears and a new report is created for the selected client/server and data source.
For more information on viewing and creating reports, see "Creating and Viewing Reports."
Viewing the Client/Server Response Time Top N Chart
Step 1
Step 2
The Client/Server Response Time Top N Chart (Figure 4-26) is displayed.
Figure 4-26 Client/Server Response Time Top N Chart
Step 3
Step 4
The specified option is displayed in the chart.
Tip
•
Viewing Port/Interface Statistics Data
To view the various data collected for the switch or router, click the Monitor tab, then click Port Stats. For NM-NAM devices, click Interface Stats. The Port/Interface Stats table is displayed with three radio buttons above it.
For Port Stats, you can click a radio button for:
•
•
•
For Interface Stats you can click a radio button for:
•
•
•
Viewing the Port Stats Current Rates Table
The Port Stats Current Rates table allows you to view the various data collected for the switch. The information displayed represents the data collected per second over the last time interval. For information on setting the time interval, see the "Setting Global Preferences for All Users" section.
Step 1
The Port Stats Current Rates Table (Table 4-41) is displayed.
Step 2
The specified port name is displayed.
Tip
Viewing the Interface Stats Current Rates Table
The Interface Stats Current Rates table allows you to view the various data collected for the router. The information displayed represents the data collected per second over the last time interval. For information on setting the time interval, see the "Setting Global Preferences for All Users" section.
Step 1
The Interface Stats Current Rates Table (Table 4-41) is displayed.
Step 2
The specified interface name is displayed.
Viewing Port/Interface Details
To view packet distribution details on a specific port or interface, click the number of the port in the Port Name column or the number of the interface in the Interface column. The detail window displays a chart that shows. the packet distribution per second on the specified port or interface.
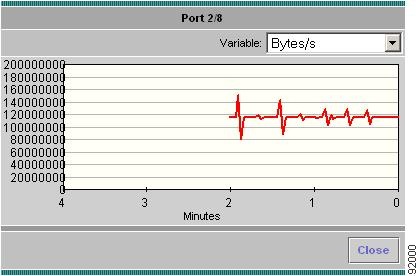
Viewing Real-Time Traffic Data from the Port/Interface Stats Table
You can view real-time data in a graphical format for a specific switch port or interface in the Port Stats or Interface Stats table.
Select the switch port or interface from the table, then click Real-Time. The Real-Time Graph (Figure 4-27) is displayed.
Note
Figure 4-27 Real-Time Graph
Viewing Reports from the Port/Interface Stats Table
You can view reports directly from the Port Stats or Interface Stats table. Select the switch port or interface for which to view a report, then click Report. The Basic Reports graph is displayed. If a report is not configured, the Basic Reports screen appears and a new report is created for the selected port and data source.
For more information on viewing and creating reports, see "Creating and Viewing Reports."
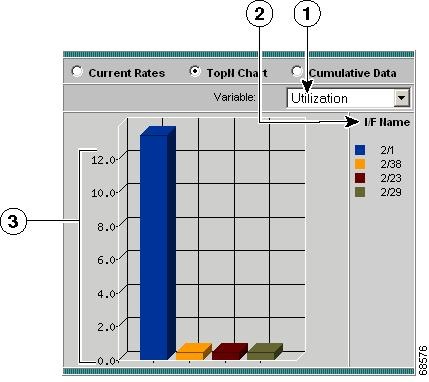
Viewing the Top N Port Stats Chart
The Port Stats Top N Chart allows you to view the various data collected for each port in a graphical format. The information displayed represents the data collected per second over the last time interval.
Step 1
The Top N Port Stats Chart(Figure 4-28) is displayed.
Figure 4-28 Top N Port Stats Chart
Step 2
•
•
•
•
•
•
•
•
•
•
•
•
Tip
Viewing the Top N Interface Stats Chart
The Interface Stats Top N Chart enables you to view the various data collected for each interface in a graphical format. The displayed information represents the data collected per second over the last time interval.
Step 1
The Top N Interface Stats Chart(Figure 4-29) is displayed.
Figure 4-29 Top N Interface Stats Chart
Step 2
•
•
•
•
•
•
•
•
•
•
Tip
Viewing the Port Stats Cumulative Data Table
The Port Stats Cumulative Data table allows you to view the various data collected for the switch. The information displayed represents the total data collected since the collection was created or since the NAM was restarted. For information on setting the time interval, see the "Setting Global Preferences for All Users" section.
Step 1
The Port Stats Cumulative Data Table (Table 4-43) is displayed.
Step 2
Step 3
The specified port name is displayed.
Viewing the Interface Stats Cumulative Data Table
The Interface Stats Cumulative Data table enables you to view the various data collected for the router. The displayed information represents the total data collected since the collection was created or since the NAM was restarted. For information on setting the time interval, see the "Setting Global Preferences for All Users" section.
Step 1
TheInterface Stats Cumulative Data Table (Table 4-44) is displayed.
Step 2
Step 3
The specified interface name is displayed.
Viewing Interface Details
To view packet distribution details on a specific interface, click the interface number in the Interface column. The detail window displays with a chart that shows the total packet distribution on the specified interface.
 Feedback
Contact Cisco
- Open a Support Case

- (Requires a Cisco Service Contract)