View Device Details

The following topics explain how to get more information about your network devices. You can also generate a variety of device reports that provide hardware and software details, CPU and memory utilization, general device health, and so forth. For information on these reports, see Device Reports. For information on inventory collection, see How Is Inventory Collected?.

Find Devices

The quickest way to find a device is to use the quick search text boxes displayed at the top of the Network Devices table (Inventory > Device Management > Network Devices). You can enter partial strings for a device name, IP address, or software version, or choose from the values for reachability, admin status, and inventory collection. If user defined fields have been created, you can also search by user defined field values. Devices are also organized into device groups, which you can view by choosing Inventory > Device Management > Network Devices and selecting a device type from the Device Group list.

Get Basic Device Information: Device 360 View

The Device 360 view is a pop-up window that provides quick information about a device, its inventory, and status. This includes device alarms, modules, interfaces, neighbors, memory utilization, CPU utilization, and chassis.

To launch a Device 360 view:

  • Click the i icon next to an IP address in almost any device table.

  • From the network topology, click a device in an expanded group, then click View 360.

The Device 360 view provides general device and performance information at the top of the view. The information displayed depends on the device type and configuration.

For SVO devices, see Device 360 View - SVO.

Information Provided in Device 360 View

Description

General information and tools

Device type, OS type and version, last configuration change, memory utilization, CPU utilization, and last inventory collection. Icons convey the status of the device.

Note

 
  • If you have opened the Device 360 view for a Cisco NCS 6000 series device that houses a Secure Domain Router (SDR), the SDR's name is also displayed.

  • If you have opened the Device 360 view for a Cisco Catalyst 6500 series device with dual and quad-supervisor Virtual Switching System (VSS), the device's redundancy state, switch mode, and operational redundancy mode are also displayed.

Using the menus in the pop-up window, you can also perform these tasks:

  • Auto-Refresh—For real-time updates of the device status and troubleshooting, enable an on-demand refresh by clicking the Refresh icon. Alternatively, you can set the autorefresh interval to 30 seconds, 1 minute, 2 minutes, or 5 minutes from the drop-down list. Auto-Refresh is OFF by default.

    Note

     
    The Auto-Refresh setting is applicable only for the open 360 view pop-up window. If the view is closed and reopened, or another view is opened, by default Auto-Refresh turns Off.
  • Troubleshoot—Perform a ping or traceroute, or launch the alarm browser (Actions menu).

  • Performance—Check device CPU and memory (View > Performance Graphs).

  • Topology—View the network topology and device's local topology, up to three hops (Actions > > Network Topology menu).

  • Open the Device Console to enter commands you want to run (Actions > Device Console).

  • Collect the device's inventory and save it to the database using Actions > Sync Now.

  • Open an HTTP, HTTPS, SSH, or Telnet session with the device (Actions > Connect To Device).

  • Launch Cisco Transport Controller for optical devices (Actions menu).

  • Enables you to resync the condition of the selected Cisco NCS 2000 series device with severity NA/NR using Resync Conditions (Actions menu).

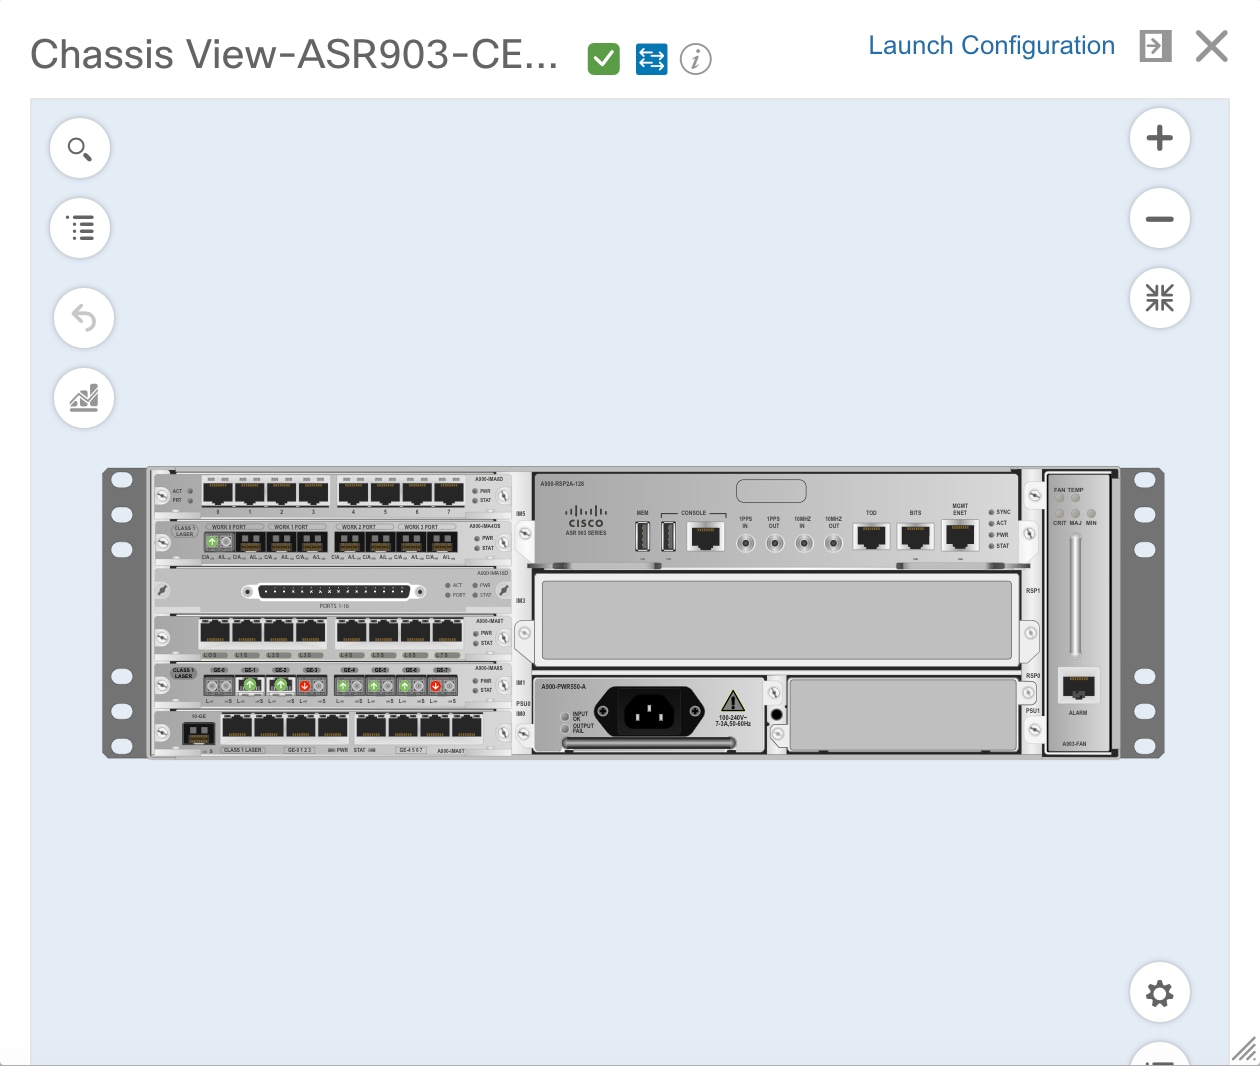
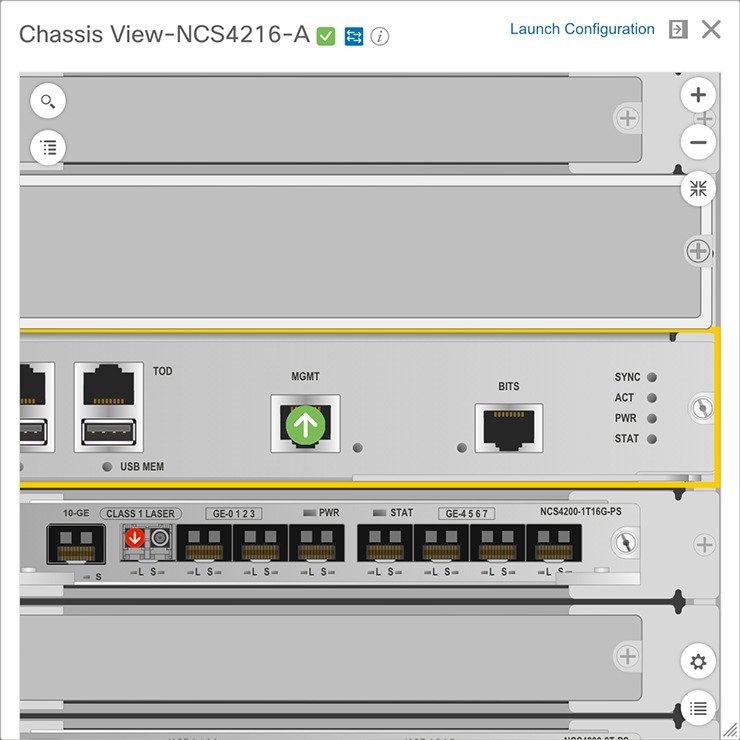
  • Open the Device Details page to view the details about software image and configuration file management, and use the device's Chassis View (by clicking the device IP address hyperlink or choosing View > Chassis View).

  • Open the Configuration page to perform any configuration changes on the device, without navigating from the Device 360 page. Choose View > Configuration.

    Note

     
    This option is available on devices where configuration changes can be performed. For example, Cisco NCS 2000 series devices.
  • Select a device for a side-by-side comparison with another device based on information such as raised alarms and status of circuits, interfaces, and modules (Actions > Add to Compare)—see Compare Device Information and Status.

  • Click Device OAM in the Actions menu to do a ping test or traceroute between two devices. In the Device OAM Commands window, enter the Destination IP. Specifying the Source IP is optional. From the Actions drop-down list, you can either choose a ping test or traceroute.

Performance Graphs

Charts reflecting various aspects of the device performance. If a device has multiple memory pools, the Device 360 view displays the average utilization for all the memory pools. If you want to see information about individual memory pools, use the memory utilization dashlets in the Network Summary dashboard. See Network Summary Dashboard Overview.
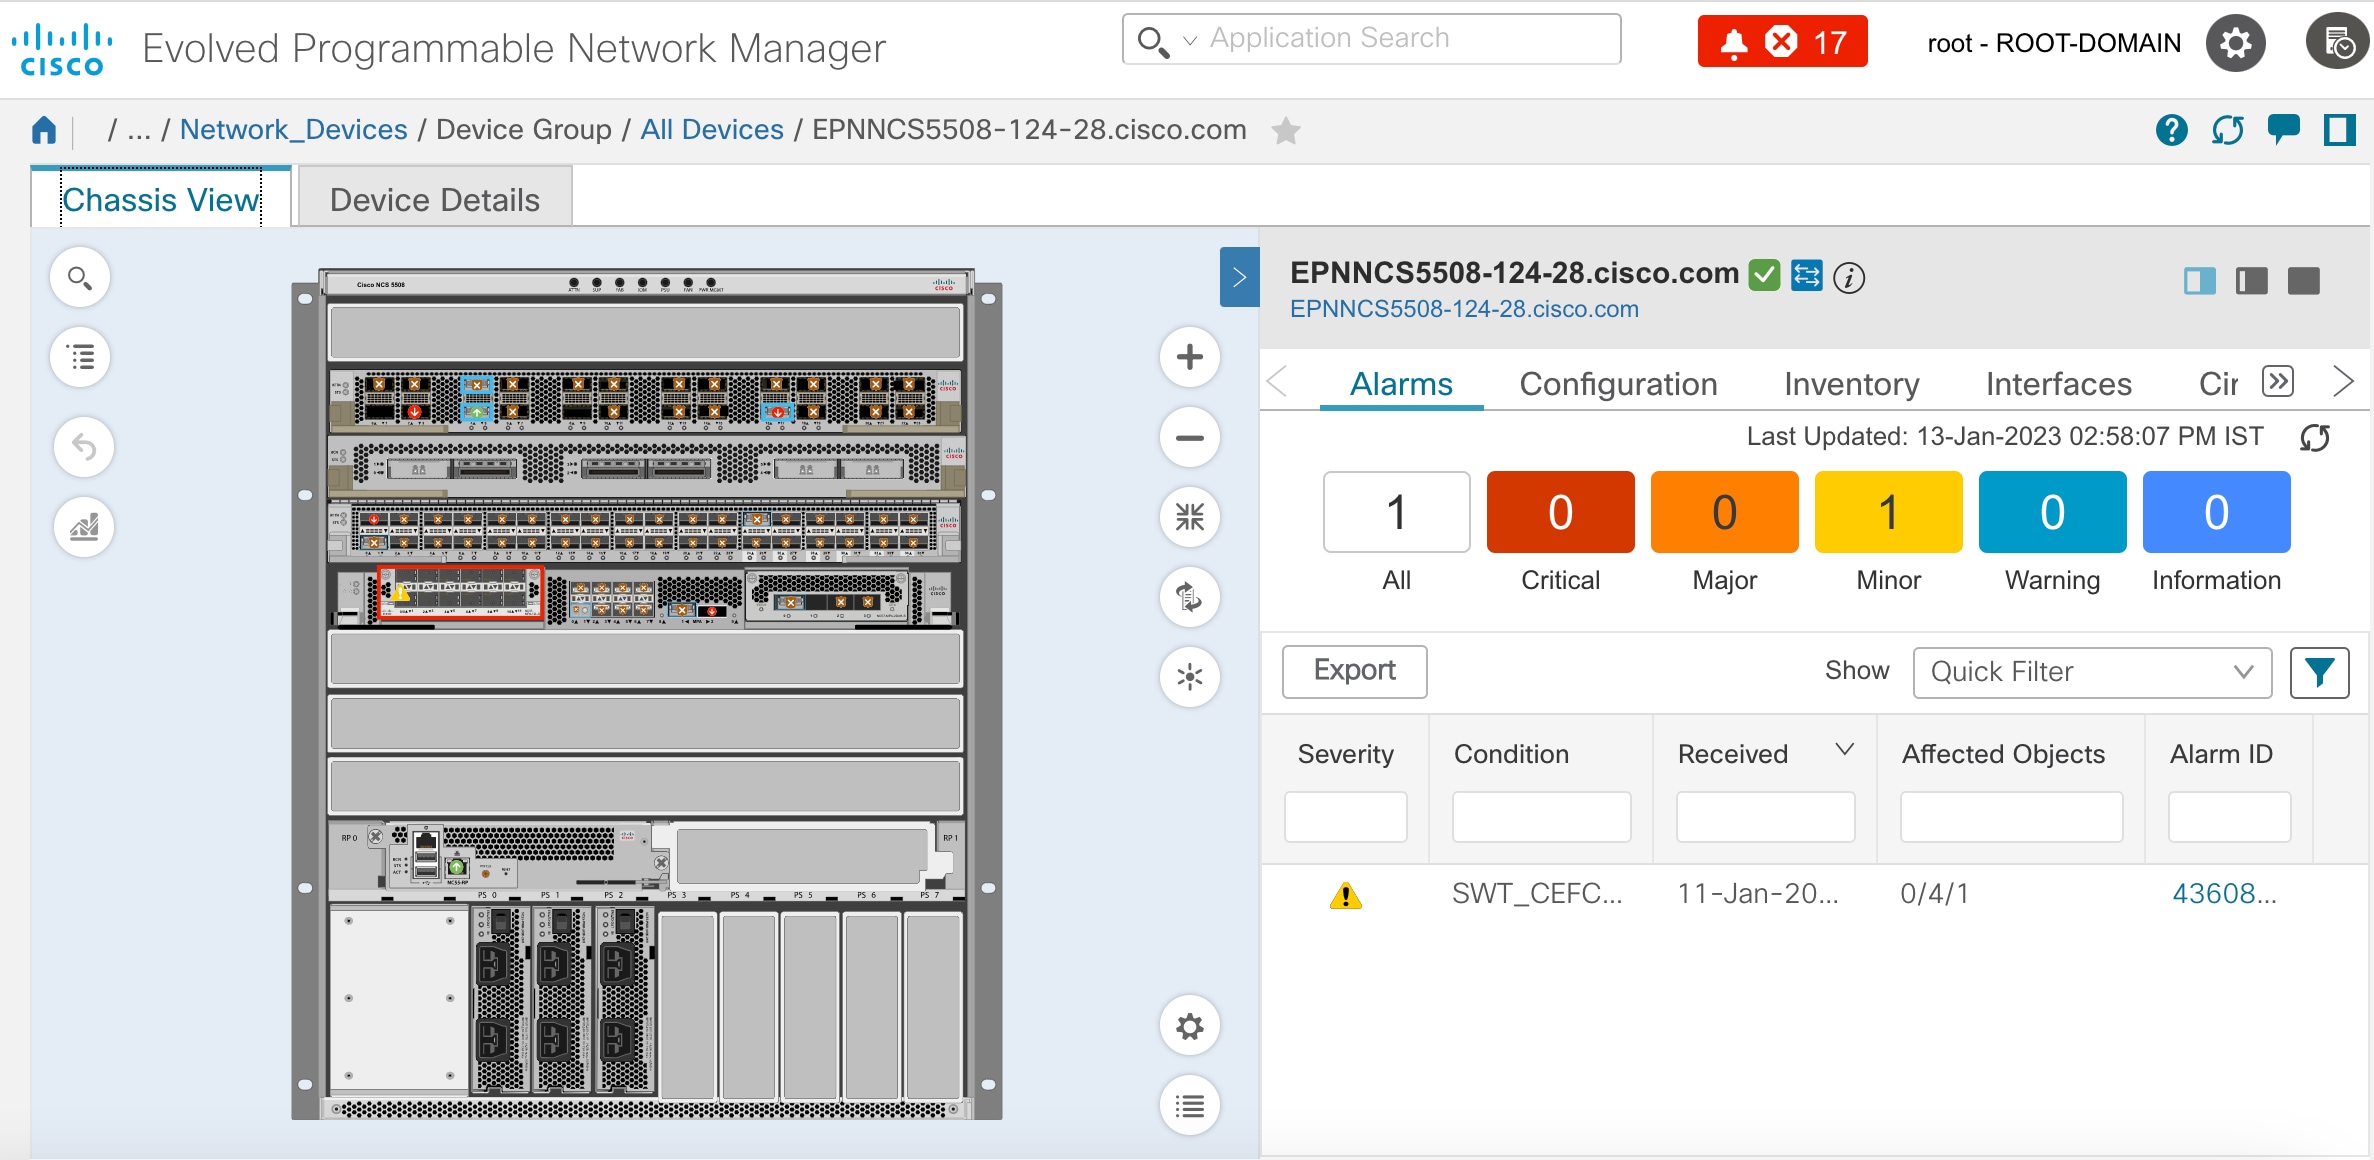
Alarms

Current alarms for the device, including their severity, status, and the time they were generated. Depending on the alarm source, you can also launch other 360 views from this tab.
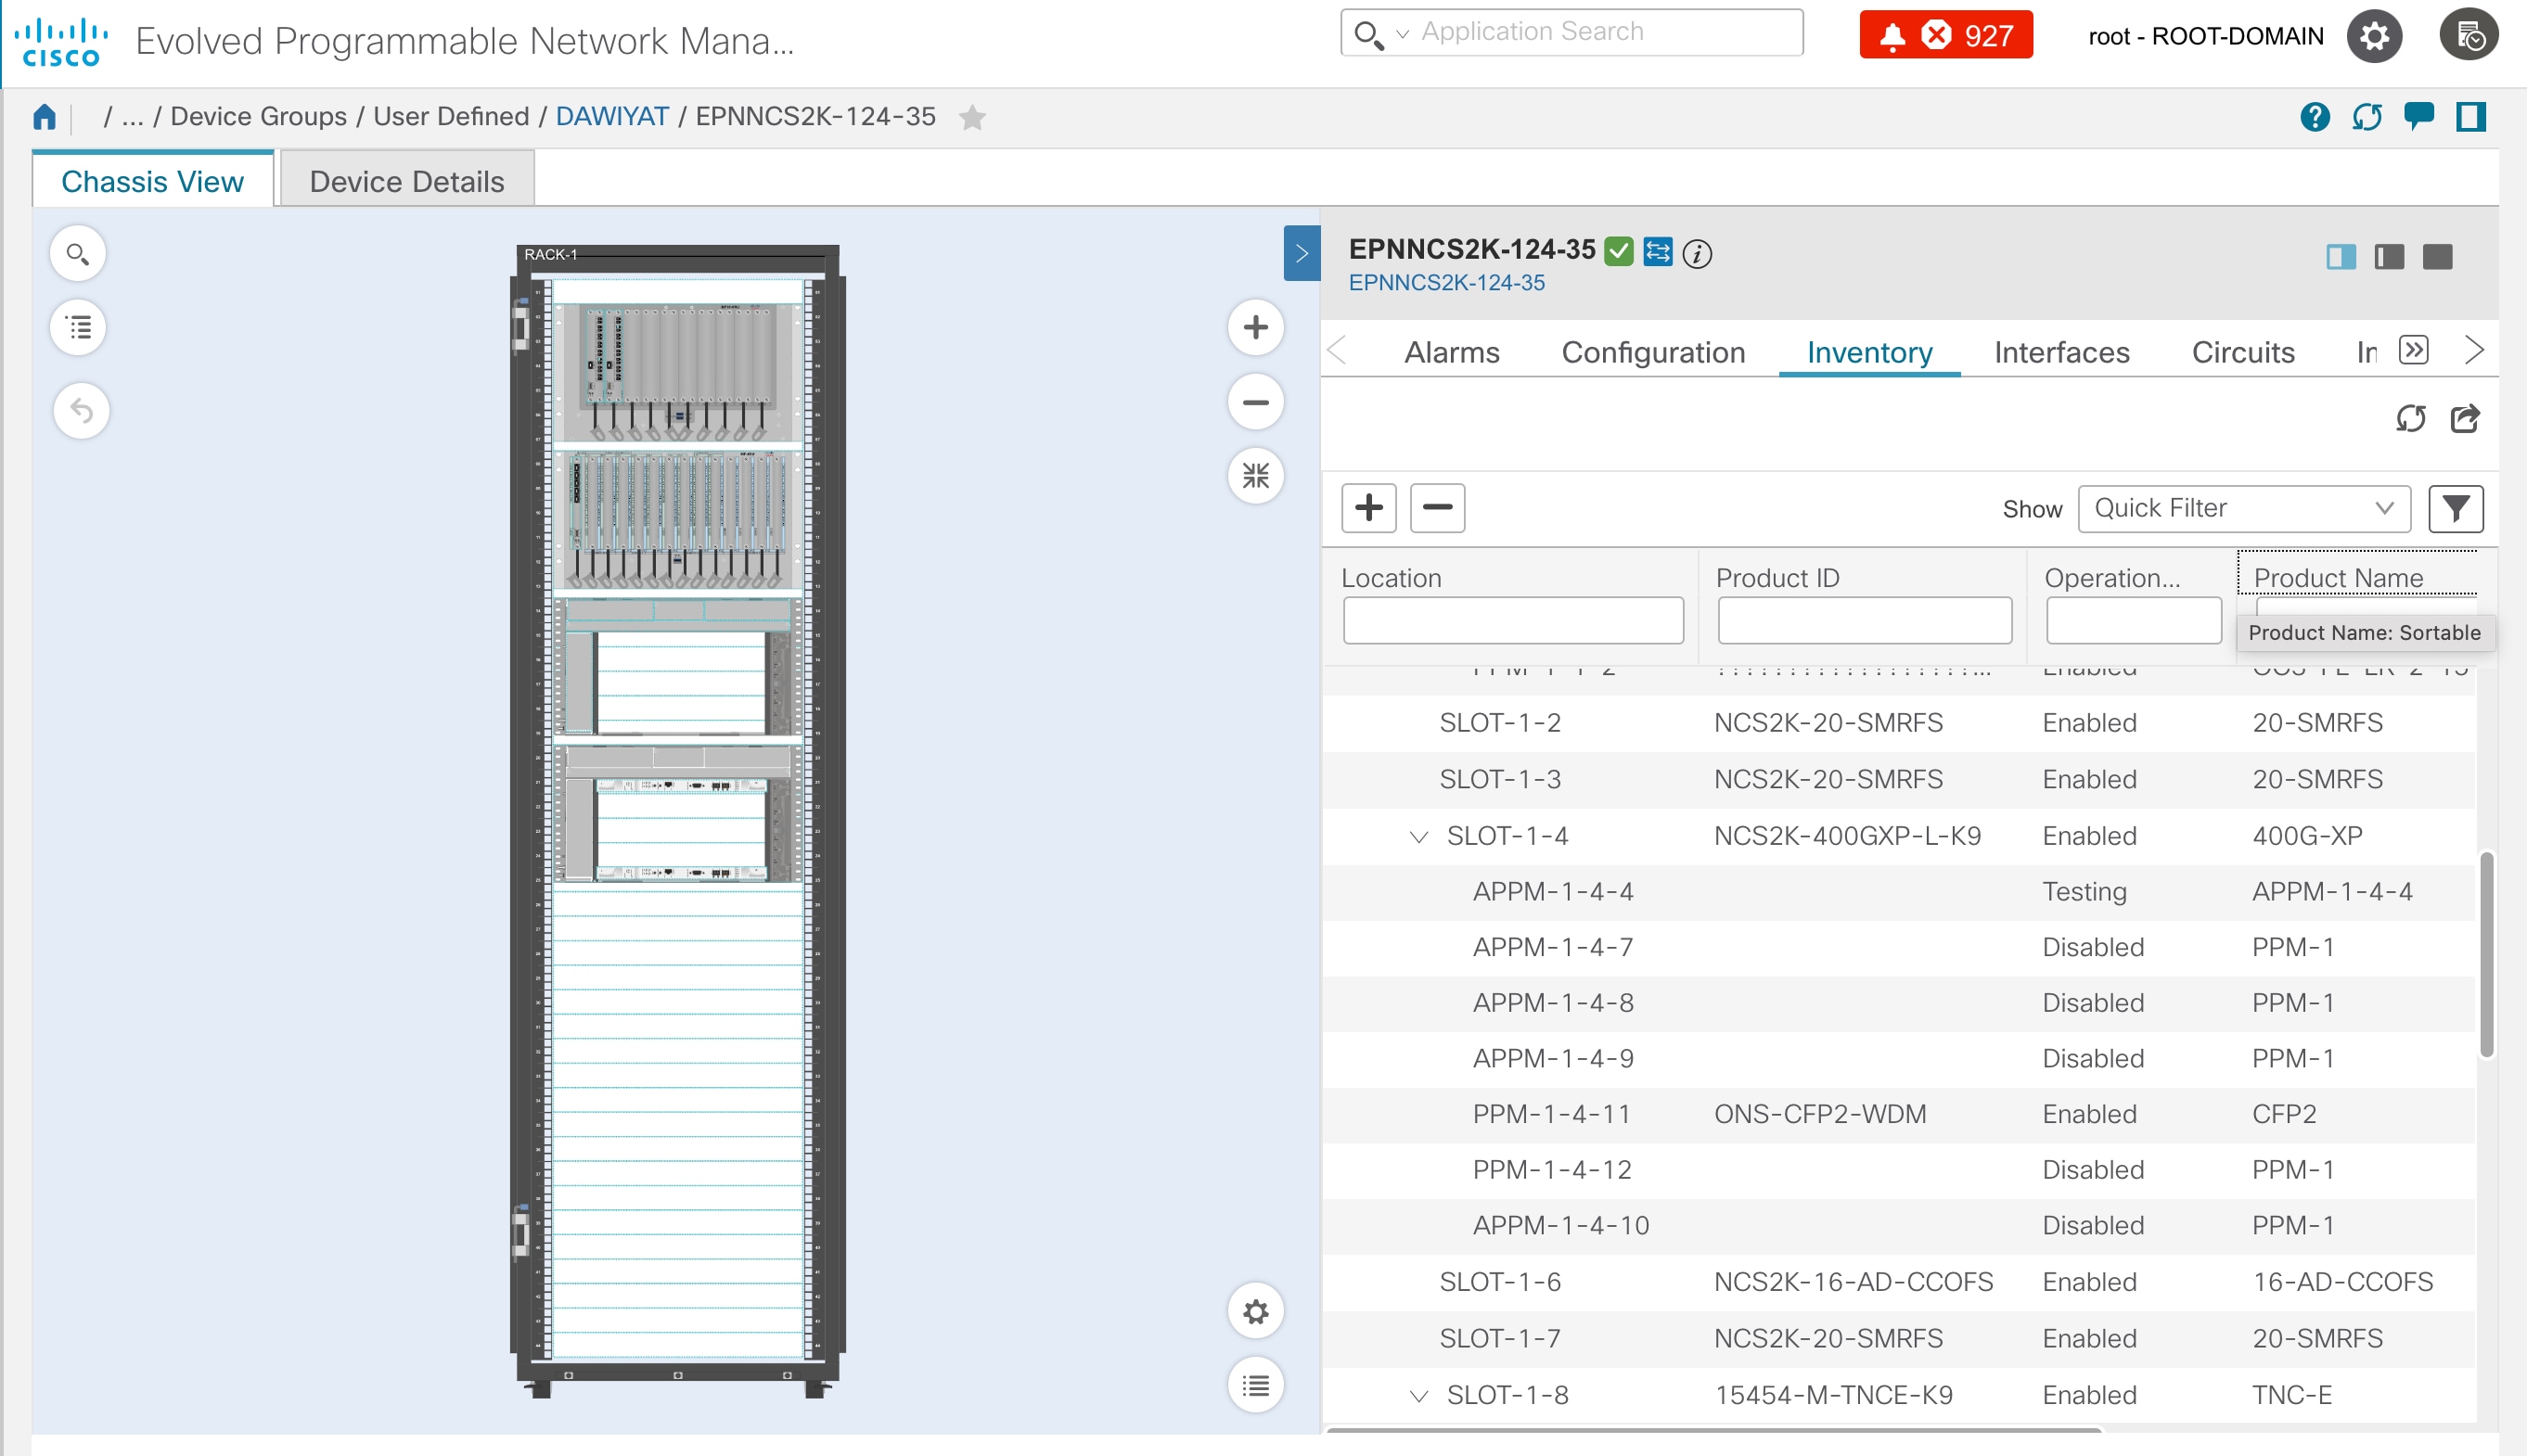
Modules

Modules that are configured on the device, including their name, type, state, ports, and location.
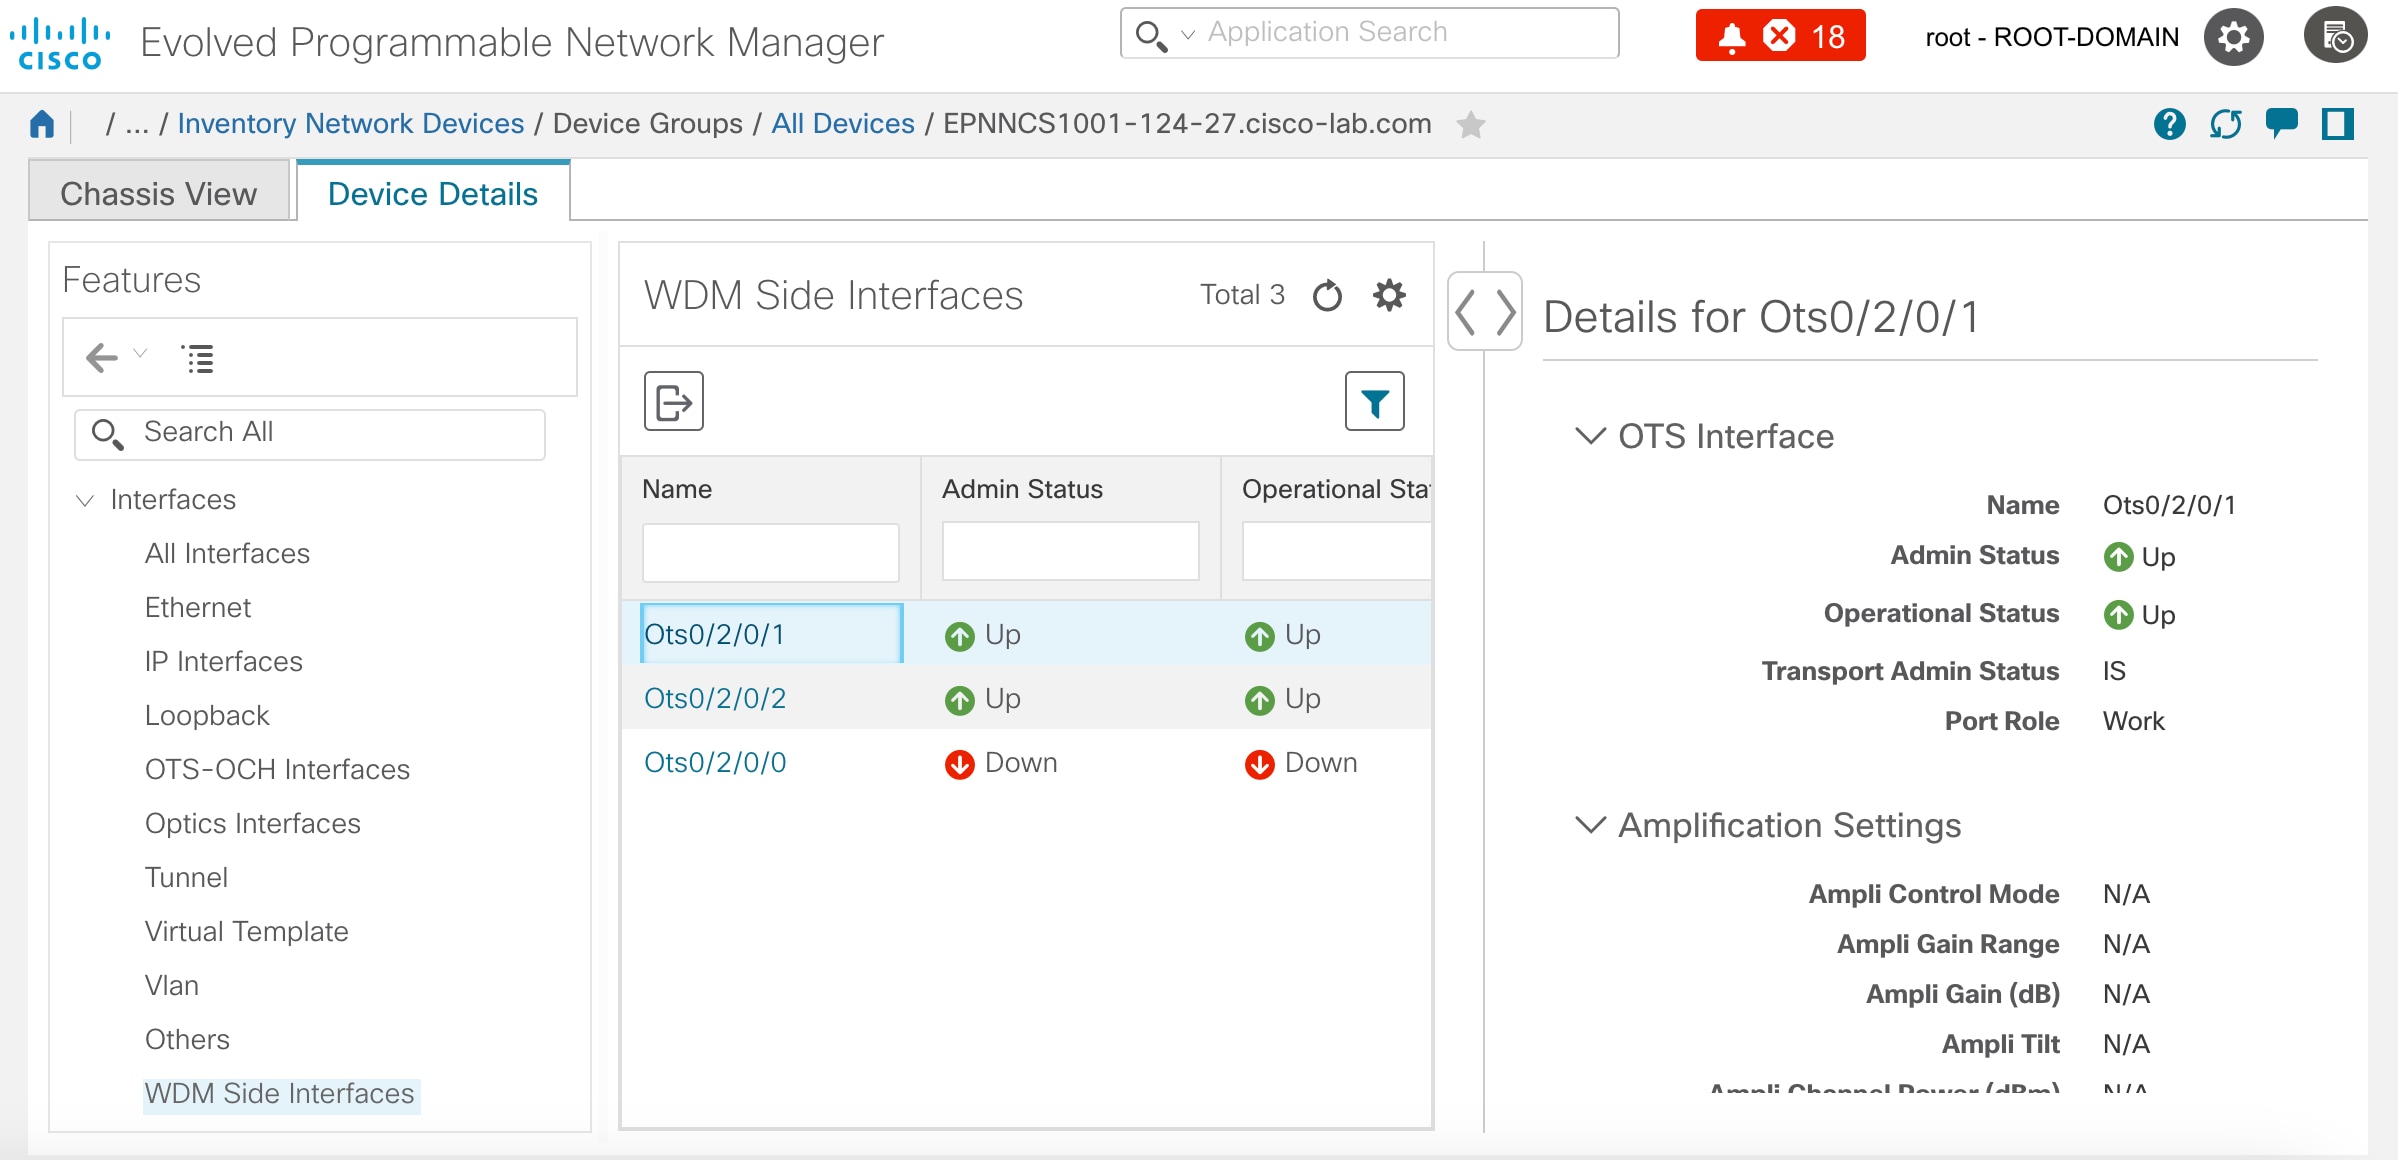
Interfaces

Interfaces that are configured on the device, including status information. You can also launch an Interface 360 view for a specific interface.
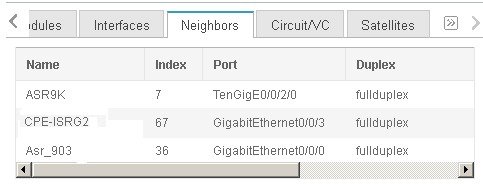
Neighbors

NEs that are connected to this device through Cisco Discovery Protocol (CDP). If the selected device does not support CDP, this tab is empty. Displayed information includes device type and name, and local and device ports. To view the neighbors in a pop up topology map, choose Actions > N Hop Topology (see View a Device's Local Topology from the Device 360 View).

Note


This option is not available for Cisco NCS 1010 devices.

Circuit/VCs

Circuit/VC name, type, customer, status, and creation date for each circuit provisioned on the device. You can also launch a Circuit/VC 360 view for specific circuits/VCs.

Note


This option is not available for Cisco NCS 1010 devices.

Satellites tab

For Cisco ASR 9000 series devices in a cluster configuration, this tab lists the satellite’s name, type, description, status, IP address, and MAC address. You can also launch a Satellite 360 view for a specific satellite.

Civic Location

Geographical information about device's location.

Recent Changes

The last five changes made on the device, classified as: Inventory, Config (Configuration Archive), or SWIM (Software Images).

Note


If you have logged in as a root user, then you can view all the activities under the Recent Changes tab. If you have logged in as a non-root user, then you can only view the activities you performed.

SRRGs

Lists the Shared Risk Resource Groups (SRRGs) assigned to the device. Click this tab's ? (help) icon to view its legend. For more information about SRRGs, see View and Manage Shared Risk Resource Groups (SRRG) in the Geo Map.

Note


This option is not available for Cisco NCS 1010 devices.

You can also view a specific device in the topology map by choosing Actions > Network Topology.

Compare Device Information and Status

From the Comparison View page, you can perform a side-by-side comparison of multiple devices, viewing information such as raised alarms, the status of modules, interfaces, and circuits on those devices, and a summary of recent changes that have been made. To compare devices, do the following:

Procedure


Step 1

Choose one of the following to open the Network Devices page:

  • Monitor > Managed Elements > Network Devices

  • Inventory > Device Management > Network Devices

Step 2

For each device you want to compare:

  1. Open its Device 360 view by clicking the i (information) icon in the IP Address column.

  2. Choose Actions > Add to Compare.

    The device you selected is displayed at the bottom of the page. You can select a maximum of 4 devices.

Step 3

Click Compare.

The Comparison View page opens.

Step 4

From the drop-down list at the top of the view, specify whether the view will show all available information or just the information that is unique to each device.

Step 5

Click Customize View, check the check box for the categories you want the view to display, and then click Save.

By default, all of the categories are selected.

Step 6

Scroll down the page to view the information provided for each category you selected.

Note the following:

  • The Comparison View only displays information for two devices at a time. If you selected more than two, you will need to toggle to the devices that are not currently displayed.

  • To reorder the devices you have selected, click Rearrange at the top right of the page.

  • Each device’s View and Actions menu is identical to the ones provided in their Device 360 view. If you select an option, the corresponding page opens.

  • You can minimize and maximize the categories displayed, as needed.

  • The Comparison View is also available for circuits and VCs, interfaces, and links. Whenever you select any of these elements from their respective 360 view for comparison, they are displayed in the corresponding tab. This allows you to switch between element types, as needed.

  • When you are done comparing devices, click Back at the top right of the page and then click Clear All Items at bottom of the page. If tabs for other element types are still displayed, you will need to clear them as well.


View a Device's Local Topology from the Device 360 View

You can launch a small topology window from the Device 360 view that displays the network topology around a device, up to 3 hops.

Procedure


Step 1

Open the Device 360 View for the device in which you are interested.

  • Click the "i" icon next to an IP address in almost any device table.

  • From the network topology, click a device in an expanded group, then click View.

Step 2

Choose N-Hop Topology from the Actions drop-down menu (at the top right of the Device 360 view).

Step 3

Adjust the popup window to show the information you need.

  • Click the edit icon

  • Select a hop count (1-3) from the Hop drop-down list.

  • Select a topology map layout from the Layout drop-down list.

Step 4

Save your changes, and use the pan and zoom tools to view the results.


View the Network's Hardware Inventory

Use this procedure to view basic hardware information for all devices in the network—the product name, physical location, serial number, manufacture date, and so forth.

Procedure


Step 1

To view device-level information:

  1. Choose Inventory > Device Management > Network Inventory.

  2. Use the Quick Filters to locate specific devices. For example, to list the hardware information for all ASR devices, enter *ASR* in the Product Name field.

Step 2

To view element-level information, use one of these methods:


Get Complete Device Information: Device Details Page

For the most comprehensive information about a device, view the Device Details page. It provides in-depth inventory information and configuration options.

Figure 1. Chassis View Window
Figure 2. Device Details Window

To launch the Device Details Page:

  • From a Device 360 view—Click the IP address hyperlink or choose the View > Details > Device Details tab.

The tabs that are displayed here depend on your selection in the Chassis View. They are described in the following table:

Tab Name

Description

Chassis View

Provides inventory, service, and alarm information that is contextualized to the element you select. Also serves as launch point for configuration, Image management, and Configuration Archive features.

For information on using the Chassis View features, see Overview of the Chassis View Window.

Device Details

Provides system information (environment, modules ports, interfaces, and other settings). Provides logical inventory information and configuration options for these elements.

Alarms

Get information about the alarms that have been raised on a device, a card, or a port. See View an Alarm's Details.

Configuration

Configure a device, card, or port. Elements are grouped by their physical location. (To configure elements that are grouped according to their logical function, click the Device Details tab.) See Ways to Configure Devices Using Cisco Evolved Programmable Network Manager.

Inventory

View detailed hardware information such as serial numbers and manufacture dates for a device or card.

Interfaces

View the status of interfaces configured on a device, card, or port. From here, you can also open the Interface 360 view for a particular interface. For links to topics that describe other ways to view interface information in Cisco EPN Manager, see View Device Interfaces.

Circuits

View the circuits a device, card, or port participates in. For links to topics that describe other ways to view circuit information in Cisco EPN Manager, see View Circuits/VCs.

Image

Manage the software image that is running on the device. See View the Images That Are Saved in the Image Repository.

Note


This tab is only available when a top-level chassis is selected.

Configuration Archive

Manage the device configuration file that is running on the device. See View All Archived Files.

Note


This tab is only available when a top-level chassis is selected.

To get an overview of a device, you can navigate to Device Details > System > Summary. Here you can view information such as general summary, UDI (Unique Device Inventory), inventory summary, port summary, stack summary, CPU graph, memory graph, and so on.

View and Manage Devices Using the Chassis View

The Chassis View provides an interactive model of a device chassis and its hardware elements. From the Chassis View you can:

  • View the contents of a chassis.

  • Check the state of chassis elements and locate problems.

  • View alarmed elements and launch views that provide alarm details.

  • Configure interfaces (using the launch point that opens the Device Details page).

The elements that are displayed in the Chassis View depend on the device type and the elements that are configured on the device.


Note


Chassis View is not supported for Cisco Catalyst 8300 series and Cisco Catalyst 9300 series devices.


Open the Chassis View

The following table describes the various ways you can open the Chassis View. If a device does not provide these launch points, it means the device does not support the Chassis View. For a list of devices that support the Chassis View, see https://www.cisco.com/c/en/us/support/cloud-systems-management/evolved-programmable-network-epn-manager/products-device-support-tables-list.html.

To open a Chassis View from:

Do the following:

The Chassis View is displayed in:

Network Devices table

Click next to the device IP address.

A pop-up window

Click a device name hyperlink.

A full-page view

Device 360 view

Choose View > Chassis View from the top right of the Device 360 view.

A pop-up window

Choose View > Details from the top right of the Device 360 view.

A full-page view

Device Details page

Click the Chassis View tab.

A full-page view

To open a full-page Chassis View from a Chassis View pop-up window, click the Launch Configuration link in the top right corner of the window.

Permissions Required to View and Configure Devices Using the Chassis View

The following table describes the Chassis View permissions that are granted to members of Cisco EPN Manager user groups. These permissions cannot be edited.

  • Full access (read and write)—Users in this group can view and configure devices using the Chassis View.

  • Read-only access—Users in this group can use the Chassis View to view devices but not to configure them.

  • Write-only access—Users in this group can use the Chassis View to configure devices but not view them (only applies to the NBI Write group).

  • No access—Users in this group cannot access or use the Chassis View.

Group Type

Read

Write

Web UI

Root

X

X

Super Users

X

X

Admin

Config Managers

X

X

System Monitoring

X

User-Defined 1–4

X

Monitor Lite

X

NBI

NBI Read

X

NBI Write

X

Overview of the Chassis View Window

The following illustration shows the Chassis View for a Cisco ASR 903 router.

The Chassis View updates, displaying only the line card module that the port resides on and zooming in on it. The port pulsates in the Chassis View to help the user locate it. The badges that are displayed on the ports in this module indicate the primary status of those ports (see Port or Interface States). Some elements may be surrounded by colored lines to indicate their state (out of service, preprovisioned, and so forth). To open a key that explains the meaning of the badges and these other indicators, click at the bottom right of the Chassis View.

If a device has multiple chassis or shelves, each chassis or shelf is displayed in the same Chassis View (for an example, see View Mixed Chassis, Multi-Chassis, and Multi-Shelf Devices in the Chassis View). If a card image cannot be retrieved, the Chassis View displays a question mark alongside the card name.

You can customize the GUI display setting that controls the number of racks to be displayed in the chassis view. To do this:

  1. Click at the top right of the Cisco EPN Manager window, then choose My Preferences.

  2. Under Chassis View Configuration, in the Chassis racks to display drop-down list, choose a value. The specified number determines the number of racks to be displayed in the Chassis view. The default value is 2.

To improve loading time, the rack information is not displayed by default. You must click the download button (displayed on the rack) to display the relevant rack information.


Note


  • The colors that are rendered in the Chassis View may not match your physical device because the Chassis View displays a generic image that is packaged with Cisco EPN Manager.

  • If you have opened the Chassis View for a Cisco NCS 6000 device that houses a Secure Domain Router (SDR), the device type and the SDR's name are displayed at the top of the Chassis View. Keep in mind that there may be cases where the SDR label for a device that belongs to a cluster or a user-defined group is not displayed (since auto-clustering is applied to devices based on their proximity).


The following table describes the Chassis View components and their function:

Chassis View Component

Description

Opens a field you can use to search for a particular rack, shelf, module, or interface on a device.
Opens the Chassis Explorer.
Indicates the device’s reachability state (see Device Reachability and Admin States). This example indicates the device is reachable.
Indicates the device’s administrative status (see Device Reachability and Admin States). This example indicates that the device is managed.
Opens the device’s Device 360 view. See Get Basic Device Information: Device 360 View.
Launch Configuration link Opens the device’s Device Details page. The tabs that are displayed on this page vary, depending on whether a device, module, or port is currently selected in the Chassis View. See Get Complete Device Information: Device Details Page.
Adds a shortcut to the device’s Chassis View in the Dock window. See Customize the Dock Window.
Closes the Chassis View.
Zooms in on an image.
Zooms out from an image.
Resizes an image so it can be viewed in its entirety within the Chassis View.

Toggles between the front and rear Chassis View for a device that supports this feature. A callout that appears when you place your cursor over this icon indicates which view you are opening.

This feature is supported for the following Cisco devices:

  • Cisco ASR 901S routers

  • Cisco NCS 1001, 1002, 5001, 5002, and 5008 devices

Rotates the image of the module that is currently displayed. This icon is not available when an entire device is displayed.
Click to access the Enable Alarm Blinking check box. When checked, any alarm badges that are displayed for a module or port will blink in order to draw attention to them and make them easier to locate.
Opens a key that explains the significance of badges and colored lines that are displayed in the Chassis View.

Opens the performance graphs for the device.

Takes you a level back in the view.

View Network Element State Information in the Chassis View

Badges, lines, and colors provide information about the operational state, elements and components in a device. Click the Legends icon at the bottom right of the Chassis View to display a key that lists what the badges, lines and colors mean.

See these topics for more information:

Equipment Operational States (Chassis View)

The equipment operational states represent the running state of the network element.

Equipment Operational State

Icon

Description

In Service

(none)

Equipment is operating properly.

Pre-provisioned


(Cisco NCS 2000 and Cisco ONS devices only) Equipment has been configured but is not physical present in the chassis.

Failed/Disabled/Down/Out of Service/Out of Service Maintenance


Equipment is not operating properly.

Unknown


Equipment operational state is unknown. No response (or insufficient response) from the device.

Port or Interface States

Port or Interface Primary States—Conveys the most important state information for a port or interface by combining the admin and operational states. The Multilayer Trace displays either a port's primary state or alarm status. For the Chassis View, if an element does not support the changing of color to indicate a state change, you can still get the state change information from the alarm that is generated.


Note


If there is an alarm associated with a port/interface, alarm icon will show up, port icon will not show. The alarm is shown only in case the port is not in test or admin down state.


Port or Interface Primary State

Icon

Admin Status

Operational State

Unknown

Unknown

Unknown

Down

Up

Down

Testing

Test

Admin Down

Admin Down

Up

Up

Up

Auto Up

Up

Auto Up

Port or Interface Admin Status—Represents the configured state of the port or interface (for example, if an administrator has manually shut down a port).

Port or Interface Admin Status

Icon

Description

Unknown

Port or interface admin status is unknown. There is no response (or insufficient response) from the device.

Admin Down

Port or interface was manually shut down by the administrator.

Up

Port or interface is enabled by the administrator.

Testing

Port or interface is being tested by the administrator.

Port or Interface Operational State—Conveys the port or interface's running state and whether it is working properly.

Port or Interface Operational State

Icon

Description

Unknown

Port or interface operational state is unknown. There is no response (or insufficient response) from the device.

Down

Port or interface is not working properly.

Up

Port or interface is receiving and transmitting data.

Auto Up

Port or interface is receiving and transmitting data (only certain devices support this state; other devices use "Up").

View Mixed Chassis, Multi-Chassis, and Multi-Shelf Devices in the Chassis View

The following example shows a mixed Chassis View. Shelf numbers are not consecutive because of the different types of chassis.


For mixed-chassis, multi-chassis, and multi-shelf devices, Cisco EPN Manager aggregates alarms to a chassis or shelf as explained in View Alarms in the Chassis View.

For multi-chassis devices in a cluster, the Device 360 view's Chassis tab identifies which chassis is the primary and which is the backup.


Note


Chassis View opened for a multi-shelf device will display only the first four racks, and requires the user to click the download button (displayed on the rack number 5 and above) to display the relevant rack information.


View Alarms in the Chassis View

An alarm badge in the Chassis View represents one or more alarms that have been localized to a piece of equipment. For an element with multiple alarms, the badge icon will convey the most severe alarm.

To customize the Chassis View so that alarm icons blink (to bring your attention them), click from the bottom right of the view, then check the Enable Alarm Blinking check box.


Note


If there is an alarm associated with a port/interface, alarm icon will show up, port icon will not show. The alarm is shown only in case the port is not in test or admin down state.


To view the alarms specific to a device, do the following:

Procedure


Step 1

With a device's Chassis View open, click the Launch Configuration link.

The Device Details page opens.

Step 2

If not already selected, click the Alarms tab.

All of the alarms that have been raised for the device are listed here.

Step 3

To view the alarms for a specific device component (such as a line card or port), do one of the following:

  • Double-click the component in the Chassis View.

  • Click to open the Chassis Explorer, then click its entry.


View Routes of a Circuit in the Chassis View

You can view the end-to-end physical route of a circuit using the Chassis View of a device participating in the circuit. You can also choose to view the power levels and span loss in the circuit.


Note


This feature is available only for the OCH WSON Optical circuit type.


Procedure


Step 1

From the left sidebar, choose Inventory > Device Management > Network Devices.

Step 2

From the Network Devices table, click the required device's name hyperlink to open the full-page view of the Chassis View.

Step 3

Expand the Chassis View Explorer, and then select the shelf.

Step 4

In the right pane, click the Circuits subtab, and then select the circuit for which you want to view the physical routes.

In the Chassis View under the Circuits subtab tab, you can see all circuits that involve the selected device at the node, slot, shelf, or port level, depending on the interfaces involved.

  • Node Level: Displays all circuits passing through the node.

  • Shelf/Slot/Port Level: Shows all circuits passing through the interfaces that are associated with the selected shelf, slot, or port.

This helps in viewing and identifying all circuits that are impacted when performing any operations that may affect the circuits.

Step 5

In the left pane, next to the Chassis View, click the eye icon to show or hide the physical routes, power levels, and span loss.


View Device Ports

You can get in-depth information about a device's physical ports from the Device Details page. You can also get basic port information from various 360 views.

To view a device chassis with its modules and ports, use the Chassis View. See Open the Chassis View.

To view this port information:

Do the following:

All Physical ports on a device (including port alias and residing module)

  1. Open the Device Details page.

    • Choose View > Details from the top right of the Device 360 view.

    • Click the device name hyperlink in a device table.

  2. Under the Device Details tab, choose System > Physical Ports.

An interface's ports

Check the Interface tab on a 360 view.

Ports connected to a module

Check the Modules tab on a Device 360 view.

Ports connected to a neighbor

Check the Neighbors tab on a Device 360 view.

For a matrix of ports states and icons, see Port or Interface States.

View Device Interfaces

Cisco EPN Manager provides the following ways to view device interfaces:

Ways to View Interfaces

For more information, see:

View details about a specific interface

Get a Quick Look at a Device Interface: Interface 360 View

View a specific device's interfaces

View a Specific Device's Interfaces: Device 360 View

Use the Device 360 view to quickly check the status of a device's interfaces.

Procedure


Step 1

Open the Device 360 view:

  • Click the "i" icon next to an IP address in almost any device table

  • From the network topology, click a device in an expanded group, then click View

Step 2

Click the Interfaces tab.


Get a Quick Look at a Device Interface: Interface 360 View

The Interface 360 view shows summary information for a specific interface including general interface details, interface status, alarms on the interface, circuits/VCs traversing the interface, and performance information. From the Interface 360 view's Actions menu, you can perform basic tasks such as enabling and disabling the interface, and so on. The Show in Topology option launches the topology map so that you can view the interface in the context of the map.

You can launch the Interface 360 view wherever you see an "i" icon next to an interface name—For example, in an alarms table, a links table or in a device 360 view.

The Interface 360 view provides general interface information at the top of the view, and more detailed interface information in tabs in the lower part of the view. The information the Interface 360 view displays depends on the interface configuration.

The tabs that are displayed vary depending on the type of interface for which you launched this view. For example, for optical interfaces you might see the Optical Physical tab or the ODU tab, depending on the type of optical interface.


Note


Interface 360 has a limited IPv6 support.


Using the menus in the top right of the dialog box, you can also perform these tasks:

  • Auto-Refresh—For real-time updates of status and troubleshooting, enable an on-demand refresh by clicking on the Refresh icon. Alternatively, you can also set the autorefresh interval to 30 seconds, 1 minute, 2 minutes, or 5 minutes from the drop-down list. Auto-Refresh is OFF by default.


    Note


    The Auto-Refresh setting is applicable only for the currently open 360 view dialog box. If the view is closed and reopened or another view is opened, by default Auto-Refresh is Off.
  • Open a chassis view that highlights the port or line card the interface is associated with (View menu). This feature comes in handy when you must describe to an onsite technician where to find the source of an issue.

  • Select the interface for a side-by-side comparison with another interface based on information such as raised alarms and the status of associated circuits and VCs (Actions menu)—See Compare Interface Information and Status.

  • View performance information in the relevant performance dashboard for the specific interface type by selecting View > Performance.

  • Enable and disable the interface from the Actions menu.

  • Enable and disable the lockout of an MPLS interface from the Actions menu. You would lock out an MPLS interface before doing maintenance work on the MPLS TE Tunnel link that the interface belongs to. Close and reopen the Interface 360 View to see the updated details.


    Note


    MPLS Lockout is not applicable on tunnel interfaces.

    The MPLS Lockout is only applicable on interfaces that have a valid discovered MPLS link in EPNM.


  • View the device on which the interface is located in a topology map (Actions menu).

  • Enable testing for the interface from the Actions menu.

  • Enable with AINS from the Actions menu.

  • Copy and activate a port configuration from one port to another using Actions > Migrate Port. This operation is supported only on XR devices. You can select only the empty destination ports (no configuration exists on the ports) while performing this operation. Use the show running-config interface <dest port> command to confirm that the destination port is empty. After the operation is successful, the source port will be shut down.

    • Both source and destination ports cannot be same.

    • Source and destination ports can be from different cards, however, they must be of the same type (for example, if the Source Port is Gigabit Ethernet, then the Destination Port should be of Gigabit Ethernet).

    • The migrate port operation is applicable only on Ethernet physical ports.

    Recommendation is to move the device to maintenance mode before performing the migrate port operation. This operation is based on the functionality that is provided by XR platform: the device must support the replace CLI command.


    Warning


    Migrating of port configuration that is configured with service endpoints create a gap between the intent and the discovered service. It is not possible to address this issue with service reconciliation, as changes in the service endpoints cannot be reconciled.


  • To clear the alarms of the migrated ports, you can use the following API:
    https://<Server IP>/webacs/alarm-rest/ClearAlarmsByPort?portName=<Port_Name>&deviceIp=<Device IP>

    Where,

    • <Server IP> is the IP address of the server.

    • <Port_Name> is the name of the port where the device is configured.

    • <Device IP> is the IP address of the device.

  • Set a baseline for performance data for optical interfaces (except for optical physical interfaces) for troubleshooting purposes. See Set a Baseline for Optical Performance Data for more information.

  • Use the UPSR/SNCP Protection option under the Actions menu to configure the switching pattern from the working interface to the protection interface on the device. This option is available in GUI only for devices whose Working and Protection Interfaces are configured. Cisco EPN Manager regularly syncs the inventory database with the device interface, based on user settings. The options to switch the interfaces are progressive:

    • Lockout - Prevents a working interface from switching to a protect interface.

    • Force Protect - Switches to a protect interface.

    • Force Working - Switches to a working interface.

    • Manual Protect - Manually switches to a protect interface.

    • Manual Working - Manually switches to a working interface.

    • Clear - Clears previously set external command.

Information Provided in Interface 360 View

Description

General information

The interface name, status, description, type, device name; IP address, MAC address, and so forth.

Performance data

Launch point to the relevant performance dashboard from View > Performance.

Alarms

Current alarms for the interface, including their severity, status, and the time they were generated. Also provides a launch point to the Alarm Browser.

Interfaces

Name, interface type, and operational and admin status for each associated interface. Also provides a launch point for the Interface 360 view.

Circuits/VCs

(For interfaces that participate in circuits) Circuit/VC name, type, customer, status, and creation date. Also provides a launch point for the Circuit/VC 360 view.

EFPs

All EFPs associated with the interface (if relevant). Also provides their operational status, admin status, and EFP type.

Detailed information relevant to a specific interface type.

Additional interface information and performance data in tabs relevant to the type of interface, for example, Optical Physical, ODU, FEC, and so on.

Note


From release 7.0 onwards, performance metrics Pre FEC BER and Post FEC BER are removed from the Coherent DSP Controllers page and added under the Interface/FEC tab.

Compare Interface Information and Status

From the Comparison View page, you can perform a side-by-side comparison of multiple interfaces, viewing information such as IP and MAC address, raised alarms, and associated circuits and VCs. To compare interfaces, do the following:

Procedure

Step 1

For each interface you want to compare:

  1. Open its Interface 360 view, as described in Get a Quick Look at a Device Interface: Interface 360 View.

  2. Choose Actions > Add to Compare.

    The interface you selected is displayed at the bottom of the page. You can select a maximum of 4 interfaces.

Step 2

Click Compare.

The Comparison View page opens.

Step 3

From the drop-down list at the top of the view, specify whether the view will show all available information or just the information that is unique to each interface.

Step 4

Click Customize View, check the check boxes for the categories you want the view to display, and then click Save.

By default, all the categories are selected.

Step 5

Scroll down the page to view the information provided for each category you selected.

Note the following:

  • The Comparison View only displays information for two interfaces at a time. If you selected more than two, you will need to toggle to the interfaces that are not currently displayed.

  • To reorder the interfaces you have selected, click Rearrange.

  • Each interface's View and Actions menu is identical to the ones provided in its Interface 360 view. If you select an option, the corresponding page opens.

  • You can minimize and maximize the categories displayed, as needed.

  • The Comparison View is also available for circuits and VCs, devices, and links. Whenever you select any of these elements from their respective 360 view for comparison, they are displayed in the corresponding tab. This allows you to switch between element types, as needed.

  • When you are done comparing interfaces, click Back at the top of the page and then click Clear All Items at the bottom of the page. If tabs for other element types are still displayed, you will need to clear them as well.


Get Comprehensive Information About a Device's Interfaces Using the Device Details Page

Use the Device Details page to get extensive information about all of the interfaces that are configured on a device. For easier navigation, interfaces are grouped together by type.

Procedure


Step 1

Open the Device Details page.

  • Click the device name hyperlink which appears in many of the device tables

  • Choose View > Details at the top right of the Device 360 view

Step 2

Under the Device Details tab, double-click Interfaces to display a list of all interfaces (of all types) that are configured on the device.

Step 3

To display all interfaces of the same type, click the type (such as Ethernet Interfaces).

Step 4

To get details about a specific interface, click the interface name hyperlink.


View Interfaces in the Chassis View

You can view the interfaces and their details using the Chassis View of a device participating in the circuit. You can find the interface details such as name, alarm, location, interface type, admin status, operational status, transport admin status, and serial number of the modules.

Procedure


Step 1

From the left sidebar, choose Inventory > Device Management > Network Devices.

Step 2

From the Network Devices table, click the required device name hyperlink to open a full-page view of the Chassis View.

Step 3

Expand the Chassis View Explorer, and then select the shelf.

Step 4

In the right pane, click the Interfaces subtab.


Set a Baseline for Optical Performance Data

Setting a baseline for optical interface performance data enables you to compare realtime network performance with a fixed set of performance statistics. In this way, you could compare normal baseline network performance with abnormal network behavior.

After you set a baseline, all new incoming performance statistics are recalculated based on the baseline values to show you the difference between the baseline values and the current realtime values (specifically, the current value minus the baseline value).

Optical interfaces that support this functionality will have a Set Baseline button in the relevant tab in the Interface 360 view.

To set a baseline for optical interface performance statistics:

Procedure


Step 1

Open the Interface 360 view for the relevant interface.

Step 2

Open the tab specific to the interface type, for example, FEC, OTU, and so on.

Step 3

Click the Set Baseline button.

The rows in the table will be cleared. Each new row will have values that reflect the difference between the baseline values and the current realtime values.

Step 4

To go back to the realtime values (effectively removing the baseline), close the Interface 360 view and then reopen it.


View Device Modules

To view device module information, choose Inventory > Device Management > Network Devices, then launch a Device 360 or Device Details page, depending on how much information you want.

To get this information:

Use this navigation:

Basic module information: Status, type, ports

From the Device 360 view, click the Modules tab. To open the Device 360 view:
  • Click the “i” icon next to the IP address in almost any device table.

  • From the Network Topology, click a device (in an expanded view), then click View.

Module equipment type and power information

From the Device Details page, choose System > Modules under the Device Details tab.

To open the Device Details page:
  • Click the device name hyperlink which appears in almost any device table.

  • Choose View > Details from the top right of the Device 360 view.

Note


Due to a limitation in the retrieval of module related information, this page lists SFP transceivers of Cisco CAT6500 devices as 'Unspecified' products.

View Environment Information (Power Supplies, Fans)

Environment-related information, such as details about power supplies and fans, is displayed in the Device Details page. To access this information:

Procedure


Step 1

Follow either of the following steps:

  • Click the device name hyperlink that appears in almost any device table and then click the Device Details tab.

  • Choose View > Details from the top right of a Device 360 view and then click the Device Details tab.

Step 2

From the Features pane on the left, choose System > Power Options & Fans or System > Environment (depends on the device type).


View Device Neighbors

Device neighbor information, such as the neighbor name, port number, index, and duplex setting, is displayed in a device’s Device 360 view.

Procedure


Step 1

Open the Device 360 view:

  • Click the i (information) icon next to the IP address in almost any device table.

  • From the network topology, click a device in an expanded group and click View.

Step 2

Click the Neighbors tab.


Example

For example:


View Circuits/VCs

Cisco Evolved Programmable Network Manager provides a variety of ways that you can view circuits/VCs:

To view circuit/VC information for:

See the procedures in:

A specific circuit/VC in a topology map, in a Circuit/VC 360 view, or in a Circuit/VC Details page

A device

View a Specific Device's Circuits/VCs

A device group in a topology map or in an expanded table

View a Device Group's Circuits/VCs

All of Cisco Evolved Programmable Network Manager

View All Circuits/VCs in Cisco EPN Manager

View Satellites

Cisco Evolved Programmable Network Manager provides the following ways to view satellite information for host-satellite configurations:

Ways to View Satellites

For more information, see:

View all satellites in a location group using a topology map

View Cisco ASR 9000 Host-Satellite Topologies in the Topology Map

View a specific device's satellites from a Device 360 view

View details about a specific satellite, including the hosts it is connected to, using the Satellite 360 view

Identify the Hosts Connected to a Satellite

Create User Defined Fields for Custom Values

If you want to assign custom attributes to devices or circuits/VCs, you can create your own fields to be shown in the tables and you can define custom values in those fields. For example, you might want to label certain devices with a customer name. After you have created user defined fields and assigned values, you can search by these values in the tables.

To create user defined fields:

Procedure


Step 1

Choose Administration > Settings > System Settings > General > User Defined Fields.

Step 2

Click the + icon. Select type of user defined field (UDF) from the drop-down list and enter a label and description.

Step 3

Assign values in your newly created user defined field for specific devices/circuits/VCs as follows:

  1. Go to the device table or to the table of circuits/VCs.

  2. Display your user defined field as a column in the table by clicking the settings icon at the top right of the table, choosing Columns, and then selecting your user defined field.

  3. Go to the required device or circuit/VC in the table, enter a value in your user defined column, and click Save.


Delete User Defined Fields

To delete user defined fields:

Procedure


Step 1

Choose Administration > Settings > System Settings > General > User Defined Fields.

Step 2

Select the user defined fields that you want to delete and click the Delete icon.

This deletes the selected user defined fields.