Deploying Cisco ACI Fabrics with Telemetry on Nexus Dashboard
Available Languages
Bias-Free Language
The documentation set for this product strives to use bias-free language. For the purposes of this documentation set, bias-free is defined as language that does not imply discrimination based on age, disability, gender, racial identity, ethnic identity, sexual orientation, socioeconomic status, and intersectionality. Exceptions may be present in the documentation due to language that is hardcoded in the user interfaces of the product software, language used based on RFP documentation, or language that is used by a referenced third-party product. Learn more about how Cisco is using Inclusive Language.
- US/Canada 800-553-2447
- Worldwide Support Phone Numbers
- All Tools
 Feedback
 Feedback
Software and Hardware Product Versions
Terminology and Architecture Definitions
Prerequisites for Nexus Dashboard and ACI
Types of Interfaces and prerequisites for Nexus Dashboard
Configuring persistent IP addresses in Nexus Dashboard
Telemetry Streaming Deployment Options
Option #1 – via out-of-band Network
Verify out-of-band Management EPG and Switch IP Addresses
Option #2 – via in-band Network
In-band Management Configuration
Preferred Connectivity Option – Using Layer3-Out
Connectivity Option 2 – Directly Attached Physical/Virtual Cluster
Connectivity Option 3 – Directly Attached Virtual Cluster using VMM Domain
Hardware Telemetry and Flow Collection
Traffic Analytics Compatibility Mode
Nexus Dashboard Site Configuration
Configuration and Interaction with APIC
Adding the ACI Site and Enabling Telemetry
Verifying the Fabric is Onboarded
Enabling Flow Collection on the Fabric
Pausing/Resuming/Reconfiguring Telemetry
Cisco Nexus Dashboard is a unified platform for configuring, monitoring, visualizing, analyzing and troubleshooting that helps reduce the mean time to detect (MTTD) and mean time to resolve (MTTR) network issues by providing comprehensive visibility into the infrastructure. Nexus Dashboard (ND) processes and analyzes telemetry data continuously streamed from all devices in the infrastructure to provide network operators with real-time monitoring and analytics. It also offers lifecycle management suggestions and foresight into infrastructure change management.
This paper details the best deployment configurations and settings to implement Nexus Dashboard for telemetry and operations for your Cisco ACI network fabrics. To enable streaming telemetry data from all the devices on the sites, specific configurations and pre-requisite settings are required on both the Cisco APIC and Nexus Dashboard. We use a typical ACI fabric as an example in this whitepaper to illustrate the necessary configuration on the APIC controller and Nexus Dashboard to prepare the sites for streaming telemetry, as well as illustrate the on-boarding process of the fabric to Nexus Dashboard.
Software and Hardware Product Versions
The content in this white paper was developed using the following product software versions:
● Nexus Dashboard version - 4.2.1
● Cisco ACI version (APIC and Switches) – 6.1(5)M
For more information about supported software versions and compatibilities of related products, refer to the Cisco Nexus Dashboard and Services Compatibility Matrix.
Terminology and Architecture Definitions
Cisco APIC (Application Policy Infrastructure Controller): The centralized policy and management controller for ACI fabrics.
Ouf-of-band Management (OOB): The management port (bond1 on APIC(s) and mgmt0 of switches) of APIC controllers and fabric switches, which resides in the OOB management network. In the context of ACI telemetry, out-of-band refers to streaming telemetry data from the APIC and switches’ management interfaces to Nexus Dashboard. This option became available in ACI version 6.1(2).
In-band Management: Refers to a dedicated management network within the ACI fabric that uses front facing interfaces and tenant configuration for management traffic. Historically, this was the only method for streaming telemetry from ACI fabrics to Nexus Dashboard. In-band management requires additional configuration including bridge domains, EPGs, contracts, and node management addresses within the mgmt tenant.
Node Management EPG: Endpoint groups within the mgmt tenant that define the management connectivity for fabric nodes. There are two types: in-band EPG and out-of-band EPG.
Nexus Dashboard Management Ports: Network interfaces dedicated for Nexus Dashboard management access, such as UI, SSH, AAA authentication, etc.
Nexus Dashboard Data Ports: Network interfaces dedicated for Nexus Dashboard node clustering connectivity and handling telemetry traffic from onboarded fabrics. Telemetry is always sent to the Nexus Dashboard data interfaces regardless of whether out-of-band or in-band is used as the source.
Nexus Dashboard Persistent IP Addresses (PIPs): IP addresses used for various controller and telemetry functions within the Nexus Dashboard cluster. Persistent IPs ensure that even with the failure of a specific node, the service IP does not change when moved to a different node. Telemetry collector PIPs are always allocated in the data network.
Precision Time Protocol (PTP): A time synchronization protocol required for flow analytics (Traffic Analytics and Flow Telemetry). PTP provides microsecond-level clock accuracy across the fabric, enabling Nexus Dashboard to calculate end-to-end flow latency.
Fabric Node Control Policy: An APIC policy that enables digital optical monitoring (DOM) and selects the feature priority for telemetry. The Feature Selection setting determines which type of telemetry monitoring takes precedence.
Digital Optics Monitoring (DOM): An optics feature that provides visibility into temperature and voltage measurements at each individual lane of a given optic.
Prerequisites for Nexus Dashboard and ACI
Types of Interfaces and prerequisites for Nexus Dashboard
Nexus Dashboard nodes provide the following two interfaces for connectivity:
● Management Interface – This is represented as a bond interface (bond1) with active/standby interfaces.
● Data Interface - This is represented as a bond interface (bond0) with active/standby interfaces.
Nexus Dashboard nodes require one IP each for the above two interface types. Management and data interfaces must be placed in different subnets. Configuration of those IP addresses happens during the Nexus Dashboard bootstrap.
The default function of the Nexus Dashboard interfaces and networks is depicted in Table 1.
Table 1. Nexus Dashboard Interfaces and their Purpose
| Data network |
Management network |
| ● Nexus Dashboard node clustering ● Service to service communication ● Nexus Dashboard nodes to Cisco APIC for configuration and inventory ● Telemetry traffic for APIC controllers and switches |
● Accessing Nexus Dashboard GUI ● Accessing Nexus Dashboard CLI using SSH ● DNS and NTP communication ● Nexus Dashboard firmware upload ● Intersight device connector ● AAA traffic ● Multi-cluster connectivity |
Before deploying Nexus Dashboard, either physically or virtually, always refer to the Nexus Dashboard Deployment Guide for the specific version that is being deployed. This will ensure that the deployment adheres to best practices before the ACI configuration is put into place.
Below is the summary of pre-requisites to prepare Nexus Dashboard, and its managed or monitored network sites for onboarding onto Nexus Dashboard and for enabling telemetry for exporting fabric data to Nexus Dashboard. Beginning with ACI release 6.1(2), the user has a choice to use either the out-of-band or in-band interfaces of the APIC and switches as telemetry sources, based on deployment design. Both the options are discussed in this white paper. Whether out-of-band or in-band is used, telemetry is always sent to the data interfaces of the Nexus Dashboard nodes.
1. The Nexus Dashboard cluster is connected and deployed (bootstrapped). For more information about deploying Nexus Dashboard in various form factors, refer to the Nexus Dashboard Deployment Guide. Specific examples of cluster placement and best practices will be provided in both the out-of-band and in-band connectivity methods respectively as well.
2. The round-trip time (RTT) between the Nexus Dashboard cluster and the fabric switches must not exceed 150ms for network site telemetry to run properly.
3. The round-trip time (RTT) between the Nexus Dashboard cluster nodes must not exceed 50ms.
4. Enable and configure NTP (Network Time Protocol) in the network. NTP is an essential clock service that syncs all the elements of the network site. The NTP service is not only required for setting up the ND cluster and managing network site switches, but also for software telemetry to work. It maintains the consistency and coherence of logs between the switches and Nexus Dashboard. NTP configurations and verifications for monitored and managed modes are discussed in further sections.
5. If Flow Telemetry or Traffic Analytics is enabled to collect flow records from the monitored ACI fabrics, you must configure PTP (Precision Time protocol) within APIC. Nexus Dashboard requires a microsecond-level accurate PTP clock for the network site to perform flow analytics across the site and calculate the end-to-end network latency of the flows. The APIC can assign a PTP Grandmaster on a spine for single pod, or an external one should be used for multi-pod environments. The PTP configurations and verifications are discussed in the next sections for both Nexus Dashboard managed and monitored network sites.
6. Configure persistent IPs as discussed in detail in the following section below. By default, you will configure these when the cluster is deployed (bootstrapped).
7. Prepare the routing of the fabrics for telemetry streaming to Nexus Dashboard based on the design – either through a Layer-3 network, directly connected, or by using of-band management network for the connectivity. This is discussed in further detail later in this white paper.
8. For streaming telemetry through out-of-band network:
a. IP reachability should be established between the Nexus Dashboard Data interfaces and the out-of-band management interfaces of the APICs (bond1) and switches (mgmt0).
9. For streaming telemetry through in-band network:
a. Configure in-band management for the ACI fabric. The details and steps to configure this are illustrated in the in-band management configuration guide.
b. Nexus Dashboard data network needs IP reachability to the ACI in-band management addresses of the APIC controllers and switches.
Configuring persistent IP addresses in Nexus Dashboard
Depending on the Nexus Dashboard cluster size and the services enabled, a different number of persistent IPs are required. For more information on persistent IPs required for your deployment, see Cisco Nexus Dashboard Deployment and Upgrade Guide.
For a typical 3-node cluster, Nexus Dashboard requires 5 mandatory persistent IP addresses for software and hardware telemetry services for a Nexus Dashboard managed or monitored network site. All 5 persistent IPs can be placed in the data network if the connectivity between Nexus Dashboard and the fabrics is over the data network itself. Alternatively, out of the 5 persistent IP addresses 3 can be placed in the data network and 2 can be placed in the management network (if the LAN Device Management Connectivity policy is set to “Management”). This depends on the deployment option that will be illustrated below. After bootstrapping, you may need to add additional persistent IP addresses as needed, depending on scenarios highlighted in the user guide (link provided below). For ACI telemetry only, the 3 Data PIPs for telemetry collection are the only ones that are used. However, the other 2 PIPs for NX-OS configuration management and discovery may be of use later if those use cases are of interest. Depending on the deployment mode, the configuration of the persistent IPs varies as shown below.
Layer 2: Here the Nexus Dashboard nodes within the cluster are layer-2 adjacent. This means that all Nexus Dashboard nodes share the same management and data subnet respectively. Persistent IP addresses need to be on the same network as the data network or management network.
Layer 3 BGP: In this mode, the Nexus Dashboard nodes within the cluster are layer-3 adjacent. In other words, unique management and data subnets are associated with each Nexus Dashboard node in the cluster. There needs to be IP reachability between the nodes to form the cluster. Persistent IP addresses cannot be from a subnet that belongs to any of the Nexus Dashboard nodes’ Data or Management interface subnets. In this case, LAN Device Management Connectivity must be set to Data and cannot be changed. For detailed examples of the use cases for when BGP should be used, refer to the High Availability Deployment Guide for Nexus Dashboard.
The configuration of persistent IP addresses is done when the cluster is bootstrapped, however if you would like to view them, or need to modify/change them, the steps are as follows:
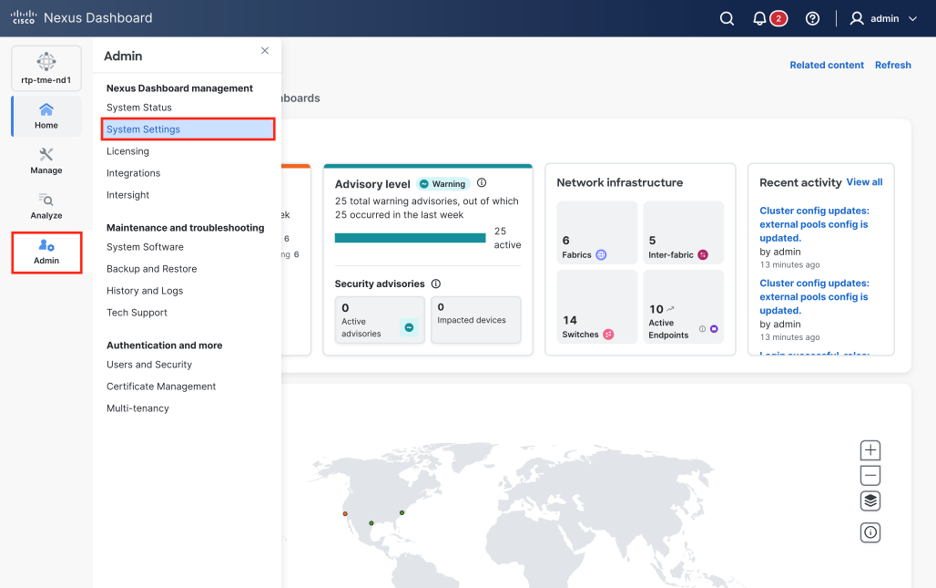
1. The telemetry collector persistent IP addresses are in the Nexus Dashboard Data Network subnet by default when the cluster is bootstrapped for the first time. Post cluster deployment, additional IPs can be added or modified in the System Settings. On the Nexus Dashboard UI, click Admin -> System Settings.
2. On the System Settings page, scroll down to External Pools.
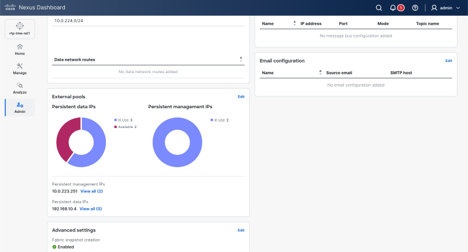
Click Edit under External Pools -> Click Add persistent data IP address to add at least 5 IP addresses
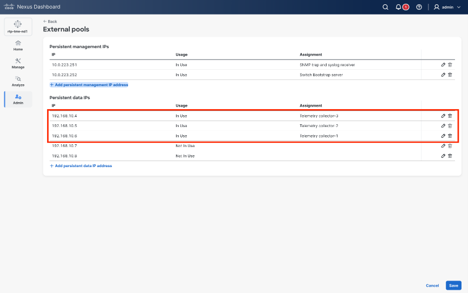
3. Click Save.
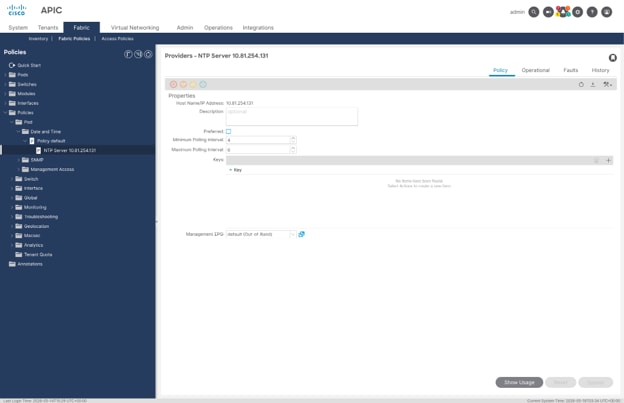
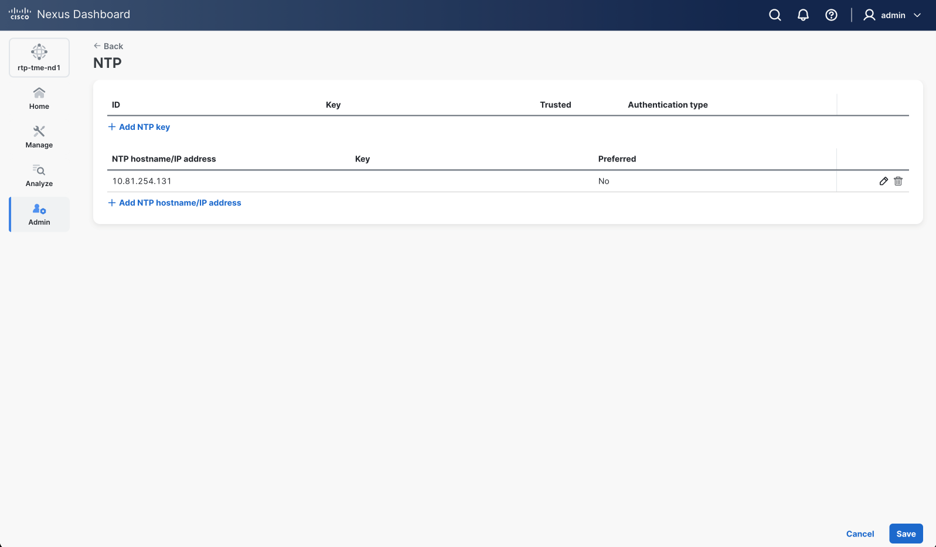
Network Time Protocol (NTP) is a core service that should be enabled on the ACI fabric regardless of the telemetry method chosen. NTP ensures consistency across log messages, faults, events, and internal counters. This is required for Nexus Dashboard to correlate information correctly and display meaningful anomalies along with other software telemetry. Ensure NTP is configured within the APIC by following the steps outlined in the NTP configuration guide.
NTP should also be configured on Nexus Dashboard. Verify the NTP configuration under Admin > System Settings > General on the Nexus Dashboard UI.
pAPIC1# show ntp
nodeid remote refid st t when poll reach auth delay offset jitter
------ - -------------- ------- ---- -- ------ ------ ------ ---- ------ ------- -------
1 * 10.81.254.131 .GNSS. 1 u 64 64 377 none 0.440 -0.011 0.014
Leaf2101-FX2# show ntp peer-status
Total peers : 1
* - selected for sync, + - peer mode(active),
- - peer mode(passive), = - polled in client mode
remote local st poll reach delay vrf
----------------------------------------------------------
*10.81.254.131 0.0.0.0 1 64 377 0.000 management
rescue-user@pND1:~$ acs ntp
ind assid status conf reach auth condition last_event cnt
===========================================================
1 29589 961a yes yes none sys.peer sys_peer 1
remote refid st t when poll reach delay offset jitter
==============================================================================
*10.81.254.131 .GNSS. 1 u 245 1024 377 0.413 +0.092 0.097
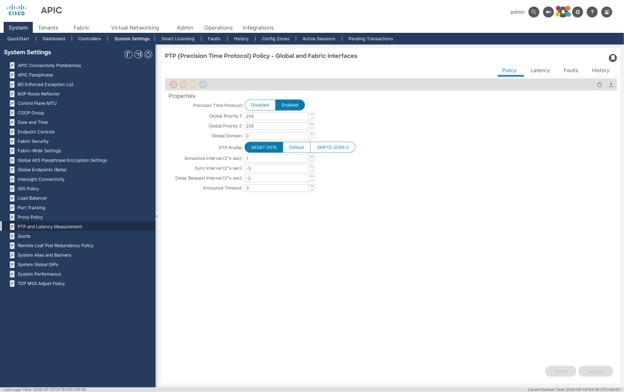
PTP is required if Traffic Analytics or Flow Telemetry is enabled for the fabric so that flow records can be sent from the fabric switches to the Nexus Dashboard cluster for persistent and real time analysis. When flow collection is enabled, every switch in the site will stream flow records with PTP timestamps. Nexus Dashboard uses these timestamps to calculate end-to-end flow latency. All switches in the fabric must be synchronized to the same PTP grandmaster.
For a single-pod ACI fabric, PTP can be enabled without an external grandmaster — the fabric will elect a spine switch as grandmaster. Multi-pod ACI fabrics require an external grandmaster connected to the IPN device. For more information, please review the PTP Configuration Guide for your current version.
Telemetry Streaming Deployment Options
In the following section, we will go through the options for streaming telemetry from an ACI fabric to Nexus Dashboard. Telemetry is always sourced from the APICs and switches and sent to the data interfaces of the Nexus Dashboard nodes. The Telemetry can be sourced from mgmt0 (out-of-band) or an SVI (in-band) but can never be sent to the management ports on the Nexus Dashboard nodes, only the data network and persistent IP addresses in the data network.
Option #1 – via out-of-band Network
Considering that most deployments already have an out-of-band network setup for remote management and disaster recovery of the devices, we provide the option to use an out-of-band network of the APIC controllers and switches for streaming telemetry to Nexus Dashboard. In such a case, using this connection type does not require any additional in-band configuration, making it plug and play and easy to deploy for every environment.
● While out-of-band Telemetry streaming might be the simplest and most straight forward approach, there are a few guidelines and limitations that must be considered:
● The ACI fabric (Controller and switches) must be running version 6.1(2) or higher. For fabrics running earlier versions, use the in-band telemetry option described later in this document.
● In-band Management must not be configured. This limitation will be removed in later releases of Nexus Dashboard, but as of release 4.2 both management modes cannot be configured on APIC. If both modes are configured, use the in-band telemetry option.
● The management and data subnets must be separate subnets, and IP reachability between bond1 on the APICs/mgmt0 on the switches and the data subnet must be allowed. The persistent IPs will be placed in the data subnet by default when the cluster is initially bootstrapped.
● The telemetry will always be sent to the Nexus Dashboard data network and interfaces.
● Flow Telemetry (FT) is not supported in this design, however Traffic Analytics (TA) and Traffic Analytics compatibility mode are supported. Traffic Analytics is the current recommended mode provided you are running Cisco ACI release 6.1 or higher.
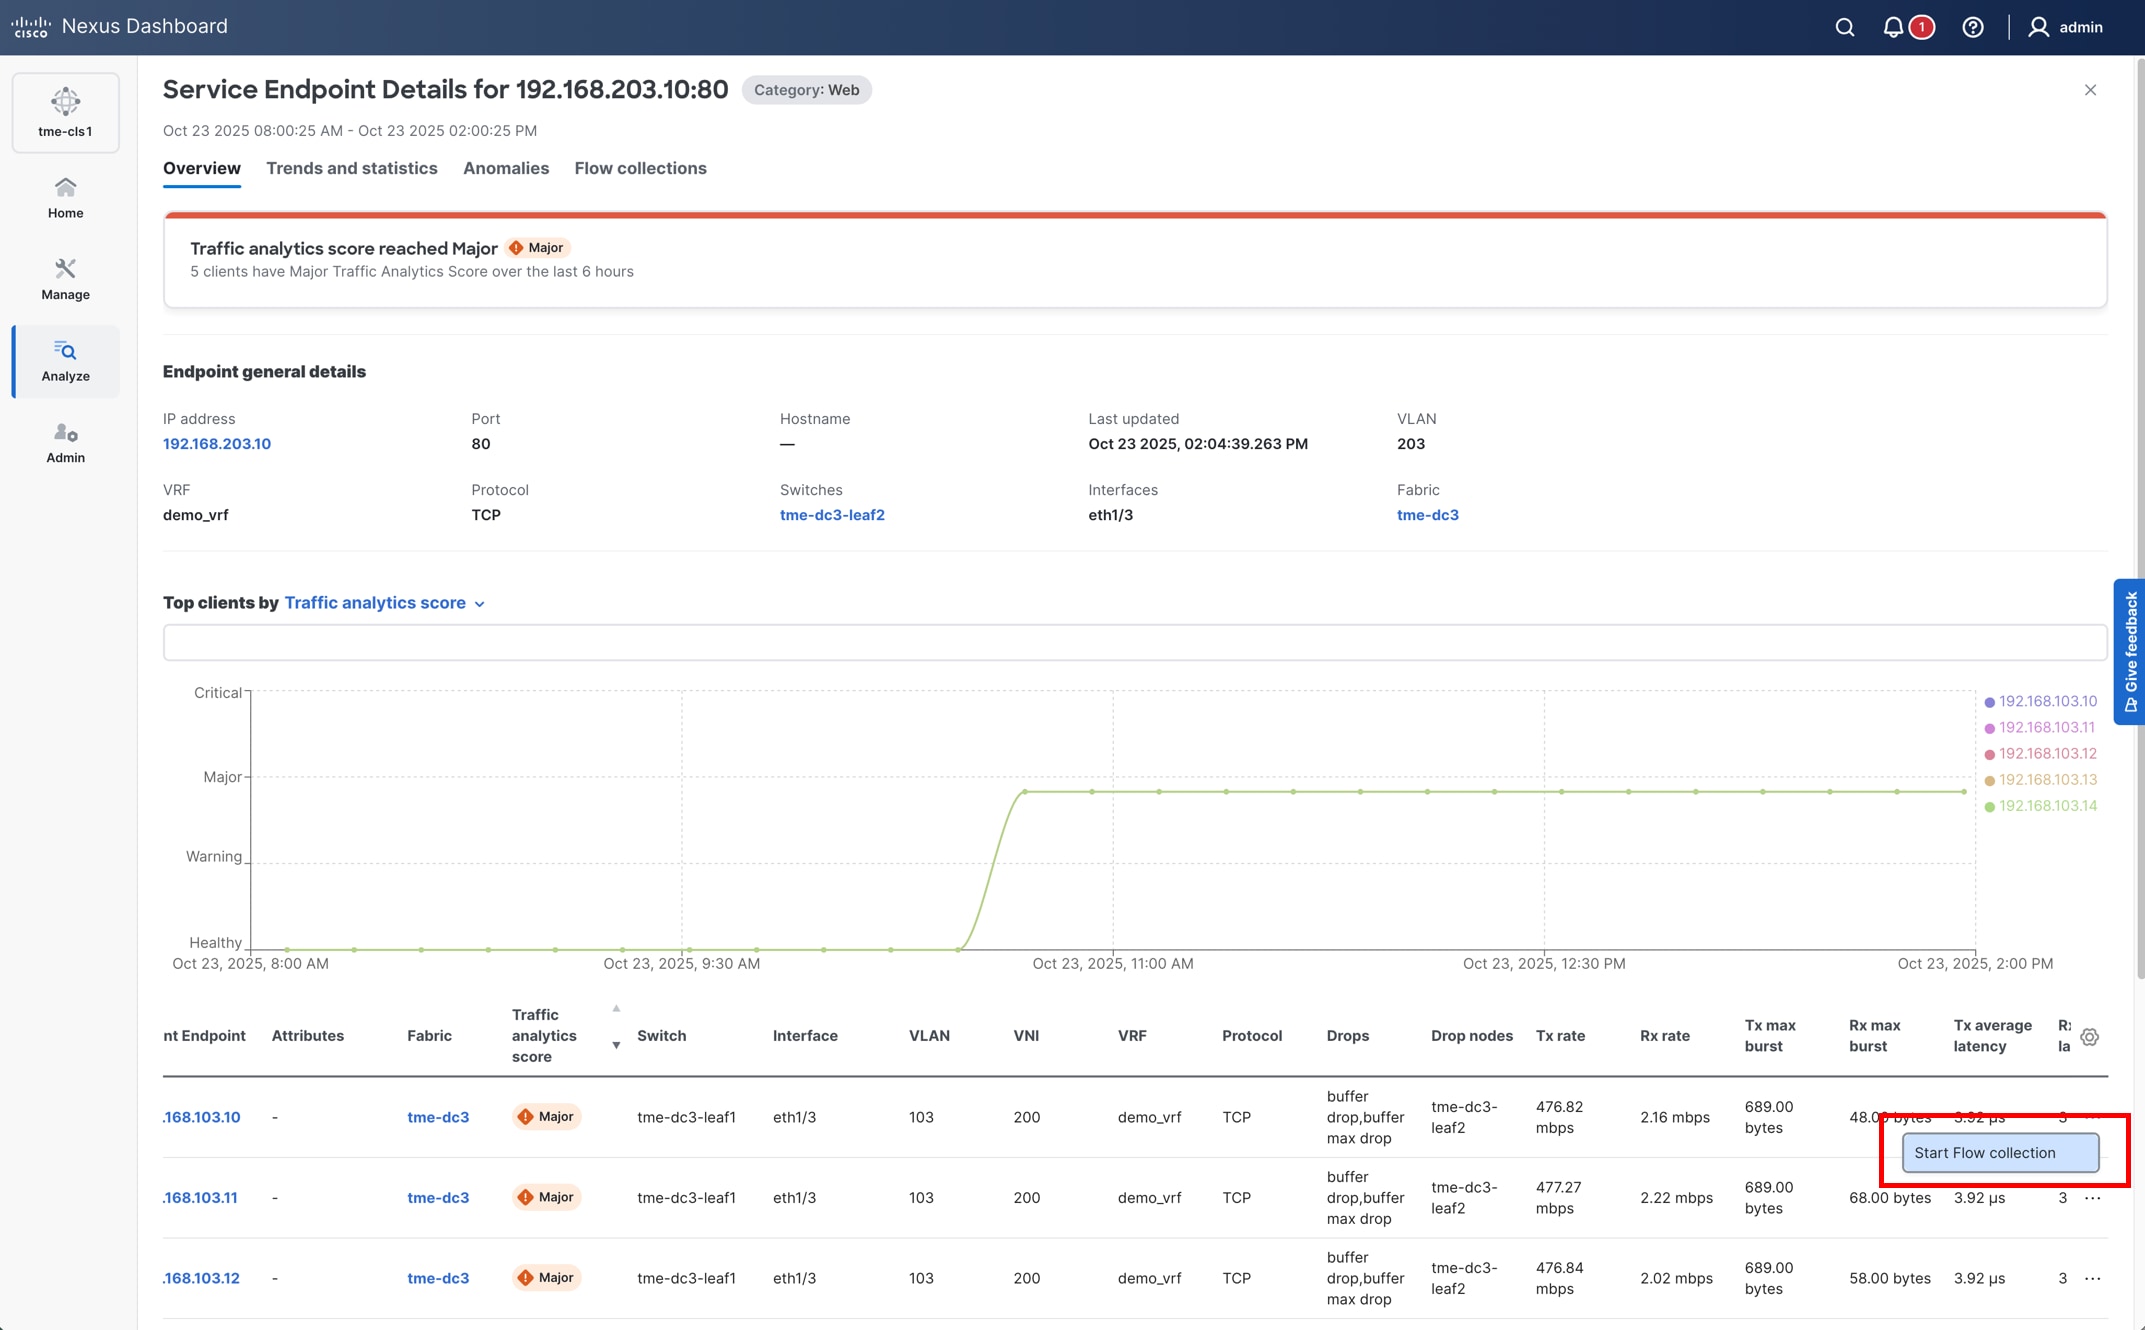
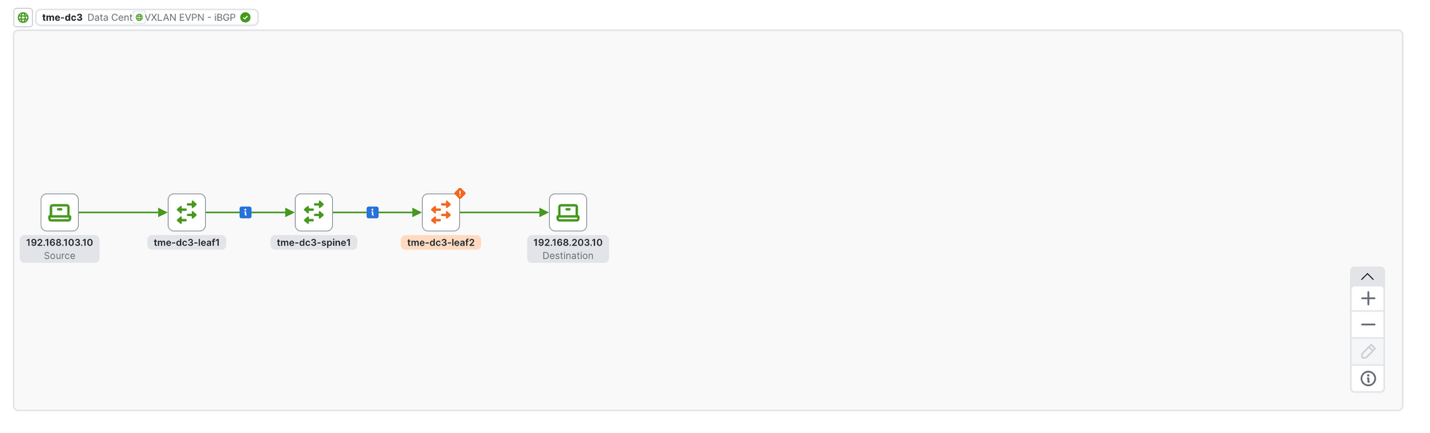
● On-demand flow troubleshooting for Traffic Analytics is not supported when using out-of-band telemetry but will be added in a later release of Nexus Dashboard. If this feature is of interest, then in-band management should be leveraged until this feature is made available via out-of-band.
◦ This feature refers to the ability to collect 5-tuple flow information in real time as a user triggered workflow. It can be found under Analyze -> Traffic Analytics -> Select Service Port -> Click “...” -> Start flow collection
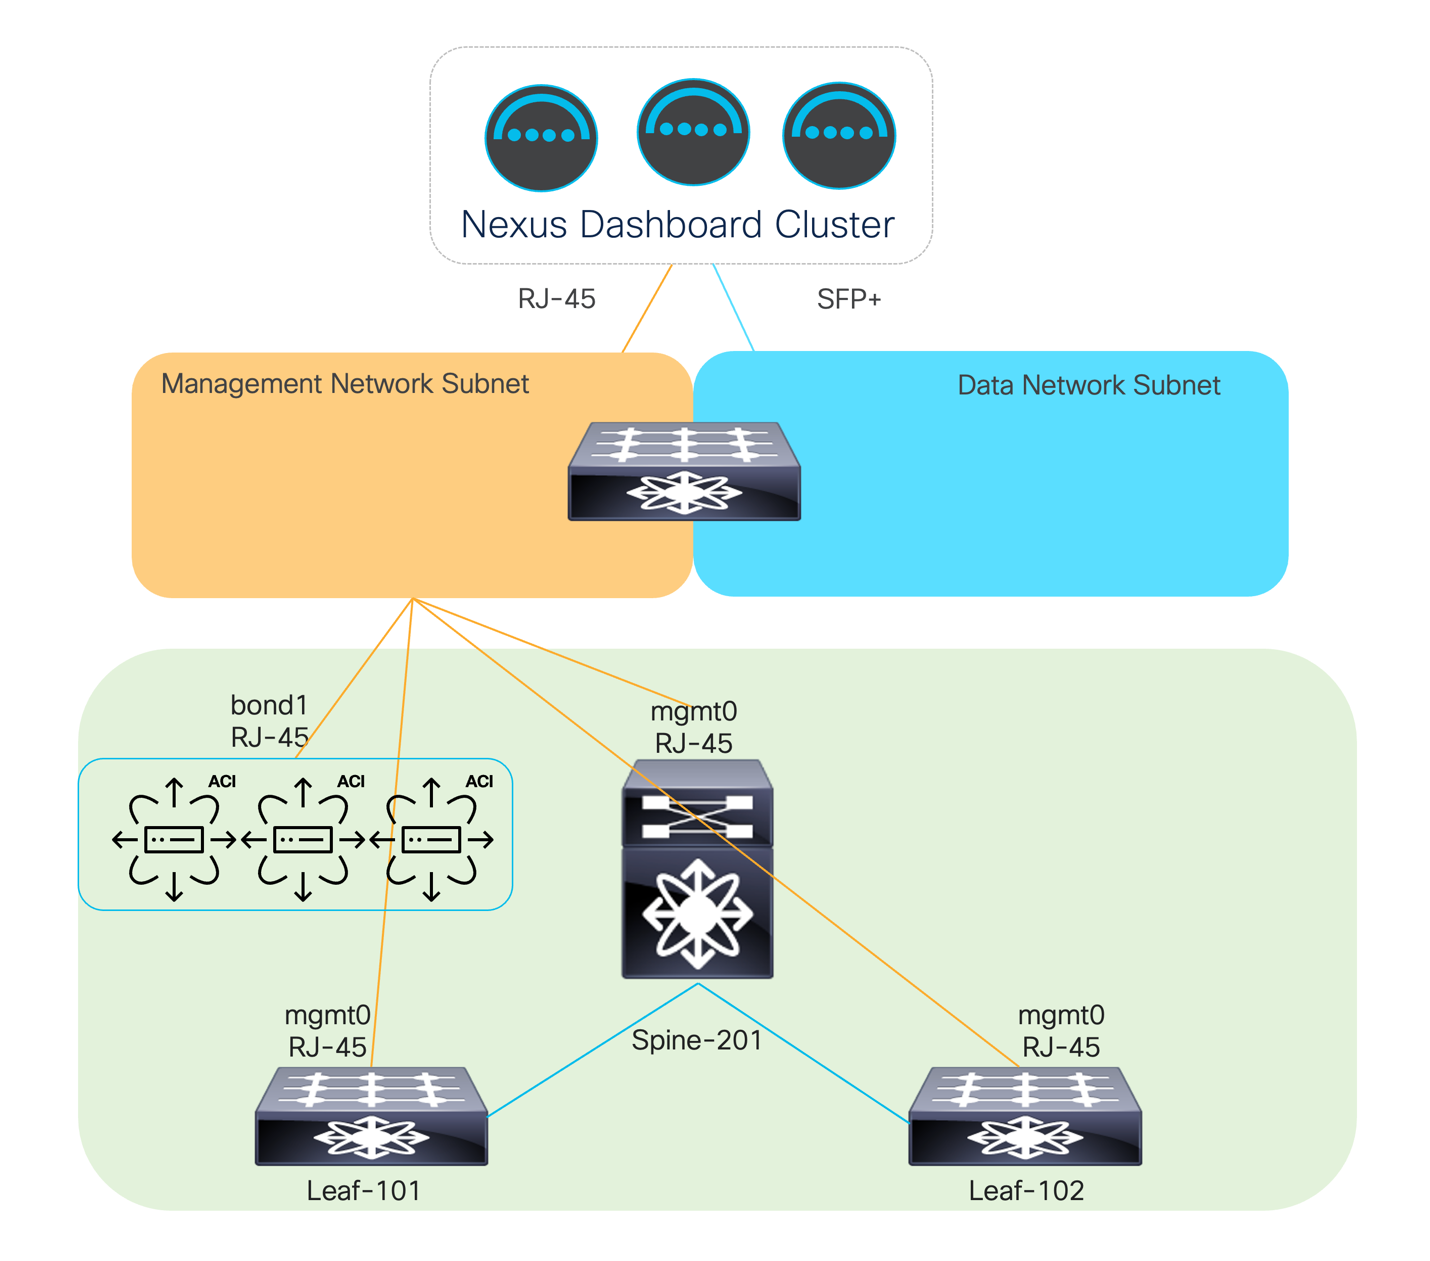
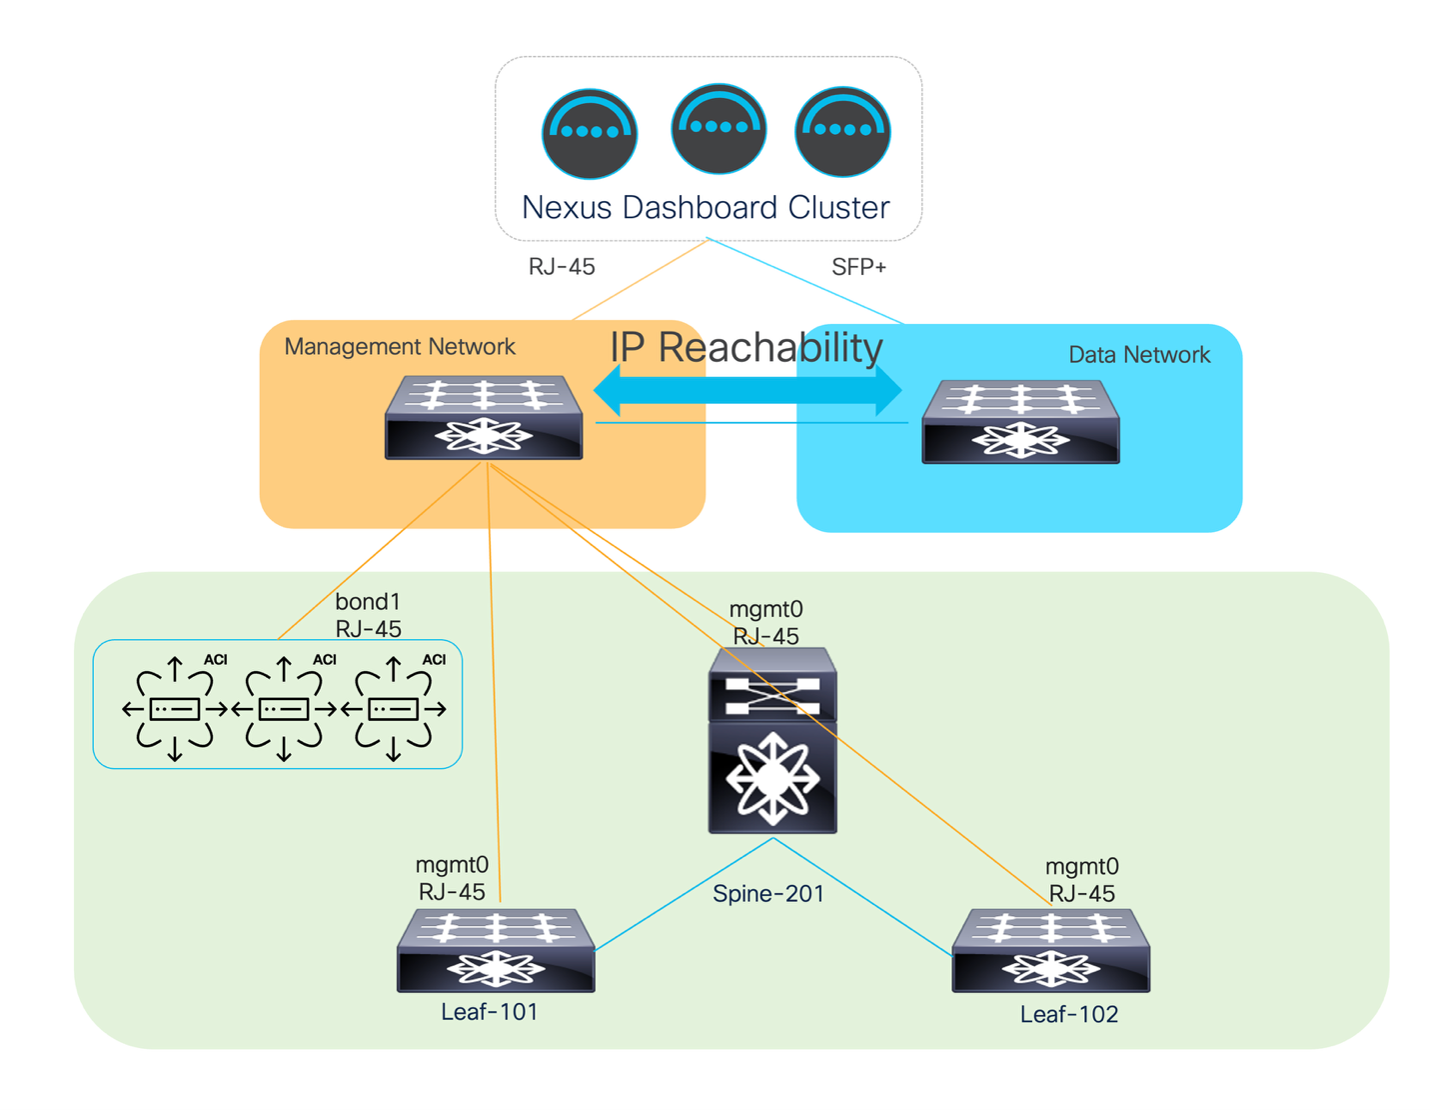
In the case of physical Nexus Dashboard appliances, the CIMC and management interfaces are RJ-45, and the data interfaces are SFP+. Hence, the upstream networking must support both. The following figures provide examples of physical topologies based on platform support for the interface form factors.
Verify out-of-band Management EPG and Switch IP Addresses
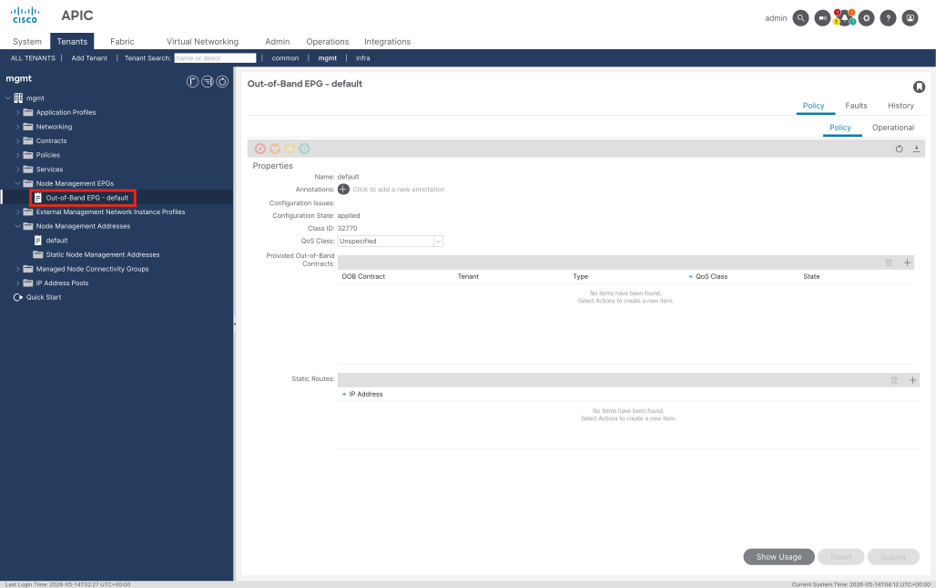
Ensure the out-of-band management EPG is configured in the mgmt tenant.
● In the APIC GUI, navigate to Tenants > mgmt > Node Management EPGs > out-of-band EPG - default.
● Verify the out-of-band EPG exists and has the appropriate properties. By default, all communication is allowed. If communication from certain subnets is being allowed by leveraging an External Management Instance Profile, ensure that the Nexus Dashboard Data IPs are defined and that a contract exists to allow communication to the APIC and switches. This is not a requirement, and the default allow all communication without specifying a provided out-of-band contract is sufficient for Nexus Dashboard integration.
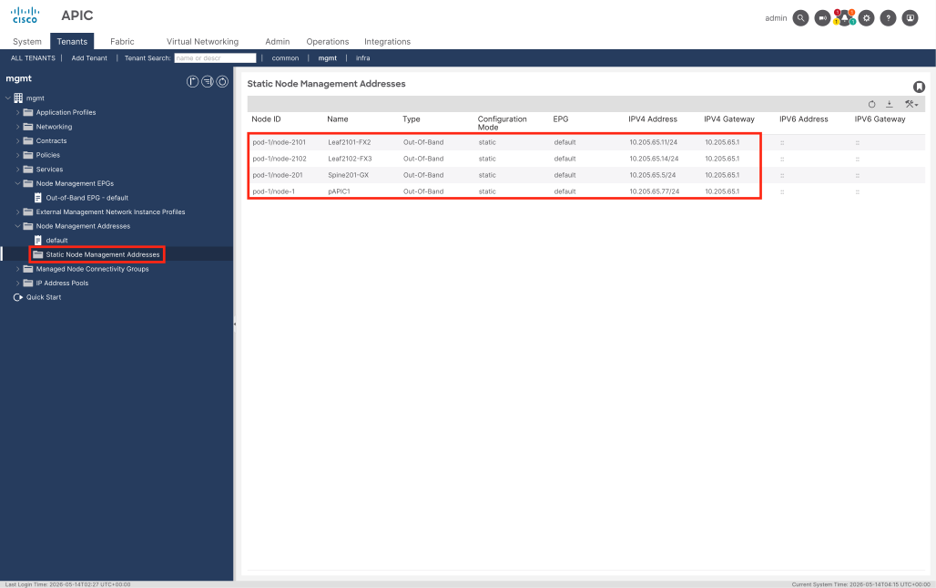
Ensure each APIC controller and switch has a valid mgmt IP.
1. In the APIC GUI, navigate to Tenants > mgmt > Node Management Addresses.
2. Ensure that there is the relevant node blocks or Static Node Management Addresses to assign a unique out-of-band IP address to each controller and switch.
Option #2 – via in-band Network
In-band management is a great option for streaming telemetry when the in-band configuration has already been deployed. In-band management has always been a supported way to streaming telemetry, and thus it supports all features and code versions on ACI.
For ACI fabrics running versions prior to 6.1(2), or when flow telemetry (as opposed to Traffic Analytics) is required, the in-band management network must be used to stream telemetry to Nexus Dashboard.
Note: If your ACI fabric is running version 6.1(2) or later, the out-of-band option described in the previous section is recommended for its simplicity.
In-band Management Configuration
In-band management allows for dedicated SVI interfaces on each switch to act as a management point, and also stream telemetry. The details and steps to configure this are illustrated in the in-band management configuration guide, and because of this, this whitepaper won’t cover the entire configuration steps in detail. However, in the context of Nexus Dashboard, it’s important to understand the recommended and supported deployment options when using in-band management outlined below.
Preferred Connectivity Option – Using Layer3-Out
When deploying Nexus Dashboard, it’s always best to consider the fabric type, and number of fabrics and switches that will be connected. To provide the most flexibility, it’s always recommended to connect the Nexus Dashboard data interfaces to a shared layer-3 network. This way you get flexibility in the number of fabrics that can be on-boarded without creating a physical dependency on the fabric that the Nexus Dashboard cluster is plugged into. Figure 16 illustrates an example topology containing multiple fabrics that share a common Layer-3 networking domain.
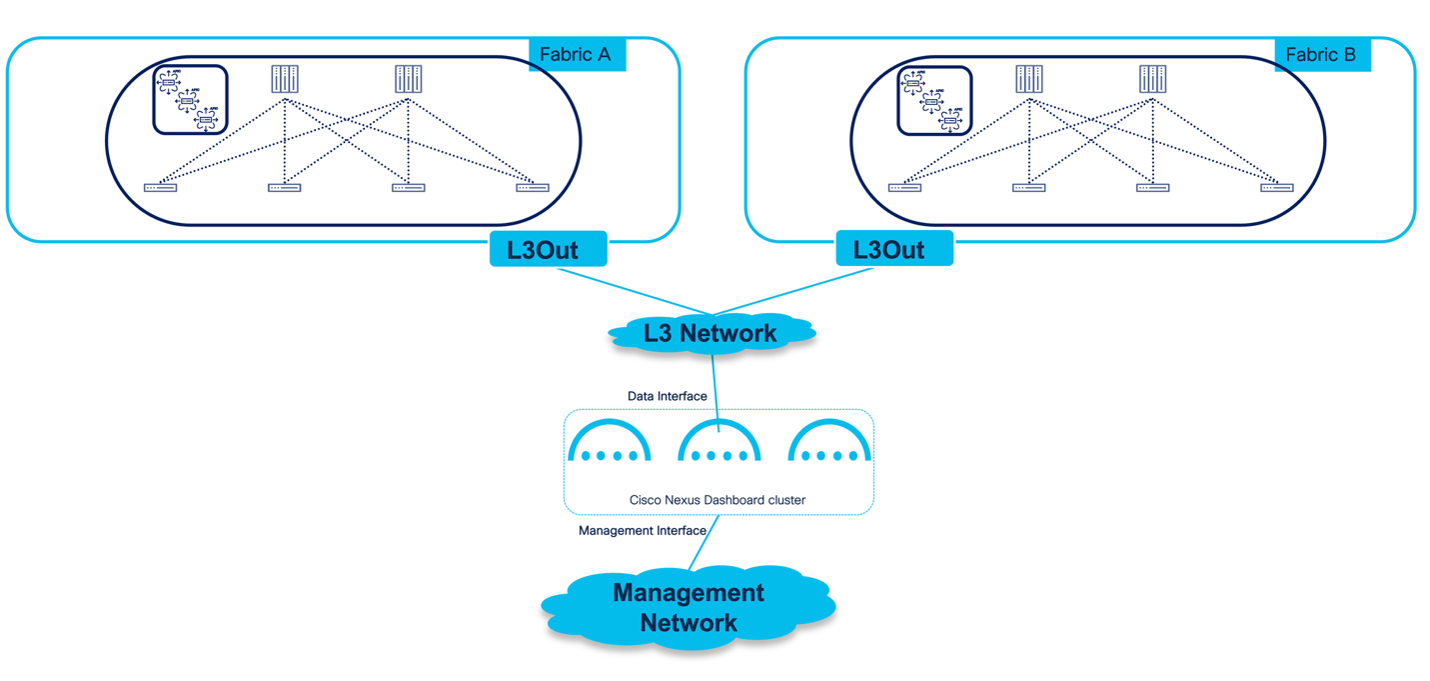
In this configuration, the ACI fabric in-band management configuration must be deployed to advertise the in-band subnet and IP addressing out of the fabric via a Layer-3 out. The Nexus Dashboard data interfaces would then connect to the same shared Layer-3 routable network for end-to-end connectivity.
It’s also important to note that for deployments using in-band management already even without Nexus Dashboard, the best practice is already to provide access to the in-band subnet and IP addresses via Layer3 out, so this simply allows Nexus Dashboard to act as another client that will utilize the network and in-band access
Connectivity Option 2 – Directly Attached Physical/Virtual Cluster
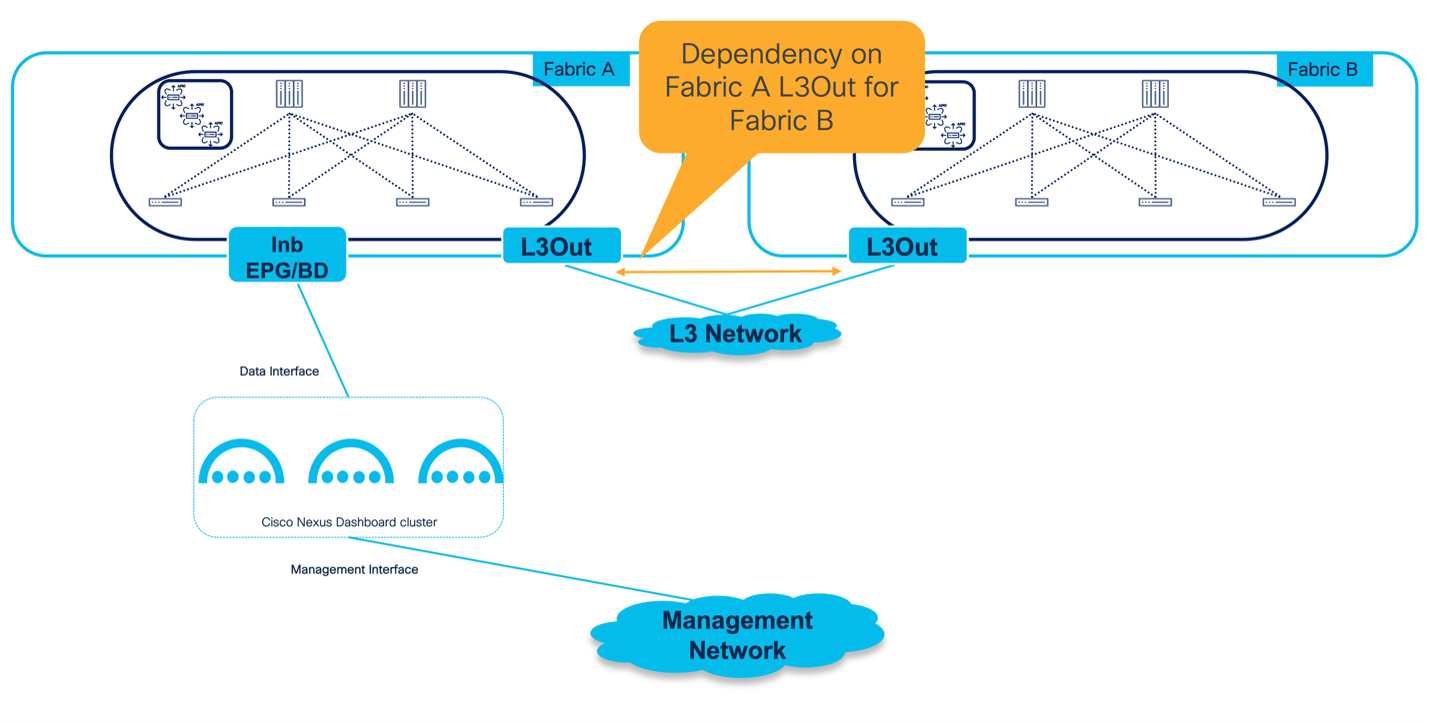
If the intent is to on-board multiple fabrics, this design is not preferred because you would need to utilize the fabric the nodes are plugged into to route to the other fabrics. This has two drawbacks, which are illustrated in Figure 17.
● Any impact to the routing on the source fabric would impact the telemetry and monitoring of the other fabrics.
● The in-band Layer3 out would be needed regardless, along with a shared Layer3 network, hence it making more sense to deploy using Layer-3 out anyways.
If the intent is to deploy a cluster to only monitor a single ACI fabric, you can deploy the Nexus Dashboard nodes to be physically connected to the fabric. This does provide localized in-band and data routing without having to deploy a Layer-3 out for the in-band network. Figure 18 illustrates an example topology for a single cluster and fabric.
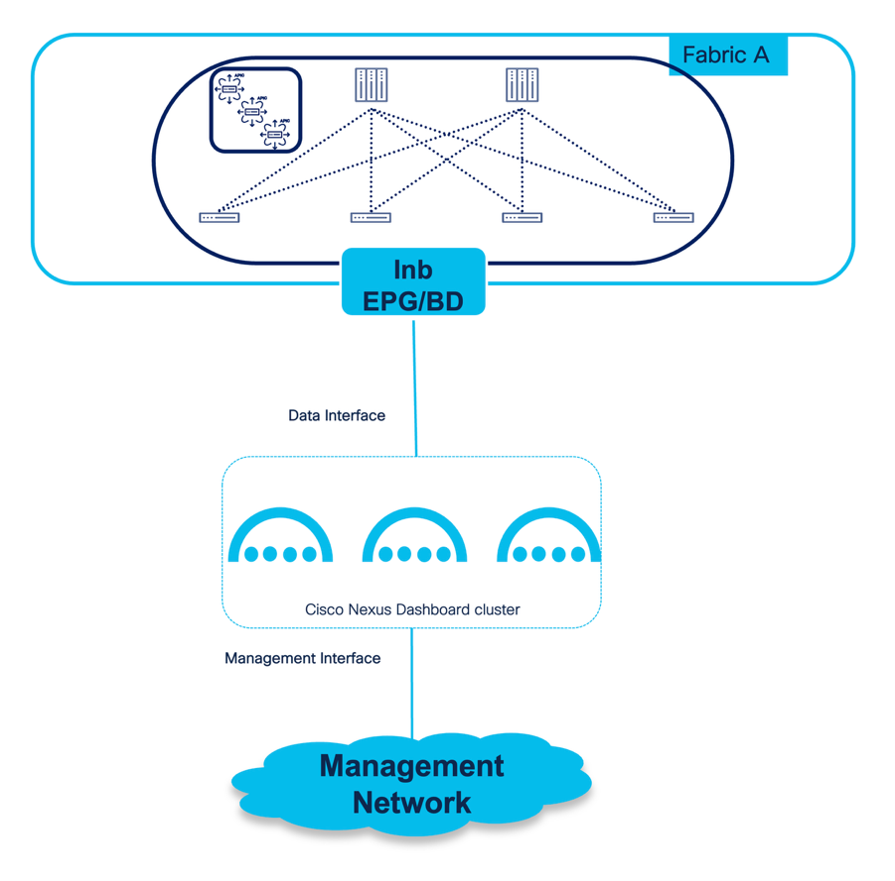
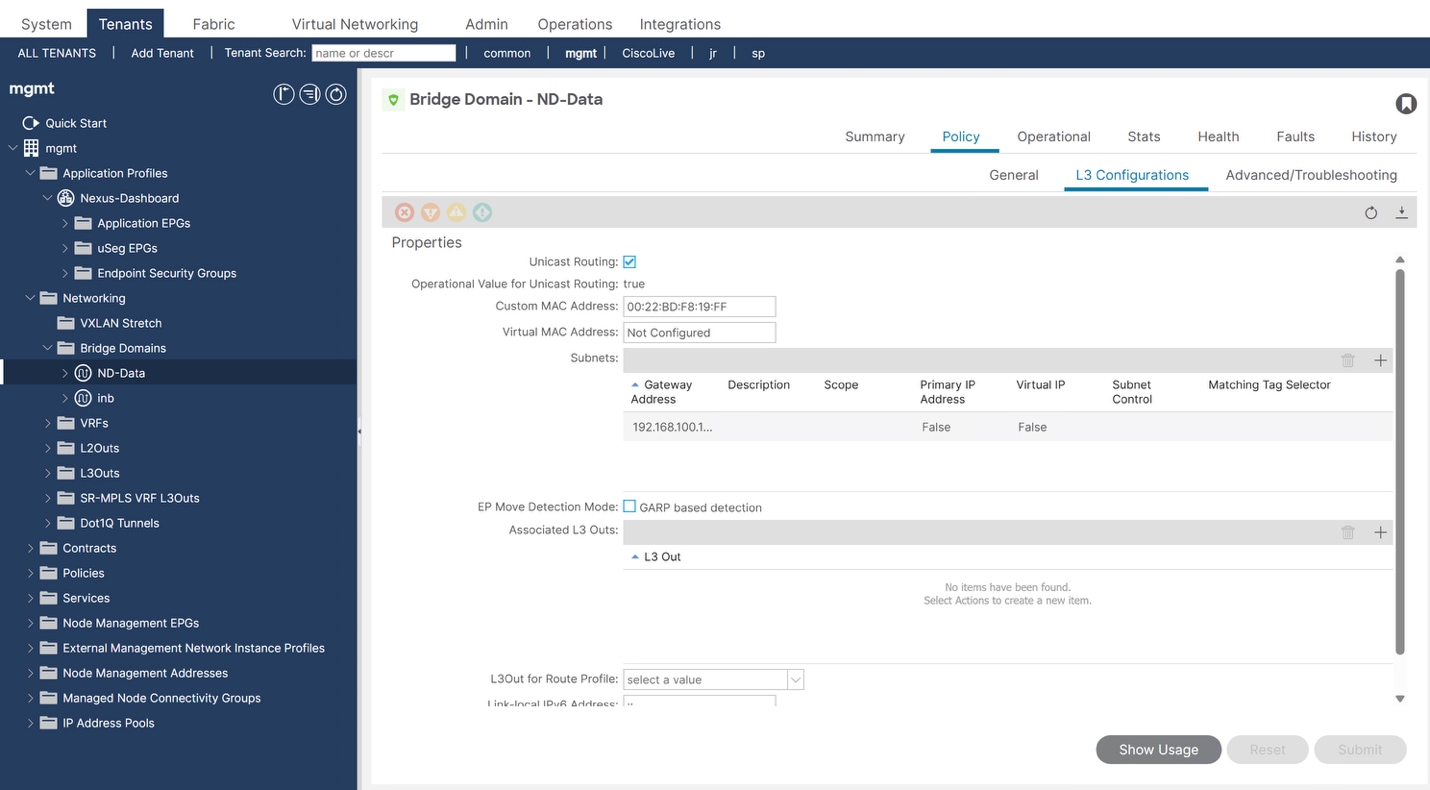
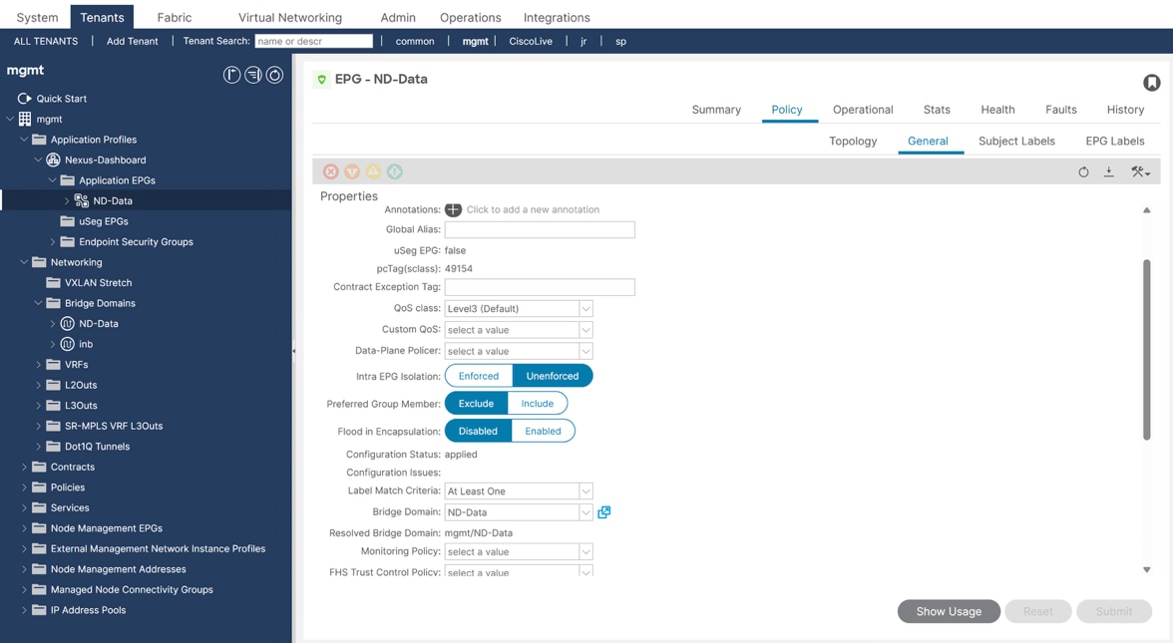
The key difference between this mode and the Layer3 out mode is that the Nexus Dashboard nodes are physically connected to the fabric, and there is APIC configuration for the Nexus Dashboard data network via an EPG/BD with the fabric as the default gateway. The steps to configure this would be as follows:
1. Create the access policies for the interfaces where the physical Nexus Dashboard appliances will be connected. This includes the VLAN pool, Physical Domain, AEP, and leaf/interface policies and groups.
2. Create a Bridge Domain and associate it to the mgmt:inb VRF. Using a custom VRF is not supported for Nexus Dashboard integration. Create a subnet IP that will act as the default gateway for the Nexus Dashboard data nodes.
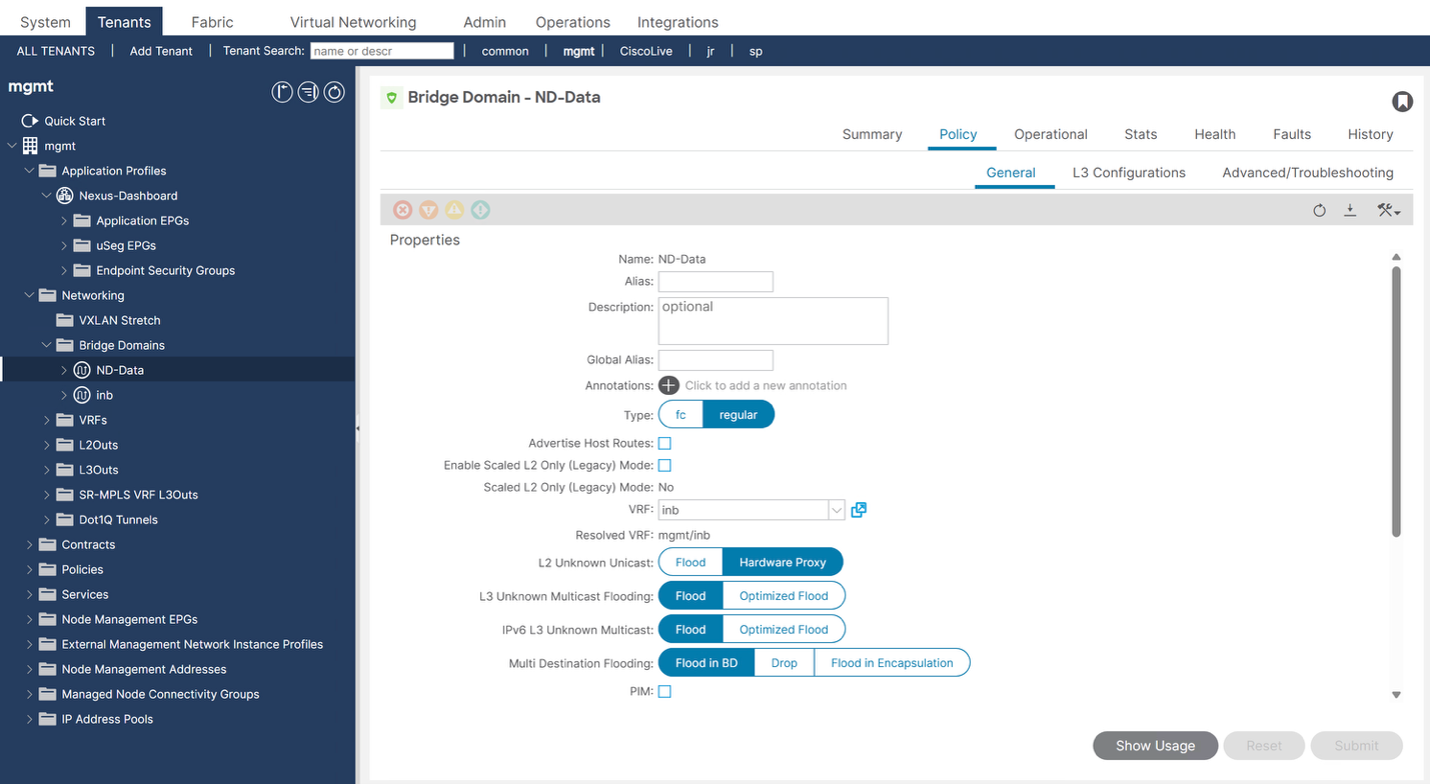
Using the default in-band EPG to connect the ND data interfaces is not supported, so a dedicated one will need to be created. Create an application profile for the Nexus Dashboard EPG. Create a matching EPG and associate the bridge domain that was created in the mgmt:inb VRF.
1. Add static path attachments under the EPG for the desired VLAN and interfaces of the Nexus Dashboard data nodes.
2. Create a contract between the EPG and the in-band node management EPG. This will allow communication between the Nexus Dashboard data nodes, and the in-band IP addresses of the APIC controller and switches.
3. Bootstrap the cluster using IP addresses from the bridge domain subnet that was created.
Connectivity Option 3 – Directly Attached Virtual Cluster using VMM Domain
If the Nexus Dashboard nodes are being deployed virtually in a supported VMM domain, you can also create the networking requirements and have APIC manage the EPG configuration. The steps to do this are identical to Option 2 for physical domain above, except instead of static attachments under the EPG, you would use a VMM domain attachment as shown in Figure 22.
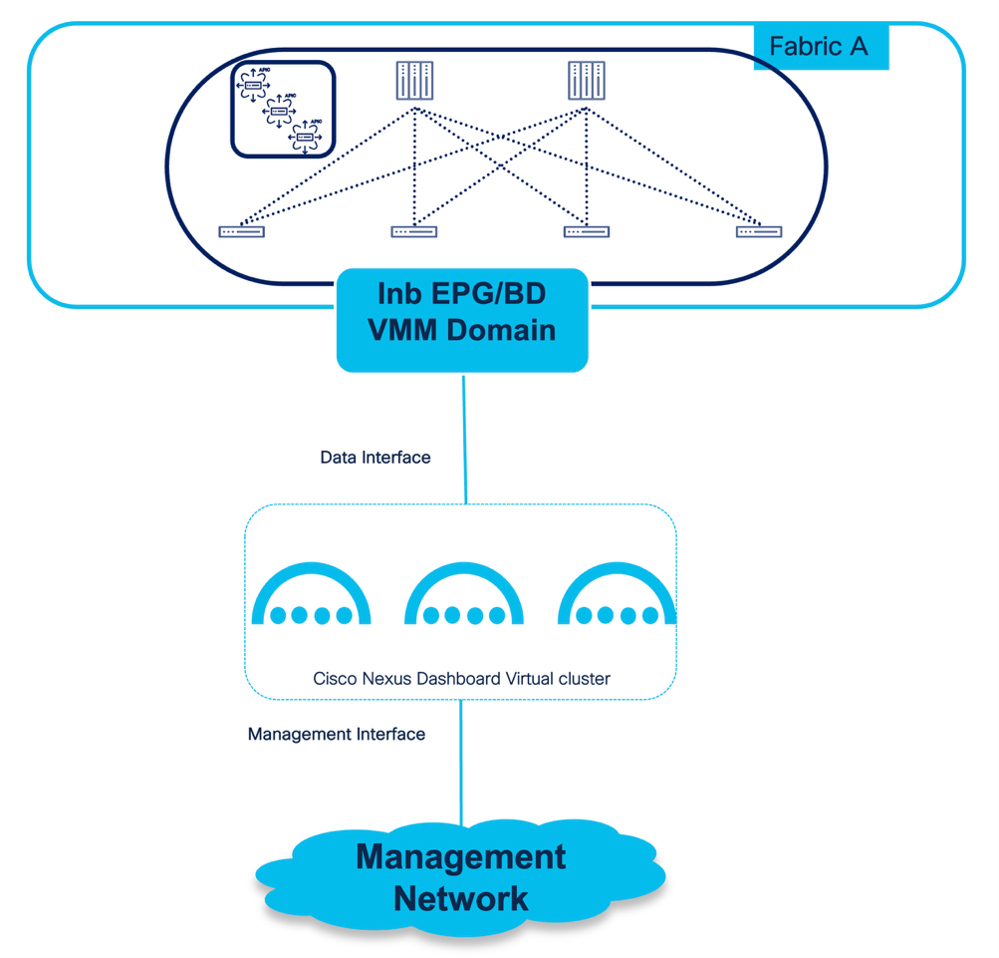
The same rule applies to the previous section where you cannot use the default in-band EPG, and thus a dedicated one will need to be created where the VMM domain can be mapped.
Hardware Telemetry and Flow Collection
Nexus Dashboard supports two modes of flow collection: Flow Telemetry (FT), and Traffic Analytics (TA), with TA being the preferred approach. The mode is configured as a system setting on the cluster, making the configuration cluster wide and applicable to all fabrics that are on-boarded to that cluster. The type of flow collection mode you are running, as well as whether there are existing Netflow collectors configured in the APIC dictates what configuration is required for the fabric node control policies.
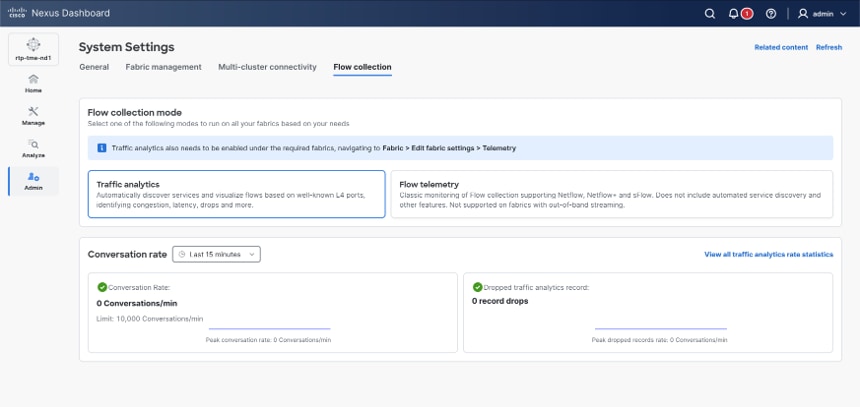
Flow Telemetry has existed since the beginning of Nexus Dashboard flow capabilities. It works by programming the ACI leaf switches to export their flow table every 1 second to Nexus Dashboard. Nexus Dashboard will stitch the records together and provide a dashboard of all flows that the user can search and explore. The flow records contain the full 5-tuple flow information as well as any statistics, latency, and drop metrics, thus reducing scale depending on the cluster size. When Flow Telemetry is used, it’s not possible to also export Netflow records to an existing Netflow collector. It’s either FT or Netflow but not both. When the cluster wide flow collection mode is set to “Flow Telemetry”, options for Netflow based exporting are also exposed in the fabric telemetry settings for each individual fabric that is on-boarded. Although, in that case, Traffic Analytics would be the preferred approach.
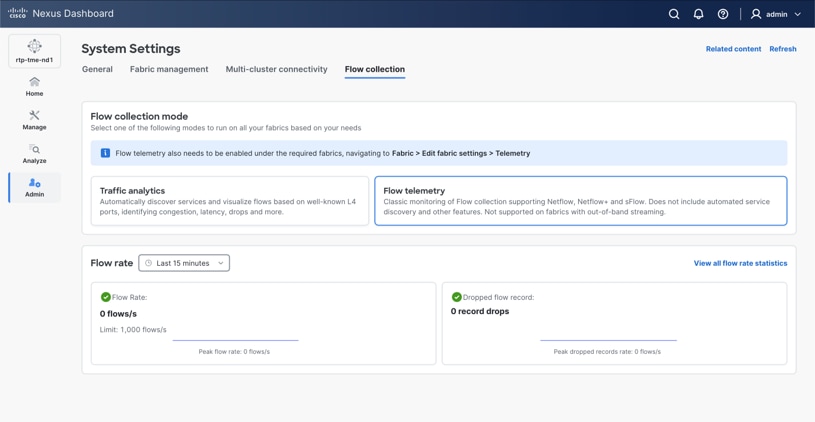
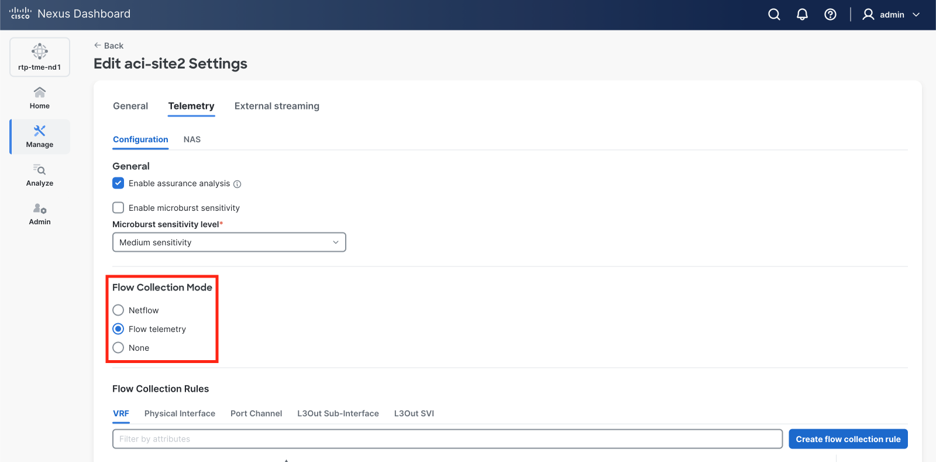
Traffic Analytics (TA) was added as part of the Nexus Dashboard release 3.1, with support for ACI coming in the ACI 6.1(1) release. Traffic Analytics has several enhancements over Flow Telemetry, including application service port identification and mapping, support for existing Netflow exporters, and better flow and conversation scale. TA Full leverages the Netflow v9 export functionality to allow the switch to export both TA and regular Netflow, and works for all models of hardware within the -FX, -GX, and -HX hardware family.
TA runs on the leaf switches, and relies on Flow Telemetry Events (FTE) on the spines to detect drops in a pervasive manner. As mentioned in the out-of-band telemetry section, triggering an on-demand flow collection to export the 5-tuple flow records from hardware is not supported when using out-of-band telemetry.
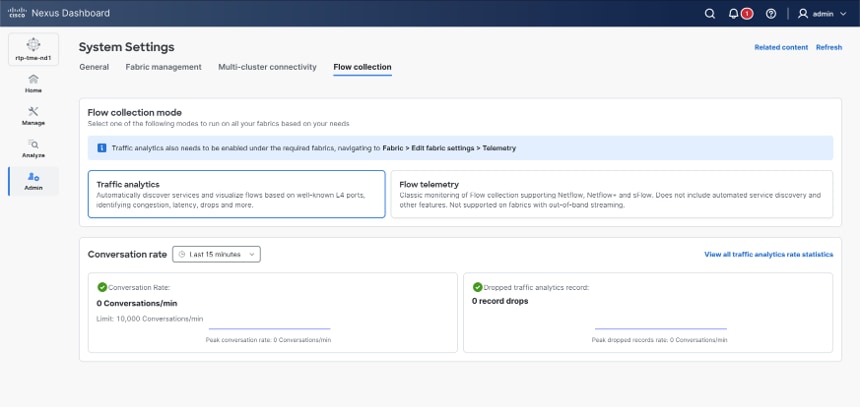
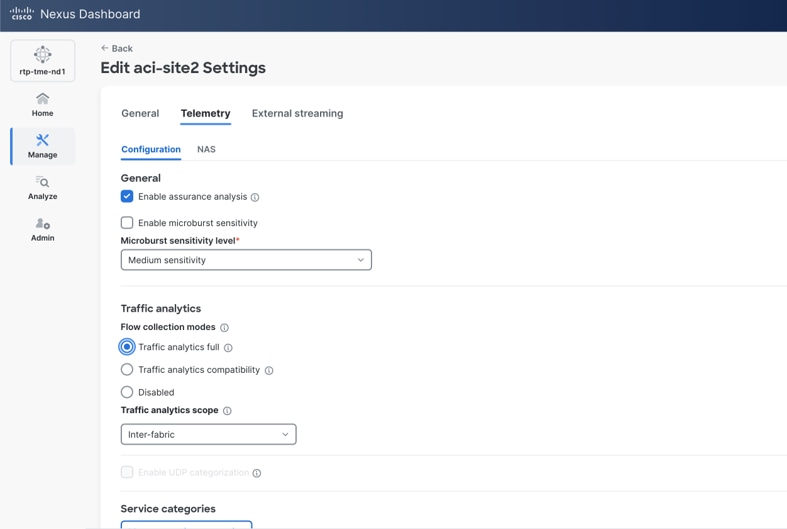
For a full list of features/guidelines and supported software versions and platforms for TA full visit the Nexus Dashboard User Content for your running release, and specifically the guidelines for ACI.
Traffic Analytics Compatibility Mode
Traffic Analytics Compatibility Mode was added in Nexus Dashboard 4.1 to support ACI fabrics that were not yet running the ACI 6.1(1)+ release supporting TA Full.
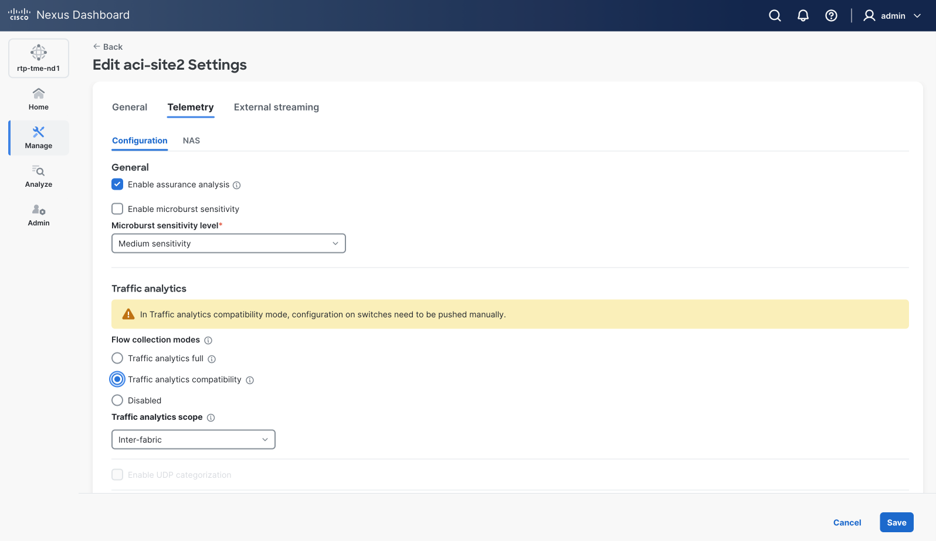
In this mode, the Nexus Dashboard collector IP addresses (PIPs) are manually configured as Netflow exporters within the APIC. Navigate to Admin > System Settings > External pools to see the Nexus Dashboard’s collector persistent IP addresses. The port number is 5641. Since APIC limits the configuration of Netflow exporters per switch to two, you can choose a single collector IP address to use for the entire fabric. If multiple fabrics are on-boarded, it’s recommended to use a different collector IP address for each fabric to distribute the Netflow data across Nexus Dashboard nodes. For example:
● Nexus Dashboard 3 Node Cluster
◦ 3 Persistent IP Addresses for Telemetry Collection
o Collector-1: 192.168.10.1
o Collector-2: 192.168.10.2
o Collector-3: 192.168.10.3
● ACI Fabric 1: Netflow exporter configuration set to export to 192.168.10.1
● ACI Fabric 2: Netflow exporter configuration set to export to 192.168.10.2
● ACI Fabric 3: Netflow exporter configuration set to export to 192.168.10.3
For a full list of features/guidelines and supported software versions and platforms for TA compatibility, visit the Nexus Dashboard User Content for your running release, and specifically the guidelines for ACI.
The fabric node control policy enables digital optical monitoring (DOM) and selects the feature priority for how the switches will export their hardware telemetry to external devices. DOM can be enabled to provide visibility for supported optics into temperature and voltage measurements at each lane of a given optic. Nexus Dashboard can use these readings to provide visibility into the optic health, raise anomalies, and do predictive optic failure analytics. This is required for Nexus Dashboard to receive and consume the appropriate flow data based on the configured flow collection mode within the cluster.
The Feature Selection has three mutually exclusive priorities:
Analytics Priority — This is used when the ACI fabric is integrated with Cisco Secure Workload (formerly known as Tetration Analytics.). This mode is not compatible with Cisco Nexus Dashboard.
Netflow Priority — This is used when the ACI fabric is intended to export Netflow records to external Netflow collectors. This setting is also used for Traffic Analytics (both full and compatibility modes) when other Netflow collectors are configured.
Telemetry Priority — This is used when the ACI fabric is intended to export flow telemetry, or Traffic Analytics Full records to Nexus Dashboard. This setting is only used when there are no other Netflow collectors configured.
If you intend to use an additional Netflow collector outside of Nexus Dashboard, the policy should be set to “Netflow Priority”. Traffic Analytics Full will still work in this configuration, but Flow Telemetry will not. Because of this, It is recommended to use Netflow priority always unless Flow Telemetry is required.
The below configuration steps outline how to create a Node Control Policy, assign it to a switch policy group, and reference that policy group for physical switches. This example uses DOM and Netflow to illustrate how the configuration should look when both Traffic Analytics, and a custom Netflow Exporter are configured (Netflow co-existence).
1. Navigate to Fabric > Fabric Policies > Policies > Monitoring > Fabric Node Controls. Modify the default policy or create a custom one.
2. Enable Digital Optics Monitoring, if desired.
3. For Feature Selection, choose the appropriate priority (e.g., Netflow Priority). The default is Telemetry Priority.
4. Click Submit.
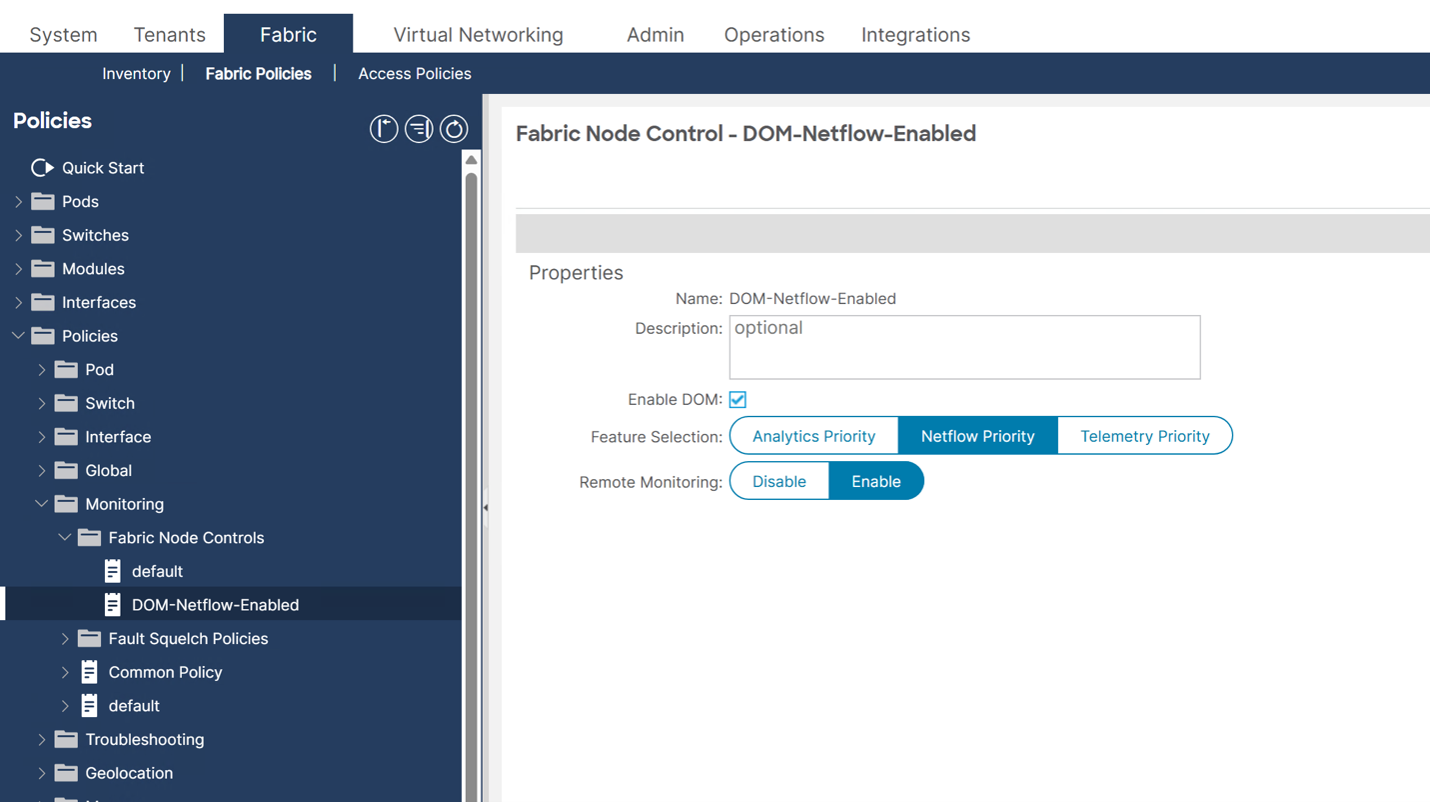
After configuring the fabric node control policy, apply it to all leaf and spine switches through switch policy groups and profiles.
1. Create a Leaf Switch Policy Group:
2. Navigate to Fabric > Fabric Policies > Switches > Leaf Switches > Policy Groups.
3. Right-click Policy Groups and choose Create Leaf Switch Policy Group.
4. Name the policy group (e.g., “DOM-Netflow-Enabled”).
5. Select the desired node control policy.
6. Click Submit.
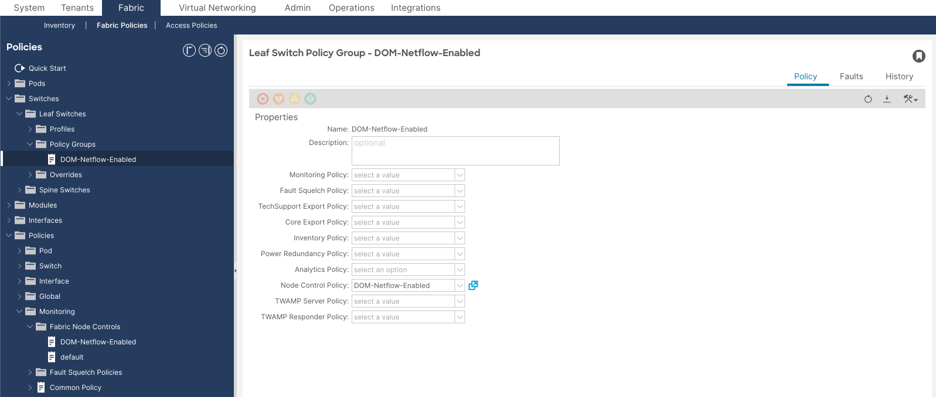
Create a Leaf Switch Profile:
1. Navigate to Fabric > Fabric Policies > Switches > Leaf Switches > Profiles.
2. Right-click Profiles and choose Create Leaf Switch Profile.
3. Name the profile and add a switch association.
4. Select all leaf switches in the Blocks section.
5. In the Policy Group drop-down list, choose the appropriate policy group.
6. Click Submit.
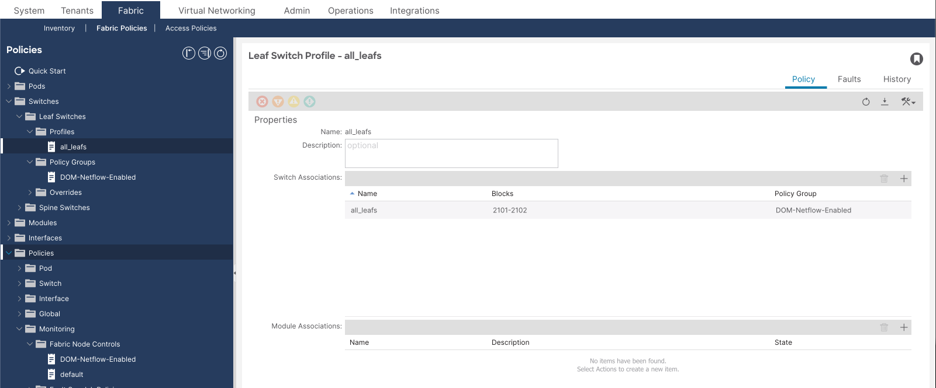
Repeat the above steps for Spine Switches — create a spine switch policy group referencing the node control policy, and a spine switch profile associating the policy group to all spine switches.
The following is an example of the Netflow exporter configuration after the fabric has been on-boarded to Nexus Dashboard (see section Adding the ACI Site to Nexus Dashboard and Enabling Telemetry), Traffic Analytics Full has been enabled, and there is one additional Netflow exporter configured to send to another collector.
tme-dc1-leaf1# show flow exporter
Flow exporter 192.168.10.6:
Destination: 192.168.10.6 ß Nexus Dashboard Persistent IP
VRF: mgmt:inb (1) ß VRF, either mgmt:inb (in-band) or management (out-of-band)
Destination UDP Port 5641 ß Custom UDP port for TA
Source: 192.168.1.101 ß Leaf IP address (either in-band or out-of-band)
DSCP 44
Export Version 255 ß Version 255 signifies we are doing TA full with flow table
Sequence number 111456
SwExport: Disabled
Type: Telemetry ß Traffic Analytics Full
Exporter Statistics
Number of Flow Records Exported 654355
Number of Export Packets Sent 111457
Number of Export Bytes Sent 128038032
Number of Destination Unreachable Events 0
Number of No Buffer Events 0
Number of Packets Dropped (No Route to Host) 0
Number of Packets Dropped (other) 0
Number of Packets Dropped (Output Drops) 0
Time statistics were last cleared: Never
Flow exporter Netflow-Ubuntu-1: ß Manually configured Netflow exporter
Destination: 172.17.0.11
VRF: jr-multi-site:v1 (1)
Destination UDP Port 6000
Source: 1.0.0.101
DSCP 16
Export Version 9 ß Netflow v9
Sequence number 835
SwExport: Disabled
Type: Netflow ß Regular Netflow exporter
Exporter Statistics
Number of Flow Records Exported 735
Number of Templates Exported 1794
Number of Export Packets Sent 835
Number of Export Bytes Sent 190168
Number of Destination Unreachable Events 0
Number of No Buffer Events 0
Number of Packets Dropped (No Route to Host) 0
Number of Packets Dropped (other) 0
Number of Packets Dropped (Output Drops) 0
Time statistics were last cleared: Never
Nexus Dashboard Site Configuration
Configuration and Interaction with APIC
When an ACI site is onboarded to Nexus Dashboard and telemetry is enabled, Nexus Dashboard will create and modify a few Managed Objects (MO’s) that will result in the creation of various things such as:
The Nexus Dashboard cluster information that is managing the APIC and receiving telemetry.
1. The telemetry configuration for both software and hardware telemetry on the ACI fabric.
2. For a complete list of objects that are touched, as well as their purpose, please visit the Nexus Dashboard User Content for your running version.
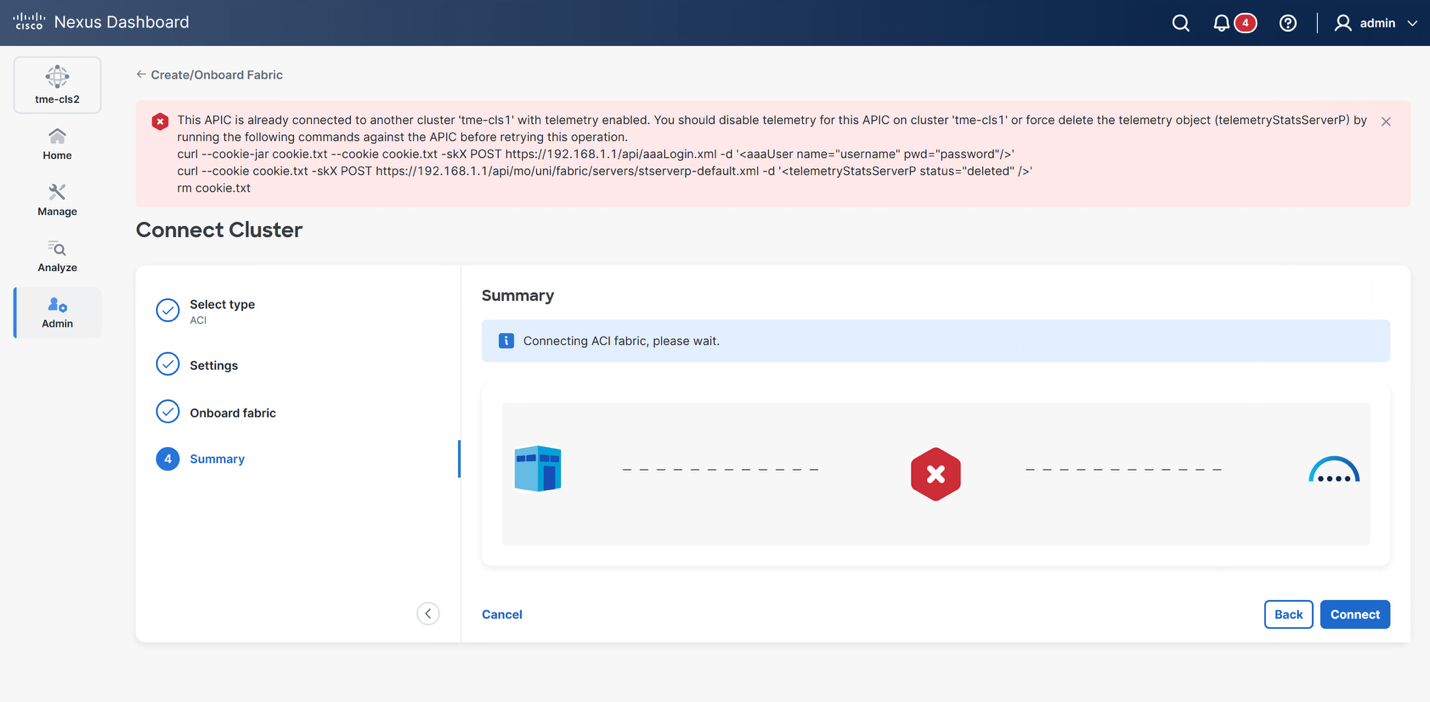
Because Nexus Dashboard will manage some configuration, only 1 cluster can be managing a fabric at a time. If a user tries to onboard the same ACI fabric to another Nexus Dashboard cluster where the telemetryStatsServerP object is already present pointing to a different cluster, you will see an error when adding the fabric including instructions for how to clean it up manually on the APIC CLI. This can be useful in scenarios where the old cluster has been deleted or removed, but the telemetry configuration was not cleaned up on the APIC. If the cluster listed in the error is still operational and managing the fabric, disable telemetry on that fabric via Nexus Dashboard before proceeding if that is the intent.
Adding the ACI Site and Enabling Telemetry
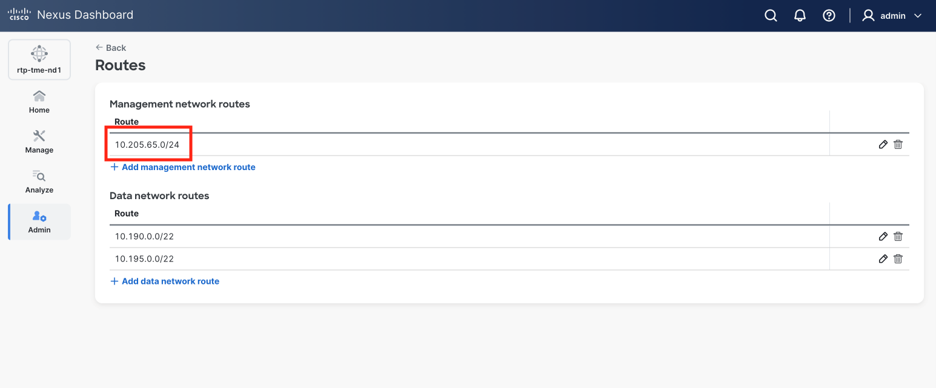
After preparing the ACI fabric (using either the out-of-band or in-band option, configuring fabric node control policies, etc), the next step is to add the ACI site to Nexus Dashboard. It’s important to note that the APIC can be discovered from Nexus Dashboard using the APICs out-of-band IP address, or in-band IP address. By default, Nexus Dashboard will always use the data network interfaces to communicate to the desired IP when the fabric is on-boarded. This means in scenarios where the management and data networks are isolated, a static route for the ACI out-of-band subnet needs to be configured under the management routes to ensure ND always uses the management interfaces to communicate to the ACI out-of-band IPs. If you choose to on-board the fabric using the in-band IP address of the APIC, then connectivity should work by default without the need for a static route since the data network should always have reachability to the in-band network on the ACI fabric for telemetry.
The following outlines the configuration steps to onboard an ACI site to Nexus Dashboard and enable telemetry:
1. Open a browser session to the Nexus Dashboard GUI.
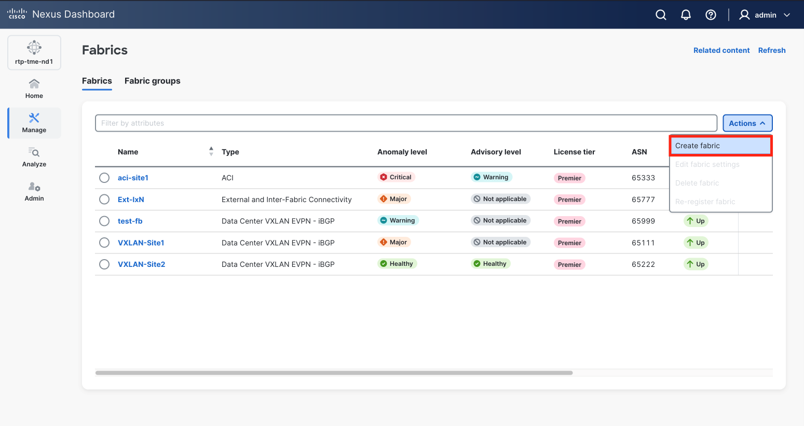
2. Navigate to Manage > Fabrics.
3. Click Actions > Create fabric.
4. Select Onboard ACI fabric as the category.
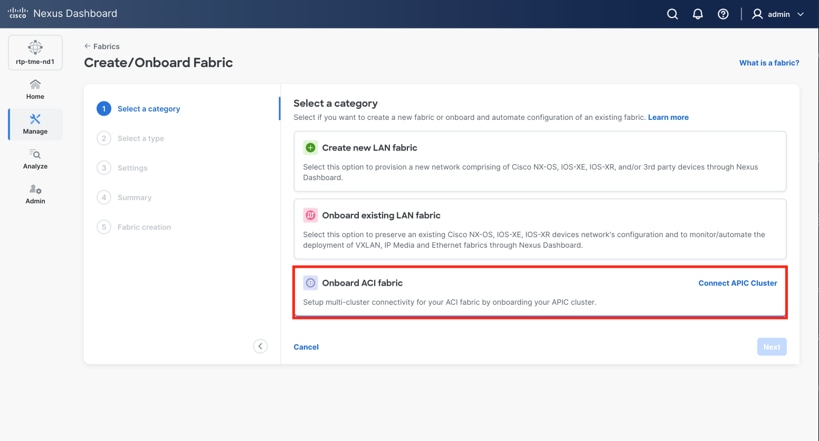
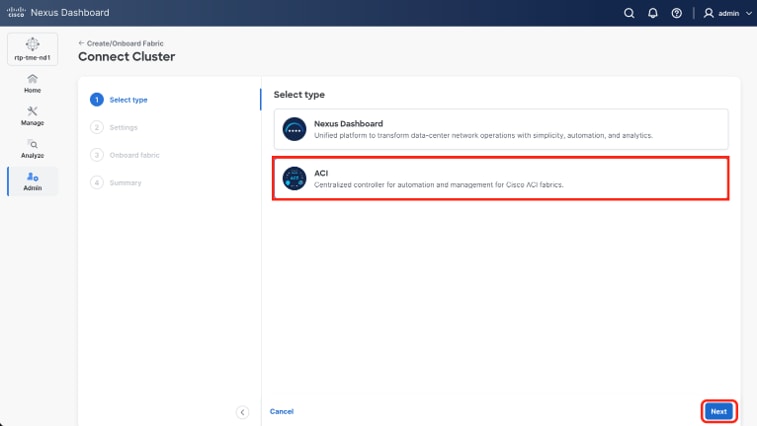
5. The next step takes you to the multi-cluster view. Select ACI.
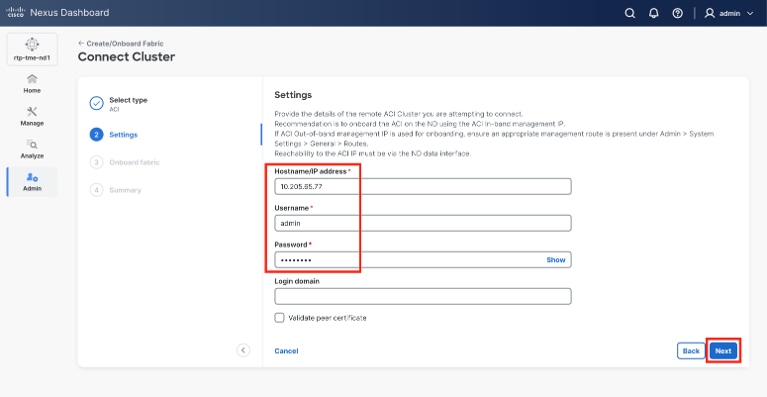
6. Provide the following settings.
● Hostname/IP Address — the in-band IP address (for in-band telemetry) or the OOB management IP address (for out-of-band telemetry) of the Cisco APIC. Hostname can also be used if resolved to the correct IP.
● Username — an admin-level username for authentication to the APIC
● Password — the password for the specified username. This is used only once for initial connection; certificate-based authentication is used subsequently.
● Login Domain — the login domain for the remote user if applicable.
● Validate peer certificate – this allows Nexus Dashboard to verify that the certificates of the APIC are valid and are signed by a trusted Certificate Authority (CA).
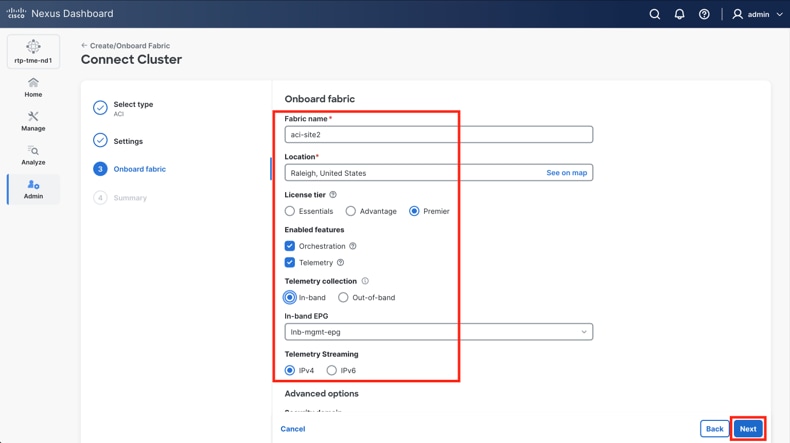
7. Provide the following settings to Onboard fabric.
● Fabric name – the name of the fabric as it will appear within Nexus Dashboard
● Location – physical location of the fabric. This data is used to place the fabric on the map within the global default login page.
● License tier – the license tier the fabric is licensed and entitled for.
● Enable Telemetry – Check this box to enable telemetry.
● Telemetry collection – Select Either in-band or out-of-band
● If in-band is selected, choose the correct in-band management EPG from the dropdown.
● Telemetry Streaming – choose whether the in-band or out-of-band network is using IPv4 or IPv6.
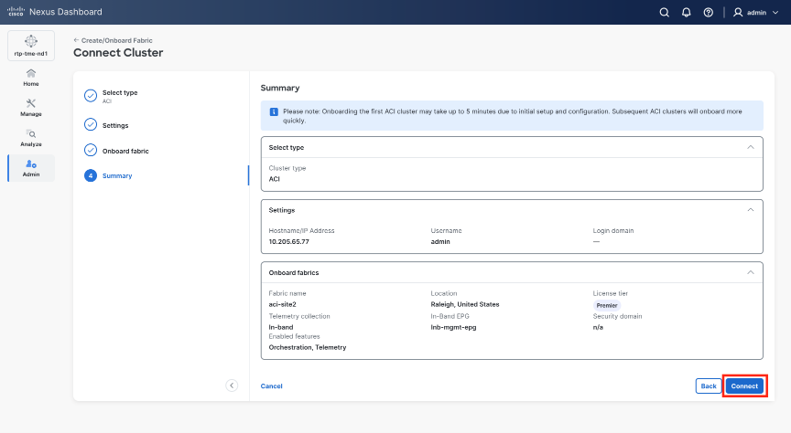
8. Click Connect after reviewing all settings.
Verifying the Fabric is Onboarded
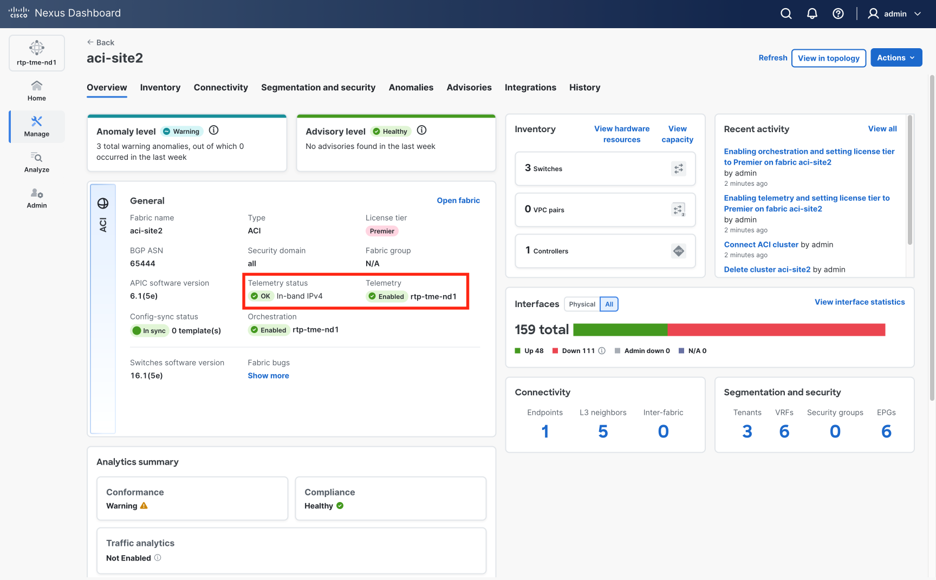
At this point the fabric will be onboarded to Nexus Dashboard and the telemetry configuration will be pushed to the APIC. For the list of objects that will be created or modified on APIC, please refer to the Configuration and Interaction with APIC section next. Verify that the fabric has been on-boarded correctly within the Manage > Fabrics view and that the telemetry status is “OK”.
Enabling Flow Collection on the Fabric
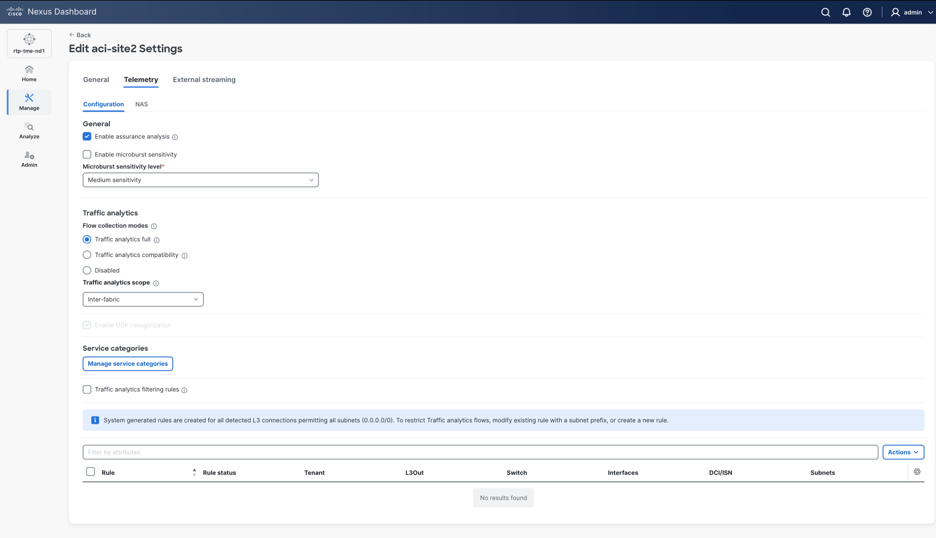
Once the fabric has been on-boarded, and telemetry has been enabled, flow collection configuration can be performed. For an overview of the supported flow collection features, please see the Hardware Telemetry and Flow Collection section.
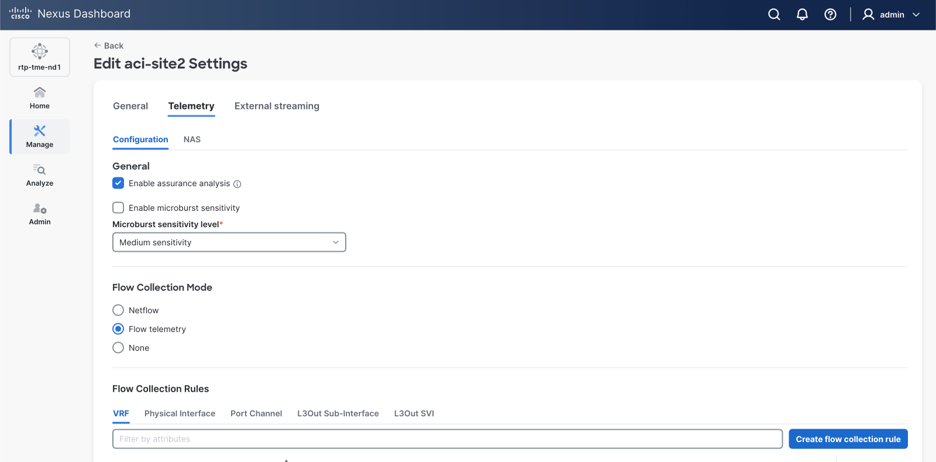
Flow configuration can be configured by navigating to Manage > Fabrics > Fabric Name > Edit fabric settings > Telemetry. There are a few important configuration options to consider:
● Flow collection mode: This is determined based on the cluster level setting: Either Flow Telemetry, or Traffic Analytics.
● Traffic Analytics Scope: Whether to monitor only flows to endpoints in the fabric, or also include transit flows where the fabric is performing transit routing. More details can be found in the Nexus Dashboard User Content.
● Filter Rules: Nexus Dashboard supports prefix based rules in a whitelist model. This means that any prefix that is defined will be exported if the source or destination IP address matches the configured prefix. All other flows will not be exported. This is very helpful in fabrics with high scale where the number of flows being exported needs to be reduced. More details can be found in the Nexus Dashboard User Content.
Pausing/Resuming/Reconfiguring Telemetry
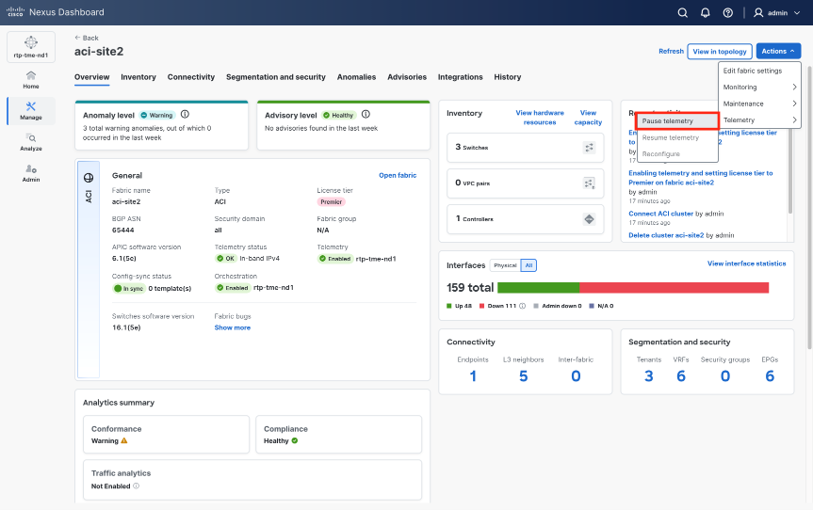
Pausing telemetry stops the real-time data collection while preserving all historical telemetry data up to the point of pausing. Real-time telemetry data will only be available once telemetry is resumed. This can be useful if you want Nexus Dashboard to clean up all configuration for telemetry on a given fabric. For example: wanting to pause, and disable telemetry on the fabric before moving the telemetry configuration to a different cluster.
To pause telemetry:
● Navigate to Manage > Fabrics and select the fabric.
● Click Actions > Telemetry > Pause Telemetry.
Resuming telemetry will re-push the telemetry configuration to the APIC and resume the processing of the telemetry data coming from the fabric. To resume telemetry after it has been paused:
● Navigate to Manage > Fabrics and select the fabric.
● Click Actions > Telemetry > Resume Telemetry.
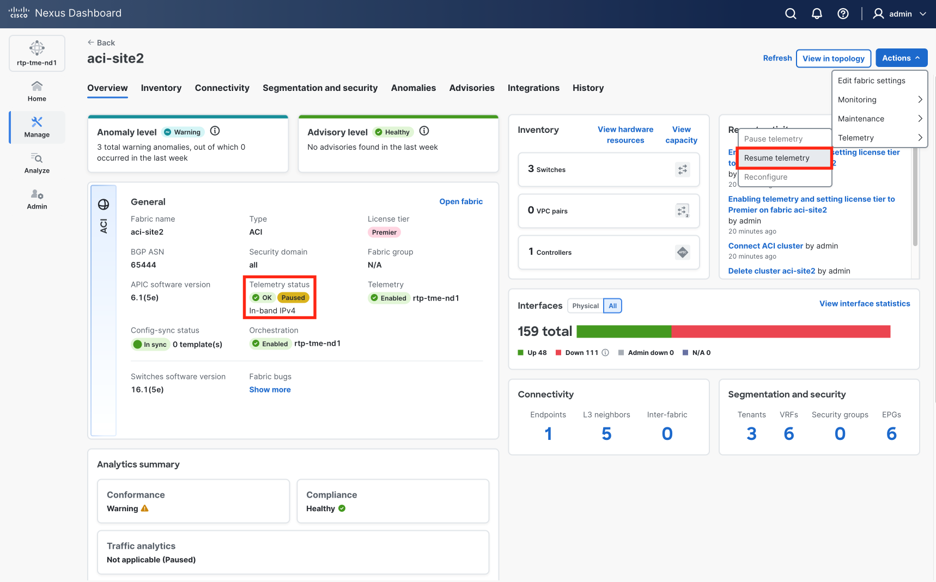
Under certain scenarios, primarily when a backup/restore operation is performed on the Nexus Dashboard cluster, telemetry might need to be reconfigured on the fabric(s).
For ACI fabrics, telemetry re-configuration is typically not required when the restored Nexus Dashboard cluster retains the same persistent IP addresses that were previously used. In this case, the leaf switches continue streaming telemetry data to the same destination IPs, and no configuration change is needed on the fabric side.
However, telemetry re-configuration is required for ACI fabrics when the restored Nexus Dashboard cluster uses different persistent IP addresses than the original cluster. This typically occurs in disaster recovery scenarios where the cluster is restored in a different logical Data Center, on a different IP subnet, or when the persistent IP pool has been modified. In this case, the ACI fabric must be reconfigured to stream telemetry to the new persistent IP addresses of the restored cluster.
Re-Configuration Process
When telemetry re-configuration is required the process involves:
1. Removing the existing telemetry configuration from the managed switches or fabric.
2. Re-pushing the updated telemetry configuration from the restored Nexus Dashboard cluster.
Nexus Dashboard will prompt the user to approve this procedure, which is then fully automated and executed by Nexus Dashboard itself. This step ensures that the switches are properly re-aligned with the restored cluster and can resume streaming telemetry data to the correct persistent IP addresses. Until this process is completed, telemetry data ingestion from the affected fabrics may be interrupted.
Recommendation: Plan for this additional post-restoration step when defining your disaster recovery procedures and SLAs. For NX-OS fabrics, always include telemetry re-configuration in the recovery runbook, as it is required regardless of the restored cluster's IP configuration. For ACI fabrics, include telemetry re-configuration in recovery scenarios where the restored cluster will use different persistent IP addresses than the original. The telemetry re-configuration process may cause a brief disruption to telemetry data ingestion as the fabric-side configuration is cleared and re-applied. No fabric data plane impact is expected during this operation — switches continue to forward production traffic normally. Only the telemetry control plane between the fabric and the Nexus Dashboard cluster is temporarily affected.
To reconfigure telemetry:
● Navigate to Manage > Fabrics and select the fabric.
● Click Actions > Telemetry > Reconfigure.
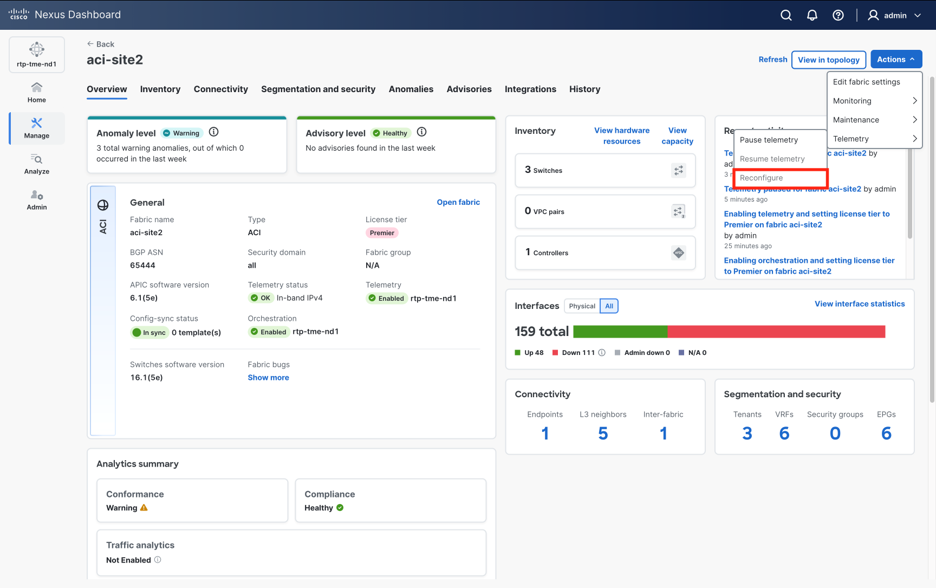
Note: This operation will be greyed out unless the system makes it available under operations like backup/restore.