
First Published: 2024-03-07
Americas Headquarters
Cisco Systems, Inc.
170 West Tasman Drive
San Jose, CA 95134-1706
USA
http://www.cisco.com
Tel: 408 526-4000
800 553-NETS (6387)
Fax: 408 527-0883
New and Changed Information
The following table provides an overview of the significant changes up to the current release. The table does not provide an exhaustive list of all changes or the new features up to this release.
| Feature | Description | Release | Where Documented |
|---|---|---|---|
|
Navigation Update |
Topology is now accessible from Overview > Topology |
6.4.1 |
This document is available from your Cisco Nexus Dashboard Insights GUI as well as online at www.cisco.com. For the latest version of this document, visit Cisco Nexus Dashboard Insights Documentation.
About Topology
About Topology
Topology displays the interconnection of the nodes in the fabric using the LLDP and CDP protocol information. The topology view helps find the nodes that are impacted by anomalies.
Topology displays all the nodes and the anomaly levels for the selected sites with a radial graph.
The page displays the list of nodes, node types, LLDP information from a leaf node to another leaf node, IPN, and anomaly level on the link. In this view, you can distinguish between a spine node, leaf node, and border leaf node by the different avatars.
IPN links are spine node links connected to the IPN and are distinguished from the links connected to the internal leaf nodes. The IPN is shown as a physical entity in the topology.
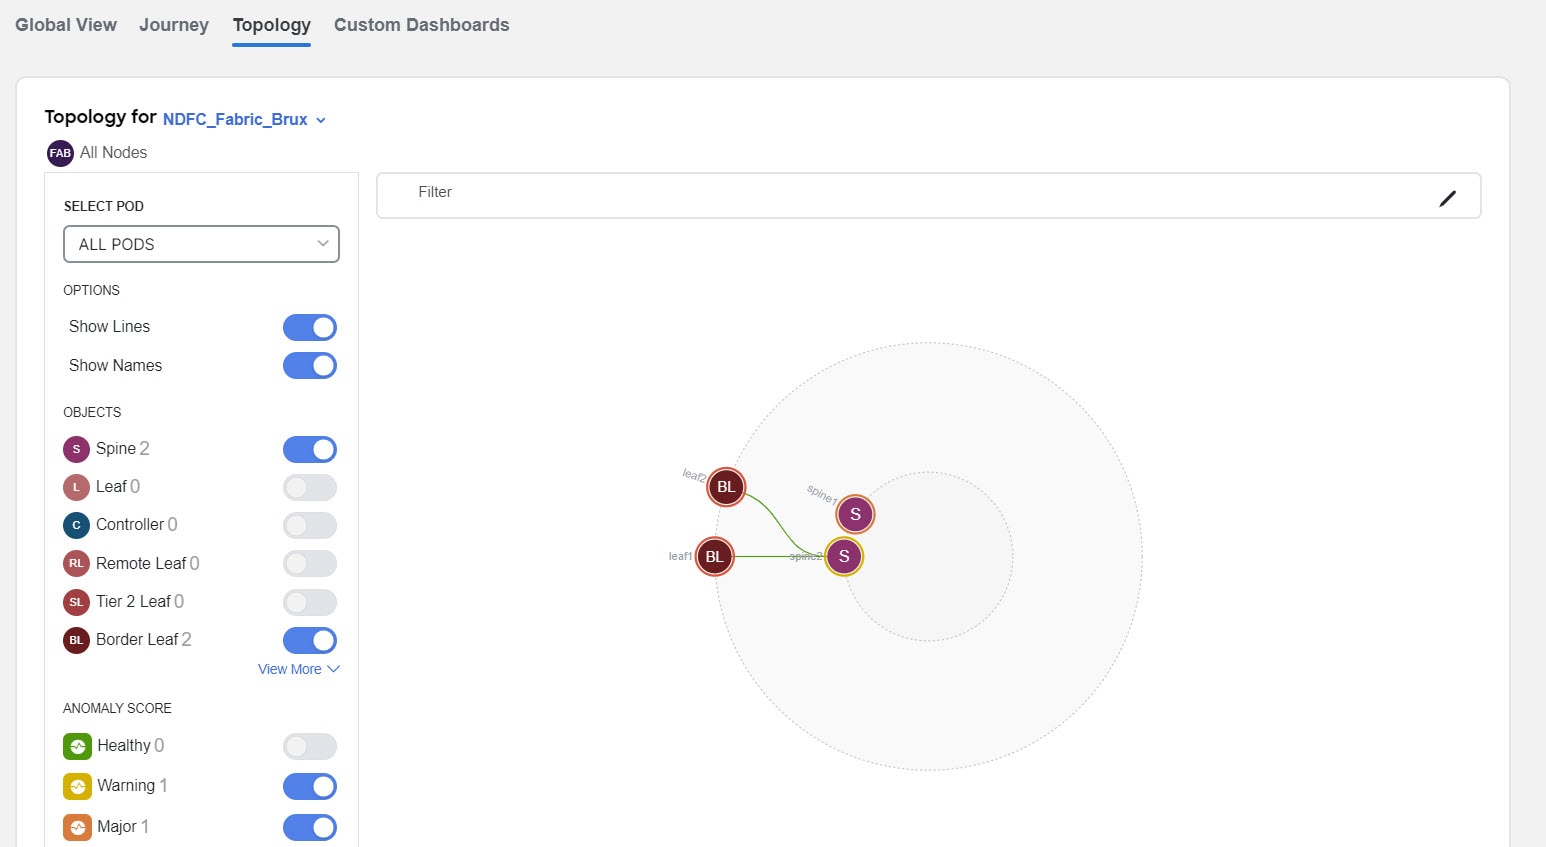
Access Topology by navigating to Overview > Topology.
Toggle Spine nodes, Leaf nodes, and Controllers to add or remove objects from the topology view. Toggle each anomaly score to add or remove from the topology view.
The various anomaly scores available are:
-
Warning
-
Major
-
Critical
Use the zoom in capability to narrow down on portions of the infrastructure based on logical constructs such as EPG, VRF, Tenant. View, sort, and filter anomalies through the topology work pane.
You can refine the displayed nodes by the following filters:
-
Name - Display only nodes with a specific name.
-
VRF - Display only nodes from a specific VRF.
Use the following operators to filter the refinement:
| Operator | Description |
|---|---|
|
== |
With the initial filter type, this operator, and a subsequent value, returns an exact match. |
|
!= |
With the initial filter type, this operator, and a subsequent value, returns all that do not have the same value. |
|
contains |
With the initial filter type, this operator, and a subsequent value, returns all that contain the value. |
|
!contains |
With the initial filter type, this operator, and a subsequent value, returns all that do not contain the value. |
The anomaly score is represented by the color of the node in the topology.
The different colors show the anomaly level for that object, where:
-
Orange indicates that this object is in an Anomaly Level Major state
-
Red indicates that this object is in an Anomaly Level Critical state
-
Gray indicates that the Anomaly Level for this object is unknown
Hover over the node to view an overview of the following details:
-
Type of node
-
Name of the node
-
Anomaly level
-
Number of nodes it is connected to
Click the node on the topology to view additional details for the node. To understand the details available, see Inventory. Click 'Actions' to view inventory details.
Topology Limitations
Nodes that do not have LLDP information are not shown in the topology.
Cisco Nexus Dashboard Insights Topology
Nexus Dashboard Insights on NDFC supports the following topologies:
VxLAN : Leaf-Spine topology for 3-HOP Flow Telemetry
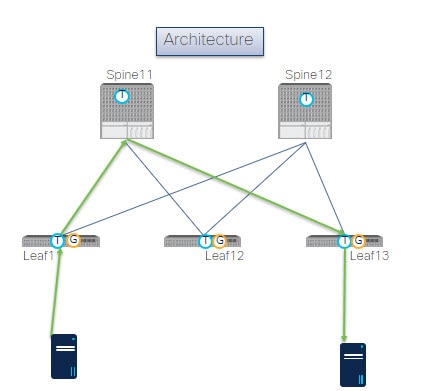
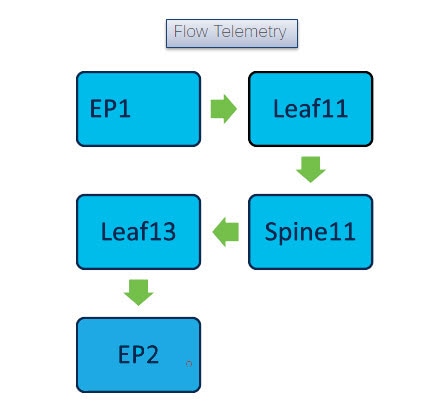
The Flow Telemetry line crossing every switch in the illustration represents the switches that are capable of exporting the Flow Telemetry data. For Example: With two flow telemetry HOP lines, the packet flows from Leaf 1.1 to Spine 1.1 and then to Leaf 1.3. This is considered as 3-Hop Flow Telemetry.
Supported Scenarios
The Nexus Dashboard Insights topology supports the following scenarios.
VXLAN
-
vPC on leaf switch
-
Border spine switch
-
Border leaf switch
-
IR or Multicast underlay
-
EBGP or IBGP
-
IPv4 underlay
-
IPv4/IPv6 overlay
Legacy/Classic LAN
-
vPC on leaf switch
-
IPv4 or IPv6
Supported Roles
The Nexus Dashboard Insights topology supports the following roles.
VxLAN
-
Leaf switch
-
Border switch
-
Border Spine switch
-
Border Gateway switch
-
Border Gateway Spine switch
-
Super Spine switch
-
Border Super Spine switch
-
Border Gateway Super Spine switch
-
Spine switch
Classic LAN
-
Access switch
-
Aggregation switch
-
Edge Router switch
-
Core Router switch
Copyright
THE SPECIFICATIONS AND INFORMATION REGARDING THE PRODUCTS IN THIS MANUAL ARE SUBJECT TO CHANGE WITHOUT NOTICE. ALL STATEMENTS, INFORMATION, AND RECOMMENDATIONS IN THIS MANUAL ARE BELIEVED TO BE ACCURATE BUT ARE PRESENTED WITHOUT WARRANTY OF ANY KIND, EXPRESS OR IMPLIED. USERS MUST TAKE FULL RESPONSIBILITY FOR THEIR APPLICATION OF ANY PRODUCTS.
THE SOFTWARE LICENSE AND LIMITED WARRANTY FOR THE ACCOMPANYING PRODUCT ARE SET FORTH IN THE INFORMATION PACKET THAT SHIPPED WITH THE PRODUCT AND ARE INCORPORATED HEREIN BY THIS REFERENCE. IF YOU ARE UNABLE TO LOCATE THE SOFTWARE LICENSE OR LIMITED WARRANTY, CONTACT YOUR CISCO REPRESENTATIVE FOR A COPY.
The Cisco implementation of TCP header compression is an adaptation of a program developed by the University of California, Berkeley (UCB) as part of UCB’s public domain version of the UNIX operating system. All rights reserved. Copyright © 1981, Regents of the University of California.
NOTWITHSTANDING ANY OTHER WARRANTY HEREIN, ALL DOCUMENT FILES AND SOFTWARE OF THESE SUPPLIERS ARE PROVIDED “AS IS" WITH ALL FAULTS. CISCO AND THE ABOVE-NAMED SUPPLIERS DISCLAIM ALL WARRANTIES, EXPRESSED OR IMPLIED, INCLUDING, WITHOUT LIMITATION, THOSE OF MERCHANTABILITY, FITNESS FOR A PARTICULAR PURPOSE AND NONINFRINGEMENT OR ARISING FROM A COURSE OF DEALING, USAGE, OR TRADE PRACTICE.
IN NO EVENT SHALL CISCO OR ITS SUPPLIERS BE LIABLE FOR ANY INDIRECT, SPECIAL, CONSEQUENTIAL, OR INCIDENTAL DAMAGES, INCLUDING, WITHOUT LIMITATION, LOST PROFITS OR LOSS OR DAMAGE TO DATA ARISING OUT OF THE USE OR INABILITY TO USE THIS MANUAL, EVEN IF CISCO OR ITS SUPPLIERS HAVE BEEN ADVISED OF THE POSSIBILITY OF SUCH DAMAGES.
Any Internet Protocol (IP) addresses and phone numbers used in this document are not intended to be actual addresses and phone numbers. Any examples, command display output, network topology diagrams, and other figures included in the document are shown for illustrative purposes only. Any use of actual IP addresses or phone numbers in illustrative content is unintentional and coincidental.
The documentation set for this product strives to use bias-free language. For the purposes of this documentation set, bias-free is defined as language that does not imply discrimination based on age, disability, gender, racial identity, ethnic identity, sexual orientation, socioeconomic status, and intersectionality. Exceptions may be present in the documentation due to language that is hardcoded in the user interfaces of the product software, language used based on RFP documentation, or language that is used by a referenced third-party product.
Cisco and the Cisco logo are trademarks or registered trademarks of Cisco and/or its affiliates in the U.S. and other countries. To view a list of Cisco trademarks, go to this URL: http://www.cisco.com/go/trademarks. Third-party trademarks mentioned are the property of their respective owners. The use of the word partner does not imply a partnership relationship between Cisco and any other company. (1110R)
© 2017-2024 Cisco Systems, Inc. All rights reserved.