New and Changed Information
The following table provides an overview of the significant changes up to this current release. The table does not provide an exhaustive list of all changes or of the new features up to this release.
|
Release Version |
Feature |
Description |
|---|---|---|
|
NDFC release 12.0.1 |
Initial release of this use case document. |
Initial release of this use case document. |
Understanding Programmable Reports
The Programmable Reports application allows you to generate reports using Python 2.7 scripts. Report jobs are run to generate reports. Each report job can generate multiple reports. You can schedule a report to run for a specific device or fabric. These reports are analyzed to obtain detailed information about the devices.
The report template type is used to support the Programmable Reports feature. This template has two template subtypes: UPGRADE and GENERIC. For more information on the report template, see the Report Template chapter in the Cisco NDFC-Fabric Controller Configuration Guide. A python SDK is provided to simplify report generation. This SDK is bundled with Nexus Dashboard Fabric Controller.
RBAC Support
-
An admin or a network operator can create a report.
-
A network operator can view reports created by other admins and operators.
-
A network operator cannot delete/edit/rerun any reports created by an admin and other network operators.
-
An admin can view and delete any report irrespective of the user creating them.
-
Due to fabric and device association, an admin cannot edit any report created by another user, including the network operator.
 Note |
A Jython template supports a maximum file size of 100k bytes. In case any report template exceeds this size, Jython execution may fail. |
For more information on programmable reports, see the Programmable Reports chapter in the Cisco NDFC-Fabric Controller Configuration Guide.
Understanding Programmable Reports for Performance Monitoring
Prior to Nexus Dashboard Fabric Controller release 12.0(1), the Data Center Network Manager 11.x release provided support for several programmable reports, such as switch inventory, ISSU pre-upgrade and post-upgrade checks, fabric resources, and so on.
Beginning in NDFC release 12.0(1), a new programmable report for switch performance monitoring is now available. This type of report is applicable for LAN and SAN fabrics to monitor CPU, memory, traffic, and interface utilization. Programmable reports for switch performance monitoring can be enabled for a specific switch (at the device level), or at the per-fabric level with support for the following fabrics:
-
Easy_Fabric -
Easy_Fabric_eBGP -
External -
LAN Classic
You can also use email as an out-of-band notification method to receive the reports externally using the periodic report generation. This allows you to receive periodic information about your data center fabric health, utilization, and performance state, and the statistics.
You can view information on the configured programmable reports for switch performance monitoring in the following areas:
-
Navigate to , then locate the Reports area to display the latest reports across all report definitions, at both the fabric level and the device level.
-
Navigate to , double-click on a fabric where you configured a programmable report, then locate the Reports area to display the latest report for that fabric across all report definitions. If the fabric is part of several definitions, then the Reports area will show the latest reports for this fabric across all definitions.
-
Navigate to , double-click on a switch where you configured a programmable report, then locate the Reports area to display the latest report for that switch across all report definitions. If the switch is part of several definitions, then the Reports area will show the latest reports for this switch across all definitions.
Prerequisites
Complete the following prerequisites before enabling performance monitoring using programmable reports:
-
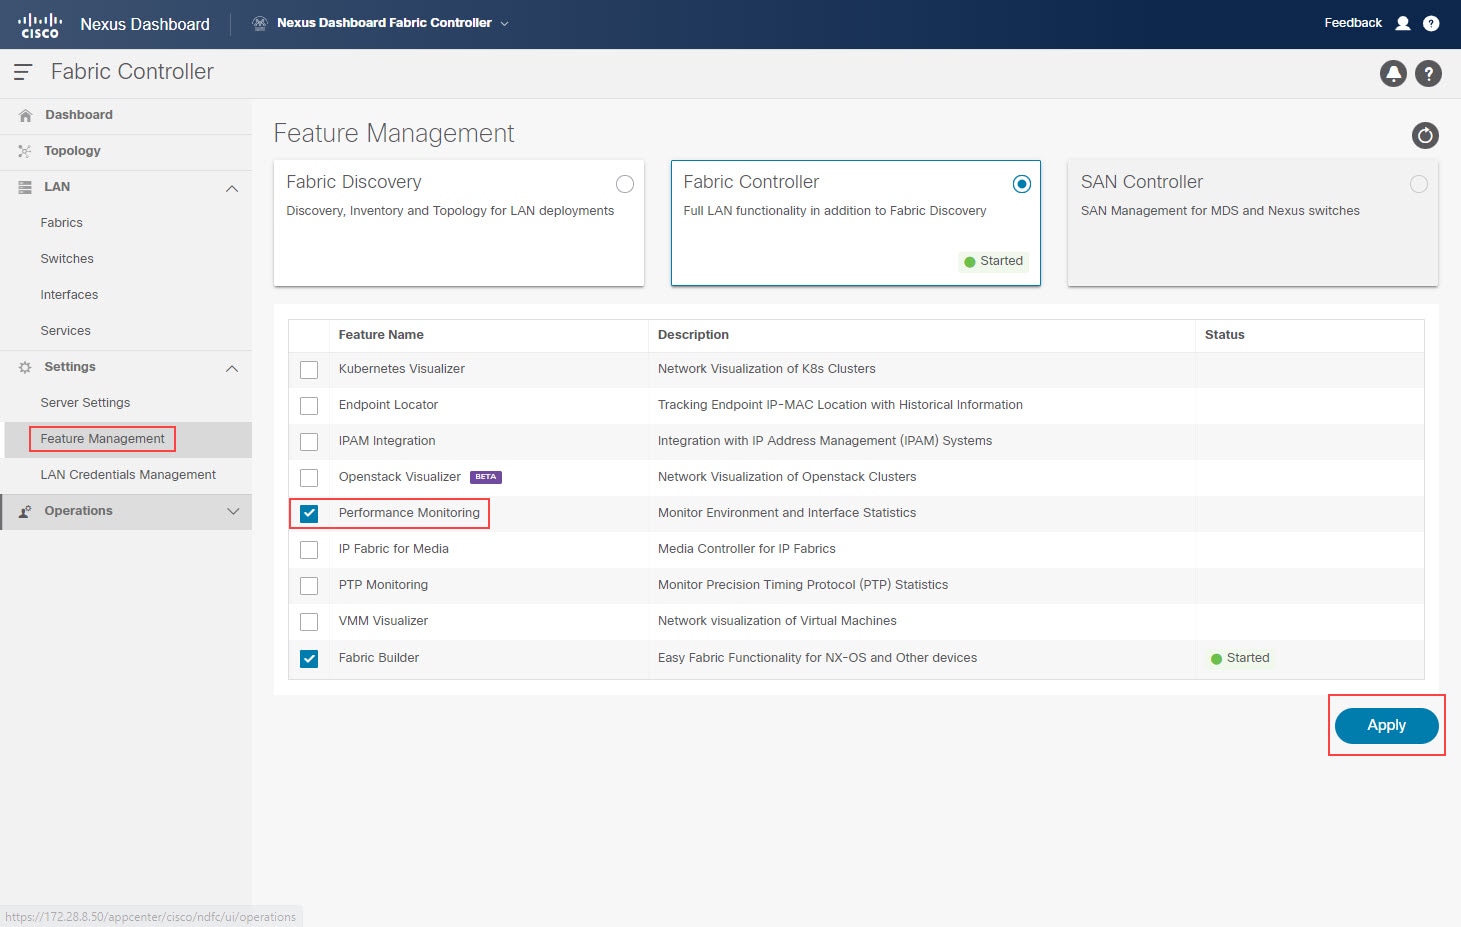
Enable the Performance Monitoring feature under the Fabric Controller feature persona:
-
In NDFC, navigate to .
The Feature Management page is displayed.
-
Click the Fabric Controller box, then click the box next to Performance Monitoring.
-
Click Apply.
-
-
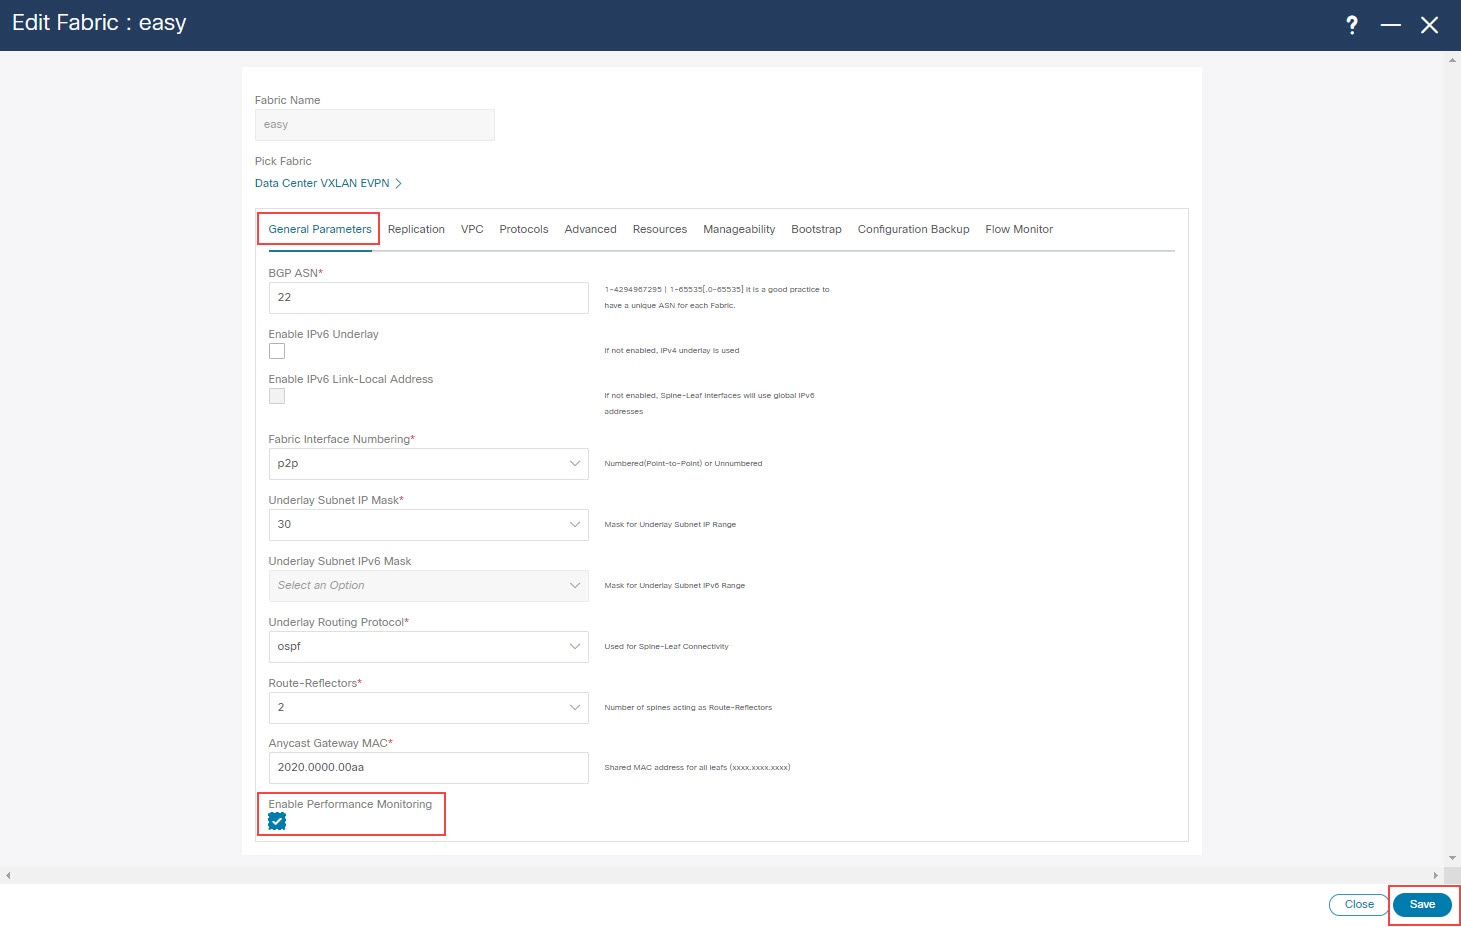
Enable the Performance Monitoring option at the fabric level:
-
In NDFC, navigate to .
The LAN Fabrics page is displayed, with all of your configured fabrics listed.
-
Double-click the fabric that you want to monitor.
The Fabric Overview page for this fabric is displayed.
-
Click .
The Edit Fabric page for this fabric is displayed.
-
In the General Parameters tab, click the box under the Enable Performance Monitoring (For NX-OS Switches Only) option to enable this feature.
-
Click Save.
-
-
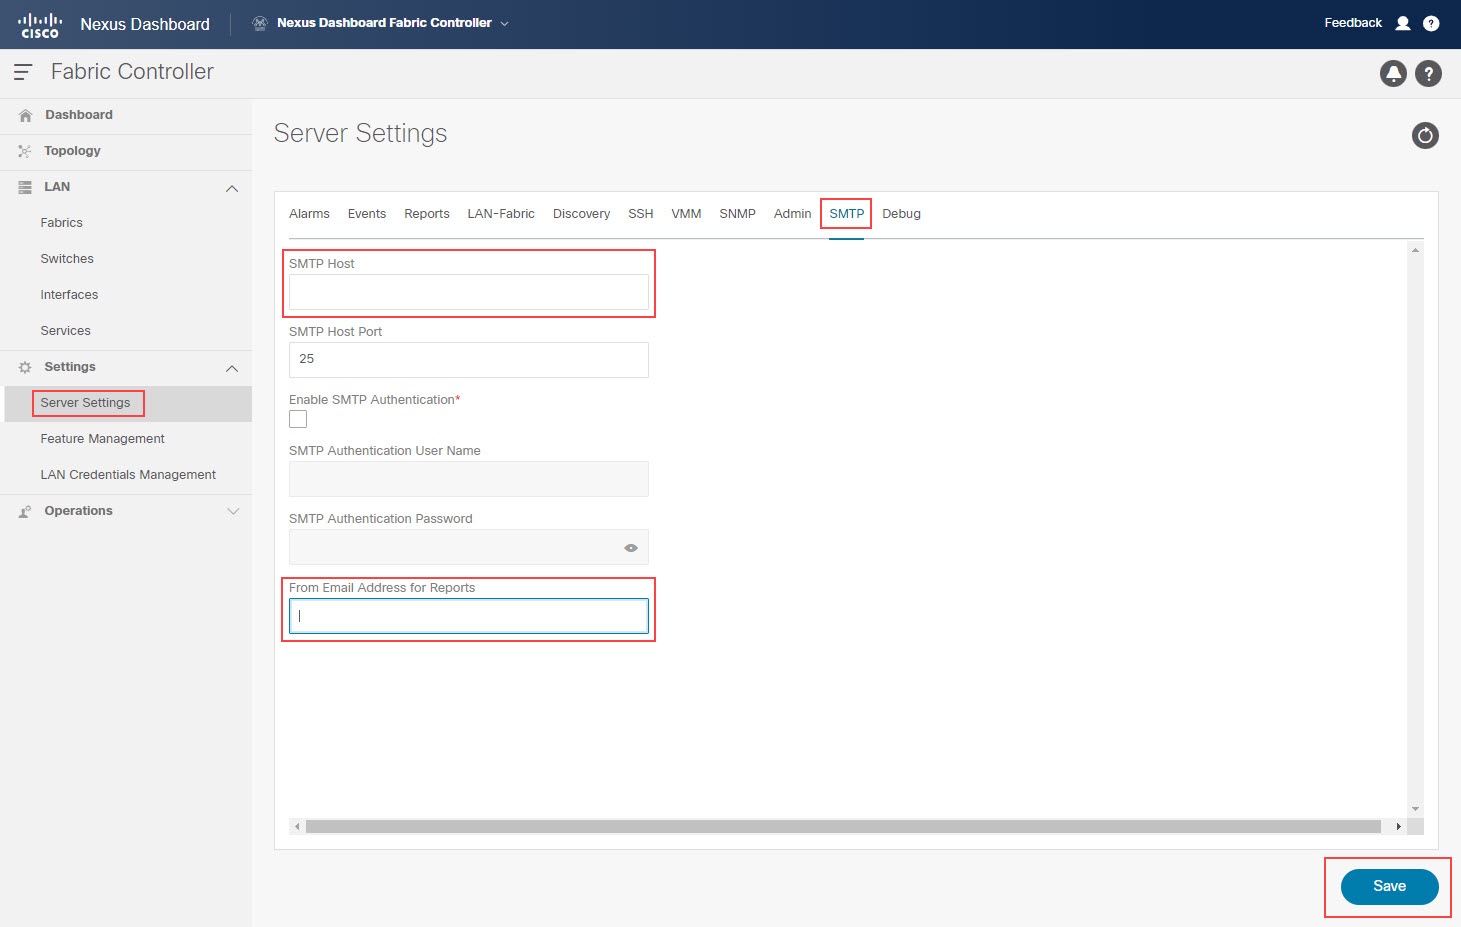
If you want to enable email notifications, update the SMTP host information in the NDFC server settings:
-
In NDFC, navigate to .
The Server Settings page is displayed.
-
Click the SMTP tab.
-
In the SMTP Host field, enter the SMTP IP address.
The SMTP host must have IP connectivity with the Nexus Dashboard.
-
In the From Email Address for Reports field, enter the source email address for the generated reports.
-
Click Save.
-
See the Cisco NDFC-Fabric Controller Configuration Guide for more information on any of these tasks.
Guidelines and Limitations
Following are the guidelines and limitations for performance monitoring using programmable reports in Nexus Dashboard Fabric Controller:
-
Only NX-OS switches are supported for switch performance monitoring using programmable reports in Nexus Dashboard Fabric Controller.
Configure Programmable Reports
Before you begin
Complete all the tasks described in Prerequisites before proceeding with these procedures.
Procedure
|
Step 1 |
Navigate to . The Reports page is displayed, with any configured report definitions displayed. 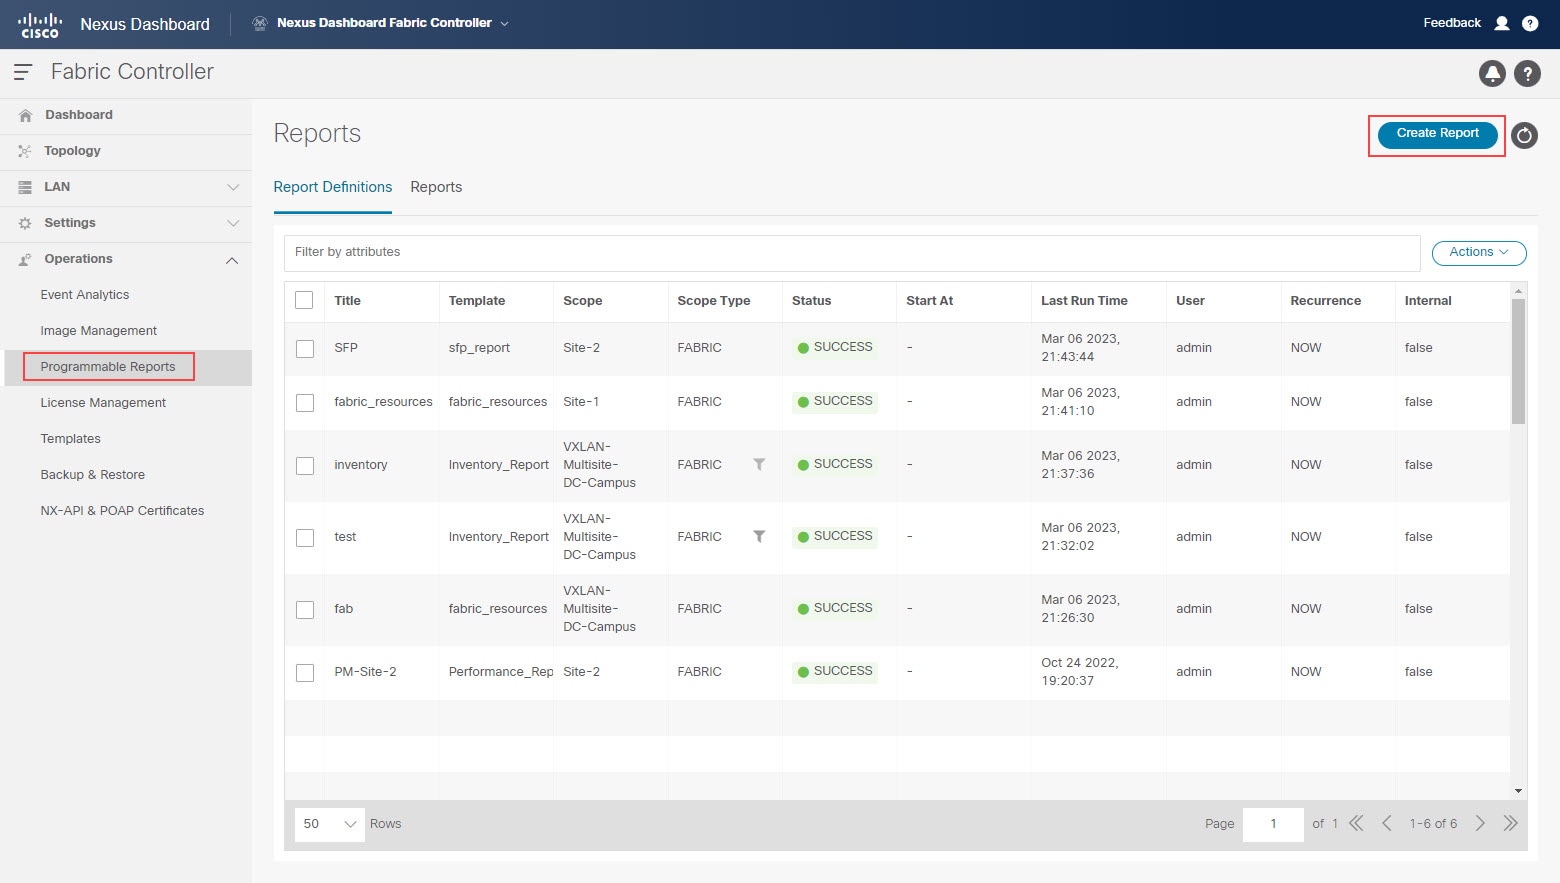
|
||||||||||||||||||||||||||||||||||||||||
|
Step 2 |
Click Create Report. |
||||||||||||||||||||||||||||||||||||||||
|
Step 3 |
In the Report Name field, enter a name for the report. |
||||||||||||||||||||||||||||||||||||||||
|
Step 4 |
Click the arrow next the Select a Template field, then select the report template that you want to use. You have the following report templates to choose from:
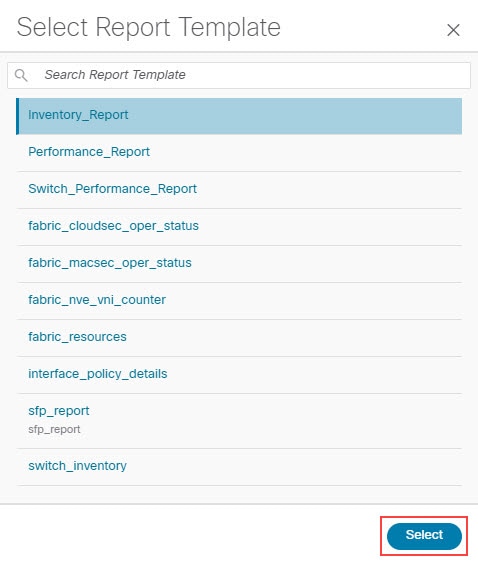
|
||||||||||||||||||||||||||||||||||||||||
|
Step 5 |
Click Select to select the template. You are returned to the Create Report page. |
||||||||||||||||||||||||||||||||||||||||
|
Step 6 |
(Optional) Edit the parameters in the report template page to customize the report. The parameters that are available vary, depending on the type of report template you selected in the previous step. The following table provides additional information on the parameters that are available for each report template.
|
||||||||||||||||||||||||||||||||||||||||
|
Step 7 |
Click Next to move to the Source & Recurrence step. |
||||||||||||||||||||||||||||||||||||||||
|
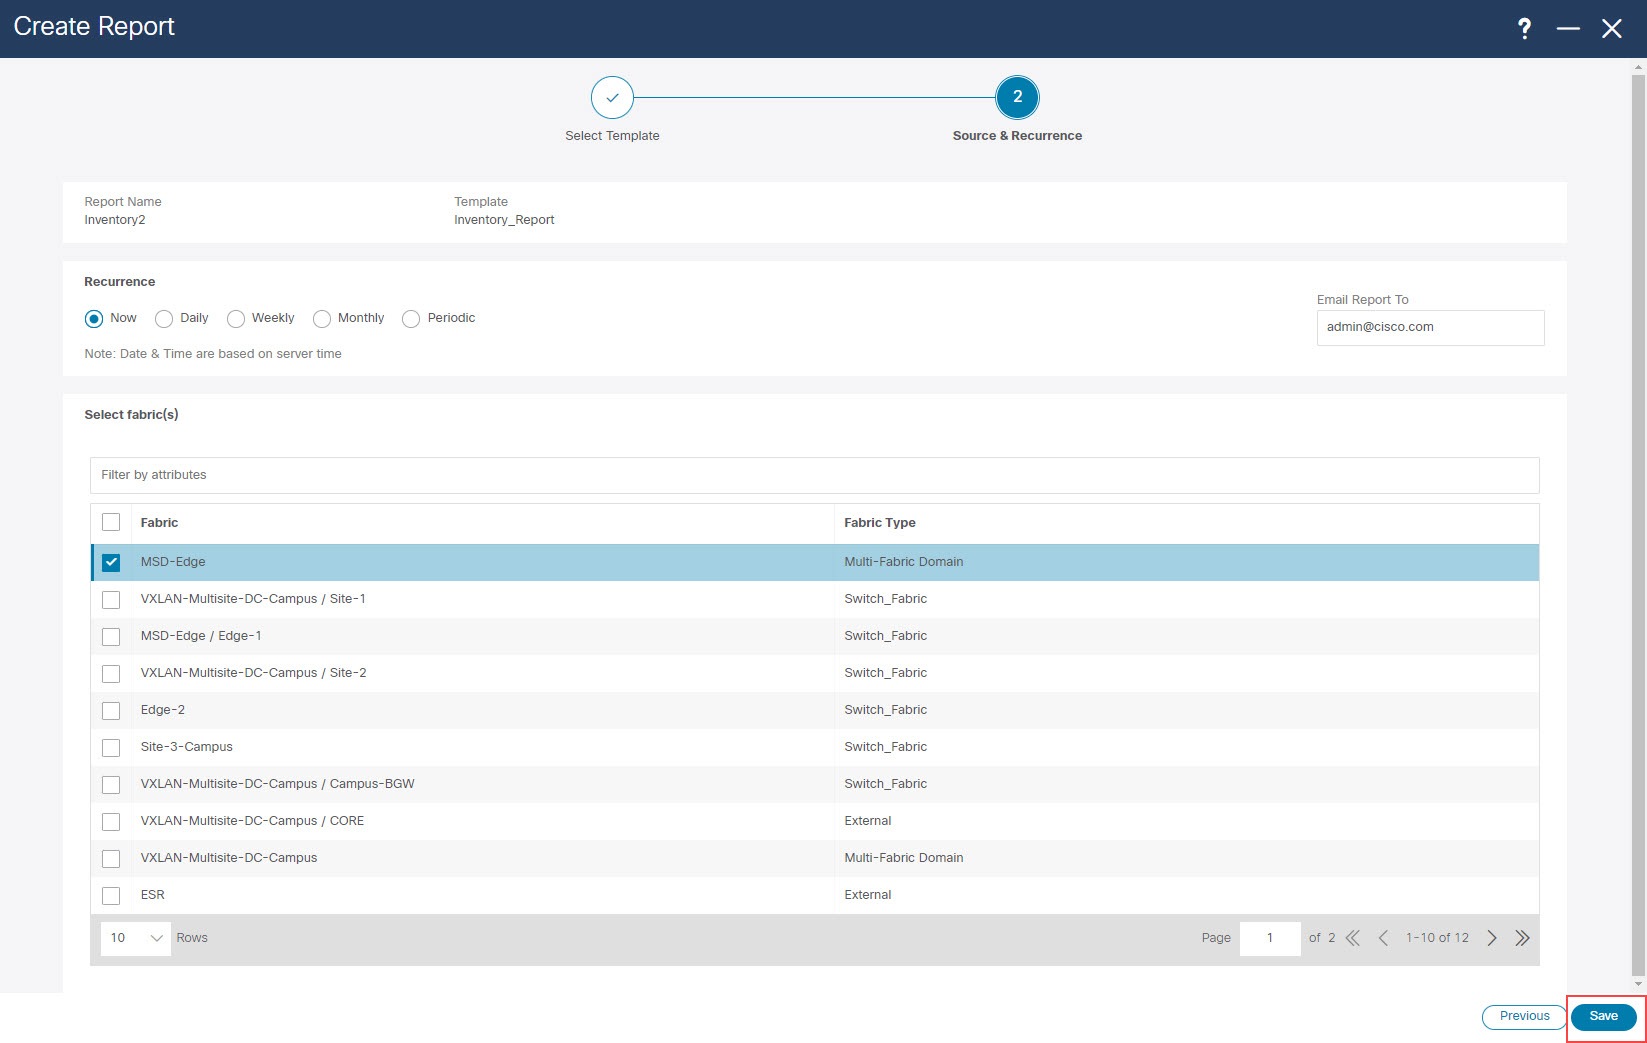
Step 8 |
In the Recurrence field, choose the frequency at which the report job should be run. The following table shows the options available and their description.
|
||||||||||||||||||||||||||||||||||||||||
|
Step 9 |
If you have email notifications enabled, in the Email Report To field, enter an email ID or mailer ID if you want the report in an email. Note that the title of the report that you receive in your email will include the time in a different format than the format that is shown under the Reports tab. As described in Prerequisites, you must configure the SMTP settings in . If the data service IP address is in a private subnet, the static management route for the SMTP server must be added in the Cisco Nexus Dashboard cluster configuration. |
||||||||||||||||||||||||||||||||||||||||
|
Step 10 |
Select the fabrics or devices where you want to generate the performance monitoring report.
|
||||||||||||||||||||||||||||||||||||||||
|
Step 11 |
Click Save. You are returned to the main Reports page. A new report and report definitions are created and appear on the Report Definitions and Reports tabs, and the report that you just created begins to run in the background. |
||||||||||||||||||||||||||||||||||||||||
|
Step 12 |
Review the information provided in the Report Definitions tab. The status for the new report shows as You can also view other information on the new report in the Report Definitions tab, such as the report template used for each report, the user who generated the report, and the recurrence setting for each report. |
||||||||||||||||||||||||||||||||||||||||
|
Step 13 |
Click the Reports tab. Information is provided for each programmable report that you configured, including the type of template used for each report, who created the report, and what the recurrence is for each report.
|
||||||||||||||||||||||||||||||||||||||||
|
Step 14 |
In the Reports tab, double-click on the report that you just created. The overview information for the report is displayed, with additional information provided under these two tabs:
|
||||||||||||||||||||||||||||||||||||||||
|
Step 15 |
If you enabled email notifications in Step 9, open the email that contains detailed information from the programmable report. For example, if you enabled email notifications for a
For this type of programmable report, in each area, you can click on multiple components within that area to get comparison information for those components, such as clicking on two links to compare information between those two links. |
||||||||||||||||||||||||||||||||||||||||
Example Use Case: Configure Programmable Report for Switch Performance Monitoring
This section provides an example use case based on the procedures provided in Configure Programmable Reports. In this example use case, you will be configuring a programmable report specifically for switch performance monitoring.
Before you begin
Complete all the tasks described in Prerequisites before proceeding with these procedures.
Procedure
|
Step 1 |
Navigate to . The Reports page is displayed, with any configured report definitions displayed.
|
||||||||||||
|
Step 2 |
Click Create Report. |
||||||||||||
|
Step 3 |
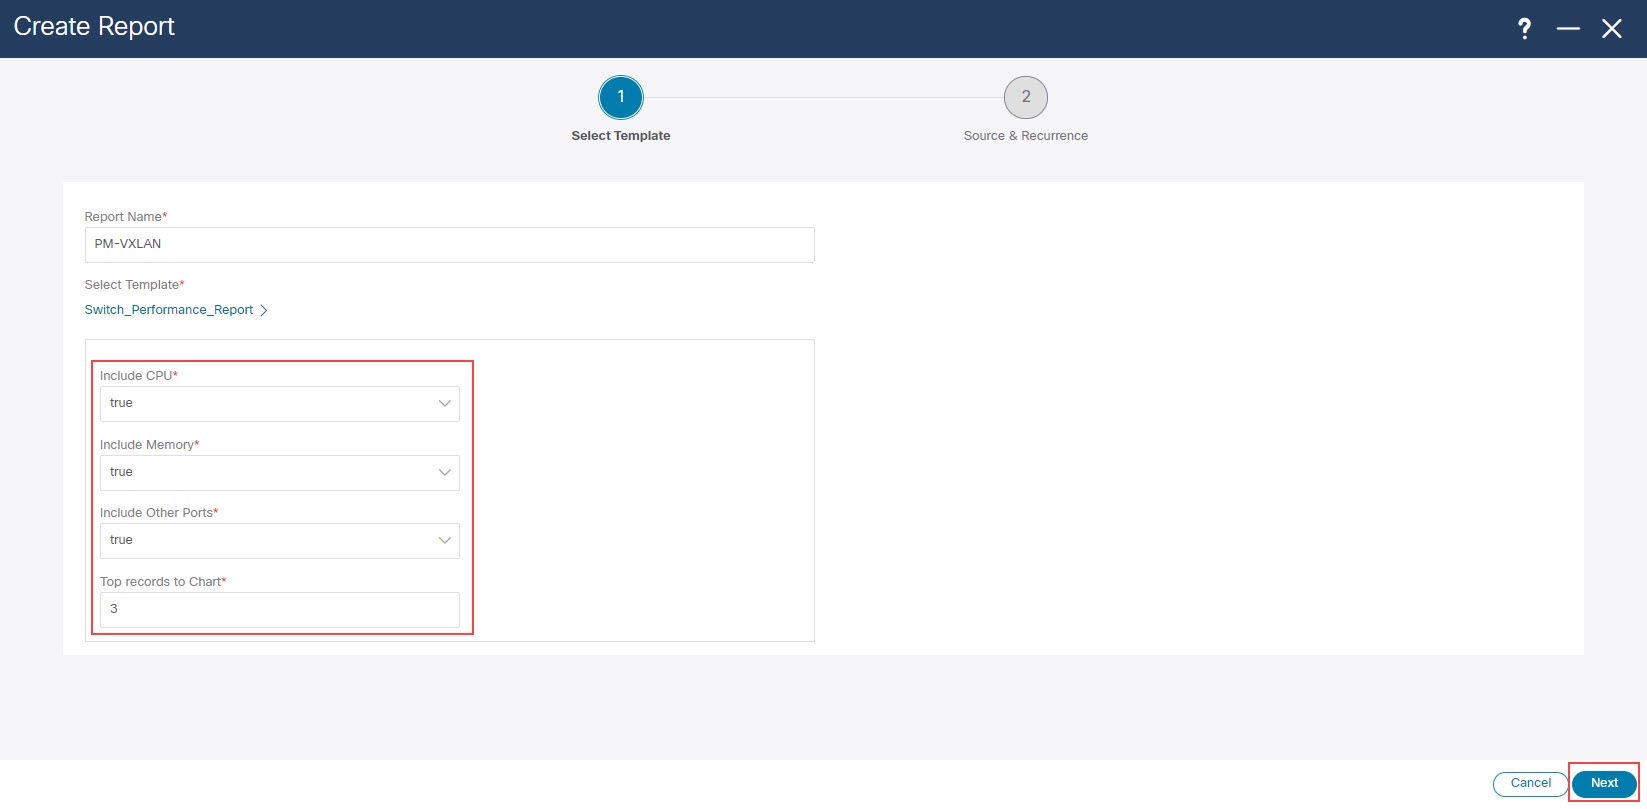
In the Report Name field, enter a name for the programmable report. For this example use case, we will use the name |
||||||||||||
|
Step 4 |
Click the arrow next the Select a Template field, then select You would choose this report template to monitor CPU, memory, traffic, or interface utilization for a specific switch in a fabric. 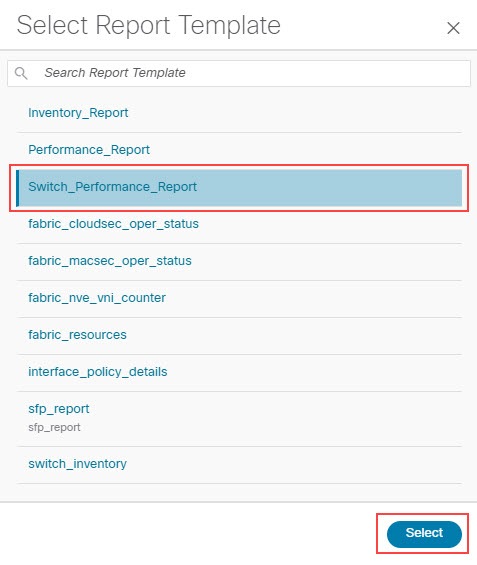
|
||||||||||||
|
Step 5 |
Click Select to select the template. You are returned to the Create Report page. |
||||||||||||
|
Step 6 |
(Optional) Edit the parameters in the report template page to customize the report.
|
||||||||||||
|
Step 7 |
Click Next to move to the Source & Recurrence step. |
||||||||||||
|
Step 8 |
In the Recurrence field, choose the frequency at which the report job should be run. The following table shows the options available and their description.
|
||||||||||||
|
Step 9 |
If you have email notifications enabled, in the Email Report To field, enter an email ID or mailer ID if you want the report in an email. As described in Prerequisites, you must configure the SMTP settings in . If the data service IP address is in a private subnet, the static management route for the SMTP server must be added in the Cisco Nexus Dashboard cluster configuration. |
||||||||||||
|
Step 10 |
Select the devices where you want to generate the performance monitoring report. As described in Configure Programmable Reports, certain reports, such as the 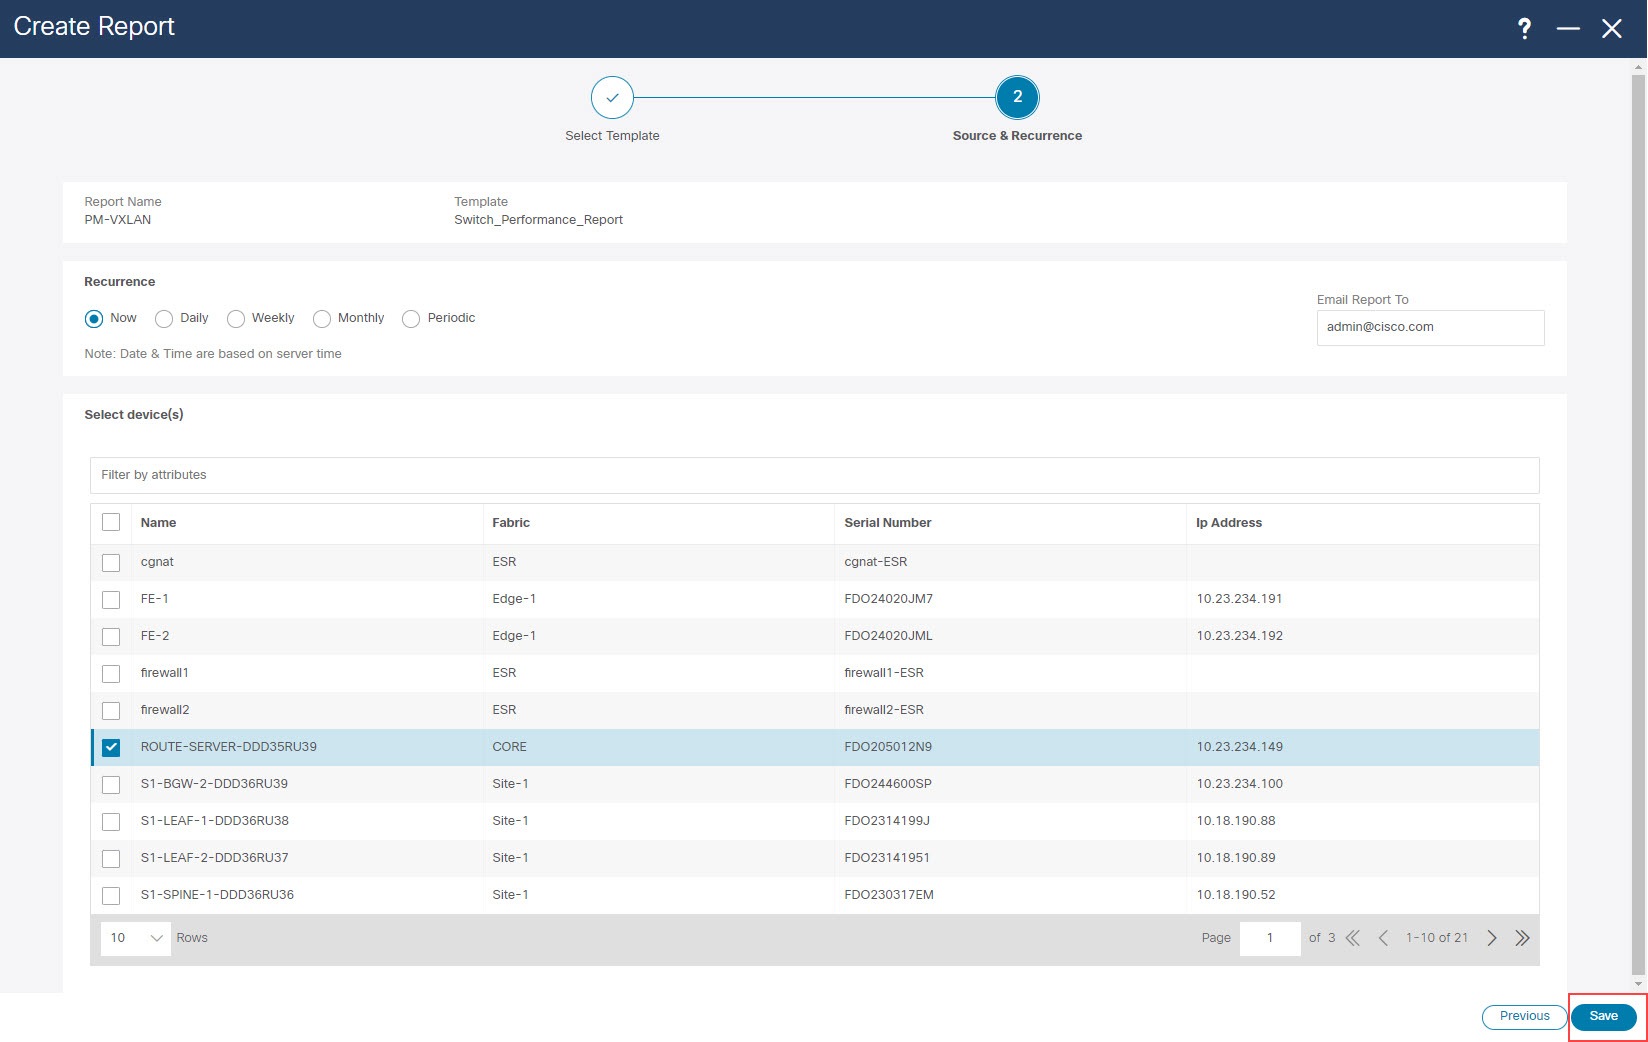
You can also use the filter field to show only devices within a specific fabric to select all the devices in a specific fabric, as shown in the following figure. 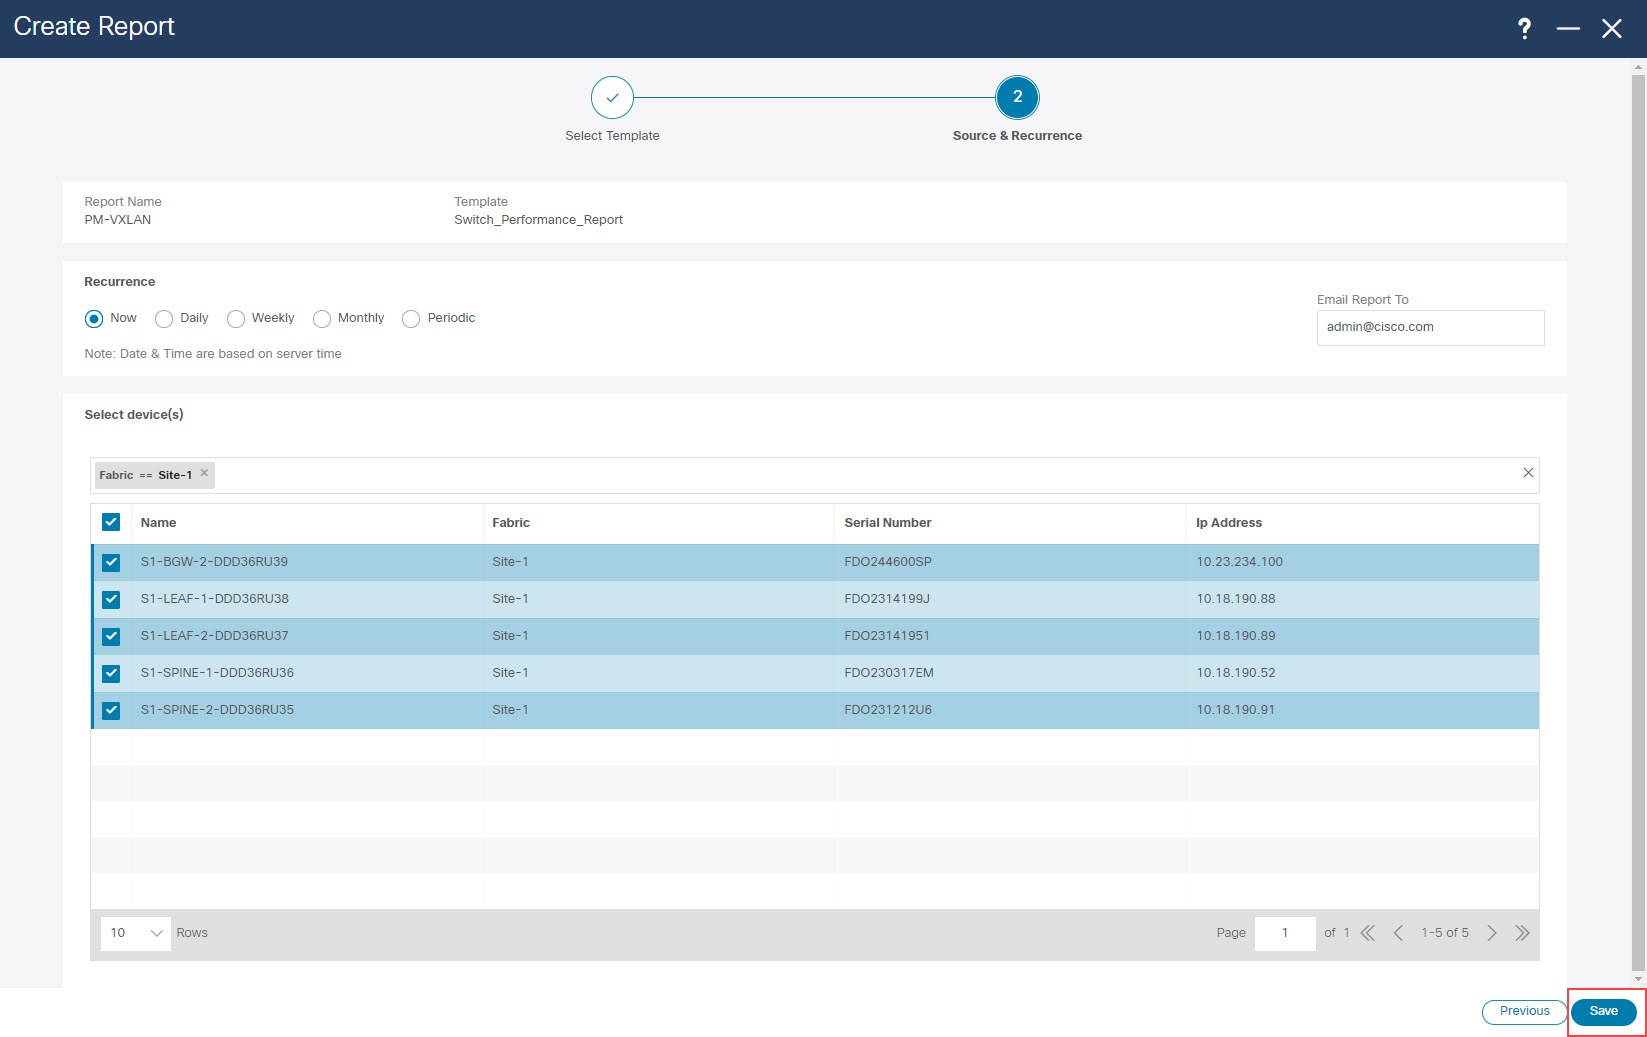
|
||||||||||||
|
Step 11 |
Click Save. You are returned to the main Reports page. A new report and report definitions are created and appear on the Report Definitions and Reports tabs, and the report that you just created begins to run in the background. |
||||||||||||
|
Step 12 |
Review the information provided in the Report Definitions tab. The status for the new report shows as 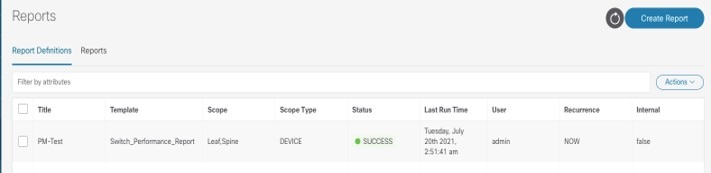
You can also view other information on the new report in the Report Definitions tab, such as the report template used for each report, the user who generated the report, and the recurrence setting for each report. |
||||||||||||
|
Step 13 |
Click the Reports tab, then double-click on the report that you just created. The overview information for the report is displayed, with additional information provided under these two tabs:
|
||||||||||||
|
Step 14 |
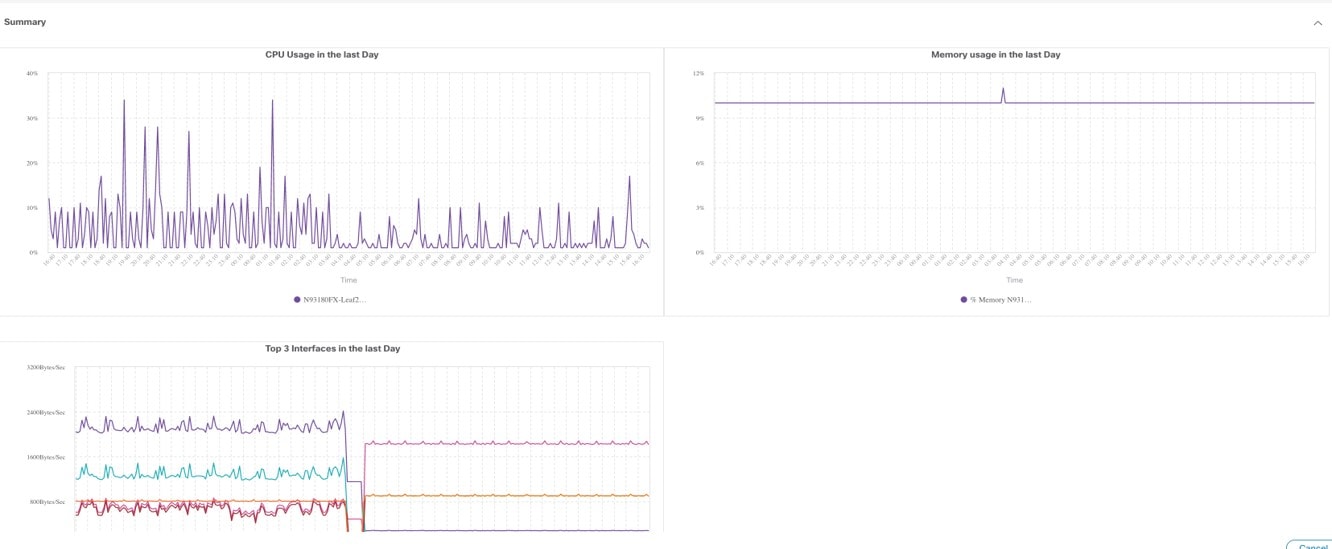
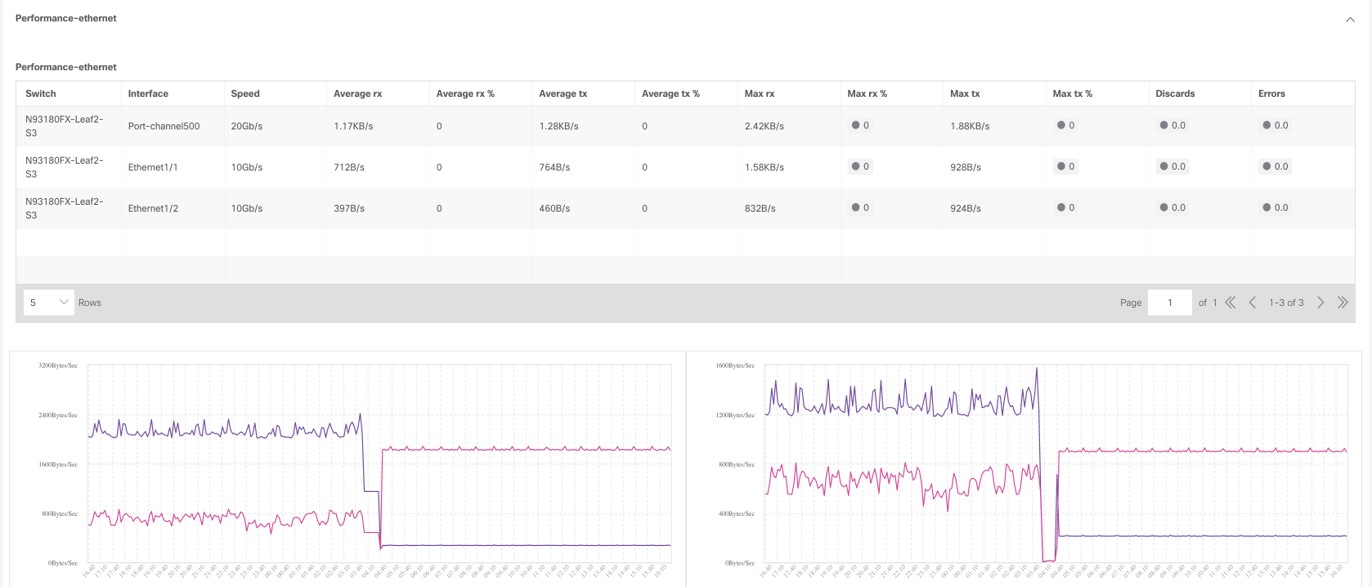
Click the Details tab, if it's not selected by default already, and expand on any area to get more information on this report. For example:
|
||||||||||||
|
Step 15 |
If you enabled email notifications in Step 9, open the email that contains the programmable report for switch performance monitoring. The emailed report will show performance information for a particular fabric and the switches within that fabric, such as:
In each area, click on multiple components within that area to get comparison information for those components. For example, click on two links to compare information between those two links. |
 Feedback