
New and Changed Information
The following table provides an overview of the significant changes up to this current release. The table does not provide an exhaustive list of all changes or of the new features up to this release.
| Release Version | Feature | Description |
|---|---|---|
|
There were no major changes from the previous release. |
||
Alarms
NDFC polls switches every 5 minutes by default and uses CLI commands to poll the switches.
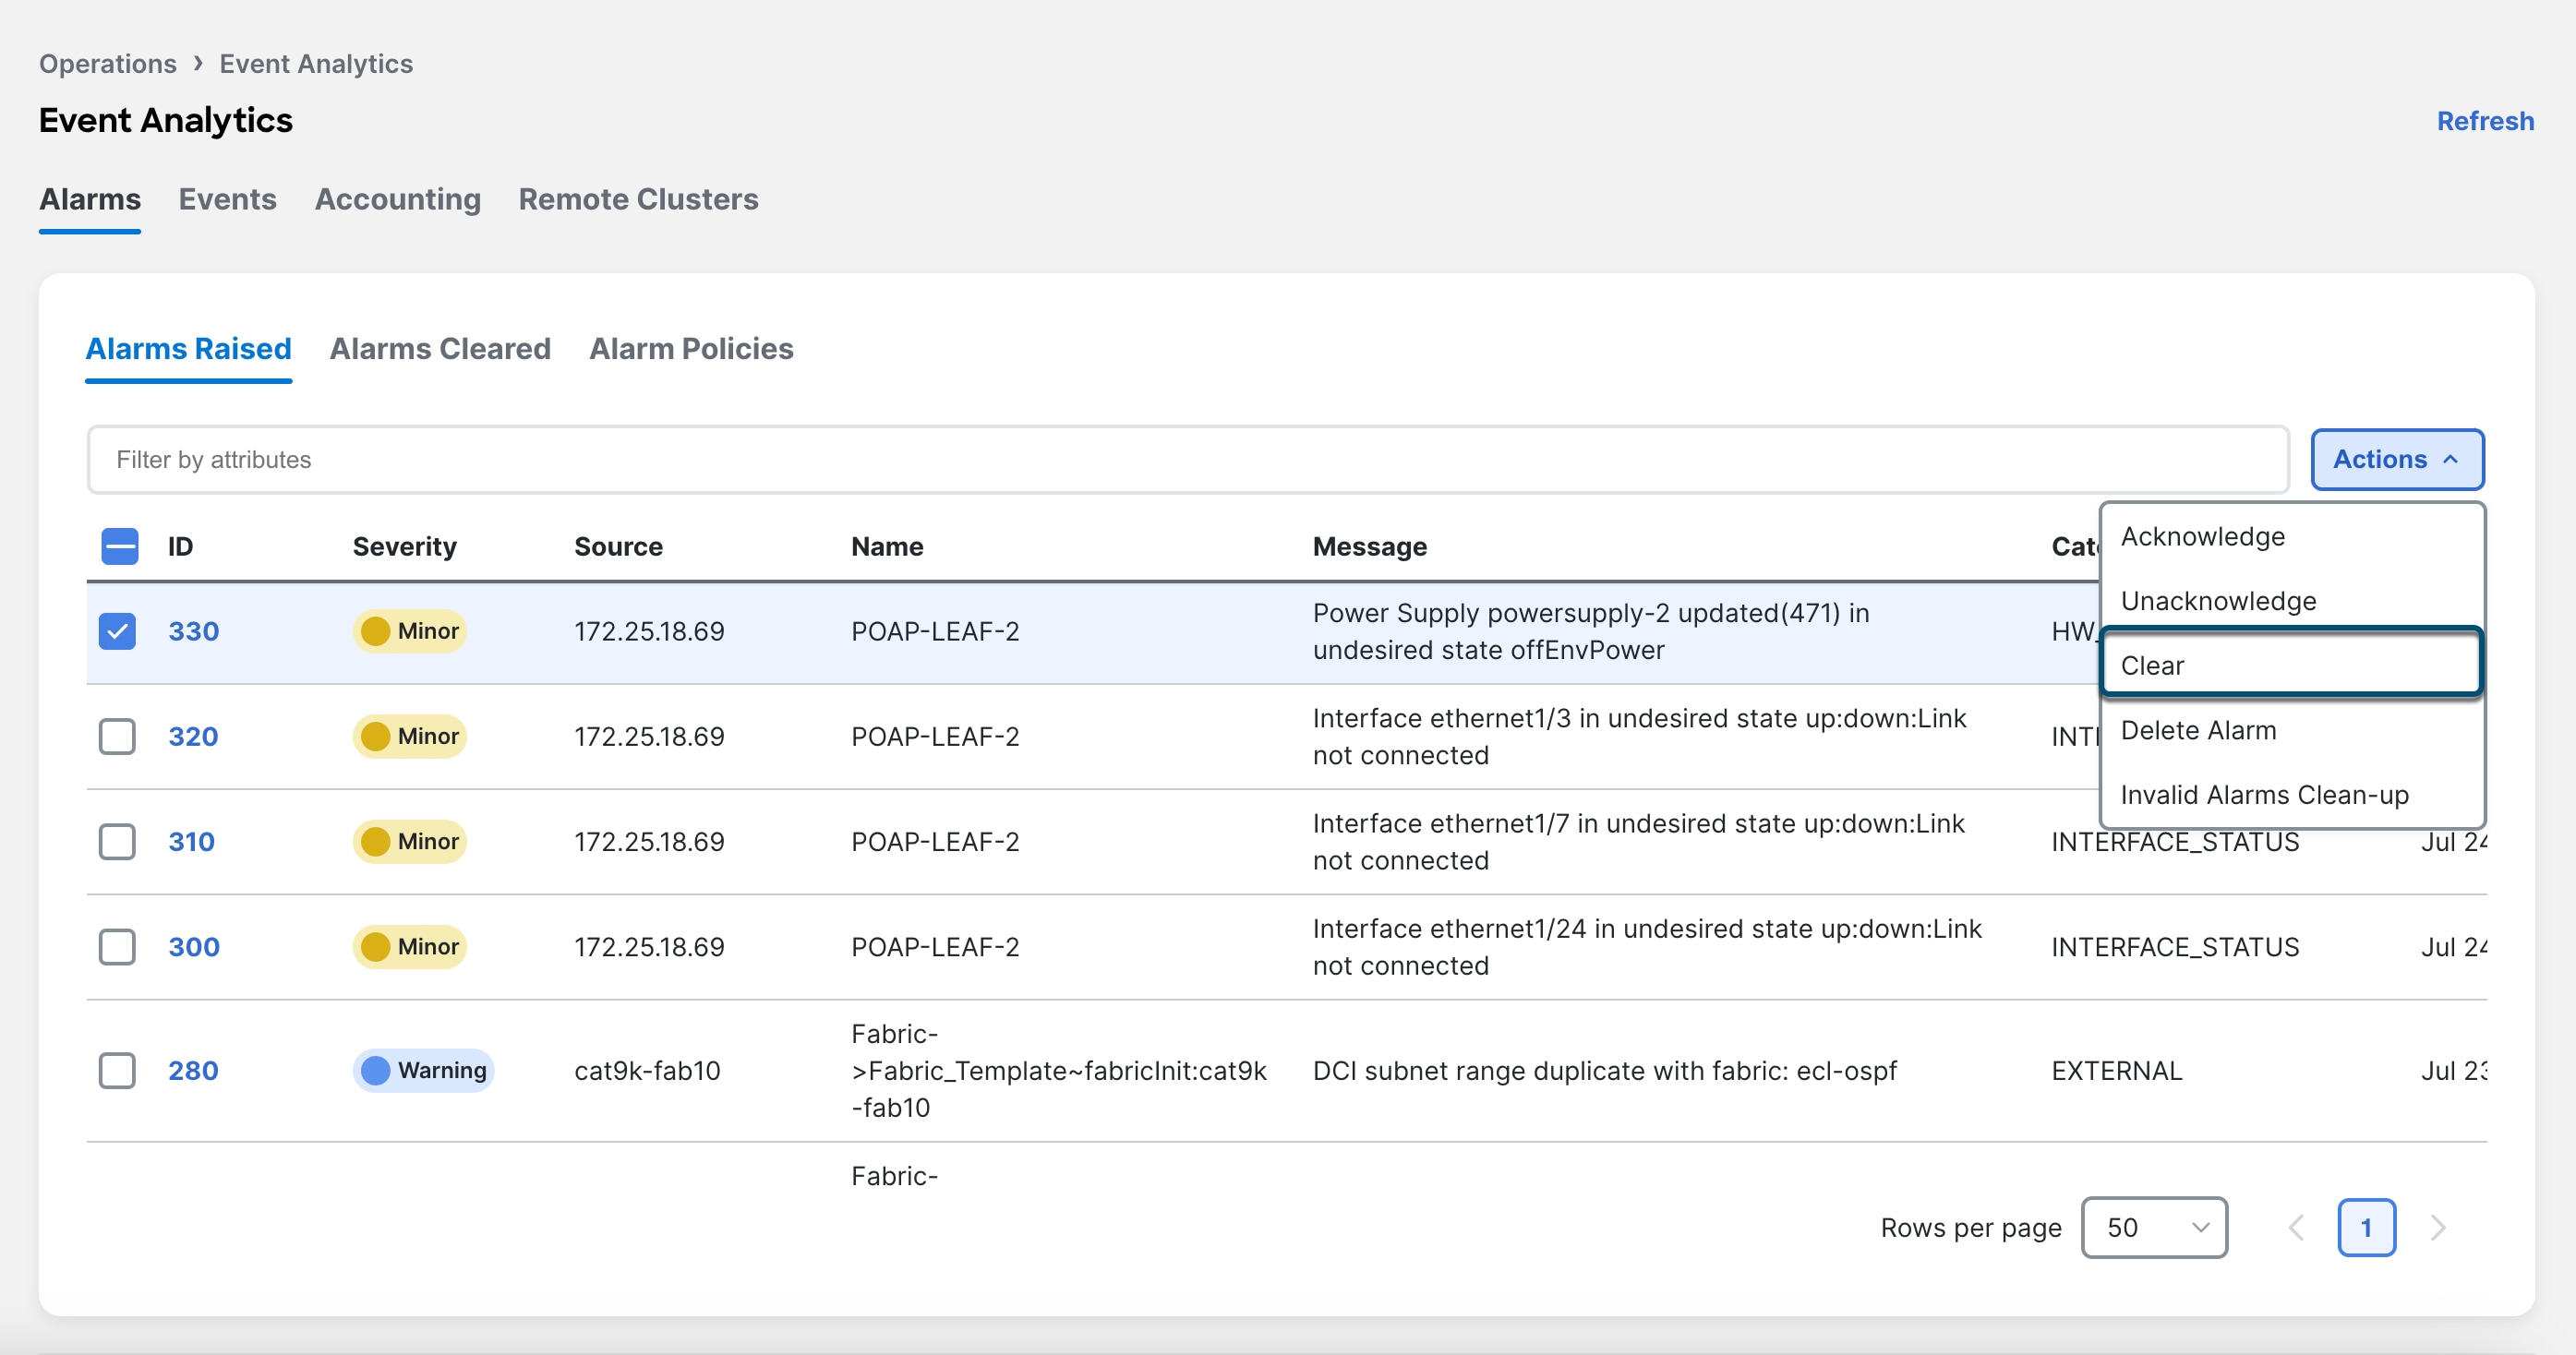
To navigate to the Alarms page in Cisco Nexus Dashboard Fabric Controller, choose Analyze > Event Analytics. The Alarms tab on the Event Analytics page contains tabs for Alarms Raised, Alarms Cleared and Alarm Policies displaying the alarms generated in the system, the list of alarms cleared and the different alarm policies that are configured for monitoring the devices.
The following sections describe each of these tabs and how to manage the alarms and alarm policies.
Alarms Raised
The Alarms Raised tab displays the alarms that are generated for various categories. This tab displays information such as alarm ID, Severity, failure Source, Name, Message, Category, Creation Time, Updated Time, Policy, and the user who acknowledged the alarm. Using the Actions menu, you can acknowledge, unacknowledge, delete or clear one or more of the alarms. It also allows you to cleanup alarms that are invalid.
To get more details for a specific alarm and the policy which triggered this alarm, click on the link in the ID field for the respective alarm. The details about the selected alarm appear on the slide-out pane.
The following table describes the fields that appear on Analyze > Event Analytics > Alarms > Alarms Raised page.
| Field | Description |
|---|---|
|
ID |
Specifies the ID of an alarm. |
|
Severity |
Specifies the severity of the alarm. |
|
Source |
Specifies the name of the source. |
|
Name |
Specifies the name of the alarm. |
|
Message |
Displays the message. |
|
Category |
Specifies the category of the alarm. |
|
Creation Time |
Specifies the time at which the alarm was created. |
|
Updated Time |
Specifies the date and time at which the alarm was updated. |
|
Policy |
Specifies the policy of the alarm. |
|
Ack User |
Displays the user who acknowledged the alarm. |
The following table describes the action items, in the Actions menu drop-down list on the Alarms Raised tab.
| Action Item | Description |
|---|---|
|
Acknowledge |
Choose one or multiple alarms and choose Acknowledge. Allows you to bookmark the alarms and adds ack user name to Acknowledged column. |
|
Unacknowledge |
Choose one or multiple alarms and choose Unacknowledge to remove the bookmarked alarms.NOTE: Only acknowledged alarms can be unacknowledged. |
|
Clear |
Clear the alarm policy manually. The cleared alarms will be moved to Alarm Cleared tab. |
|
Delete Alarm |
Choose an alarm and choose Delete to delete the alarm. |
|
Invalid Alarms Clean-up |
Removes all the discovery related invalid alarms in the system. The cleared alarms will be moved to the Alarms Cleared tab. |

For link-down events related to interface alarms, you must configure the switches to send SNMP traps to NDFC. Otherwise, the port state change can only be done through polling, which is every 5 minutes.
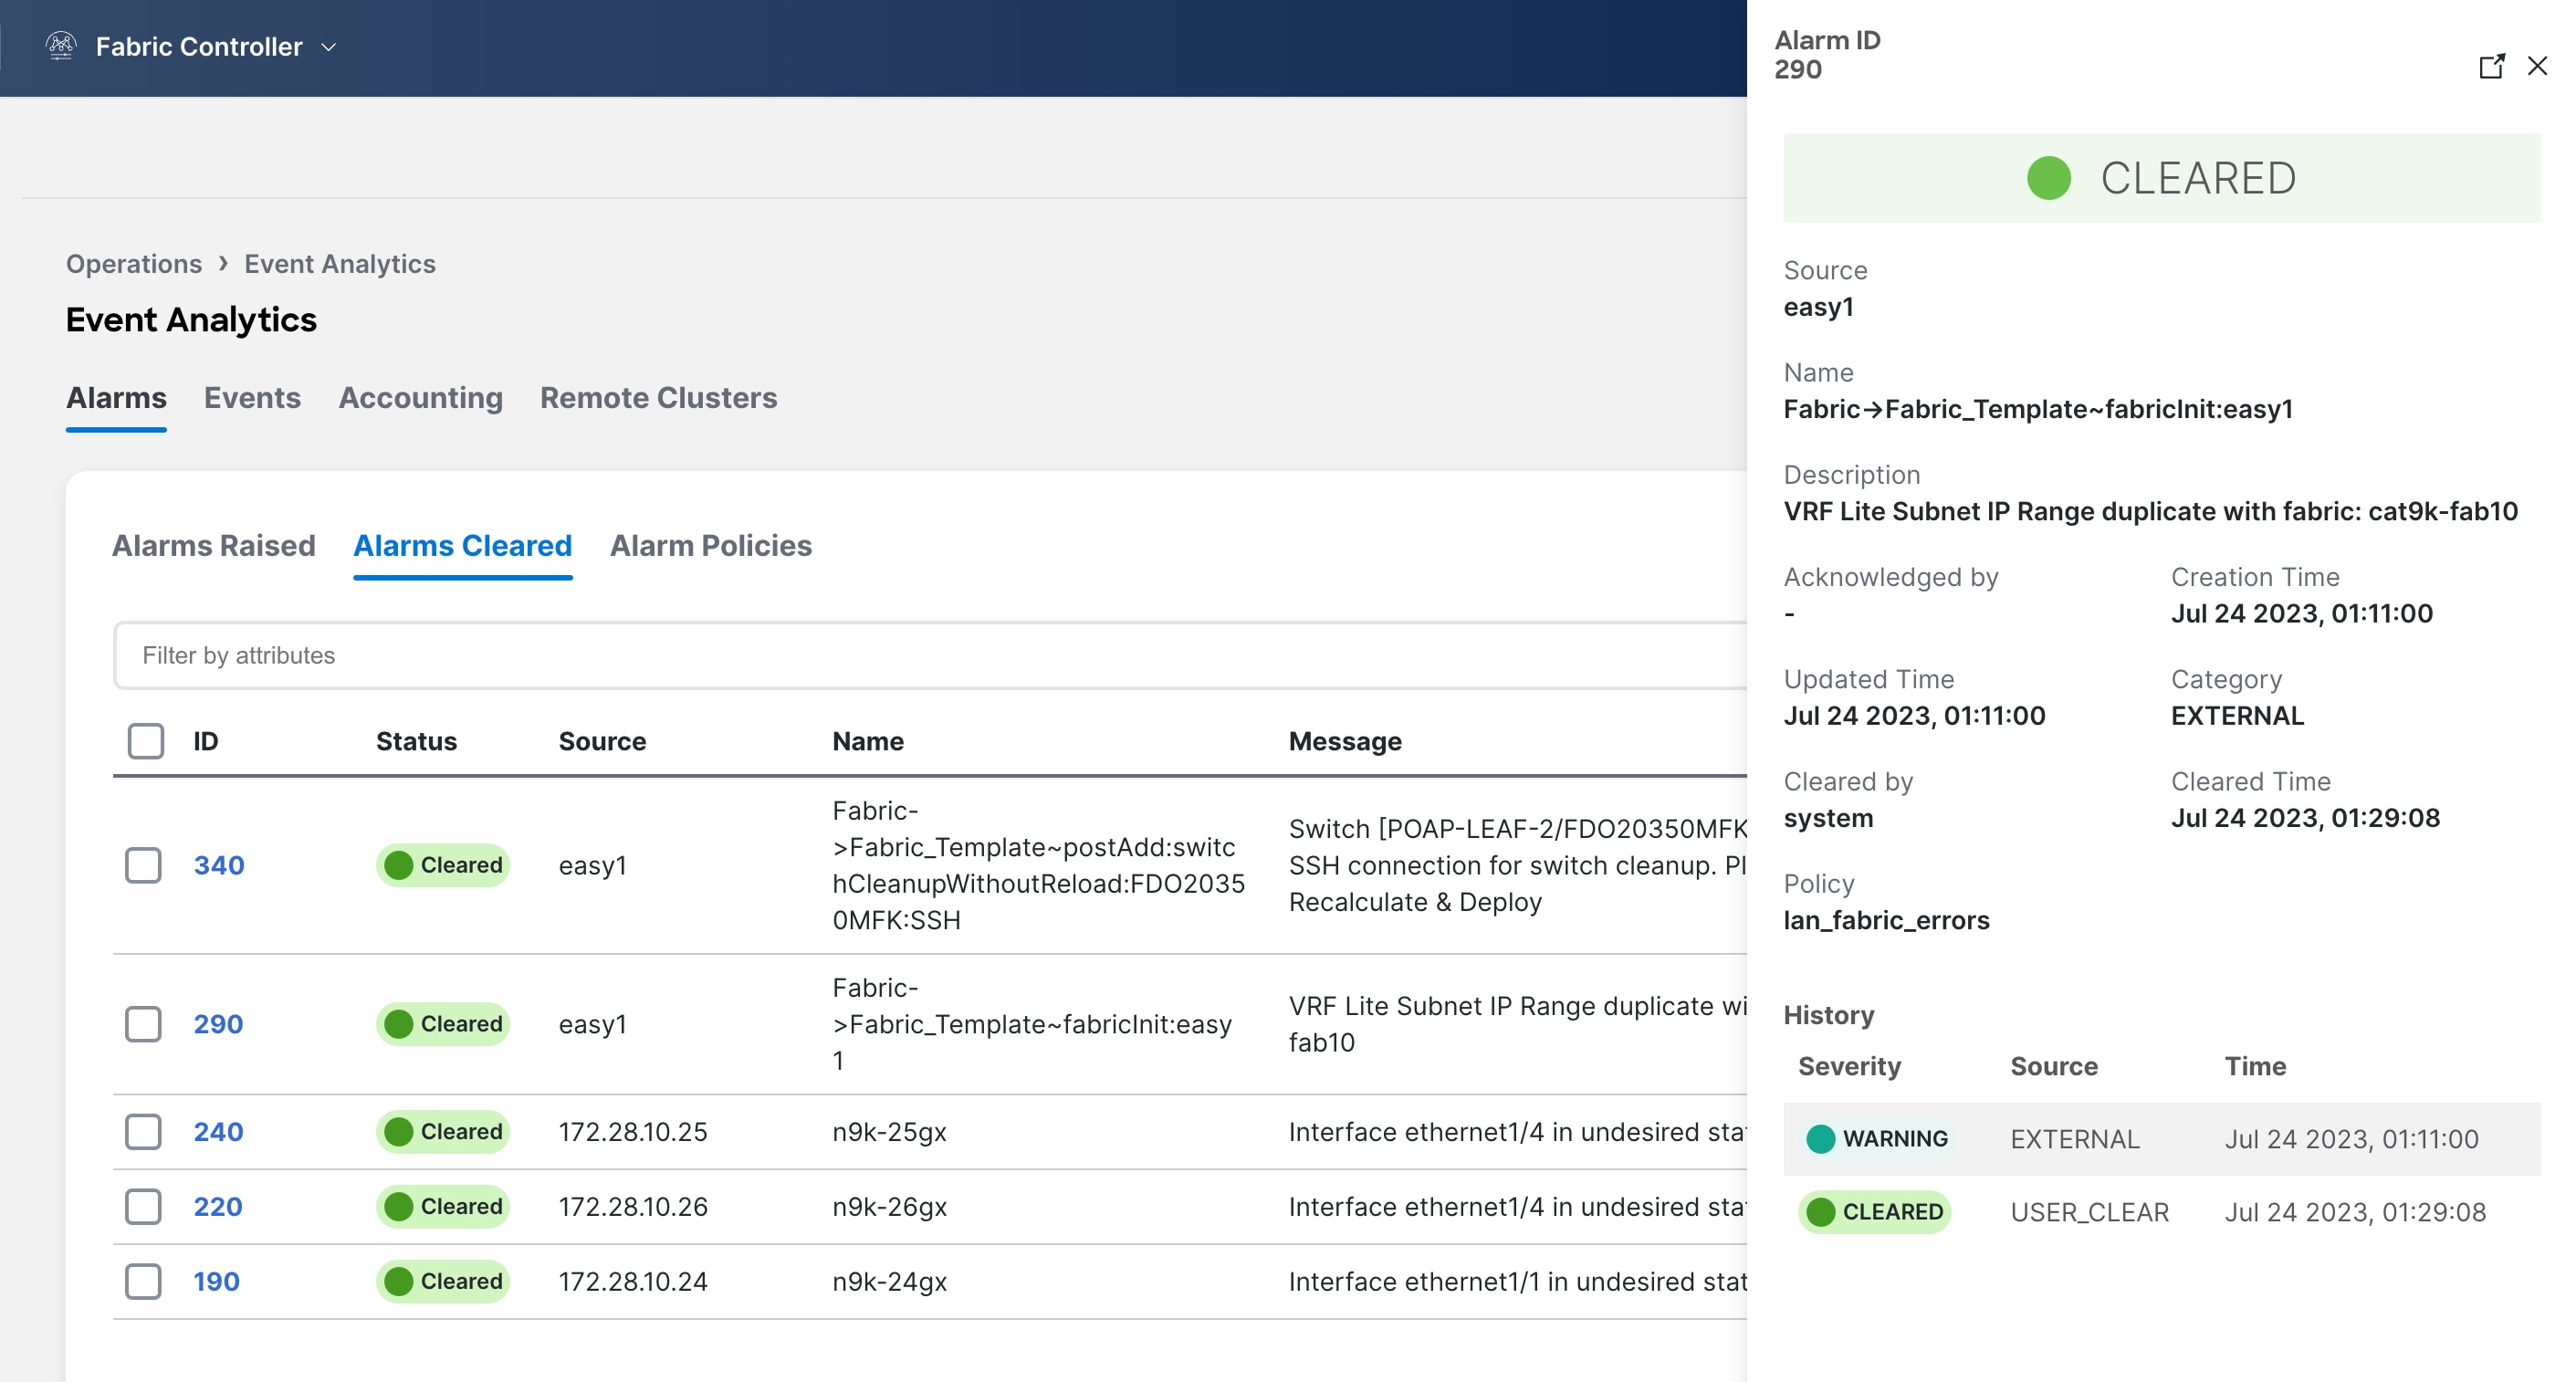
Alarms Cleared
The Alarms Cleared tab displays the list of alarms which are cleared in the Alarms Raised tab. This tab displays information such as alarm ID, status, failure source, name, message, category, creation time, cleared time, cleared by, policy, and the name of the user who has acknowledged the alarm. You can view the cleared alarm details for a maximum of 90 days.
The following table describes the fields that appear on Analyze > Event Analytics > Alarms > Alarms Cleared page.
| Field | Description |
|---|---|
|
ID |
Specifies the ID of an alarm. |
|
Status |
Indicates the status of the alarm. |
|
Source |
Specifies the IP Address of source alarm. |
|
Name |
Specifies the name of the alarm. |
|
Message |
Specifies the CPU utilization and other details of alarm. |
|
Category |
Specifies the category of the alarm. |
|
Creation Time |
Specifies the time at which the alarm was created. |
|
Cleared Time |
Specifies the time at which the alarm was cleared. |
|
Cleared By |
Specifies the user who cleared the alarm. |
|
Policy |
Specifies the policy of the alarm. |
|
Ack User |
Specifies the acknowledged user role name. |
The following table describes the action items, in the Actions menu drop-down list, that appear on Alarms Cleared tab.
| Action Item | Description |
|---|---|
|
Delete Alarm |
Select one or more alarms and choose Action > Delete to delete the cleared alarms. Note that you cannot recover a deleted alarm. |
Alarm Policies
In Cisco Nexus Dashboard Fabric Controller to enable alarms, navigate to Analyze > Event Analytics > Alarms, click Alarm Policies on vertical tab. Ensure that the Enable external alarms check box is selected. You must restart Cisco Nexus Dashboard Fabric Controller server to bring this into effect.
You can forward alarms to registered SNMP Listeners in Cisco Nexus Dashboard Fabric Controller. From Cisco Nexus Dashboard Fabric Controller web UI, choose Admin > System Settings > Server Settings > Alarms, ensure that the Enable external alarms check box is selected. You must restart Cisco Nexus Dashboard Fabric Controller server to bring this into effect.
Ensure that you select the Forwarding check box in the Alarm Policy creation dialog box to enable forwarding alarms to an external SNMP listener.
The following table describes the fields that appear on the Analyze > Event Analytics > Alarms > Alarms Policies page.
| Field | Description |
|---|---|
|
Name |
Specifies the name of the alarm policy. |
|
Description |
Specifies the description of the alarm policy. |
|
Status |
Specifies the status of the alarm policy:
|
|
Policy type |
Specifies the type of the policy:
|
|
Devices |
Specifies the devices to which the alarm policy is applied. |
|
Details |
Specifies the details of the policy. |
The following table describes the action items, in the Actions menu drop-down list that appear on the Alarms Policies page.
| Action Item | Description |
|---|---|
|
Create new alarm policy |
Choose to create a new alarm policy. See Create new alarm policy section. |
|
Edit |
Select a policy and choose Edit to edit the alarm policy. |
|
Delete |
Select a policy and choose Delete to delete the alarm policy. |
|
Activate |
Select a policy and choose Activate to activate and apply the alarm policy. |
|
Deactivate |
Select a policy and choose Deactivate to disable and deactivate the alarm policy. |
|
Import |
Select to import alarm policies from a .txt file.
Beginning with the NDFC 12.2.1 release, you can import alarm policies from a .txt file using the Import Policy dialog box from the Actions > Import drop-down list. |
|
Export |
|
You can create alarm policies for the following policy types:
-
Device Health Policy: Device health policies enable you to create alarms when device SNMP, SSH or ICMP is unreachable. It also raises alarms when the device peripherals become unavailable . Also, these policies enable you to monitor chassis temperature, CPU, memory usage and the status of routing protocols in the device.
-
Interface Health Policy: Interface health policies enable you to monitor Up or Down, Packet Discard, Error, Bandwidth details of the interfaces. By default, all interfaces are selected for monitoring. is
-
Syslog Alarm Policy: Syslog Alarm Policy defines a pair of syslog message formats; one which raises the alarm, and one which clears the alarm.
-
Hardware Health Policy: Hardware health policies enable you to monitor fans, power supplies, modules and also interface status.
Create new alarm policy
You can add alarm policies for the following:
-
Device Health Policy
-
Interface Health Policy
-
Syslog Alarm Policy
-
Hardware Health Policy
After you create a new alarm policy, in the Alarm Policies tab, click Refresh to view the newly-created alarm policy.
Device Health Policy
Device health policies enable you to create alarms when certain conditions are met. By default, all devices are selected for monitoring.
-
Policy Name: Specify a name for the policy. It must be unique.
-
Description: Specify a brief description for the policy.
-
Forwarding: You can forward alarms to registered SNMP listeners in Cisco Nexus Dashboard Fabric Controller . From the Web UI, choose Admin > System Settings > Server Settings > Events.
Ensure that you select Forwarding check box while configuring alarm policies to forward alarms to an external SNMP listener.
-
Email: You can forward alarm event emails to recipients when an alarm is created, cleared or when the severity is changed. From Cisco Nexus Dashboard Fabric Controller Web UI, choose Admin > System Settings > Server Settings > Events. Configure the SMTP parameters, click Save, and restart Cisco Nexus Dashboard Fabric Controller services.
-
Specify the CPU utilization parameters, memory utilization parameters, and environmental temperature parameters.
-
Device Availability: Device health policies enable you to create alarms in the following situations:
-
Device Access: When device ICMP, device SNMP, or device SSH is unnreachable.
-
Peripherals: When fan, power supply, or module is unnreachable.
-
-
Device Feature: You can select the BFD, BGP, and HSRP protocols. When these check boxes are selected, alarms are triggered for the following traps:
-
BFD: ciscoBfdSessDown, ciscoBfdSessUp
-
BGP: bgpEstablishedNotification, bgpBackwardTransNotification, cbgpPeer2BackwardTransition (), c*bgpPeer2EstablishedNotification
-
-
HSRP: cHsrpStateChange
For detailed trap OID definitions, refer to https://snmp.cloudapps.cisco.com/Support/SNMP/do/BrowseOID.do.
Also, these policies enable you to monitor chassis temperature, CPU, and memory usage.
Select the devices for which you want to create policies. Specify the policy name, description, CPU Utilization parameters, Memory Utilization parameters, Environment Temperature parameters, device availability, and device features.
Interface Health Policy
Interface health policies enable you to monitor the interface status, packet discards, errors and bandwidth details of the interfaces. By default, all interfaces are selected for monitoring.
Select the devices for which you want to create policies and then specify the following parameters:
-
Policy Name: Specify a name for the policy. It must be unique.
-
Description: Specify a brief description for the policy.
-
Forwarding: You can forward alarms to registered SNMP listeners in Cisco Nexus Dashboard Fabric Controller by configuring sender and recepient email addresses in Admin > System Settings > Server Settings > Alarms tab.
Ensure that you select Forwarding check box while configuring alarm policies to forward alarms to an external SNMP listener.
-
Email: You can forward alarm event emails to recipients when an alarm is created, cleared or when the severity is changed. From Cisco Nexus Dashboard Fabric Controller Web UI, navigate to Admin > System Settings > Server Settings > SMTP, configure the SMTP parameters and restart Cisco Nexus Dashboard Fabric Controller services.
-
Linkstate: Choose linkstate option to check for the interface link status. You can generate an alarm whenever a link is down and clear the alarms when the link is up.
-
Bandwidth (In/Out): Allows you to set the maximum bandwidth allowed in inbound and outbound directions. The system generates alarms when the bandwidth exceeds the specified values.
-
Inbound Errors: Allows you to set thresholds for the number of inbound errors that are discarded after which it generates an alarm.
-
Outbound Errors: Allows you to set thresholds for the number of outbound errors that are discarded after which it generates an alarm.
-
Inbound Discards: Allows you to set thresholds for the number of inbound packets that are discarded after which it generates an alarm.
-
Outbound Discards: Allows you to set thresholds for the number of outbound packets that are discarded after which it generates an alarm.
Syslog Alarm
Syslog Alarm Policy defines a pair of Syslog messages formats; one which raises the alarm, and one which clears the alarm.
Select the devices for which you want to create policies and then specify the following parameters:
-
Devices: Define the scope of this policy. Select individual devices or all devices to apply this policy.
-
Policy Name: Specify the name for this policy. It must be unique.
-
Description: Specify a brief description for this policy.
-
Forwarding: You can forward alarms to registered SNMP listeners in Cisco Nexus Dashboard Fabric Controller . From Web UI, choose Admin > System Settings > Server Settings > Events.
Ensure that you select Forwarding check box in Alarm Policy creation dialog window to enable forwarding alarms to external SNMP listener.
-
Email: You can forward alarm event emails to recipient when alarm is created, cleared or severity changed. From Cisco Nexus Dashboard Fabric Controller Web UI, choose Admin > System Settings > Server Settings > Events. Configure the SMTP parameters, click Save, and restart Cisco Nexus Dashboard Fabric Controller services.
-
Severity: Define the severity level for this syslog alarm policy. Choices are: Critical, Major, Minor, and Warning.
-
Identifier: Specify the identifier portions of the raise & clear messages.
-
syslogRaise: Define the format of a syslog raise message. The syntax is as follows: Facility-Severity-Type: Message
-
syslogClear: Define the format of a syslog clear message. The syntax is as follows: Facility-Severity-Type: Message
The Regex definitions are simple expressions but not a complete regex. Variable regions of text are noted using $(LABEL) syntax. Each label represents a regex capture group (.+), which corresponds to one or more characters. The variable texts found in both raise and clear messages are used to associate the two messages. An Identifier is a sequence of one or more labels that appear in both messages. An Identifier is used to match a clear syslog message to the syslog message that raised the alarm. If the text appears only in one of the messages, it can be noted with a label and exclude it from the identifier.
Example: A policy with "Value": "ID1-ID2",
"syslogRaise": "SVC-5-DOWN: $(ID1) module $(ID2) is down $(REASON)"
"syslogClear": "SVC-5-UP: $(ID1) module $(ID2) is up."
In the example, ID1 and ID2 labels can be marked as an identifier to find the alarm. This identifier will be found in corresponding syslog messages. Label "REASON" is in the raise but not in the clear message. This label can be excluded from the identifier, as it has no impact on the syslog message to clear the alarm.
| Identifier | ID1-ID2 |
|---|---|
|
Raise Regex |
ETHPORT-5-IF_ADMIN_UP: Interface Ethernet15/1 is admin up . |
|
Clear Regex |
ETHPORT-5-IF_DOWN_NONE: Interface Ethernet15/1 is down (Transceiver Absent) |
In the above example, the regex expressions are part of the syslog messages that appear in the terminal monitor.
| Identifier | ID1-ID2 |
|---|---|
|
Raise Regex |
ETH_PORT_CHANNEL-5-PORT_DOWN: $(ID1): $(ID2) is down |
|
Clear Regex |
ETH_PORT_CHANNEL-5-PORT_UP: $(ID1): $(ID2) is up |
| Identifier | ID1-ID2 |
|---|---|
|
Raise Regex |
ETHPORT-5-IF_SFP_WARNING: Interface $(ID1), High Rx Power Warning |
|
Clear Regex |
ETHPORT-5-IF_SFP_WARNING: Interface $(ID1), High Rx Power Warning cleared |
Hardware Health Policy
The hardware health policy is used to raise hardware-related alarms for different parameters, such as fan status, power supply, modular status and all interface-related alarms.
By default, there is a hardware policy called as discovery that is standard with the NDFC installation. This hardware policy defines various conditions for different parameters. You can also create custom hardware policies for the parameters listed above and define regex expressions based on which alarms are raised.
By default, the All Devices option is selected automatically.
-
Policy Name: Specify a name for the policy. It must be unique.
-
Description: Specify a brief description for the policy.
-
Forwarding: You can forward alarms to registered SNMP listeners in Cisco Nexus Dashboard Fabric Controller. From the Web UI, choose Admin > System Settings > Server Settings > Events.
Ensure that you select Forwarding check box while configuring alarm policies to forward alarms to an external SNMP listener.
-
Email: You can forward alarm event emails to recipients when an alarm is created, cleared or when the severity is changed. From Cisco Nexus Dashboard Fabric Controller Web UI, choose SettingsServer SettingsEvents. Configure the SMTP parameters, click Save, and restart Cisco Nexus Dashboard Fabric Controller services.
Hardware alarms are raised based on regex expressions that you enter when you are creating the policy.
In the Alarms area, create a hardware health policy to raise alarms for the following parameters:
-
Fan: Define the severity for fan-related alarms and determine the condition for the alarms.
-
Click the toggle switch next to Fan to enable the fan-related alarms.
-
Select the severity of the alarm:
-
Critical
-
Major
-
Minor
-
Warning
-
Cleared
-
-
Click Edit Regex, then enter the value that will trigger the alarm when the status is not that value.
For example, if you enter ok in the Trigger alarm when status is not field, NDFC will raise an alarm for any status other than ok, such as N/A.
-
Click Save.
-
-
Power Supply: Define the severity for power supply-related alarms and determine the condition for the alarms.
-
Click the toggle switch next to Power Supply to enable the power supply-related alarms.
-
Select the severity of the alarm:
-
Critical
-
Major
-
Minor
-
Warning
-
Cleared
-
-
Click Edit Regex, then enter the value that will trigger the alarm when the status is not that value.
For example, if you enter ok in the Trigger alarm when status is not field, NDFC will raise an alarm for any status other than ok, such as failed, OffEnvpower, OffDenied, and so on.
-
Click Save.
-
-
Module: Define the severity for module-related alarms and determine the condition for the alarms.
-
Click the toggle switch next to Module to enable the module-related alarms.
-
Select the severity of the alarm:
-
Critical
-
Major
-
Minor
-
Warning
-
Cleared
-
-
Click Edit Regex, then enter the value that will trigger the alarm when the status matches that value.
For example, if you were to enter the following value in the Trigger alarm when status matches regex field, as shown in the information (i) button:
^(?!ok|poweredDown|okButDiagFailed).*$
NDFC will raise an alarm when modules are in states other than ok, poweredDown, and OkButDiag failed.
-
Click Save.
-
-
Interface Status: Define the severity for interface-related alarms and determine the condition for the alarms.
-
Click the toggle switch next to Interface Status to enable the interface-related alarms.
-
Click one or more toggle switches next to the appropriate severity to select the severity of the alarm:
-
Critical
-
Major
-
Minor
-
Warning
-
Cleared
-
-
Click Edit Regex, then enter the value that will trigger the alarm when the status matches that value. The provided regex expression is matched against the combined field of admin_status:oper_status:status_reason.
For example, if you were to enter the following value in the Trigger alarm when status matches regex field:
^up:down:(?!Link not connected|XCVR not inserted|sfpNotPresent|Channel admin down).*$
NDFC will raise an alarm when interfaces are in states that match these values.
-
Click Save.
-
Endpoint Locator Alarms
Alarms are registered and created under the External alarm category by the Endpoint Locator (EPL).
Endpoint Locator: Alarm Policies
The EPL external alarm category policy is activated when EPL is enabled on a fabric. Alarms are raised for issues such as Duplicate IP addresses, Duplicate MAC addresses, Endpoints appearing on a VRF and Endpoints disappearing from a VRF, Endpoints moving within a fabric, loss of Route Reflector connectivity, and restoration of Route Reflector connectivity. Depending on the issue, the severity level of the alarm policy can be CRITICAL or MINOR.
Alarms are raised and categorized as CRITICAL for the following events:
-
Route Reflector disconnection
-
Detection of a duplicate IP address
-
Detection of a duplicate MAC address
Alarms are raised and categorized as MINOR for the following events:
-
Movement of an endpoint
-
Appearance of a new VRF in a fabric
-
Number of endpoints in a fabric goes down to 0
-
Number of endpoints in a VRF goes down to 0
-
Disappearance of all endpoints from a switch
-
Connection of a Route Reflector (RR)
CRITICAL alarms are cleared automatically when the condition is corrected. For example, when the connectivity between NDFC and RR is lost, a CRITICAL alarm is generated. This alarm is automatically cleared when the connectivity between NDFC and RR is restored. Other MINOR alarms are automatically cleared after 30 minutes have passed since the alarm was generated.
You must clear the duplicate MAC and duplicate IP alarms after the condition is resolved.
Choose Event Analytics > Alarms > Alarm Policies to display the EPL alarm policies. You cannot edit the alarm policies on the web UI.
Choose Actions > Activate or Deactivate to activate or deactivate the selected policy.
In case an alarm policy is deleted using the NDFC Web UI, any alarms created or cleared for that policy will not be displayed in the Event Analytics > Alarms > Alarm Policies tab. To delete a policy, select the checkbox next to the policy and click Delete. However, we recommend not deleting a policy from the NDFC Web UI. When a fabric is deleted, the alarm policy along with all the active alarms for the devices in that fabric are deleted.
Endpoint Locator: Active Alarms
Choose Event Analytics > Alarms > Alarms Raised to display the active alarms.
To clear an active alarm, select the checkbox next to the alarm and choose Actions > Clear.
To delete an active alarm, select the checkbox next to the alarm and choose Actions > Delete.
Endpoint Locator: Cleared Alarms
To view cleared alarms, choose Event Analytics > Alarms > Alarms Cleared.
Click on the Cleared status column for any particular alarm to display detailed information about the selected alarm.
To delete a cleared alarm from the list of cleared alarms, select the checkbox next to the alarm and choose Actions > Delete.
For more information on Alarms and Policies, refer to Alarms.
Events
This tab displays the events that are generated for the switches. This tab displays information such as Ack, Acknowledged user, Group, Switch, Severity, Facility, Type, Count, Last Seen, and Description. You can select one or more events and then acknowledge or unacknowledge their status using the Change Status drop-down list. In addition, you can select one or more alarms and then click the Delete button to delete them. If you want to delete all events, click the Delete All button.
The following table describes the fields that appear on Analyze > Event Analytics > Events.
| Field | Description |
|---|---|
|
Group |
Specifies the Fabric |
|
Switch |
Specifies the hostname of the switch |
|
Severity |
Specifies the severity of the event |
|
Facility |
Specifies the process that creates the events. The event facility includes two categories: NDFC and syslog facility. Nexus Dashboard Fabric Controller facility represents events generated by Nexus Dashboard Fabric Controller internal services and SNMP traps generated by switches. Syslog facility represents the machine process that created the syslog messages. |
|
Type |
Specifies how the switch/fabric are managed |
|
Count |
Specifies the number of times the event has occurred |
|
Creation Time |
Specifies the time when the event was created |
|
Last Seen |
Specifies the time when the event was run last |
|
Description |
Specifies the description provided for the event |
|
Ack |
Specifies if the event is acknowledged or not |
The following table describes the action items, in the Actions menu drop-down list, that appear on Analyze > Event Analytics > Events.
| Action Item | Description |
|---|---|
|
Acknowledge |
Select one or more events from the table and choose Acknowledge icon to acknowledge the event information for the fabric. After you acknowledge the event for a fabric, the acknowledge icon is displayed in the Ack column next to the Group. |
|
Unacknowledge |
Select one or more events from the table and choose Unacknowledge icon to acknowledge the event information for the fabric. |
|
Delete |
Select an event and choose *Delete*to delete the event. |
|
Add Suppressor |
Select an event and choose Add Suppressor to add a rule to the event. You can provide name to the rule. Using the Scope options, you can add this rule to all the Fabrics, or particular elements or all elements. |
|
Event Setup |
Allows you to set up new events. For more information, see Setting Up Events. |
Setting Up Events
To setup an event using the Cisco Nexus Dashboard Fabric Controller Web UI, perform the following steps:
-
Choose Analyze > Event Analytics and click on the Events tab.
-
From the Actions drop-down list, select Event Setup. The Receiver tab displays the following details:
-
Syslog Receiver enabled: Displays the status of the syslog server.
-
SNMP Trap Receiver: Displays the details of SNMP traps received, processed and dropped.
-
Syslog Receiver: Displays the details of syslog messages received, processed and dropped.
SMTP servers with Start Transport Layer Security (STARTTLS) are not supported.
-
-
Navigate to the Sources tab, to view a list of fabrics and its associated switches. The Sources tab displays all the fabrics and the associated switches in tabular format. It also displays if traps and syslogs have been configured on the switches.
-
Perform the following steps to create rules for forwarding email notifications or traps for events:
Cisco Nexus Dashboard Fabric Controller Web UI forwards fabric events through email or SNMPv1 or SNMPv2c traps. Some SMTP servers may require adding authentication parameters to the emails that are sent from Nexus Dashboard Fabric Controller to the SMTP servers.
-
Ensure that you have configured SMTP parameters before configuring rules for forwarding event notifications through emails. To verify SMTP configuration, navigate to Admin > System Settings > Server Settings > SMTP and verify that you have configured the required fields.
-
To enable events forwarding, choose Admin > System Settings > Server Settings > Events and configure the fields as described in the following table.
Table 4. Configure Events Forwarding Field Description Enable Event forwarding
Check the checkbox to enable events forwarding feature.
Email Forwarding From Email List
Specifies the email address from which the forwarding messages arrive.
Snooze Event Forwarding
Snoozes an event from forwarding for the given time range.
Maximum Number of Repeats in Event Forwarding
Stops forwarding an event after the specified time. 0 indicates unlimited time.
Maximum Number in Events/Traps/Syslog Queue
Specifies the maximum number in the queue before dropping the incoming events/traps/syslog.
-
To configure rules, choose Analyze > Event Analytics.
-
Navigate to the Forwarding tab and choose Actions > Add Rule and configure the fields as described in the following table.
Table 5. Configure Rules Field Description Forwarding Method
Chooose one of the forwarding methods:
-
E-Mail
-
Trap
Email Address
This field appears if you select E-mail as the forwarding method.
Enter an email address for forwarding the event notifications.
Address
This field appears if you select Trap as the forwarding method.
Enter the IP address of the SNMP trap receiver. You can either enter an IPv4 or IPv6 address or a DNS server name.
Port
Enter the port to which the traps are forwarded.
Forwarding Scope
Maximum number in queue before dropping the incoming events/traps/syslog messages.
Fabric
Select All Fabrics or a specific fabric for notification.
Source
Select DCNM or Syslog. If you select DCNM, do the following:
-
From the Type drop-down list, choose an event type.
-
Check the Storage Ports Only check box to select only the storage ports. This check box is enabled only for port related events.
If you select Syslog, do the following:
-
In the Facility list, select the syslog facility.
-
In the Type field, enter the syslog type.
-
In the Description Regex field, enter a description that matches with the event description.
-
-
From the Minimum Severity drop-down list, select the severity level of the messages to receive.
The traps that are transmitted by Cisco Nexus Dashboard Fabric Controller correspond to the severity type. A text description is also provided with the severity type.
trap type(s) = 40990 (emergency) 40991 (alert) 40992 (critical) 40993 (error) 40994 (warning) 40995 (notice) 40996 (info) 40997 (debug) textDescriptionOid = 1, 3, 6, 1, 4, 1, 9, 9, 40999, 1, 1, 3, 0 -
Click Add Rule.
-
-
Perform the following steps to create rules for suppressing events:
Nexus Dashboard Fabric Controller allows you to suppress specified events based on user-specified rules. Such events will not be displayed on the Nexus Dashboard Fabric Controller Web UI and SAN Client. The events will neither be added to the Nexus Dashboard Fabric Controller database, nor forwarded via email or as SNMP traps.
You can view, add, modify, and delete rules from the table. You can create a rule from the existing events. Select an existing event as the template and open the Add Rule window by navigating to Analyze > Event Analytics > Events page, select the event and choose Actions > Add Suppressor. The details are automatically ported from the selected event in the events table to the fields of the Add Rule window.
-
In the Name field, enter a name for the rule.
-
In the Scope field, select one of the following options - SAN, Port Groups or Any.
In the Scope field, the LAN/SAN groups and the port groups are listed separately. For SAN and LAN, select the scope of the event at the fabric or group or switch level. You can only select groups for port group scope. If use select Any as the scope, the suppression rule is applied globally.
-
In the Facility field, enter the name or choose from the SAN/LAN switch event facility list.
If you do not specify a facility, a wildcard is applied.
-
In the Type field, enter the event type.
If you do not specify the event type, wildcard is applied.
-
In the Description Matching field, specify a matching string or regular expression.
The rule matching engine uses regular expression that is supported by Java Pattern class to find a match against an event description text.
-
Check the Active Between check box and select a valid time range during which the event is suppressed.
By default, the time range is not enabled.
In general, you must not suppress accounting events. Suppression rule for Accounting events can be created only for certain situations where accounting events are generated by actions of Nexus Dashboard Fabric Controller or switch software. For example, 'sync-snmp-password' AAA syslog events are automatically generated during the password synchronization between Nexus Dashboard Fabric Controller and managed switches. To suppress accounting events, navigate to Analyze > Event Analytics > Events page, select the event and choose Actions > Add Suppressor.
-
Click Add Rule.
-
Accounting
You can view the accounting information on Cisco Nexus Dashboard Fabric Controller Web UI.
The following table describes the fields that appear on Analyze > Event Analytics > Accounting.
| Field | Description |
|---|---|
|
Source |
Specifies the source |
|
User Name |
Specifies the user name. |
|
Time |
Specifies the time when the event was created |
|
Description |
Displays the description. |
|
Group |
Specifies the name of the group. |
The following table describes the action items, in the Actions menu drop-down list, that appear on Analyze > Event Analytics > Accounting.
| Action Item | Description |
|---|---|
|
Delete |
Select a row and choose Delete to delete accounting information from the list. |
Remote Clusters
This tab displays the clusters and the number of Fabrics in each cluster in your setup.
Click on the Cluster Name to see the summary information. You can click on the launch icon to view the detailed summary of the Cluster.
Copyright
THE SPECIFICATIONS AND INFORMATION REGARDING THE PRODUCTS IN THIS MANUAL ARE SUBJECT TO CHANGE WITHOUT NOTICE. ALL STATEMENTS, INFORMATION, AND RECOMMENDATIONS IN THIS MANUAL ARE BELIEVED TO BE ACCURATE BUT ARE PRESENTED WITHOUT WARRANTY OF ANY KIND, EXPRESS OR IMPLIED. USERS MUST TAKE FULL RESPONSIBILITY FOR THEIR APPLICATION OF ANY PRODUCTS.
THE SOFTWARE LICENSE AND LIMITED WARRANTY FOR THE ACCOMPANYING PRODUCT ARE SET FORTH IN THE INFORMATION PACKET THAT SHIPPED WITH THE PRODUCT AND ARE INCORPORATED HEREIN BY THIS REFERENCE. IF YOU ARE UNABLE TO LOCATE THE SOFTWARE LICENSE OR LIMITED WARRANTY, CONTACT YOUR CISCO REPRESENTATIVE FOR A COPY.
The Cisco implementation of TCP header compression is an adaptation of a program developed by the University of California, Berkeley (UCB) as part of UCB’s public domain version of the UNIX operating system. All rights reserved. Copyright © 1981, Regents of the University of California.
NOTWITHSTANDING ANY OTHER WARRANTY HEREIN, ALL DOCUMENT FILES AND SOFTWARE OF THESE SUPPLIERS ARE PROVIDED “AS IS" WITH ALL FAULTS. CISCO AND THE ABOVE-NAMED SUPPLIERS DISCLAIM ALL WARRANTIES, EXPRESSED OR IMPLIED, INCLUDING, WITHOUT LIMITATION, THOSE OF MERCHANTABILITY, FITNESS FOR A PARTICULAR PURPOSE AND NONINFRINGEMENT OR ARISING FROM A COURSE OF DEALING, USAGE, OR TRADE PRACTICE.
IN NO EVENT SHALL CISCO OR ITS SUPPLIERS BE LIABLE FOR ANY INDIRECT, SPECIAL, CONSEQUENTIAL, OR INCIDENTAL DAMAGES, INCLUDING, WITHOUT LIMITATION, LOST PROFITS OR LOSS OR DAMAGE TO DATA ARISING OUT OF THE USE OR INABILITY TO USE THIS MANUAL, EVEN IF CISCO OR ITS SUPPLIERS HAVE BEEN ADVISED OF THE POSSIBILITY OF SUCH DAMAGES.
Any Internet Protocol (IP) addresses and phone numbers used in this document are not intended to be actual addresses and phone numbers. Any examples, command display output, network topology diagrams, and other figures included in the document are shown for illustrative purposes only. Any use of actual IP addresses or phone numbers in illustrative content is unintentional and coincidental.
The documentation set for this product strives to use bias-free language. For the purposes of this documentation set, bias-free is defined as language that does not imply discrimination based on age, disability, gender, racial identity, ethnic identity, sexual orientation, socioeconomic status, and intersectionality. Exceptions may be present in the documentation due to language that is hardcoded in the user interfaces of the product software, language used based on RFP documentation, or language that is used by a referenced third-party product.
Cisco and the Cisco logo are trademarks or registered trademarks of Cisco and/or its affiliates in the U.S. and other countries. To view a list of Cisco trademarks, go to this URL: https://www.cisco.com/go/trademarks. Third-party trademarks mentioned are the property of their respective owners. The use of the word partner does not imply a partnership relationship between Cisco and any other company. (1110R)
© 2017-2024 Cisco Systems, Inc. All rights reserved.