
New and changed information
The following table provides an overview of the significant changes up to this current release. The table does not provide an exhaustive list of all changes or of the new features up to this release.
| Release Version | Feature | Description |
|---|---|---|
|
Nexus Dashboard 4.3.1 |
Smart Switch VXLAN EVPN with Hypershield Integration (Top of rack, Zone Based Segmentation use cases) |
Beginning with Nexus Dashboard 4.3.1, the system supports onboarding the Hypershield controller to automate security policy enforcement, zone segmentation, and traffic steering on Cisco N9324C-SE1U and N9348Y2C6D Smart switches. For more information, see Hypershield integration. |
About integrations
Nexus Dashboard supports these categories for supported integration types:
| Category | Integration type |
|---|---|
|
IPAM and DNS |
Infoblox IPAM and DNS integrations |
|
Virtual machine and container workload managers |
vCenter server, Kubernetes, and OpenShift integrations |
|
AI endpoint discovery and management |
LLDP AI endpoint discovery |
|
Energy management |
Panduit PDU integration |
|
Application performance management |
AppDynamics integration |
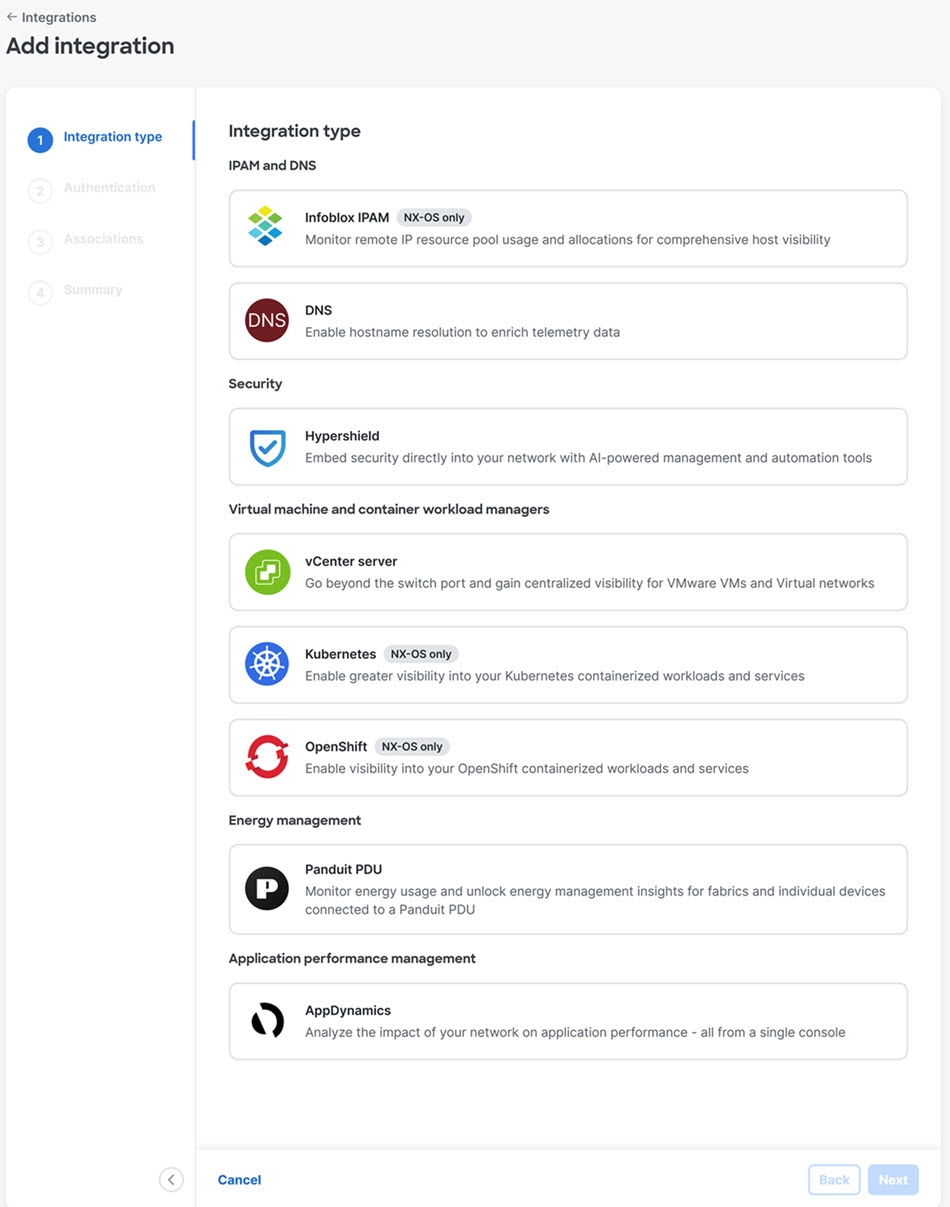
Navigate to the Integrations page using either of the following paths:
-
To see integrations at the Nexus Dashboard level, navigate to Admin > Integrations.
-
To see integrations at the fabric level:
-
Navigate to your fabric (Manage > Fabrics, then click on your fabric).
-
Click the Integrations tab.
-
All the integrations are listed in a tabular form with the following fields:
| Action Item | Description |
|---|---|
|
Name |
The name of the integration. |
|
Status |
The status of the integration. |
|
Type |
The type of integration. |
|
IP/Hostname |
The IP or hostname of the integration. |
|
Last Active |
When the integration was last active. |
|
Fabric associations |
Which fabric this integration is associated with, if applicable. |
|
Derived fabrics |
Shows integrations that are not configured but are derived based on the physical topology and discoverability by Nexus Dashboard. |
The connected status indicates that the controller is active to fetch data. The down status indicates that the Nexus Dashboard will not fetch data from the controller. Use the filter bar to search for a specific integration. You can filter based on the name and type of integration.
At the Nexus Dashboard level:
-
Click Add Integration to add a new integration.
-
Click the ellipsis icon (…) to edit, delete, or rediscover an integration.
The following table describes the action items that appear in the Integrations page in the Actions menu drop-down list:
| Action Item | Description |
|---|---|
|
Add Instance |
From the Actions drop-down list, choose Add Instance. For more instructions, see Adding an Instance. 
Ensure that you have configured same IP address on Routes. Refer to Configuring Routes IP Address. |
|
Edit Instance |
Choose an instance to edit. From the Actions drop-down list, choose Edit Instance. Make the necessary changes and click Save. Click Cancel to discard the changes. |
|
Delete Instance(s) |
Choose one or more required instance to delete. From the Actions drop-down list, choose Delete Instance(s). Click Confirm to delete the instance. Click Cancel to discard the delete. |
|
Rediscover Instance(s) |
Choose one or more required instance to rediscover. From the Actions drop-down list, choose Rediscover Instance(s). A confirmation message appears. |
At either the Nexus Dashboard level or the fabric level, click the integration names to view further details about the integration.
DNS integrations are not clickable and do not have any further information to display apart from the data available in the table.
Guidelines and limitations for integrations
-
In Nexus Dashboard, integrations are supported on both Management and Data networks.
-
By default, Nexus Dashboard will use Data network to connect to the integrations such as vCenter server, DNS, AppDynamics, or orchestration. If you want to use Management network, you can add a specific route in Nexus Dashboard’s Admin Console from Admin > System Settings > General > Routes. The route can be a /32 pointing to Integrations or a larger subnet that includes it.
Infoblox IPAM
The IPAM Integrator allows read-only access to the IPAM and Nexus Dashboard servers. Currently, IPv4 overlay DHCP is supported. In read-only access mode, IPAM records are retrieved and mapped to Nexus Dashboard networks in Easy Fabric and eBGP VXLAN fabric. You can also choose to sync up records on-demand between Nexus Dashboard and IPAM server. An Infoblox user who has the API permission and at least IPv4 network read permission of IPAM will be able to view the retrieved Infoblox records.
In addition to the matched subnets that exist on both IPAM server and Nexus Dashboard, the IPAM Integrator lists the subnets with conflicting netmask for review.
Accessing IPAM Integrator
This procedure shows how to access IPAM integrator.
-
To enable IPAM Integration feature, perform the following steps:
-
Choose Admin > System Settings > Feature Management.
-
Check the IPAM Integration check box and click Apply.
-
-
On Nexus Dashboard UI, choose Virtual Management > IPAM Integrator.
-
Click on Authentication Access to provide the required IPAM server authentication details.
-
Provide the required access details in the Access Config page.
You can provide the access details of an Infoblox server or an Infoblox grid manager.
-
IPAM Server IP Address - Specifies the IP address of the IPAM server.
-
IPAM Server Username - Specifies the user name for the IPAM server. The Infoblox user has to be granted API permission for the application to retrieve data from Infoblox server via API.
-
IPAM Server Password - Specifies the password for the IPAM server with respect to the username.
-
Poll Interval (minutes) - Specifies the time in minutes that determines how often you want the data to be retrieved from Cisco Nexus Dashboard and IPAM server. The default value is 15 minutes.
-
-
Click Authenticate.
-
After you access IPAM, you can modify, remove the access details, or edit the poll interval using the Edit Authentication Access.
Only the Nexus Dashboard users with the admin role can add, update, and delete the access setting. Also, only Infoblox user who has been granted with API permission and at least IPv4 network read access of IPAM permission is able to view the retrieved Infoblox network records.
Viewing Network IP Scope
Network IP Scope is the landing page after you access the IPAM Integrator.
The following table describes the fields retrieved from the IPAM server.
|
Field |
Description |
|
Network View |
Specifies the network view, which is a single routing domain with its own networks and shared networks on the Infoblox server. |
|
IP Subnet |
Specifies the IP subnet defined in the IPAM server. A subnet, or subnetwork, is a segmented piece of a larger network. More specifically, subnets are a logical partition of an IP network into multiple, smaller network segments. |
|
DHCP Utilization |
Specifies the utilization percentage of a network in terms of the IP addresses that are leased out.Hover over the percentage value to view the number of allocated IPs and their details.In the Infoblox server, it takes time to calculate the DHCP utilization. The IPAM utilization is calculated approximately every 15 minutes on the Infoblox server, and the latest value will be reflected on the IPAM Integrator after that. |
|
IP Range |
Specifies the IP range for the network. Hover over a range to view the enabled DHCP range, the reserved DHCP range, and the fixed addresses for a network. |
The following table describes the fields retrieved from Nexus Dashboard.
|
Field |
Description |
|
Fabric Name |
Specifies the name of the fabric. |
|
Fabric Type |
Specifies the type of the fabric. It can be Multi-Site Domain (MSD), or a standalone easy fabric or an eBGP VXLAN fabric. |
|
Network Name |
Specifies the name of the network. |
|
VRF Name |
Specifies the name of the VRF. |
|
Network ID |
Specifies the network ID. |
|
VLAN ID |
Specifies the VLAN ID. |
|
Last Updated (by Infoblox) |
Specifies the date and time when the data was last updated by Infoblox.
The date and time of the last poll are displayed under the Network IP Scope title. |
Click Export to export the data in a .csv file.
For each field, you can sort the values by clicking the arrow icons, and search by entering the search criterion in Filter by attributes box.
The polling of data is based on the following criteria:
-
Poll interval value that the user configured initially in the Access Authentication page. It specifies how often you want the data to be retrieved from Cisco Nexus Dashboard and IPAM.
-
User can click the Refresh icon to receive instantaneous data from Nexus Dashboard and IPAM server.
-
Nexus Dashboard Web UI automatically refreshes every 2 minutes and displays data retrieved from Nexus Dashboard and Infoblox server.
For example, if the poll interval is 15 minutes and user doesn’t refresh (on-demand) the data during this 15-minute duration, the Nexus Dashboard Web UI displays the same polling data after every 2-minute refresh until 15 minutes. After 15 minutes, new data is polled from Nexus Dashboard and IPAM, and saved in the database. This new data is fetched by Nexus Dashboard after a total of 16 minutes.
Viewing Statistics and Summary Data for the Subnet Utilization
To view the summary data for the utilization of the IP Subnet over a time, navigate to the following path.
-
Click on the IP Subnet. A Subnet slide-in pane displays summary data with IP Allocations, Utilization, Allocations, and DHCP Range Details.
To view the statistics for the utilization of the IP Subnet over a time, navigate to the following paths.
-
Click on the IP Subnet. A Subnet slide-in pane displays summary data.
-
Expand the Subnet slide-in pane. A Subnet Details screen appears.
-
Click the Statistics tab.
Click the drop-down list and select the time for which you want to view the statistics. These statistics include utilization of subnet such as DHCP allocations, total allocations, dynamic allocations, and static allocations.
Viewing IP Allocation for Hosts
To view the IP allocation for each host, navigate to the following paths.
-
Click on the IP Subnet. A Subnet slide-in pane displays summary data.
-
Expand the Subnet slide-in pane. A Subnet Details screen appears with IP Allocation details.
The following fields are displayed for each host in the IP Allocation page. The data for these fields is retrieved from the IPAM server.
-
IP Address
-
Host Name
-
State of the host, that is, active or free
-
Range start time and end time
-
Subnet
-
VRF Name
-
Protocol version
-
MAC address
-
DHCP server info such as IP address and server name
-
Switch:Port
-
Fabric Name
-
Last requested by the host
The Switch:Port and Fabric Name are retrieved through Nexus Dashboard EPL (Endpoint Locator) integration. Their values are empty if EPL feature is not enabled.
For each field, you can sort the values by clicking the arrow icons, and search by entering the search criterion in Filter by attributes box.
By default, information about only active hosts are displayed. Click the All value to view information about all hosts retrieved from the IPAM server. Click Export to export the data in a .csv file.
Hosts that were recently freed show as "FREE" in the All tab. All the originally free hosts won’t be shown as FREE. Only the hosts that were recently freed appear in this tab.
Viewing Conflicting Networks
IPAM Integrator detects conflicting networks defined in IPAM server and Nexus Dashboard. You can view this info by clicking Conflicting in the Network IP Scope page.
For example, if one network is a subset of another, the conflicting IP addresses of the network are displayed under Conflicting.
The data is displayed similar to how the Matched data is displayed. You can click the IP range value under the IP Range column to view the IP allocation for each host.
Note that this table also lists the Nexus Dashboard Gateway for the conflicting IP scopes in addition to the subnet information from the IPAM server.
For each field, you can sort the values by clicking the arrow icons, and search by entering the search criterion in Filter by attributes box.
DNS integration
The Domain Name System (DNS) integration feature enables the name resolution feature to telemetry data. DNS integration can be associated at the Fabric level.
For DNS integration, you can use one of multiple data source methods.
DNS file upload
This method is simple because mappings do not change often. In the GUI, you can upload a file containing mappings. Use one of the supported formats (.csv and .json). Nexus Dashboard verifies the integrity of the file. When required, you can also download or delete the file from the GUI.
If you do not specify a VRF instance, Fabric name, nor Tenant information, DNS will be applied to the fabrics for which the DNS server is configured based on the choices in Add Integrations and Associations section. If the DNS server is configured for a fabric, then DNS will be applied to all the fabrics in the group.
The DNS file upload size is limited to 1.8 MB.
Example CSV file
This section provides an example of a CSV file’s contents.
recordType  fqdn            ips         siteName    tenant          vrf
dnsEntry    WebSrv1.foo.com 10.101.11.1 ACI-Fab1    prod            vrf_prod
dnsEntry    WebSrv2.foo.com 10.101.11.2 ACI-Fab1    prod            vrf_prod
dnsEntry    WebSrv3.foo.com 10.101.11.3 ACI-Fab1    prod            vrf_prod
dnsEntry    WebSrv4.foo.com 10.101.11.4 ACI-Fab1    prod            vrf_prod
Example JSON file
This section provides an example of a JSON file’s contents.
[
    {
        "recordType": "dnsEntry",
        "fqdn": "WebSrv1.foo.com",
        "ips": [
            "10.101.11.1"
        ]
    },
    {
        "recordType": "dnsEntry",
        "fqdn": "WebSrv2.foo.com",
        "ips": [
            "10.101.11.2",
            "52::2"
        ]
    },
    {
        "recordType": "dnsEntry",
        "fqdn": "WebSrv3.foo.com",
        "ips": [
            "10.101.11.3",
            "52::3"
        ]
    },    {
        "recordType": "dnsEntry",
        "fqdn": "WebSrv4.foo.com",
        "ips": [
            "10.101.11.4",
            "10::101:0:4"
        ]
    }
]
DNS query
Use this method one query at a time to retrieve data from the DNS server using reverse lookup. Reverse lookup zone(s) must be configured on the DNS server.
Nexus Dashboard queries the DNS server at regular intervals and resolves IP addresses that are learned using endpoints.
Nexus Dashboard allows one primary and multiple secondary DNS servers, the primary DNS server will be polled first. If the resolution does not succeed, the secondary servers will be polled thereafter.
DNS zone transfer
DNS zone transfer is also known as AXFR downloads. Nexus Dashboard can retrieve zone data in bulk from the DNS server using AXFR downloads. This method is convenient for large quantities of data as you no longer have to work on one query at a time.
A zone transfer requires at least one DNS zone. If you configure a forward mapping zone, then all the A and AAAA records will be fetched from a DNS server, and if you configure a reverse mapping zone, then PTR records will be fetched. When onboarding the DNS server, you must provide a list of zones from which to fetch the data. Nexus Dashboard will fetch the data from each zone configured from the DNS server.
TSIG (transaction signature) is a computer-networking protocol defined in RFC 2845. Primarily it enables the DNS to authenticate updates to a DNS database. For a secure transfer, Nexus Dashboard allows you to configure the TSIG key for a zone to initiate the transaction. Configure the zone with the TSIG key, and an associated algorithm. In the Nexus Dashboard GUI, the supported algorithms are displayed in a drop-down list.
When you delete an onboarded DNS server, all the zones will be un-configured automatically. A zone can be a forward mapping or a reverse mapping zone.
Guidelines and limitations for DNS integration
These guidelines and limitations apply to DNS integration:
-
DNS onboarding can be done at a fabric level.
-
Only one type of DNS integration method is supported in one fabric. For example, in a fabric, you cannot configure integration using DNS file uploads as well as DNS zone transfer methods.
-
Multiple DNS integration onboarding of the same type is allowed in a fabric. For example, multiple files can be onboarded to a fabric using the DNS file uploads method.
-
If you perform DNS integration onboarding for multiple fabrics, you cannot also onboard a fabric in that group.
-
When a corrupted or malformed .CSV of .JSON file is uploaded to the DNS server, Nexus Dashboard raises system anomalies. However, the connectivity status of the third-party onboarding server, remains in the initialized state and does not change to display a failed state. If the third-party onboarding server remains in the initialized state, check the system anomalies for any anomalies related to the specific integration.
-
Data from DNS servers will be polled or refreshed every 3 hours. Any changes in the mapping on the DNS server will be reflected after the next polling cycle.
Configure DNS
Follow these steps to configure DNS.
The .json or .csv file used in this task must be uploaded in a specific schema. See the following section for the formats to use.
-
Click Admin > Integrations > Add Integration.
-
Select DNS for the Integration Type.
-
In the Authentication section, select one of the following DNS types to view the corresponding fields:
-
Zone Transfer - Enter the Name, DNS Server IP, DNS Server Port, and Zones. In the Zones area, enter the value for Zone Name. Optional values that can be entered are TSIG Key Name, TSIG Key Value, TSIG Algorithm. The TSIG Algorithm dropdown menu selections are hmac-sha1, hmac-sha256, hmac-sha512, hmac-md5.
-
Query Server - Enter the Name, DNS Server IP, DNS Server Port, and Secondary Servers.
-
Mapping File - Enter the Name, Description, and Upload a JSON or CSV file.
-
-
In the Associations area, click Add Associations to associate a fabric or multiple fabrics. The Summary displays an overview of the Integration created.
-
Click Save to add the integration. The post completion success screen allows you to Add Another Integration or View Integrations.
Edit or delete a DNS configuration
Follow these steps to edit or delete a DNS configuration.
-
To edit your DNS configuration, click the Actions icon and click Edit. When you have completed editing, click Add.
-
To delete your DNS configuration, click the Actions icon and click Delete.
Formats for files used in DNS file uploads
When configuring the DNS file uploads, .json and .csv formats are supported. Use the formats provided below for the files that you upload.
The fields in a DNS file upload can have optional VRF instance or fabric name information. In a Cisco ACI fabric, the upload can also have tenant information. If you specify details for one of these options, you must specify details for all of them. In a Cisco ACI fabric, if you have a file that contains the fabric name, you must also specify the VRF instance and tenant. In an NX-OS fabric, if you have a file that contains the fabric name, specifying the VRF instance is optional.
Format .json for a Cisco ACI fabric
[
  {
        "recordType": "dnsEntry",
        "fqdn": "host1.cisco.com",
        "ips": ["1.1.0.0"],
        "vrf": "vrf-1",
        "siteName": "swmp3",
        "tenant": "tenant-1"
  },
  {
        "recordType": "dnsEntry",
        "fqdn": "host2.cisco.com",
        "ips": ["1.1.0.1"],
        "vrf": "vrf-1",
        "siteName": "swmp3",
        "tenant": "tenant-1"
 },
 {
         "recordType": "dnsEntry",
         "fqdn": "host3.cisco.com",
         "ips": ["1.1.0.2"],
 },
]
Format .json for an NX-OS fabric
[
  {
        "recordType": "dnsEntry",
        "fqdn": "host1.cisco.com",
        "ips": ["1.1.0.0"],
        "vrf": "vrf-1",
        "siteName": "swmp3",
  },
  {
        "recordType": "dnsEntry",
        "fqdn": "host2.cisco.com",
        "ips": ["1.1.0.1"],
        "vrf": "vrf-1",
        "siteName": "swmp3",
 },
 {
         "recordType": "dnsEntry",
         "fqdn": "host3.cisco.com",
         "ips": ["1.1.0.2"],
 },
]
Format .csv
recordType,fqdn,ips,siteName,tenant,vrf
dnsEntry,swmp3-leaf1.cisco.com,"101.22.33.44",swmp3,tenant-1,vrf-1
dnsEntry,swmp5-leaf1.cisco.com,"10.2.3.4,10.4.5.6,1.2.3.4",fabric2,tenant-2,vrf-2
dnsEntry,swmp4-leaf1.cisco.com, "1.1.1.1",,,
Hypershield integration
The Hypershield integration enables you to automate security policy enforcement and zone segmentation using Smart Switches. This integration leverages the DPU (Data Processing Unit) capabilities on Smart Switches to provide stateful security services at the cloud edge, replacing the need for external firewall appliances for Layer 4 segmentation.
In a multi-data-center deployment, Hypershield uses a leader and follower model. The leader manages the followers and distributes policy across the multi-cluster deployment. Each on-premises Hypershield follower runs in its own Kubernetes cluster, has its own management IP address, and onboards the Smart switches in its data center.
Create a separate integration in Nexus Dashboard for each data center and point that integration to the on-premises Hypershield follower for that data center. The follower that you associate with an integration must have front-panel network reachability to the Smart switches that it manages.
Workflow for Hypershield integration
Follow this workflow to add your Hypershield integration.
-
Add the Smart switch. For more information, see Working with Inventory in Your Nexus Dashboard LAN or IPFM Fabrics.
-
Add your Hypershield integration. For more information, see Add the Hypershield follower to Nexus Dashboard.
-
Associate External fabrics, VXLAN EVPN (iBGP and eBGP), and Routed (eBGP) fabrics with Hypershield integration. For more information, see Associate a fabric with Hypershield integration.
-
Onboard the Smart switch to your Hypershield integration. For more information, see Onboard the Smart switch.
-
View the Hypershield integration. For more information, see View Hypershield integration.
Generate an API access token on the Hypershield follower
Before you add the Hypershield follower integration in Nexus Dashboard, generate an API access token from the on-premises Hypershield follower. This procedure assumes that the Hypershield follower is already deployed and reachable.
Follow these steps to generate the token.
-
Access the on-premises Hypershield follower and generate the nd-token for follower access.
Use the
nd-tokensecret when you generate the token. Thisnd-tokenis for Nexus Dashboard to follower access.
-
Generate the Nexus Dashboard
nd-tokenfor follower access using the command:get-token.sh script: ./get-token.sh <namespace> <secret-name> [api-server-public-ip].-
Replace
<namespace>with the Kubernetes namespace where the secret resides. -
Replace
<secret-name>with the name of the service account token secret (for example,nd-token). -
Replace the
[api-server-public-ip]argument, with the follower data-plane API server IP address that is reachable by the Smart switches through their front-panel network.
Nexus Dashboard uses this IP address to construct the
smartswitch-tokenduring onboarding. If this address is incorrect, the Smart switch cannot connect to the follower. If you omit this argument, the script uses the IP address of the follower’s default route interface.
-
-
Copy the generated
nd-token.
You will use this token in step 5 of the Add the Hypershield follower to Nexus Dashboard section.
Add the Hypershield follower to Nexus Dashboard
Follow these steps to integrate the Hypershield follower with Nexus Dashboard. In a multi-data center deployment, create one integration per data center and use the follower for that data center.
-
In Nexus Dashboard, navigate to Admin > Integrations.
-
Click Add integration.
The Add Integration page displays.
-
Choose Hypershield as the integration type and click Next.
-
Enter the information for these fields.
-
In the Account Alias field, enter a name for the on-premises Hypershield follower.
-
In the Account URL (ip address:port number) field, enter the follower IP address that Nexus Dashboard can reach and the Kubernetes API server port. The standard Kubernetes API server port is 6443.
-
-
Click Next. Nexus Dashboard validates the token and follower reachability before allowing you to proceed.
-
Review the tenant information and associate the Fabric name from the drop-down list. You can also associate the fabric later by editing the integration.
-
Click Save.
Associate a fabric with Hypershield integration
You can associate a fabric with a Hypershield integration at different times during the Hypershield integration configuration. Here are different use-case scenarios for associating a fabric to a Hypershield integration.
-
Enable onboarding of Smart switches to Hypershield after you have completed a Hypershield integration.
-
Associate a fabric with Hypershield while adding a Hypershield integration.
Follow these steps to associate a Hypershield integration with External fabrics, VXLAN EVPN (iBGP and eBGP), and Routed (eBGP) fabrics.
-
Navigate to Manage > Fabrics.
-
Click the fabric name to view the fabric Overview page.
-
Open the fabric settings.
-
Click Fabric Management > Hypershield.
-
Configure the required Hypershield and HA fields.
-
Click Save.
-
Deploy the generated configuration. If you save the configuration for later deployment, navigate to the fabric page and choose Actions > Recalculate and deploy.
These are the fields that are displayed on the Hypershield page.
Field Description Enable onboarding of smart switches to Hypershield for firewall service
Enables smart switch onboarding for Hypershield firewall service. This option is supported only for NX-OS switches.
Source interface
Enter the supported loopback interface on each Smart switch that the system uses for communication with Hypershield during onboarding. You must create and deploy this interface before onboarding the Smart switches.
Enable Hypershield proxy
Enables proxy connectivity for smart switches that must reach on-premises Hypershield controllers through a proxy. Most on-premises deployments do not require this option.
Proxy Server (https)
Specifies the IPv4 address, IPv6 address, or DNS name of the HTTPS proxy server. This field is required when the Hypershield proxy is enabled.
Proxy Server Port (https)
Specifies the HTTPS proxy port number. This field is required when the Hypershield proxy is enabled.
Enable high availability configuration for smart switches
Enables HA configuration for smart switches. This option is supported only for NX-OS switches.
Use Hypershield source loopback for HA
Check this check box to reuse the Hypershield source interface as the high availability (HA) source loopback interface. When enabled, the HA source subnet pool is not required.
+ NOTE: The source interface is an onboarding prerequisite, while the HA loopback interface is an HA setting. Unless you select this option, configure these as separate interfaces. Selecting this option disables the HA source interface and HA source subnet fields.
Enable automatic high availability configuration for smart switch vPC pairs
Enables Nexus Dashboard to configure HA automatically when smart switches are paired as vPC peers. This option is supported only for NX-OS switches.
HA source interface
Specifies the loopback interface on the smart switch that is used for HA communication.
HA source subnet
Specifies the IPv4 subnet pool that Nexus Dashboard uses to allocate loopback addresses for smart switch HA communication.
HA VLAN
Specifies the VLAN that is used for smart switch HA communication. The demo uses the default VLAN 3601.
HA connectivity subnet
Specifies the IPv4 subnet pool that Nexus Dashboard uses to allocate HA connectivity addresses on the smart switches.
HA connectivity subnet granularity
Specifies the subnet prefix length that Nexus Dashboard uses for each HA connectivity allocation from the HA connectivity subnet pool.
Enable secure default VRF
Enables default virtual routing and forwarding (VRF) security during onboarding. This option is available only for Routed Fabric, such as EBGP and AI/ML routed fabrics. For other fabric types, you must manually configure the secure default VRF using the freeform configuration, if required.
View Hypershield integration
Follow these steps to view your Hypershield integration and the fabrics associated with the Hypershield integration.
Navigate to Admin > Integrations.
Here you can view the the integration status.
These are the fields that display on the Integrations page.
| Field | Description |
|---|---|
|
Name |
Specifies the name of the integration. |
|
Status |
Specifies the status of the integration. Possible states are Ok, poweredDenied, or unreachable. |
|
Type |
Specifies the type of integration. You must select Hypershield for this integration. |
|
IP/hostname |
Specifies the IP address or the hostname of the integration. |
|
Last active |
Specifies the last active date of the integration. |
|
Fabric associations |
Specifies the last active date of the integration. When you click on a fabric, Nexus Dashboard takes you to the Manage Fabrics > Overview page. |
Guidelines and limitations for Hypershield integration
These guidelines and limitations apply for Hypershield integration:
-
After you restore a fabric backup taken while a Smart switch was onboarded, you must re-onboard the switch to regenerate its Smart switch token, as the token is not included in the fabric backup.
-
The Recalculate and Deploy operation might add routed policies to Hypershield-owned high availability links between BGW switches. Because per-link selection is not supported for non-vpc HA, you must customize the
Easy_Fabric_Extn_11_1template if your deployment requires switchport-only configuration on high availability links. -
The first NX-OS version that supports Smart switches is NX-OS 10.5(3s), and this is also the minimum NX-OS version required for Hypershield integration between Smart switches and Hypershield. As a result, Nexus Dashboard can provide Hypershield integration only for Smart switches that run NX-OS 10.5(3s) or later.
Smart switch configuration behavior in brownfield deployments
Beginning with Nexus Dashboard 4.3.1, when you add one or more Smart switches that already contain Smart switch configuration to a supported fabric with the Preserve Config option enabled, Nexus Dashboard negates the existing Smart switch-related configuration, including the service system hypershield section. This behavior occurs even if Nexus Dashboard originally added the Smart switch configuration.
To continue managing the Smart switches from the Nexus Dashboard, you must recreate the required Smart switch intent in the Nexus Dashboard and deploy the configuration to the switches.
Onboard the Smart switch
Before you onboard a Smart switch, ensure you complete the following tasks.
-
Associate the fabric with a Hypershield integration: The onboarding process uses the selected integration to retrieve the Smart switch token from the Hypershield controller.
-
Configure the loopback interface: Create a supported loopback interface on each Smart switch and deploy the configuration. Verify that the configuration status is In Sync.
-
Configure fabric settings: In the fabric settings, set the Source interface to the loopback interface that you created. Do not use a default loopback value for all deployments; select an interface that is supported by the fabric.
Follow these steps to onboard the Smart switches.
-
Navigate to Manage > Fabrics.
-
Click the fabric name to view the fabric Overview page.
-
Click Inventory > Switches to view the switches listed in the table.
-
Click Actions drop-down list at the top right, Actions > Smart switches > Onboard to onboard a Smart switch.
The Onboard Smart switches to Hypershield for fabric: fabric-name page appears.
-
Choose the eligible Smart switches that you want to onboard. Only eligible Smart switches are displayed.
These fields are displayed as columns on the Onboard Smart switches to Hypershield for fabric-name Select Switches page.
Field Description Switch
Specifies the name of the Smart switch.
Hypershield tenant
Specifies current on-prem Hypershield.
Hypershield connectivity status
Specifies connectivity status. This column displays Connected, Pending, or Not connected as the available status types. The default value is Not applicable.
Hypershield integration name
Displays a drop-down list for choosing the Hypershield integration. If no integrations are associated with the fabric, the list is empty. You can create an integration directly from this page.
Model
Specifies the model number of the Smart switch.
IP address
Specifies the management IP address of the Smart switch.
Serial number
Specifies the serial number of the Smart switch.
Role
Specifies the role of the Smart switch.
-
Check the check box next to the name of the Smart switch you want to onboard.
-
Click Onboard.
-
(Optional) Click Resync all if the Configuration sync status column displays the status as Out of sync.
-
Click Deploy all.
-
Review the status on the Deployment progress page, and then click Next to complete.
Deboard the Smart switch
Before you deboard a Smart switch, ensure the following conditions are met:
-
HA Status: Verify that the switch is not part of an active high availability (HA) pair. If the HA configuration status is Paired or PairPending, unpair the Smart switch and deploy the configuration change before proceeding.
-
Network Attachments: Remove all secure network and virtual routing and forwarding (VRF) attachments from the Smart switch.
Deboarding procedure
-
On the Network attachments page, ensure all network attachments are removed.
-
If an attachment remains after you perform a multi-detach operation, complete these substeps:
-
Select the attachment.
-
Choose Actions > Quick detach.
-
Confirm the action.
-
Choose Actions > Deploy.
-
-
Wait for the configuration compliance synchronization to complete.
-
Delete the secure networks and VRFs only after all task attachments are removed.
Remove network attachments before you remove VRF attachments.
Verification
After you complete the cleanup, perform the following verification steps:
-
Verify that the fabric has no pending configurations.
-
Verify that the task VRF and network no longer appear in any DPU association.
Follow these steps to deboard the Smart switches.
-
Navigate to Manage > Fabrics.
-
Click the fabric name to view the fabric Overview page.
-
Click Inventory > Switches to view the switches listed in the table.
-
Click Actions drop-down list at the top right, Actions > Smart switches > Deboard to deboard a smart switch.
The Deboard Smart Switches to Hypershield for Fabric: fabric-name page appears.
-
Choose the switches.
-
Check the check box next to the name of the smart switch you want to deboard.
-
Click Deboard.
-
(Optional) Click Resync all if the Configuration sync status column displays the status as Out of sync.
-
Click Deploy all.
-
Review the status on the Deployment progress page, and then click Next to complete.
Reboard the Smart switch
Follow these steps to reboard the Smart switches.
-
Navigate to Manage > Fabrics.
-
Click the fabric name to view the fabric Overview page.
-
Click Inventory > Switches to view the switches listed in the table.
-
Click Actions drop-down list at the top right, Actions > Smart switches > Reboard to reboard a smart switch.
The Reboard Smart Switches to Hypershield for Fabric: fabric-name page appears.
-
Choose the switches.
-
Check the check box next to the name of the smart switch you want to reboard.
-
Click Reboard.
-
(Optional) Click Resync all if the Configuration sync status column displays the status as Out of sync.
-
Click Deploy all.
-
Review the status on the Deployment progress page, and then click Next to complete.
Pair Smart switches for high availability
High availability (HA) pairing provides stateful redundancy for Layer 4 to Layer 7 (L4-L7) flows on Smart switches. You can pair Smart switches that are already virtual port channel (vPC) peers. You can also or pair standalone, non-vPC leaf Smart switches.
HA communication requires a dedicated physical link between the Smart switches.
For non-vPC HA pairing, size the HA link based on the amount of HA traffic that your deployment must support. In VXLAN EVPN fabrics, the HA link can require 800 Gbps of bandwidth. For example, use two 400 Gbps links on N9348Y2C6D-SE1U switch or eight 100 Gbps links on N9324C-SE1U switch. If the Smart switch is deployed as an ePBR destination or an ACI PBR destination, two 100 Gbps or 25 Gbps links are sufficient.
For standalone leaf Smart switches, Nexus Dashboard must discover the physical links between the switches before you can pair them.
Before you pair smart switches, enable the high availability configuration in the fabric settings. You can also enable automatic HA pairing when vPC pairing occurs on smart switches. Configure the following parameters.
Select a supported, unused loopback interface for high availability communication.
Note: Do not use the onboarding source interface unless you have enabled Use Hypershield source loopback for HA. Additionally, do not use Loopback1024 for the HA loopback interface.
-
HA loopback interface
-
HA source subnet
-
HA VLAN
-
HA peer link subnet
-
HA peer link subnet granularity
-
Ensure that the HA loopback interface that you select in fabric settings is not already in use on the Smart switches. If you use a loopback that is already in use, for instance Loopback1023 for HA pairing and Loopback1023 is preconfigured for another purpose, the HA pairing configuration can fail.
-
HA pairing is not supported for border gateway role Smart switches in Nexus Dashboard 4.3.1. This restriction applies to both vPC and non-vPC configurations.
HA pair for vPC
For vPC-based high availability (HA) pairing, the Smart switches must have a direct physical vPC peer link. Nexus Dashboard uses the reserved HA VLAN, VLAN 3601 by default, on an SVI over this physical link for HA communication.
The vPC must be physical. Although vPCs created over a virtual link might appear in the selection list, they are not supported for HA pairing.
Follow these steps to perform HA pair for vPC.
-
Choose Manage > Fabrics.
-
Click the fabric name to view the fabric Overview page.
-
Click Inventory > vPC pairs > Discovered.
-
Click Actions drop-down list at the top right, Actions > Smart switches > HA pair.
-
Check the switches check box and click Next.
-
Click Pair.
-
Click Deploy now.
-
Click Done to complete.
HA pair for non-vPC
Follow these steps to perform HA pair for non-vPC.
-
Choose Manage > Fabrics.
-
Click the fabric name to view the fabric Overview page.
-
Click Inventory > Smart switches > HA pairs and ensure that switches are present in the fabric.
-
Click Actions drop-down list at the top right, Actions > Smart switches > HA pair.
-
Check the switch check box for the first switch and click Next.
-
Check the switch check box for the second switch and click Pair.
-
Click Deploy now.
-
Click Done to complete.
HA unpair for vPC
Follow these steps to perform HA unpair for vPC.
-
Choose Manage > Fabrics.
-
Click the fabric name to view the fabric Overview page.
-
Click Inventory > vPC pairs > Discovered.
-
Click Actions drop-down list at the top right, Actions > Smart switches > HA unpair.
-
Check the switches check box and click Next.
-
Click Unpair.
-
Click Deploy now.
-
Click Done to complete.
HA unpair for non-vPC
Follow these steps to perform HA unpair for non-vPC.
-
Choose Manage > Fabrics.
-
Click the fabric name to view the fabric Overview page.
-
Click Inventory > Smart switches > HA pairs and ensure that switches are present in the fabric.
-
Click Actions drop-down list at the top right, Actions > Smart switches > HA unpair.
-
Check the switches check box and click Next.
-
Click Unpair.
-
Click Deploy now.
-
Click Done to complete.
DPUs
Data Processing Units (DPUs) are integral to a Smart switch and help transform it into a multifunctional, service-hosting device. DPUs are specialized hardware components designed to offload and accelerate data processing tasks traditionally handled by CPUs or NPUs. DPUs are equipped with programmable data planes, memory, specialized acceleration engines, and embedded CPUs for control and management.
A Smart switch integrates with DPUs and networking Application-Specific Integrated Circuits (ASICs) to deliver these advanced services:
-
Stateful firewall — Distributed stateful firewall capabilities for enhanced security.
-
Encryption services — Support for IPsec encryption and other security protocols. Telemetry and analytics — Offloading telemetry and flow data collection for better network visibility.
-
Segmentation and scalability — Enabling stateful segmentation and seamless scaling of services.
In Nexus Dashboard, you can view and download the Data Processing Unit (DPU) information from your Hypershield fabric’s Fabric > Inventory page. You can also view the DPU information in the Nexus Dashboard Manage > Inventory > Switch Overview > Hardware page.
Not all switch overview pages in Nexus Dashboard display the DPU information. You must have a Smart switch configured on your fabric to view information on the DPUs.
View and download the inventory information for DPUs
Follow these steps to view and download the inventory information for DPUs.
-
Click Manage > Fabric.
-
Click a fabric name to open the fabric Overview page.
-
Click Inventory > Smart Switches > DPUs.
The DPUs subtab displays information in a table format.
-
Click the download icon to download the DPU information in a CSV file format.
-
Enter filter criteria in Filter by Attributes to sort the information based on the fields presented in the table.
You can view these fields for the DPUs.
|
Column |
Description |
|
Switch |
Displays the smart switch’s name with a DPU suffix in the switch name. For example, |
|
Module number |
Displays the model number. |
|
Module model |
Displays the module’s model information. For example, |
|
Software version |
Displays the supported software version for the DPUs. |
|
Hardware version |
Displays the supported hardware version for the DPUs. |
|
Serial number |
Displays the serial number on the DPU. |
|
Operation Status |
Displays the operational status of the module. Green: The module is operational with no active major or critical alarms. |
Monitor DPU statistics
Follow these steps to monitor DPU statistics.
-
Click Manage > Fabric.
-
Click a fabric name to open the fabric Overview page.
-
Click Inventory > Smart Switches > DPUs.
The DPUs subtab displays information in a table format.
-
In the DPUs table, click on a number in the Module number column.
The Details for DPU number page displays the Overview, Trends and statistics, and Anomalies tabs.
-
Click Overview to view information specific to a DPU.
-
The General section displays the Module number, Type, Model name, Firmware version, and Operational status.
-
The Interface section displays the interface (logical) Name, Operational status, Transmit byte, Type, and Speed.
-
The Association to DPU section displays the Network object, Type (VRFs), Name, Operational status, Redirect status, and VLAN.
You can verify traffic redirection status in the Redirect status column, the redirection status is displayed as Enabled or Disabled. Traffic is not redirected if the Redirect status column shows a Disabled value.
-
-
Click Trends and statistics to view real-time graphs for the selected DPU interface. The graphs display metrics such as traffic receive (Rx) and transmit (Tx) bytes, errors, bandwidth utilization, bandwidth rate, and temperature. These graphs update every 10 seconds when real-time data is available.
-
Click Anomalies to view any anomalies specific to a DPU.
Create and assign a VRF to a DPU
Before you begin, review VRF configuration details in the "Working with VRFs" section in Working with Segmentation and Security for your Nexus Dashboard Enhanced Classic LAN Fabric.
Nexus Dashboard allows you to create VRF instances with stateful filtering that DPUs perform on smart switches. To redirect VRF traffic to a DPU, enable Secure VRF.
When you configure a VRF, you can assign it dynamically or statically to a DPU. If you configure a VRF statically, you can pick and choose any DPUs.
Follow these steps to create and assign a VRF to a DPU.
-
Navigate to your External and Inter-Fabric Connectivity fabric with DPU. + Manage > Fabrics
-
Click the fabric name to view the fabric Overview page and click Segmentation and security.
-
(Optional) Click the Actions drop-down list in the VRF area and choose Create to create a VRF.
-
(Optional) On the Create VRF page enter the following information:
-
VRF name — Enter a name for your VRF.
-
VRF description — (Optional) Enter a description for your VRF.
-
-
(Optional) Click Create to create your VRF.
-
In the VRF name column, click the VRF that you want to attach to the DPU.
The VRF Overview page displays.
-
Click VRF Attachments and check the check box for the VRF that you want to attach to the DPU.
-
Choose Actions > Edit to launch the Edit VRF page. Toggle the Attach option to attach the VRF to a DPU.
-
Choose a static or dynamic DPU.
-
Choose any DPU (for example, DPU-1 or DPU-2) listed in the drop-down to allow static assignment of a DPU to the VRF.
-
Choose the Dynamic option in the drop-down list to allow dynamic assignment of a DPU to the VRF.
-
-
Click Save.
-
Choose Action > Deploy to deploy the VRF configuration.
Follow these steps to deploy the configuration and verify the Data Processing Unit (DPU) assignment.
-
When the deployment finishes, click Close.
-
To view the association, choose Manage > Fabrics, select the fabric, and choose Inventory > Smart switches > DPUs.
-
Verify the following on the VRFs page:
-
The configuration synchronization status is Deployed.
-
The VRF association is visible for the DPU.
-
DPU affinity verification
-
Dynamic affinity: The attachment table continues to display Dynamic. To identify the module selected at runtime, open the DPU details page.
-
Display format: On physical build tests, the DPU association might display the VRF name in lowercase; this is expected behavior and does not indicate an attachment failure.
Create and assign a network attachment to a DPU
When you configure a network attachment for a smart switch, enable Secure Network to redirect traffic to a DPU.
Follow these steps to create a network and assign the network attachment to a DPU.
-
Navigate to your External and Inter-Fabric Connectivity fabric with DPU. + Manage > Fabrics
-
Click the fabric name to view the fabric Overview page and click Segmentation and security.
-
(Optional) Click the Actions drop-down list in the network area and choose Create to create a network.
-
(Optional) On the Create Network page enter the following information:
-
Network name — Enter a name for your network.
-
Network mode — Enter the mode of your network.
-
VRF name — Enter a name for your VRF.
-
Network ID — Enter the network ID.
-
-
(Optional) Click Create to create your network.
-
In the Network name column, click the network that you want to attach to the DPU. + The network Overview page displays.
-
Click the Network attachments and check the check box for the network that you want to attach to the DPU.
-
Choose Actions > Edit to launch the Edit Network Attachment page. Toggle the Attach option to attach the network to a DPU.
-
Choose a static or dynamic DPU.
-
Choose any DPU (for example, DPU-1 or DPU-2) listed in the drop-down to allow static assignment of a DPU to the VRF.
-
Choose the Dynamic option in the drop-down list to allow dynamic assignment of a DPU to the VRF.
-
-
Click Save.
-
Choose Action > Deploy to deploy the network configuration.
You can navigate to Manage > Inventory > DPUs to view the network association with DPUs in Nexus Dashboard UI.
Slurm integration
Enhanced analytics is available for workloads in AI routed and VXLAN fabrics within Nexus Dashboard. This enhancement provides end-to-end visibility and actionable insights for AI infrastructures by integrating job completion and GPU statistics with network statistics, providing a detailed overview of network topologies along with GPUs.
In order to view job details for AI fabrics, you must first integrate Slurm (Simple Linux Utility for Resource Management), which is an open-source job scheduler used to manage resources on high-performance computing clusters.
Add Slurm integration
Follow these steps to add the Slurm integration.
-
Navigate to Admin > Integrations > Add integration.
-
In the Integration type step, choose Slurm, then click Next.
-
Complete these fields in the Authentication step.
-
Enter the name of the Slurm integration.
-
Enter the Slurm host name or IP address.
-
Enter the username and password to authenticate the Slurm integration.
-
Click Next.
-
-
Review the information in the Summary step, then click Save.
-
To add another Slurm integration, click Add another integration.
-
To view Slurm integration details, click View integrations.
-
In the Integrations page, the status for the Slurm integration will display as Initialize for a short period of time, and will change to Active when the integration is successfully completed. In addition, Nexus Dashboard determines which servers are connected to the Slurm cluster, then locates the fabric that contains those servers and displays that fabric in the Derived fabrics column.
Using enhanced analytics for AI fabrics
After you have added the Slurm integration, you can now use enhanced analytics for AI fabrics using these procedures:
VMware vCenter integration
Integrating VMware vCenter server allows Nexus Dashboard to collect data and metrics of the virtual machines and hosts monitored by VMware vCenter, and then correlate the collected information with the data collected from the Cisco ACI or Cisco NX-OS fabric.
Data collected from VMware vCenter includes
-
Virtual machine data
-
Network data
-
Virtual machine NIC data
-
Host data
-
Datastore data
-
Standard switch information
-
DVS information
Data is collected from vCenter every 60 minutes by default. Follow these steps to modify the settings.
-
Navigate to Admin > System Settings.
-
Click Fabric management.
-
In the Advanced settings area, click VMM.
-
Change the setting in the Background Resync Timer in minutes field, then click Save.
Prerequisites for VMware vCenter Server integration
-
You have installed VMware vCenter 6.5 and later.
-
You have read-only privileges for VMware vCenter.
-
Network reachability.
-
For NXOS or ACI fabrics, ensure that the ESXi hosts are directly connected to the front panel ports of the leaf switches. Nexus Dashboard must discover this physical connectivity to update the VM inventory list.
-
Ensure that you enable either LLDP or CDP to accurately discover the connection points of hosts and to determine the inventory. Therefore, the DVS should be configured with one of these protocols, and the corresponding protocol must also be configured on the switch ports facing the hosts.
-
A successful VMware vCenter connection indicates only that Nexus Dashboard can communicate with the VMware vCenter server. To discover and populate the virtual machine inventory, Nexus Dashboard must discover the direct physical connectivity between the ESXi hosts and the front panel ports of the managed leaf switches.
Guidelines and limitations for VMware vCenter Server integration
-
For a single node vND deployment, support includes one VMware vCenter server and up to 1000 VMs.
-
For greenfield or brownfield VXLAN EVPN fabric management to Nexus Dashboard, support includes 24 VMware vCenter servers and up to 5500 VMs.
-
Number of vNIC hosts supported for VMware vCenter integration is 10,000.
-
Nexus Dashboard supports multiple vCenters per fabric.
-
Ensure that you resync vCenter clusters after you use backup or restore operation. To synchronize individual vCenter cluster, click the ellipsis (…) in the last column of the Integrations table to choose the Rediscover option.
Supported deployment scenarios
Nexus Dashboard supports the following VMware vCenter deployment scenarios.
-
NX-OS fabrics — Direct connection to server ports.
-
ACI fabrics — Direct connection to server ports.
-
UCS domains — NX-OS fabric connected to a UCS Fabric Interconnect (FI), which is then connected to the UCS servers (NX-OS fabric <> UCS-FI <> UCS server).
Add VMware vCenter server integration
Follow these steps to add VMware vCenter Server integration.
-
Click Admin > Integrations > Add integration.
-
Choose vCenter server for the Integration type, then click Next.
-
Configure these fields in the Authentication page.
Field Description vCenter server name
Enter the vCenter server name.
vCenter server IP address or DNS name
Enter the vCenter server IP address or domain name.
Username
Enter the vCenter username and password.
Password
-
Click Next.
The Summary page displays an overview of the integration.
-
Verify the information in the Summary page, then click Save.
-
Click Save to add the integration.
The success screen displays and allows you to Add Another Integration or View.
vCenter VM adapter state overview
To display an Overview page for a vCenter integration:
-
Navigate to the Integrations page.
Admin > Integrations
-
Locate the integration that shows vCenter in the Type column in the Integrations page.
-
Click on the entry in the Name column for that vCenter integration.
The Overview page for that vCenter integration appears.
The following table describes the fields and description in the page.
| Field | Description |
|---|---|
|
VM Name |
Specifies the name of the virtual machine. |
|
IP Address |
Specifies the IP address of the virtual machine. |
|
MAC Address |
Specifies the MAC address of the virtual machine. |
|
VLAN |
Specifies the VLAN associated with the virtual machine. |
|
Network |
Specifies the network associated with the virtual machine. |
|
Network adapter |
Specifies the state of the network adapter. |
|
VM adapter state |
Specifies the state of the VM adapter. |
|
Switch |
Specifies the switch connected to the virtual machine. |
|
Switch interface |
Specifies the switch interface connected to virtual machine. |
|
Compute host |
Displays the IP address of the compute host. |
|
Physical NIC |
Specifies the physical network interface card (NIC) on the host that connects to the network adapter of the VM. |
|
ToR name |
Specifies the name of the ToR switch that the VM’s network traffic is routed through. |
|
ToR interface |
Specifies the interface on the ToR switch that connects to the physical NIC or network path for the VM. |
|
ToR PO |
Specifies the port channel (PO) on the ToR switch aggregating multiple physical links for redundancy and increased bandwidth to the VM. |
Note that this table provides a complete inventory of the physical network path for network connections of a VM. The ToR name, ToR interface, and ToR PO columns display values only when a ToR switch is present in the network path.
View VM details
The VM details page displays specific operational, configuration, and inventory details for virtual machines that an integrated vCenter manages.
Follow these steps to view the VM details.
-
Navigate to the Integrations page.
Go to Admin > Integrations.
-
Click the name of the vCenter server integration.
The vCenter VM overview page displays.
-
In the VM inventory list, click the VM Name of the specific virtual machine you wish to inspect.
The VM details page displays General details and Network adapter sections.
You can view the following information in General details section.
| Field | Description |
|---|---|
|
State |
Specifies the power state of the VM (for example, connected or disconnected). |
|
Status |
Displays the health status of the VM as reported by vCenter. |
|
Hostname |
Displays the hostname assigned to the guest operating system. |
|
Guest OS |
Displays the operating system type and architecture running on the VM. |
|
vCenter |
Displays the IP address of the vCenter server managing the VM. |
|
Datacenter |
Displays the name of the vCenter datacenter where the VM resides. |
|
Cluster |
Displays the name of the vCenter cluster associated with the VM. |
|
Compute host |
Displays the IP address of the ESXi host where the VM is currently running. |
|
CPU |
Specifies current CPU usage of the VM. |
|
Memory |
Specifies the Active Guest Memory currently used by the VM.
This value represents the memory the guest operating system currently uses. Nexus Dashboard normalizes this value across integrations. |
|
Disk |
Displays the total disk storage capacity allocated to the VM. |
You can view the following information in Network adapter section.
| Field | Description |
|---|---|
|
IP Address |
Displays the IP address assigned to the specific network adapter. |
|
MAC address |
Displays the hardware address of the network adapter. |
|
Network |
Displays the name of the network to which the adapter connects. |
|
Switch |
Displays the name of the fabric switch(es) connected to the host (for example, dev2-leaf1, dev2-leaf2). |
|
Switch Interface |
Displays the specific physical interface on the switch (for example, Ethernet 1/3). |
|
PG/DVS PG |
Displays the Port Group (PG) or Distributed Virtual Switch(DVS) PG name. |
Kubernetes integration
Kubernetes is an open-source platform that automates the deployment, scaling, and management of applications packaged as lightweight and portable units.
Follow these steps to enable LLDP on Nexus Dashboard:
-
Navigate to Fabric management page.
Go to Admin > System Settings > Fabric management.
-
In the Advanced settings area, click the Discovery tab.
-
Check the enable / disable neighbor link discovery using LLDP check box.
LLDP is applicable for Bare-metal Kubernetes clusters only.
-
Ensure that the LLDP feature is enabled on all fabric switches for which the cluster node is connected. (switches may be spine or leaf switches).
-
On the Kubernetes cluster, ensure that LLDP and SNMP services are enabled on all Bare-metal nodes.
-
If the Cisco UCS is using an Intel NIC, LLDP neighborship fails to establish due to FW-LLDP.
To resolve this, for selected devices based on the Intel® Ethernet Controller (for example, 800 and 700 Series), disable the LLDP agent that runs in the firmware. Use the following command to disable the LLDP agent.
echo 'lldp stop' > /sys/kernel/debug/i40e/<bus.dev.fn>/command
Execute the following command to find the bus.dev.fn for a given interface, and choose the ID associated with the interface. The ID is highlighted in the sample output.
[ucs1-lnx1]# dmesg | grep enp6s0 [ 12.609679] IPv6: ADDRCONF(NETDEV_UP): enp6s0: link is not ready [ 12.612287] enic 0000:06:00.0 enp6s0: Link UP [ 12.612646] IPv6: ADDRCONF(NETDEV_UP): enp6s0: link is not ready [ 12.612665] IPv6: ADDRCONF(NETDEV_CHANGE): enp6s0: link becomes ready[ucs1-lnx1]#
LLDP is enabled on the fabric switches that connect to the bare-metal cluster nodes. The nodes can also connect to the border gateway switches. If you discover the fabric (to which the Kubernetes cluster connects) after you discover the cluster, you must rediscover the cluster to display the topology correctly.
If the Bare-metal-based Kubernetes cluster is discovered after configuring LLDP, you must rediscover the Baremetal cluster to display the topology correctly.
To discover or visualize a VM-based Kubernetes cluster, you must first onboard the vCenter cluster that manages the VMs hosting the Kubernetes cluster. If you do not complete this step, Kubernetes cluster discovery fails.
Configure routes
By default, Nexus Dashboard uses the data interface to connect to the Kubernetes API endpoint. To use the management interface instead, you need to configure an alternate route on Nexus Dashboard.
Follow these steps to configure routes on Nexus Dashboard.
-
Navigate to Admin > System Settings.
-
In the General tab, under Routes, click Edit.
The Routes page displays.
-
Click Add management network routes, enter the required IP addresses, and click the check icon.
-
Click Save.
Add a Kubernetes cluster
Follow these steps to add a Kubernetes cluster.
Ensure that the routes are configured to connect to the Kubernetes cluster through the appropriate network interface. For more information, see Configure routes.
-
Navigate to Admin > Integrations.
-
If there are no existing integrations, click Add integration.
The Add integration page displays.
-
Under Integration type, choose Kubernetes and click Next.
-
In the Cluster name field, provide a unique name for the cluster.
-
In the API server name/address field, provide a hostname or IP address of the API server.
-
In the API server port number field, enter the port number used by the API server.
-
In the Username field, provide a username that Nexus Dashboard uses for authentication.
-
Click the Fetch CSR button to obtain a certificate signing request (CSR) from the Kubernetes visualizer application. This option remains disabled until you provide a valid cluster IP address and username.
Click the Fetch CSR button only if you do not have the SSL certificate for the Nexus Dashboard Kubernetes client.
Click Download CSR to download the <username>.csr file in your directory. The username is the one provided in step 7.
The CSR file name must adhere to the naming convention <username>.csr.
-
Login to the Kubernetes cluster controller node.
-
Copy the
genk8clientcert.shand<username>.csrfiles from the Nexus Dashboard server location to the Kubernetes Cluster controller node. -
Execute the genk8sclientcert.sh script file to generate the CSR for the user name using this command.
(k8s-root)# ./genk8sclientcert.sh kubereader x.x.x.x where,
-
kubereader is the username of the API Client to connect to Kubernetes. (as defined in Step 7).
-
x.x.x.x is the IP address of the Nexus Dashboard server.
The script genk8sclientcert.sh generates these files.
-
k8s_cluster_ca.crt
-
username_IP.crt
For example: kubereader_x.x.x.x.crt (where, kubereader is the username, and x.x.x.x is the Nexus Dashboard IP address).
-
-
Use the cat command to extract the certificate from these 2 files.
(k8s-root)# cat kubereader_10.x.x.x.crt (k8s-root)# cat k8s_cluster_ca.crt -
Copy the content in the kubereader_x.x.x.x.crt to Client certificate field.
Ensure that all the characters are copied correctly with no spaces.
-
Copy the content in the k8s_cluster_ca.crt to Cluster certificate field.
Ensure that all the characters are copied correctly with no spaces.
-
Click Next.
You can view the summary of details that you added.
-
Click Add.
You can view the Kubernetes cluster that you added in the Integrations page.
View a Kubernetes cluster
Follow these steps to view the Kubernetes visualizer details.
-
Navigate to Admin > Integrations.
The Integrations page displays.
-
In the Integrations page, click the Kubernetes cluster that you added.
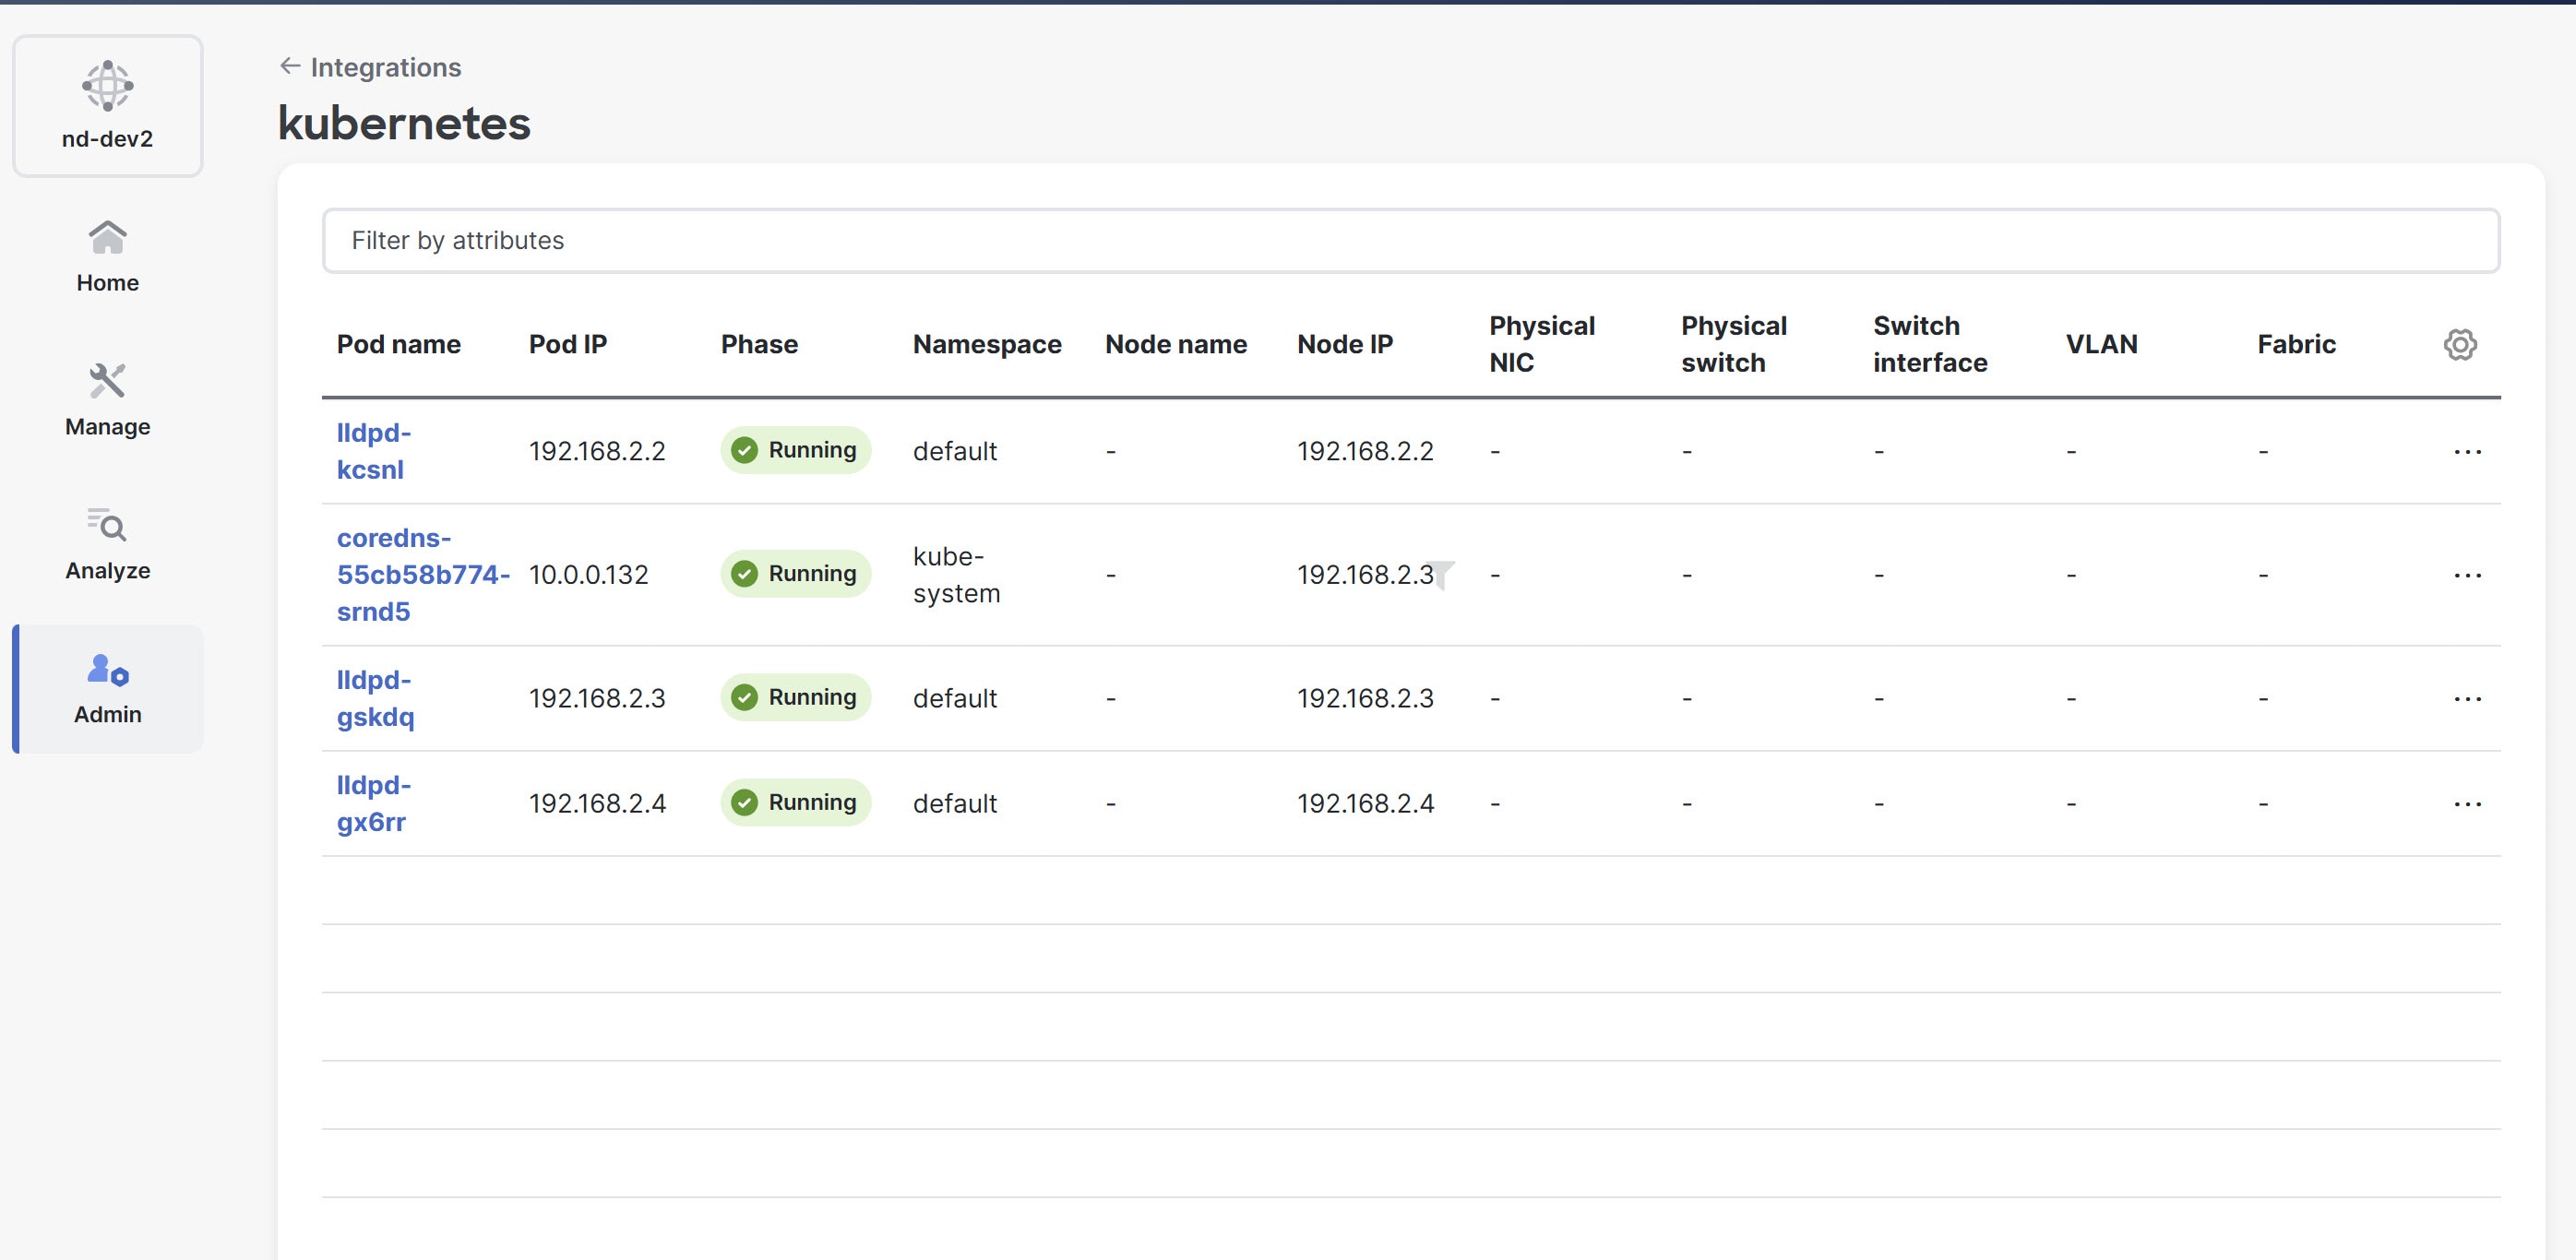
The Cluster page opens and displays details about Kubernetes Pods and Kubernetes Nodes .
Edit a Kubernetes cluster
Follow these steps to edit a Kubernetes cluster.
-
Choose the appropriate cluster.
-
From the Actions drop-down list, choose Edit Instance.
-
Click Edit to modify the cluster settings.
You can also update the cluster and the client certificates.
For the Kubernetes cluster in unmanaged status, you cannot view the topology and the Kubernetes cluster details in the Integrations page.
-
Click Save to save the changes or click Cancel to discard the changes.
Delete a Kubernetes cluster
Follow these steps to delete a Kubernetes cluster.
-
Choose the appropriate cluster.
-
From the Actions drop-down list, choose Delete Instance(s).
-
Click Confirm to delete the cluster.
All the data is deleted if you delete the cluster. The cluster is removed from the Topology view as well.
Rediscover a Kubernetes cluster
Follow these steps to rediscover a Kubernetes cluster.
-
Choose the appropriate cluster.
-
From the Actions drop-down list, choose Rediscover Instance(s).
A confirmation message appears to verify your action. Click Confirm to proceed with rediscovery.
Renew certificate for an Kubernetes cluster
If the Integration summary page indicates that the certificate for the integrated Kubernetes cluster has expired, delete the existing Kubernetes integration. Then, follow the steps outlined in Add a Kubernetes cluster again to re-register the cluster. Note that the certificate validity period is ultimately determined by the signer on the cluster side. This approach ensures that the cluster is properly re-registered with valid certificates.
Guidelines and limitations
Ensure that you resync Kubernetes clusters after you use backup or restore operation. To synchronize individual Kubernetes cluster, click the ellipsis (…) in the last column of the Integrations table to choose the Rediscover option.
OpenShift integration
OpenShift is a Kubernetes-based platform from Red Hat that includes tools for developing and running applications. OpenShift integration in Nexus Dashboard focuses on showing OpenShift resources and their placement within the network. OpenShift will now appear as a new integration option under Virtual machine and container workload managers similar to Kubernetes. You can add an existing OpenShift cluster to Nexus Dashboard through this integration. Once added, Nexus Dashboard regularly fetches data from the OpenShift cluster to display information about pods, nodes, and their connections. For network discovery, Nexus Dashboard assumes LLDP/CDP data is available. OpenShift integration provides the capability to visualize connectivity through topology and fabric management interfaces.
Prerequisites for OpenShift integration
-
All OpenShift nodes must be connected to one of the fabrics managed by Nexus Dashboard.
-
The OpenShift cluster API endpoint must be reachable by Nexus Dashboard data interface. Alternatively, the OpenShift cluster API endpoint must be reachable by Nexus Dashboard management interface and the specific routes must be configured from Admin > System Settings > General > Routes.
Prerequisites for OpenShift bare-metal nodes
-
Enable neighbor discovery using LLDP in Nexus Dashboard.
Follow these steps to enable neighbor discovery using LLDP.
-
Enable advanced settings for TAC support.
-
Navigate to Admin > System Settings.
-
Click the General tab.
-
Under Advanced settings, click Edit.
The Advanced settings page displays
-
Check the Display advanced settings and options for TAC support check box.
-
Click Save.
-
-
Enable LLDP neighbor discovery.
-
Navigate to Admin > System Settings.
-
Click the Fabric management tab.
-
Under Advanced settings, click the Discovery tab.
-
Check the enable/disable neighbor link discovery using LLDP check box.
-
Click Save.
-
-
The OpenShift cluster must run an agent to send LLDP packets. You must configure the system name in the agent to match the node name.
Example configuration for LLDP daemonSet.
This configuration creates a daemonSet that deploys the lldpd container on each node. The container runs with the necessary privileges and mounts the /etc/os-release file from the host.
apiVersion: apps/v1
kind: DaemonSet
metadata:
  name: "lldpd"
spec:
  selector:
    matchLabels:
      name: lldpd
  template:
    metadata:
      labels:
        name: lldpd
    spec:
      tolerations:
        - key: node-role.kubernetes.io/control-plane
          operator: Exists
          effect: NoSchedule
        - key: node-role.kubernetes.io/master
          operator: Exists
          effect: NoSchedule
      containers:
        - name: lldpd
          image: ghcr.io/lldpd/lldpd
          command: ["lldpd"]
          args: ["-d"]
          imagePullPolicy: IfNotPresent
          securityContext:
            capabilities:
              drop: ["ALL"]
              add: ["NET_ADMIN", "NET_RAW"]
            privileged: true
          volumeMounts:
            - name: os-release
              mountPath: /etc/os-release
      volumes:
        - name: os-release
          hostPath:
            path: /etc/os-release
      hostNetwork: true
Prerequisites for OpenShift virtualizer nodes
-
The OpenShift nodes should be running on hypervisors managed by a vCenter integrated with Nexus Dashboard .
-
Integration with the vCenter must be done before the OpenShift integration.
Add an OpenShift cluster
Follow these steps to add an OpenShift cluster.
-
Navigate to Admin > Integrations.
-
If there are no existing integrations, click Add integration.
The Add integration page displays.
-
Under Integration type, choose OpenShift and click Next.
-
In the Cluster name field, provide a unique name for the cluster.
-
In the API server name/address field, provide a hostname or IP address of the API server.
-
Optional: If the TLS server name differs from the API server name, provide the TLS server name in the TLS server name field to ensure secure communication.
The following combinations of API server name/address and TLS server name values are supported.
Fields OpenShift API Server Reachability from Nexus Dashboard API server name/address
TLS server name
Direct
Through HTTP Proxy
FQDN
Empty
Supported if Nexus Dashboard can resolve the FQDN
Supported if
-
FQDN is added to the SAN of the server certificate (if not present already).
-
Nexus Dashboard can resolve the FQDN.
IP Address
Valid TLS server name
Supported
Supported (not required to add to SAN, no FQDN resolution needed).
FQDN
Valid TLS server name
Supported
Supported (not required to add to SAN, but FQDN resolution is needed).
IP Address
Empty
Not supported
Not supported
-
-
In the API server port number field, enter the port number used by the API server.
The default port number for the OpenShift API server is 6443.
-
In the Username field, provide your username for authentication.
-
Click the Fetch CSR button to obtain a certificate signing request (CSR) from the OpenShift visualizer application. This option remains disabled until you provide a valid cluster IP address and username.
Nexus Dashboard saves the certificate details in the <username>.csr file in your directory.
-
Click the Fetch CSR button only if you do not have the SSL certificate for the Nexus Dashboard OpenShift client.
If you already have a valid client certificate, you need not fetch the CSR. You can use the
base64encoded client certificate and the cluster certificate in the Cluster certificate and Client certificate fields respectively.
-
Click the Get CertGen tool button to download the script file, genclientcert.sh, which generates the client certificate and retrieves the API server certificate.
You need OpenShift cluster administrator privileges to generate client certificates. Ensure that the previously obtained <username>.csr file is placed in the same directory as the script file.
Execute the script file on any server configured with the appropriate kubeconfig to access the OpenShift API server using this command.
(osp-root)# ./genclientcert.sh Ospreader 10.x.x.x where,
-
Ospreader is the username of the API Client to connect to OpenShift. (as defined in Step 4)
-
10.x.x.x is the IP address of the Nexus Dashboard server.
These are the two new certificates generated in the same location.
-
k8s_cluster_ca.crt
-
username_ND_IP.crt
For example: Ospreader_10.x.x.x.crt (where, Ospreader is the username, and 10.x.x.x is the Nexus Dashboard IP address).
-
-
Copy the content in the <username>_<ND_IP>.crt to Client certificate field.
Ensure that all the characters are copied correctly with no spaces.
-
Copy the content in the k8s_cluster_ca.crt to Cluster certificate field.
Ensure that all the characters are copied correctly with no spaces.
-
Click Next.
You can view the summary of details that you added.
-
Click Save.
You can view the OpenShift cluster that you added in the Integrations page. For more information, see View an OpenShift cluster.
Edit an OpenShift cluster
Follow these steps to edit an OpenShift cluster.
-
Choose the appropriate cluster.
-
From the Actions drop-down list, choose Edit Instance.
-
Click Edit to modify the cluster settings.
You can also update the cluster and the client certificates.
-
Click Save to save the changes or click Cancel to discard the changes.
Delete an OpenShift cluster
Follow these steps to delete an OpenShift cluster.
-
Choose the appropriate cluster.
-
From the Actions drop-down list, choose Delete Instance(s).
-
Click Confirm to delete the cluster.
Rediscover an OpenShift cluster
Follow these steps to rediscover an OpenShift cluster in case the discovery failed or you need to update the information to connect to the OpenShift cluster.
-
Choose the appropriate cluster.
-
From the Actions drop-down list, choose Rediscover Instance(s).
A confirmation message appears to verify your action. Click Confirm to proceed with rediscovery.
Renew certificate for an OpenShift cluster
If the integrated OpenShift cluster shows certificate expired in integration-summary page, then delete the existing OpenShift integration and perform the steps mentioned in Add an OpenShift cluster section again to re-register the cluster. Certificate validity duration is ultimately controlled by the signer on the cluster side.
View an OpenShift cluster
Follow these steps to view an OpenShift cluster.
-
Navigate to Admin > Integrations.
The Integrations page displays.
-
In the Integrations page, click the OpenShift cluster that you added.
-
The Cluster page opens and displays details about OpenShift Pods, OpenShift VMs, and OpenShift Nodes.
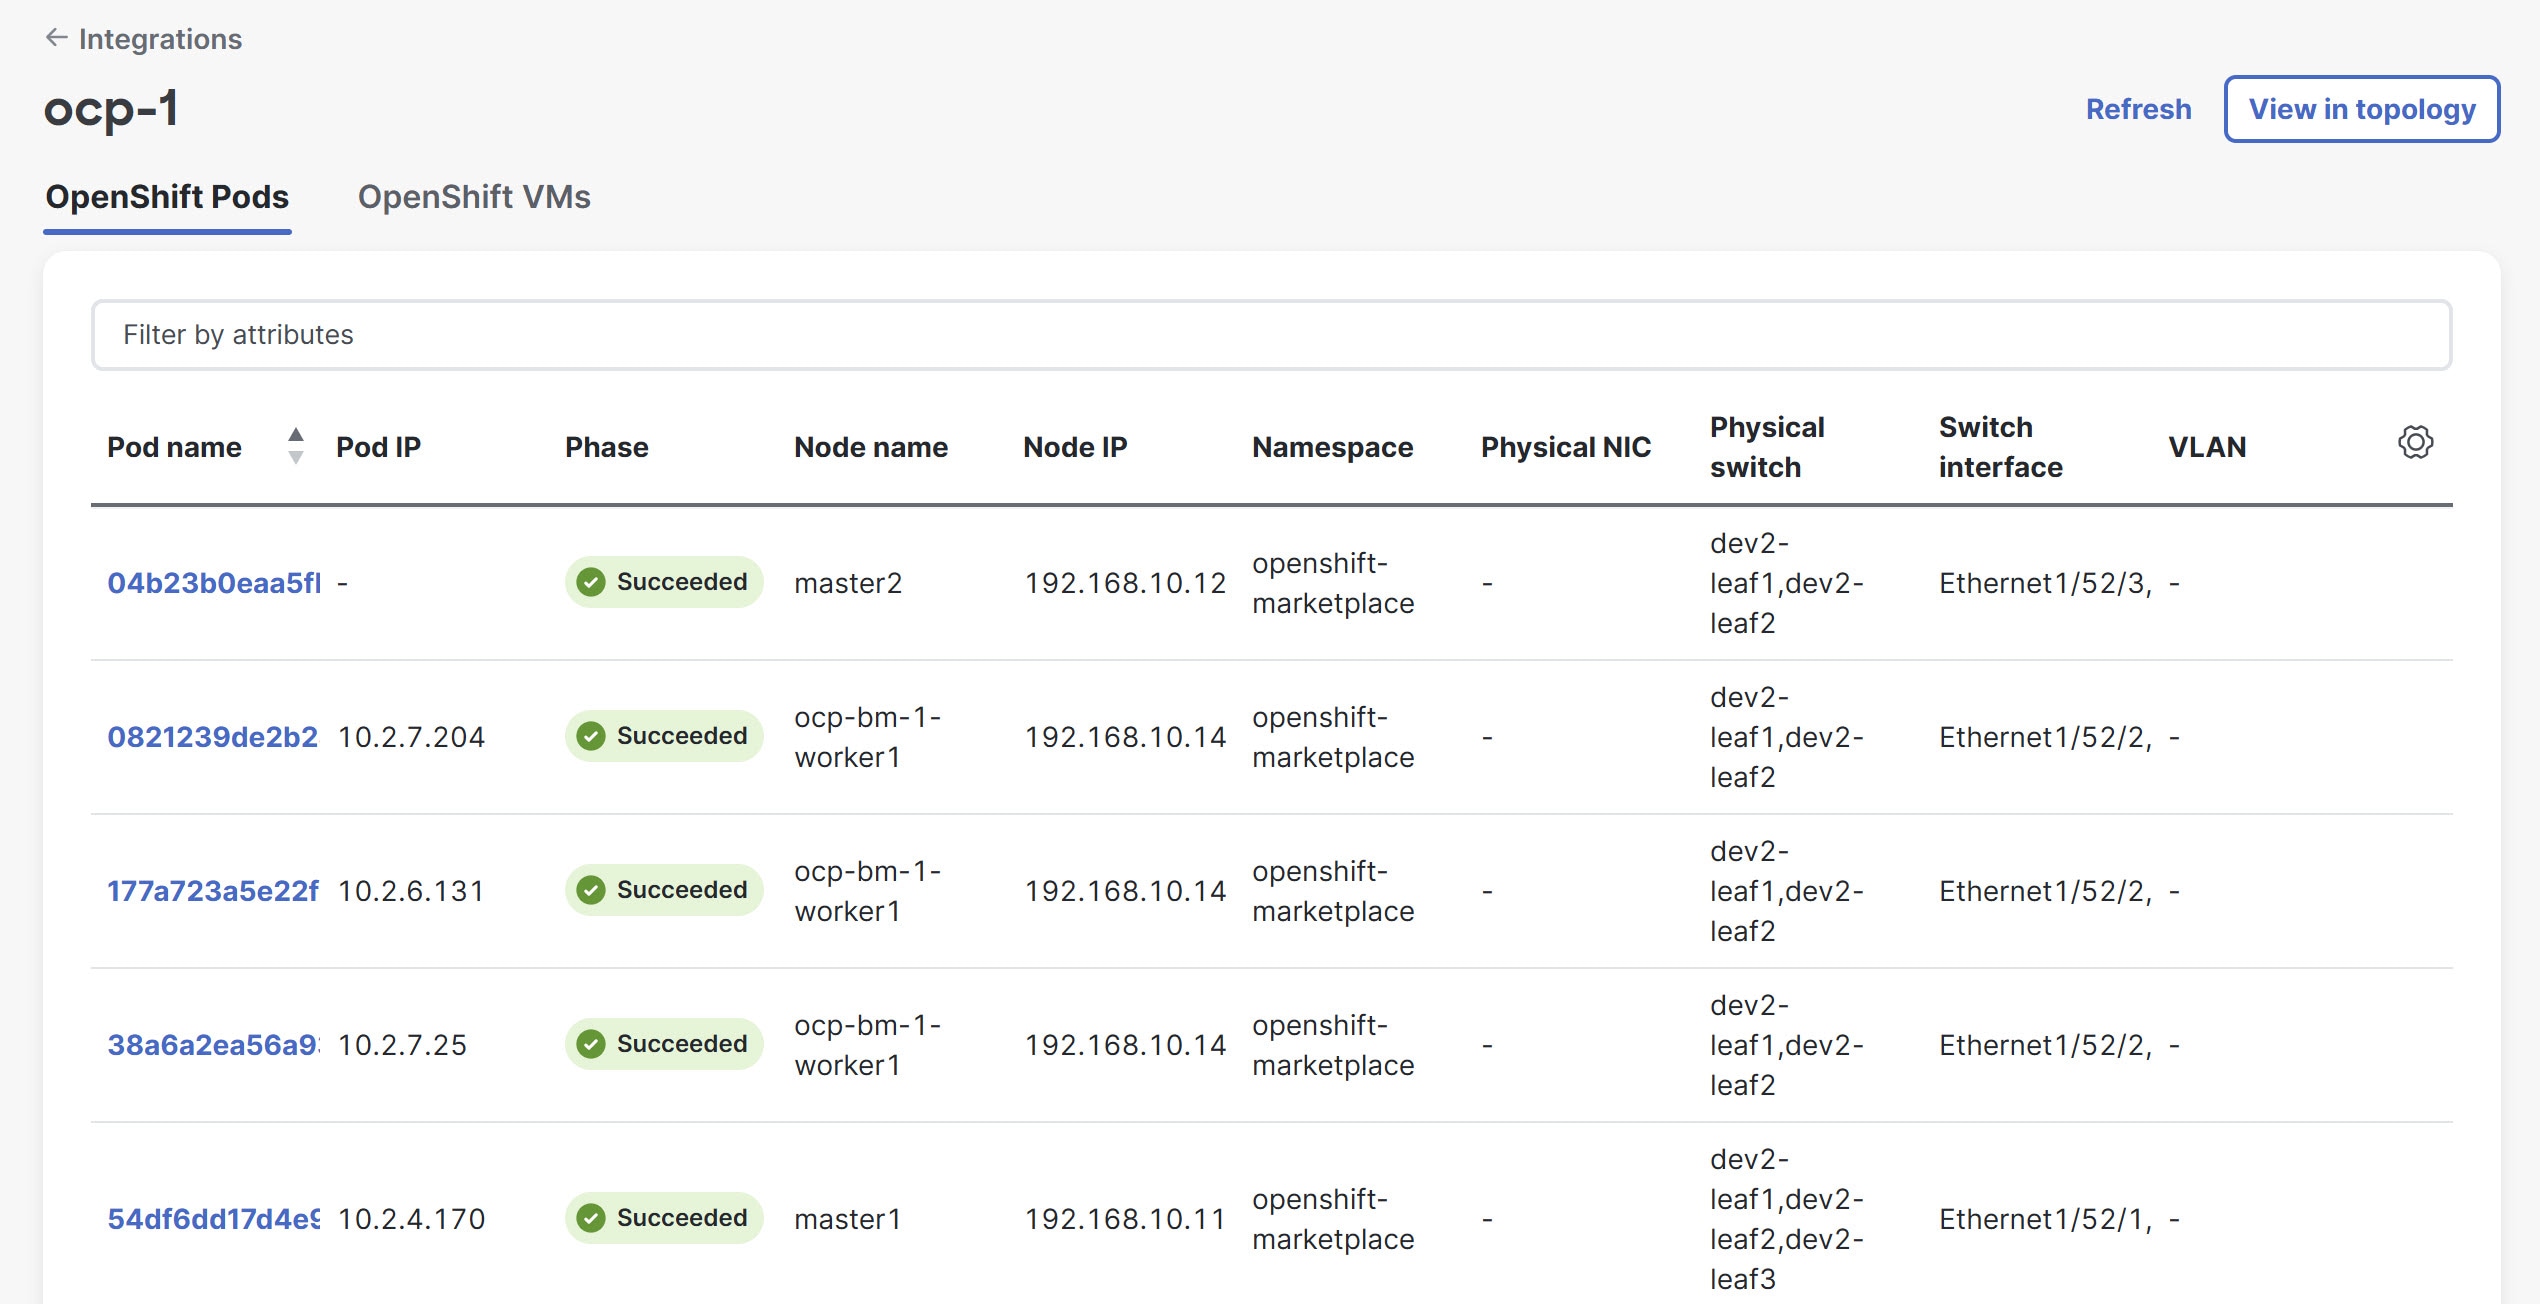
You can also view the OpenShift cluster from the Topology page. Navigate to Home > Topology to view the OpenShift Nodes and VMs represented with OpenShift-specific icons. In the topology view, a specific VM is represented by both the pod that launches it and an icon for the VM itself. This occurs because OpenShift visualization, which is built on KubeVirt, treats VMs as pods.
Guidelines and limitations for OpenShift integration
-
Security groups for OpenShift VMs, like those used for VMware VMs, are not supported.
This is because OpenShift traffic uses the fabric as an underlay, unlike regular vCenter traffic. Policy enforcement in these cases is managed through fabric-level policies or Kubernetes-native network policies.
-
OpenShift integration is compatible only with bare metal and virtual nodes running on VMware ESX.
-
Ensure that you resync OpenShift clusters after you use backup or restore operation. To synchronize individual OpenShift cluster, click the ellipsis (…) in the last column of the Integrations table to choose the Rediscover option.
-
Anomaly detection and endpoint analytics for OpenShift nodes are not available.
-
OpenShift integration is only supported for OpenShift clusters connected to an NX-OS based fabric. ACI fabrics are not supported in this release.
-
OpenShift cluster bare-metal nodes are supported. In order to discover bare-metal nodes, LLDP is required.
-
OpenShift cluster virtualized nodes are supported only if they run on VMware hypervisors. In order to discover virtual nodes running on ESXi hosts, it is required to integrate Nexus Dashboard with the VMware vCenter where the nodes are running. For more information see, Add VMware vCenter server integration.
-
If the OpenShift nodes are virtualized, the discovery of the nodes on vCenter happens matching the IP address of the nodes with the known virtual machines. If multiple virtual machines across the same or multiple vCenters integrated with Nexus Dashboard are overlapping the same IP address, the discovery may fail.
Panduit PDU integration
Panduit Power Distribution Unit (PDU) Integration in Nexus Dashboard enables you to monitor energy usage and unlock sustainability insights for fabrics and individual devices connected to a Panduit PDU. Monitoring energy consumption gives you insight into how much electricity your devices and/or Panduit PDUs are using.
The workflow for integration of Panduit PDU consists of the following steps:
-
Install Panduit PDU collector and PDUs.
-
Add PDU collector to Nexus Dashboard. The PDU collector collects telemetry from PDUs in your environment.
-
Associate PDUs to the PDU collector. The associated PDUs sends telemetry to the Panduit PDU collector, and Nexus Dashboard displays PDU statistics in the Sustainability Report. See Sustainability Report.
Prerequisites for Panduit PDU integration
-
Install Panduit Collector and PDUs. See Panduit Data Collector for Cisco Nexus Dashboard.
-
Associate the PDUs with the collector.
-
Configure a persistent IP address for the PDU collector in the Nexus Dashboard Admin Console to stream telemetry information for one or more PDUs in your fabric. To set this up, navigate to Admin > System Settings > General > External Service Pools > Add Data Service IP Address to configure the persistent IP address.
-
Ensure that you configure the SNMP protocol in the PDU. For more information, see Simple Network Management Protocol.
Guidelines and limitations for Panduit PDU integration
These guidelines and limitations apply for Panduit PDU integration:
-
After you onboard the PDU collector in Nexus Dashboard, it will take at least 15 minutes for the number of devices powered by the PDU collector to be displayed in the Nexus Dashboard GUI.
-
Once the number of devices powered by the PDU collector to be displayed in the Nexus Dashboard GUI, the PDU data is updated every 15 minutes in Nexus Dashboard.
-
If the PDU collection status is Not OK, see the "Troubleshooting" section in the Installation Guide (https://www.panduit.com/content/dam/panduit/en/website/support/download-center/documents/Panduit-Collector-for-Nexus-Installation-Guide_v1.2.pdf) to check the streaming issues.
-
If you have not configured the PDU name in the Panduit PDU GUI, the PDU name is not displayed in the PDU table in Nexus Dashboard.
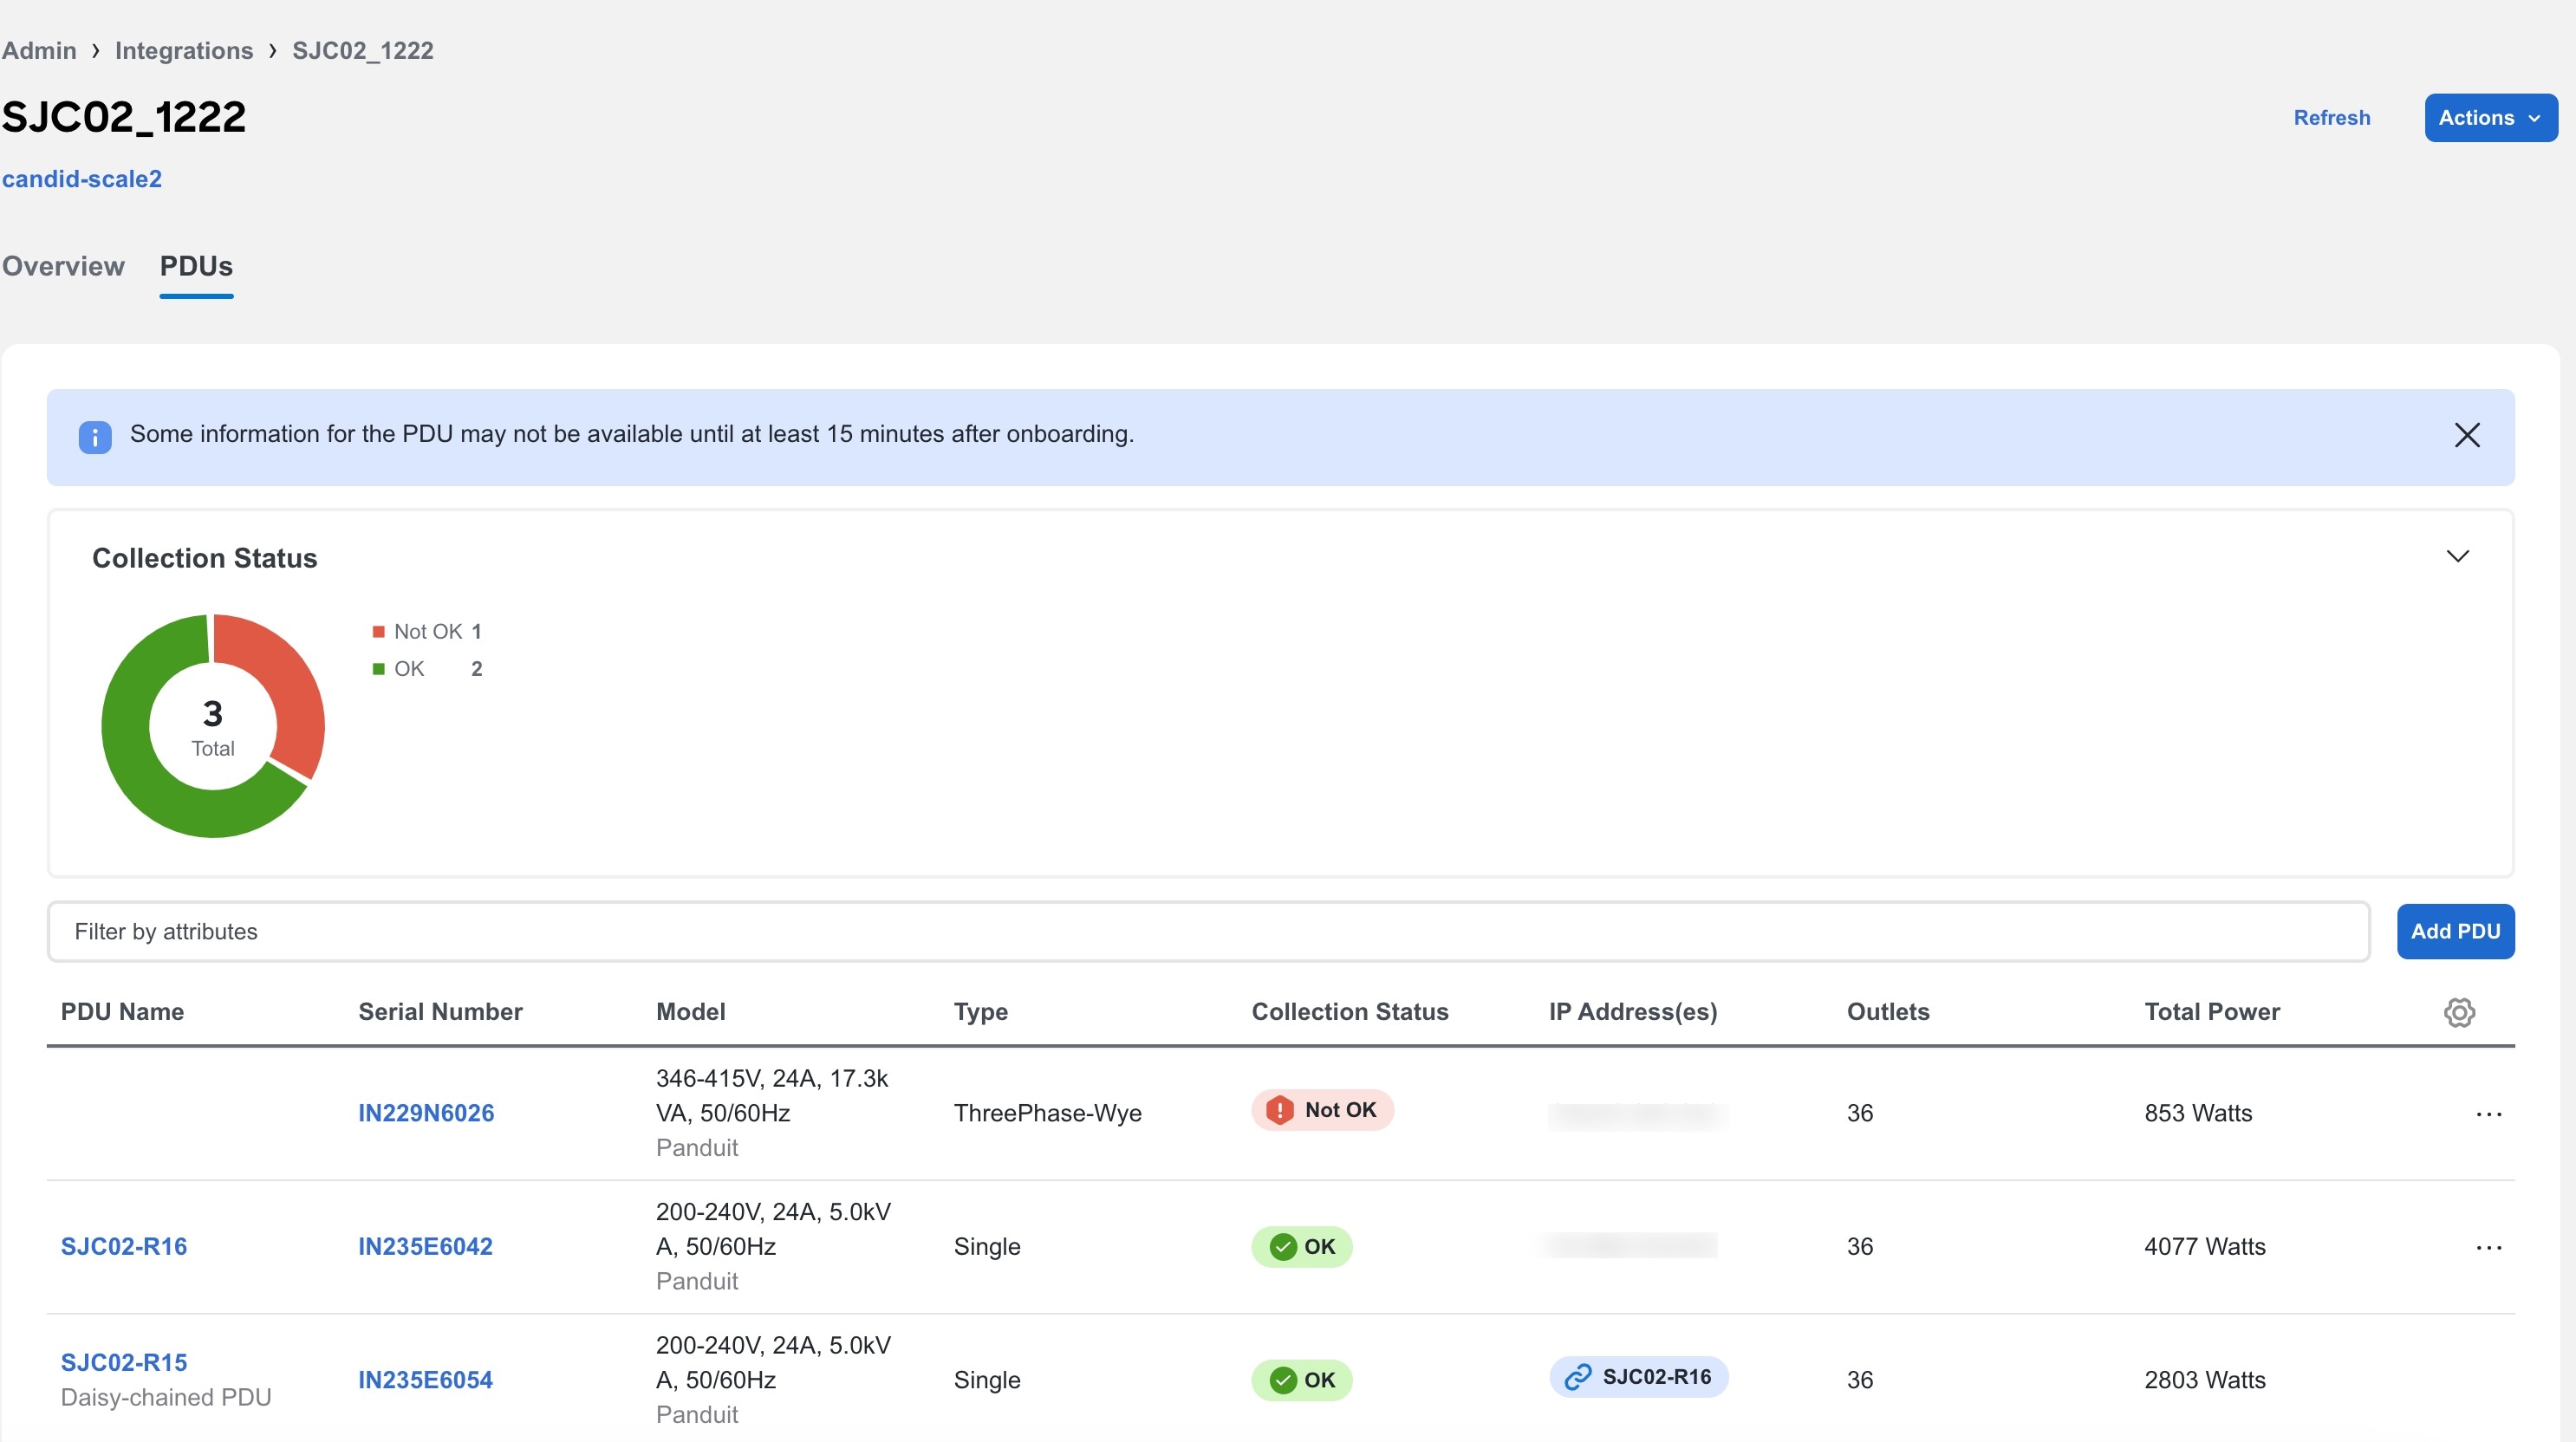
Add PDU integration
Follow these steps to add PDU integration.
-
Navigate to Admin > Integrations > Add Integration.
-
Select Integration Type Panduit PDU.
-
Complete the following fields for PDU Collector.
-
Enter the name of the PDU Collector.
-
Enter the IP address of the PDU Collector.
-
Enter the username and password to authenticate the PDU Collector.
-
Select an online fabric to associate with the PDU Collector. A PDU Collector is associated with single fabric.
Snapshot fabric is not supported.
-
Click Next.
-
-
Complete the following fields for Add PDUs to add PDUs to the PDU collector.
-
The PDU collector version and status is displayed in the summary. Once the PDU collector is added successfully, you can add the PDUs to the collector.
-
Enter the IP address of the PDU.
-
Click Add to Collector.
-
-
Complete the following fields for PDU credentials.
Ensure that you have configured the SNMP protocol in the PDU.
-
Select the SNMP protocol version.
-
For SNMP protocol version 2, enter the community string and click Submit.
-
For SNMP protocol version 3, enter the user name.
-
Select the Authentication Type and Protocol.
-
Enter the Authentication password.
-
Select the Privacy Protocol and enter the password.
-
Click Submit.
-
After the PDU credentials are verified, the PDU is added to the collector and the PDU status is displayed in the table. In the table you can view details such as PDU status, PDU name, IP address of primary and secondary PDU, model, and serial number. For secondary PDU or Daisy-chained PDUs, you can view all the PDUs linked to the primary PDU.
-
Click Next.
-
-
Review the PDU information in the PDU Summary and click Done.
-
To add another PDU Collector click Add Another PDU Collector.
-
To view PDU Collector details, click View PDU Collector.
-
View PDU integration
Follow these steps to view PDU integration.
-
Navigate to Admin > Integrations. In the Integrations Dashboard you can view the list of Panduit PDUs associated with a fabric. For each PDU integration you can view the Name, Connectivity Status, Type, IP address, Last Active, and Associations.
-
Click PDU collector name to view additional details.
-
Click Overview to view information such as collector IP address, connectivity to Nexus Dashboard, number of PDUs associated with the PDU collector, and number of devices powered by the PDU collector.
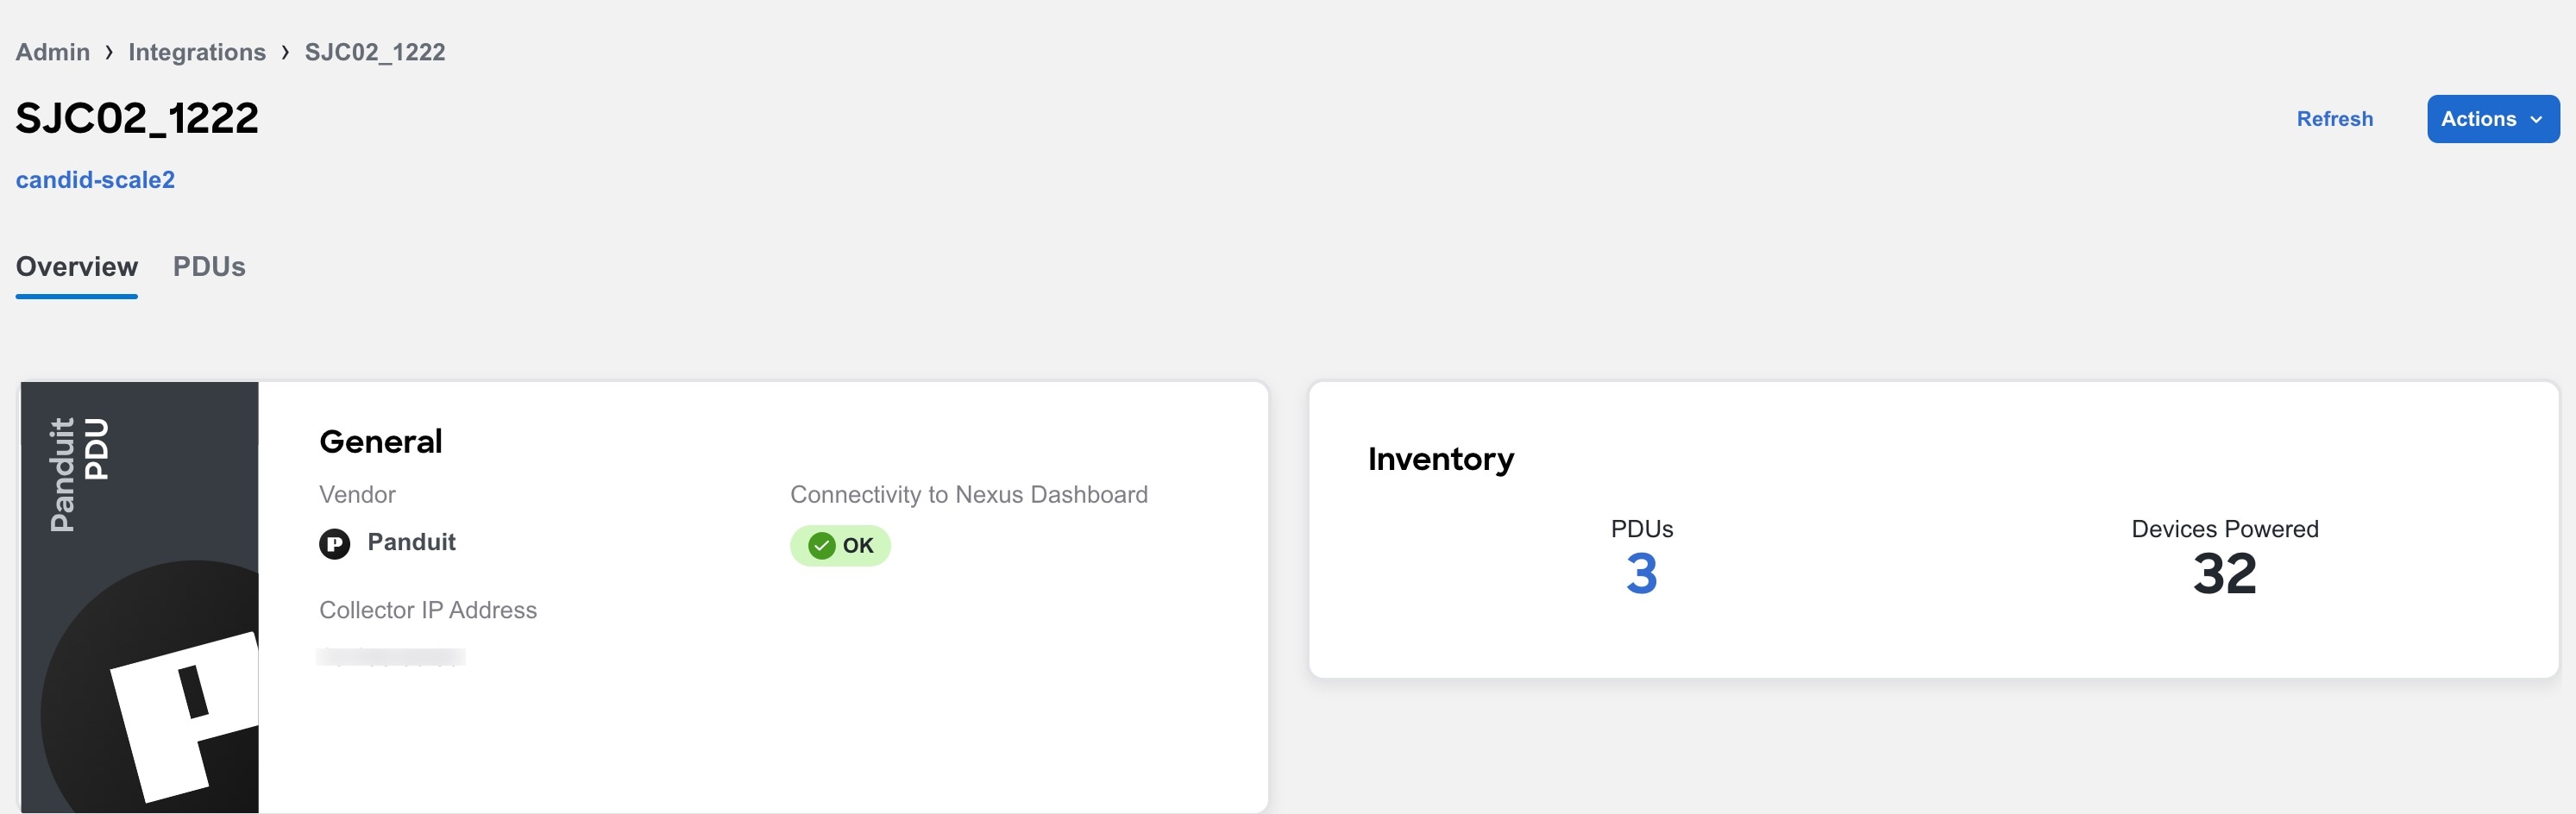
-
Click PDUs to view the onboarding status of the PDUs associated with the PDU collector as a doughnut chart.
-
Use the search bar to filter the PDUs by name, serial number, model, type, collection status, IP addresses, outlets, and total power.
-
The PDUs table displays the filtered PDUs. The PDU table displays the PDU name name, serial number, model, type ( single or three phase), collection status, IP addresses, outlets, and total power.
-
Click the column heading to sort the PDUs in the table.
-
Click the gear icon to configure the columns in the PDUs table.
-
Click the ellipsis icon and click Remove from this Collector to remove the PDU.
-
Click PDU name to view additional details such as general information, phases, and circuits. For Three Way type PDUs, you can the view the different phases.
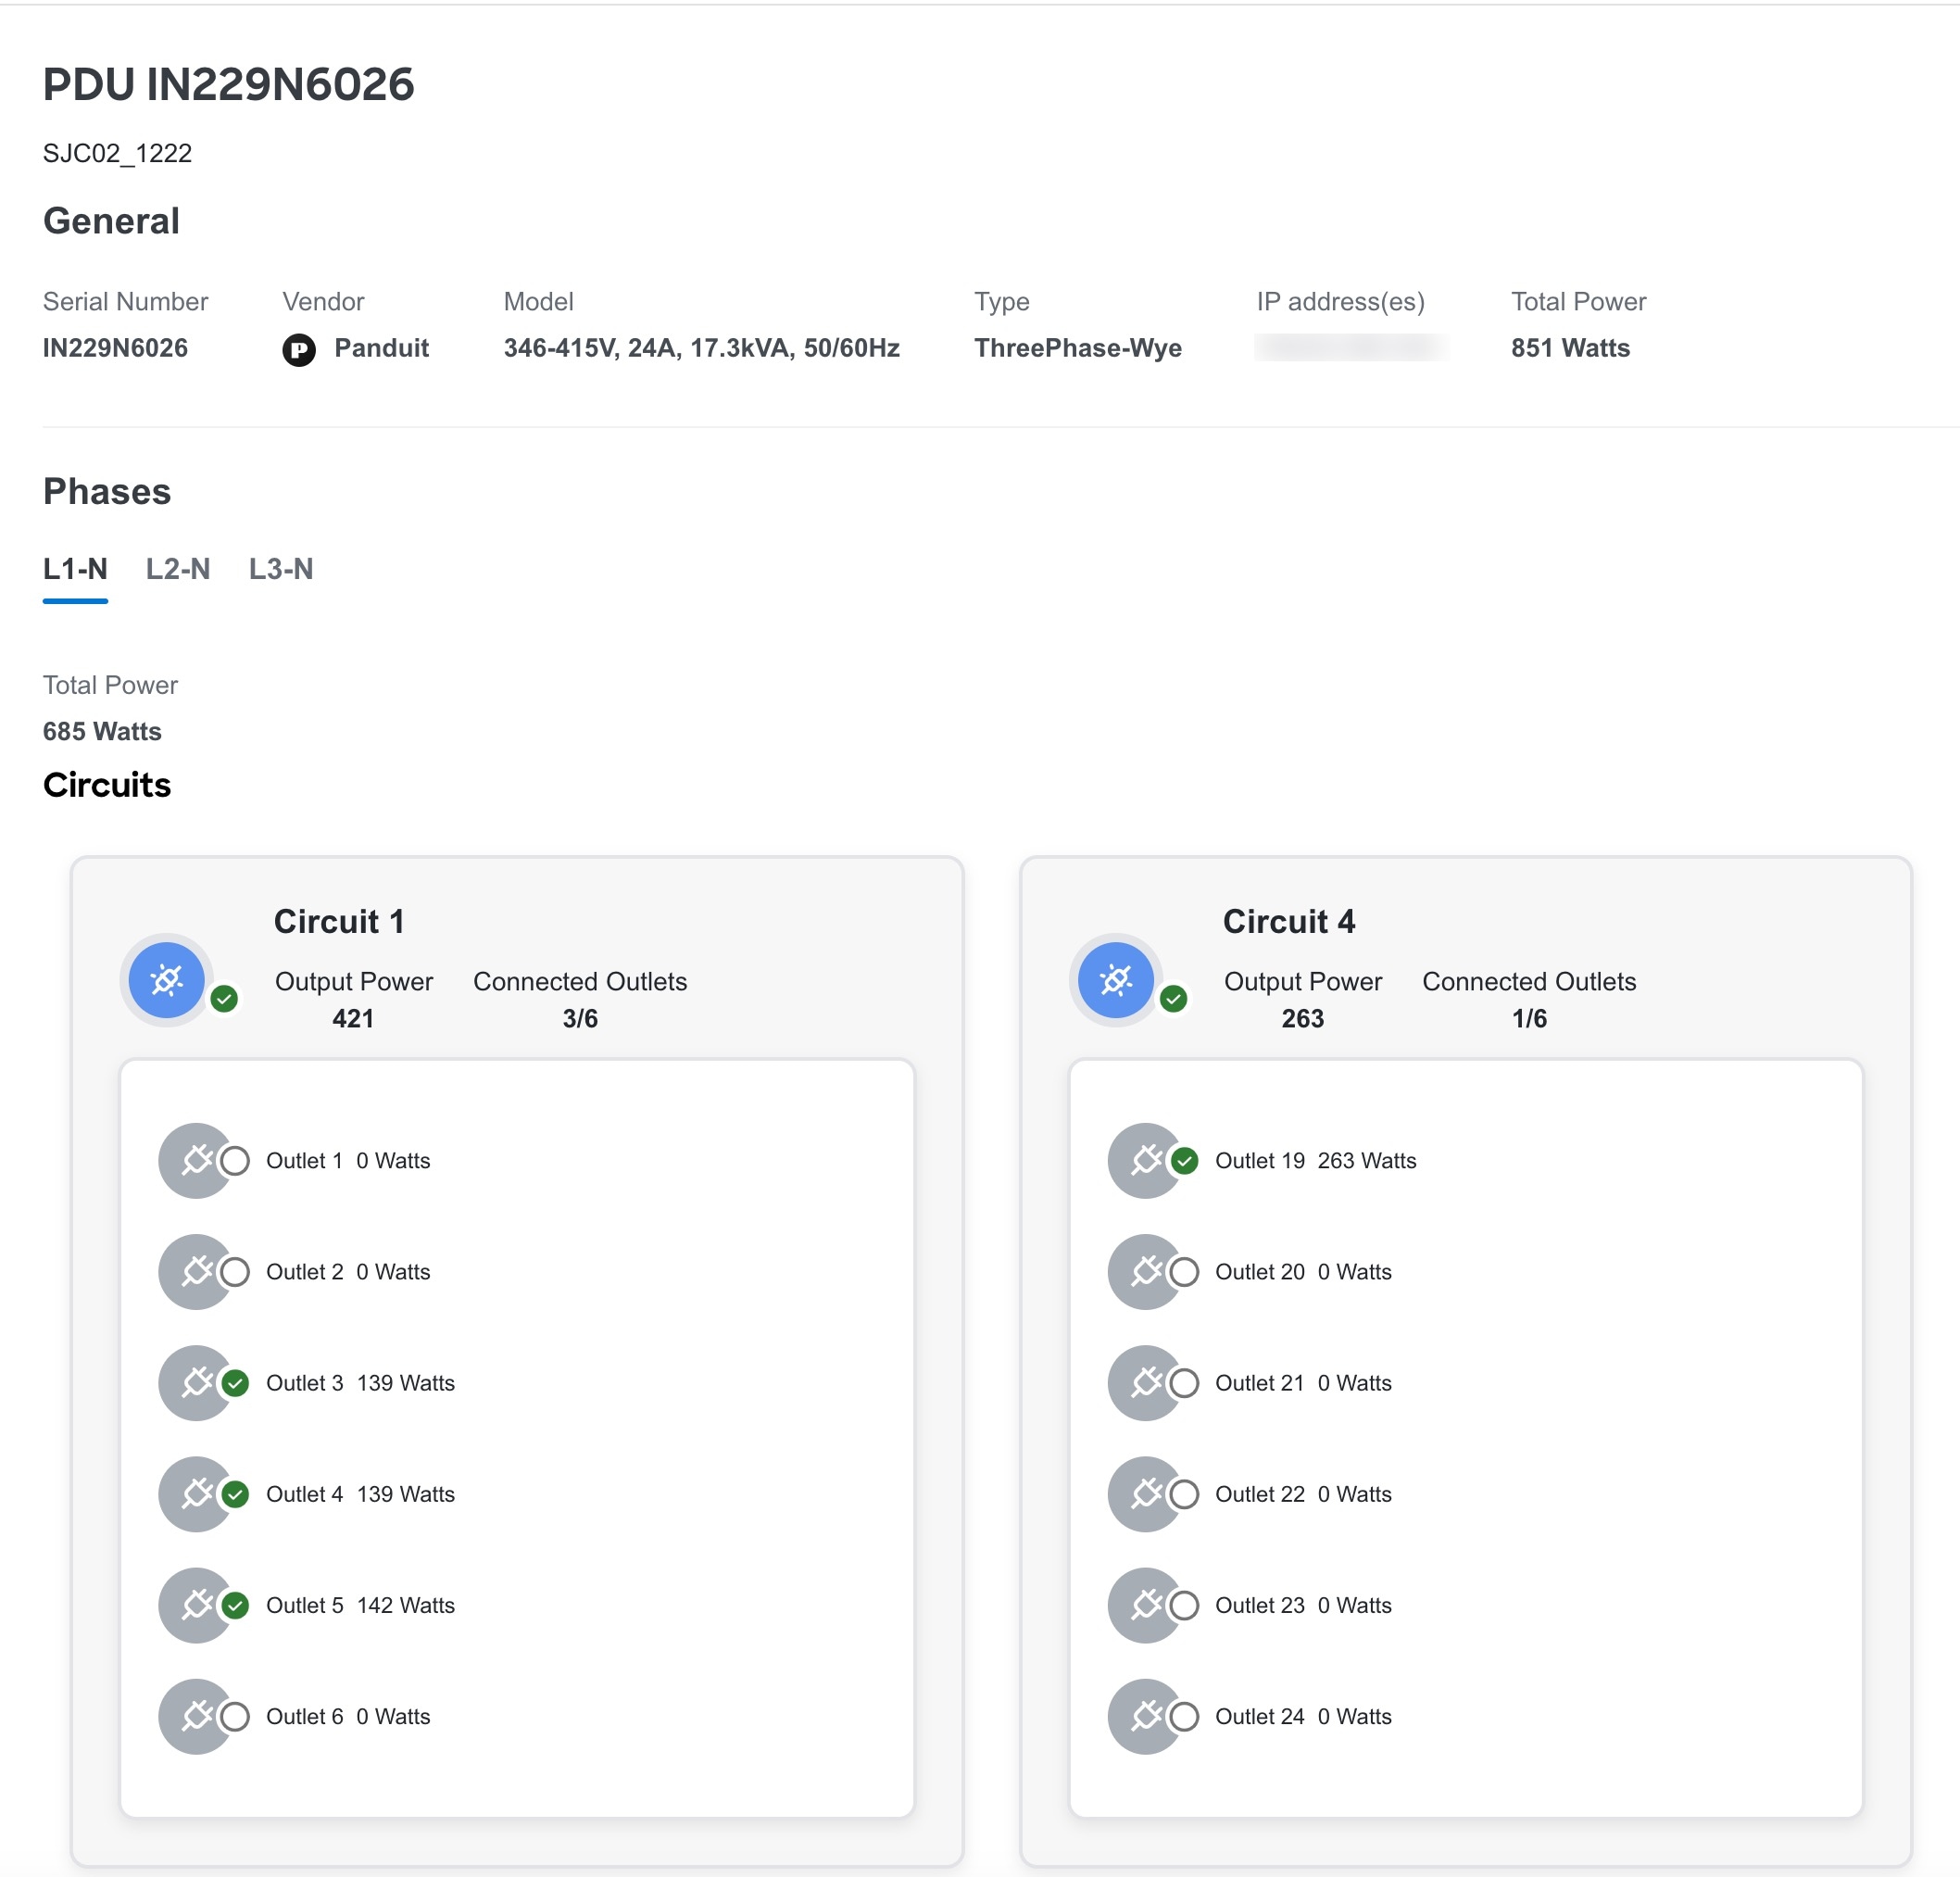
AppDynamics integration
Nexus Dashboard provides the ability to monitor the most common and complex challenges in the maintenance of infrastructure operations, which involves monitoring, troubleshooting, identification and resolving the network issues.
AppDynamics provides application performance management (APM) and IT operations analytics that helps manage the performance and availability of applications in the data center. It also provides the required metrics for monitoring, identifying, and analyzing the applications that are instrumented with AppDynamics agents.
AppDynamics hierarchy consists of the following components:
-
Network Link—Provides the functional means to transfer data between network entities.
-
Node—A working entity of an application and is a process running on a virtual machine.
-
Tier—Grouping of nodes into a logical entity. Each tier can have one or more nodes.
-
Application—A set of tiers make up an application.
-
Controller—A controller consists of a set of accounts with each account comprising a list of applications. Each account in the controller is an instance.
Integrating AppDynamics allows Nexus Dashboard to collect operational data and metrics of the applications monitored by AppDynamics, and then correlate the collected information with the data collected from the fabric.
In a scenario where an application communicates through the fabric, AppDynamics provides various metrics about the application and the network, which can be used to isolate the cause of the anomaly. The anomaly can be in the application or the underlying network. This in turn allows network operators to monitor the network activity and detect anomalies.
The AppDynamics agents are plug-ins or extensions, hosted on the application. They monitor the health, and performance of the network nodes and tiers with minimal overhead, which in turn report to the AppDynamics controller. The controller receives real-time metrics from thousands of agents and helps troubleshoot and analyze the flows.
Nexus Dashboard connects to the AppDynamics controller and pulls the data periodically. This data from AppDynamics controller, rich in application specific information is fed to Nexus Dashboard, thereby providing Nexus Dashboard for the traffic flowing through the fabric.
From AppDynamics, you can create your own health rule on the available metrics, which contributes to the overall anomaly score of the entity.
The integration of Nexus Dashboard with AppDynamics enables the following:
-
Monitoring and presenting AppDynamics hierarchy in Nexus Dashboard.
-
Gathering and importing network related metrics into Nexus Dashboard.
-
Presenting statistics analytics, flow analytics, and topology view on the data collected from AppDynamics controller.
-
Detecting anomaly trends on metrics collected from AppDynamics controller and raising anomalies on detection of such events.
-
The AppDynamics integration uses API server and multiple instances of Telegraph data collecting container to support load balancing of the onboarded controllers.
-
Fabric flow impact calculation for AppDynamics anomalies.
Onboarding for SaaS or cloud deployments
Starting from Nexus Dashboard release 6.0.2, you can connect to an AppDynamics controller using a proxy for SaaS or cloud deployments. For onboarding an AppDynamics Controller running on a cloud, Nexus Dashboard uses a proxy configured in Nexus Dashboard’s Admin Console to connect to the AppDynamics Controller.
Guidelines and limitations for AppDynamics integration
-
After upgrading Nexus Dashboard, AppDynamics takes about 5 minutes to report the information in the AppDynamics GUI.
-
The health and count of AppDynamics business transactions displayed in the application details do not match the flow count in Nexus Dashboard.
-
Nexus Dashboard does not support fabric topologies as a transit-leaf switch does not have the VRF instance deployed and the flow table in the transit-leaf switch will not export the flow record to Nexus Dashboard. Hence, Nexus Dashboard will not stitch the path fully and will not display complete path summary with all the information.
-
To connect an HTTPS AppDynamics controller using an HTTP proxy you must configure HTTPS proxy in Nexus Dashboard’s Admin Console with the HTTP proxy server URL address.
-
To connect an HTTP AppDynamics controller using an HTTP proxy you must configure HTTP proxy in the Admin Console with the HTTP proxy server URL address.
-
In Cisco ACI fabrics, configuration import and export are not supported for AppDynamics integrations.
Installing AppDynamics
Before you begin using Nexus Dashboard integrations, you must install the AppDynamics Application Performance Management and Controller. See Getting Started for details.
Onboard an AppDynamics controller
For Nexus Dashboard and AppDynamics integration, Nexus Dashboard’s data network must provide IP reachability to the AppDynamics controller. For more information, see the Cisco Nexus Dashboard Deployment Guide.
Prerequisites
-
You must have installed AppDynamics application and controller.
-
You must have administrator credentials for Nexus Dashboard.
-
You must have user credentials for AppDynamics controller.
-
You must have configured a proxy in the Nexus Dashboard Admin Console to connect to an AppDynamics controller using a proxy. For more information, see the "Connecting Nexus Dashboard clusters" section in Connecting Clusters.
Procedure
Follow these steps to onboard an AppDynamics controller.
-
Click Admin > Integrations > Add Integration.
-
Choose App Dynamics for Integration Type.
-
AUTHENTICATION
-
Enter the Controller Name, Controller IP or Hostname, Controller Protocol, and Controller Port. The Controller Name can be alphanumeric, but spaces are not allowed.
The AppDynamics Controller Name cannot be the same name as the Nexus Dashboard fabric name.
-
Put a check in the Enable box to connect to the AppDynamics controller using a proxy. The proxy must be configured in the Admin Console.
-
Enter the AppDynamics Account Name, User Name, and Password.
-
-
ASSOCIATIONS
-
Choose a fabric or multiple fabrics. You can view the number of anomalies for each severity level, SW Analytics, Flow Collection, and the Anomaly Trend for each fabric before selecting it.
-
Click Select.
-
-
The Summary displays an overview of the Integration created.
-
Click Submit to add the integration. The post completion success screen allows you to Add Another Integration or View Integrations. When the Status is Connected, the onboarding for the controller is complete.
Nexus Dashboard and AppDynamics integration dashboard
The AppDynamics Dashboard allows you to onboard controllers and presents a view of the Top 5 Applications by Anomaly Score along with various metrics. After a controller is onboarded, data related to applications monitored by that controller is pulled by Nexus Dashboard. It can take up to 5 minutes for the first set of data to appear on the GUI. The AppDynamics health state information provided for each entity is aggregated and reported by Nexus Dashboard on the dashboard.
The AppDynamics dashboard displays the overview of the applications monitored by the AppDynamics controller.
-
Controller Connectivity—Represents the number of integrations that are Up or Down.
-
Anomalies by Severity—The Nexus Dashboard runs statistical analytics on the metrics received from the AppDynamics controller.
-
Top 5 Applications by Anomaly Score—Displays top five out of all the applications based on the anomaly score.
-
Anomalies by Severity—Shows the Anomalies page.
-
Application Widget—Displays the top application by anomaly score. This includes the anomaly score of the application as computed in Nexus Dashboard, health state of tiers and nodes as reported by AppDynamics. Click the widget for additional details about the monitored application.
AppDynamics integration application
Detailed information including operational, statistics, and metrics, for each tier or application is also presented.
-
Summary lists the anomaly score, controller name, account, application name, number of tiers, number of nodes, throughput, TCP loss, and errors.
-
Analyze Anomaly details displays estimated impact application, recommendations, mutual occurrences, and other details affected by the anomaly. Click an anomaly in the summary to display additional details.
-
View Report displays the flow groups affected where each flow group can correspond to multiple fabric flows. View reports also display the proxy/entity IP address, node source, and node destination IP address.
-
Number of Tiers to list the available tiers. Click each tier from the list to display health score, number of nodes, and usage statistics.
-
Number of Nodes to list the available nodes. Click each node from the list to display statistics about the node.
-
Application Name to display additional details such as general information of the application, controller name, controller IP, account name, health of the tier, health of the node, business transaction health, and usage analytics.
-
 icon to open AppDynamics Application details. This displays application statistics details such as anomaly score, application tiers summary, application nodes summary, network charts for the node communication, and summary table of anomalies.
 -
Application Network Links table shows how the different components of AppDynamics application network flow map are communicating among each other. Detailed information about a network link, including flow counts and anomalies are used for further analysis.
-
AppDynamics Application View shows the summary for the particular AppDynamics monitored application to display page.
AppDynamics application view
The AppDynamics application view presents an overview of the application health state including tier health, node health, and business transaction health.
-
Application Statistics displays the graphical representation of the flow properties and a timeline graph representing the properties.
-
Tiers displays the health state of the tiers in the application. Click each row in the tier section for the side panel to display additional tier usage details.
-
Nodes displays the health state of the nodes in the application. Click each row in the node section for the side panel to display additional node usage details.
-
Application Network Links displays the link summary for the nodes.
-
Network Connection displays additional flow connection details.
-
Browse Network Flows to navigate to Browse Flows Records with the flow properties set in the filter.
-
Anomalies summarizes the anomalies with severity and other essential details of the anomaly. Click each row in the Anomalies section to see additional details of the anomaly.
-
Analyze for in-depth analysis, mutual occurrences, estimated impact, lifespan, and recommendations on the anomaly.
AppDynamics integration application for standalone NX-OS fabrics
Detailed information including operational, statistics, and metrics, for each tier or application is also presented.
-
Summary lists the anomaly score, controller name, account, application name, number of tiers, number of nodes, throughput, TCP loss, and errors.
-
*Anomaly in the summary to display additional details.
-
Analyze Anomaly details displays estimated impact application, recommendations, mutual occurrences, and other details affected by the anomaly.
-
View Report displays the flow groups affected where each flow group can correspond to multiple fabric flows. View reports also display the proxy/entity IP address, node source, and node destination IP address.
-
Number of Tiers lists the available tiers. Click each tier from the list to display health score, number of nodes, and usage statistics.
-
Number of Nodes lists the available nodes. Click each node from the list to display statistics about the node.
-
Application Name displays additional details such as general information of the application, controller name, controller IP, account name, health of the tier, health of the node, business transaction health, and usage analytics.
-
icon on the right top corner is to open AppDynamics Application details. This page displays application statistics details such as anomaly score, application tiers summary, application nodes summary, network charts for the node communication, and summary table of anomalies.
-
Application Network Links table shows how the different components of AppDynamics application network flow map are communicating among each other. Detailed information about a network link, including flow counts and anomalies are used for further analysis.
-
AppDynamics Application View - Double-click each row in the summary for the particular AppDynamics monitored application.
AppDynamics application view
AppDynamics application view presents an overview of the application health state including tier health, node health, and business transaction health.
-
Application Statistics displays the graphical representation of the flow properties and a timeline graph representing the properties.
-
Tiers displays the health state of the tiers in the application. Click each row in the tier section for the side panel to display additional tier usage details.
-
Nodes displays the health state of the nodes in the application. Click each row in the node section for the side panel to display additional node usage details.
-
Application Network Links displays the link summary for the nodes.
-
Network Connection displays additional flow connection details.
-
Browse Network Flows to navigate to Browse Flow Records with the flow properties set in the filter.
-
Anomalies summarizes the anomalies with severity and other essential details of the anomaly. Click each row in the Anomalies section for the side pane to pop up with additional details of the anomaly.
-
Analyze for in-depth analysis, mutual occurrences, estimated impact, lifespan, and recommendations on the anomaly.
Topology view
The topology view represents the stitching between nodes where these nodes are connected to the fabric.
The topology view includes application nodes and leaf nodes. Toggle between show or not show to view/hide the nodes with anomaly score. The anomaly score is represented by the dot in the topology.
The topology view represents a hierarchical view of Application > Node > Leaf and the links between them with a logical or network view of how various objects are related.
AppDynamics anomalies
From AppDynamics application, you can create your own health rule on the available metrics, which contributes to the overall anomaly score of the entity. If the health rules are violated and a violation is generated by the AppDynamics controller, then Nexus Dashboard pulls these health violations and generates anomalies on these violations.
The anomalies in the summary table include the following:
-
Anomalies raised on the metrics from the AppDynamics controller.
-
Health violation on the network metrics that the AppDynamics controller raised.
-
Anomalies at the application level and node level.
If there is an anomaly on the interface of application(s) impacted by the interface, then an anomaly is identified and shown.
Depending on the anomaly score and the level at which the anomaly occurs, the corresponding flows impacted are identified. Information related to the flow metrics with the leaf information enable statistics analytics, pin point the source of the anomaly, whether it is the application or network, and the impacted entities.
The fabric flow impact calculation for AppDynamics anomalies calls flow APIs to fetch the fabric flows corresponding to the AppDynamics flow groups that were affected by the anomaly. Nexus Dashboard displays the top 100 fabric flows ordered by the anomaly score for AppDynamics anomalies.
Slack integration
Overview
Slack integration with Nexus Dashboard allows you to query Nexus Dashboard directly from Slack messenger across various Slack channels, enabling seamless collaboration and real-time interaction.
Key features of Slack integration
-
Direct queries from Slack — You can perform on-demand queries to retrieve monitoring and operational data from Nexus Dashboard without leaving Slack.
-
Channel mapping — Each Slack channel must be mapped to one or more security domains and a single tenant domain within Nexus Dashboard. This mapping ensures that any queries initiated from the channel adhere to the permissions defined for those security and tenant domains.
-
Secure authentication — Nexus Dashboard authenticates the WebSocket connection to Slack using the Slack CA certificate and a Slack app-level token configured on Nexus Dashboard. This ensures a secure and trusted link between Slack workspaces, channels, and Nexus Dashboard domains.
-
User-initiated interaction — Slack channels allow users to actively query Nexus Dashboard secure domains and receive responses within Slack, supporting interactive collaboration.
Slack integration in Nexus Dashboard includes these steps.
Guidelines and limitations of Slack integration
-
Slack integration requires specific configurations in the Slack app, including app setup and token management.
-
Only users with super-admin privileges can configure Slack integration on Nexus Dashboard. The super-admin must provide the Slack App ID for Nexus Dashboard to validate incoming requests.
-
You can link each Slack channel to one or more secure domains and a single tenant domain. This setup allows users in these channels to access Nexus Dashboard resources (such as fabrics and switches) and run slash command queries directly from Slack.
-
Currently, Slack integration does not support real-time notifications from Nexus Dashboard. You must manually run commands to retrieve the latest information.
Configure Slack app
To integrate your Slack app with Nexus Dashboard and enable real-time interactions, you need to perform the following steps.
Create Slack workspace
Follow these steps to create Slack workspace.
-
Navigate to the Slack.com.
-
Click Get Started.
-
Provide a name for your Slack workspace.
-
Click Next.
After you create your workspace, you can create and configure Slack apps.
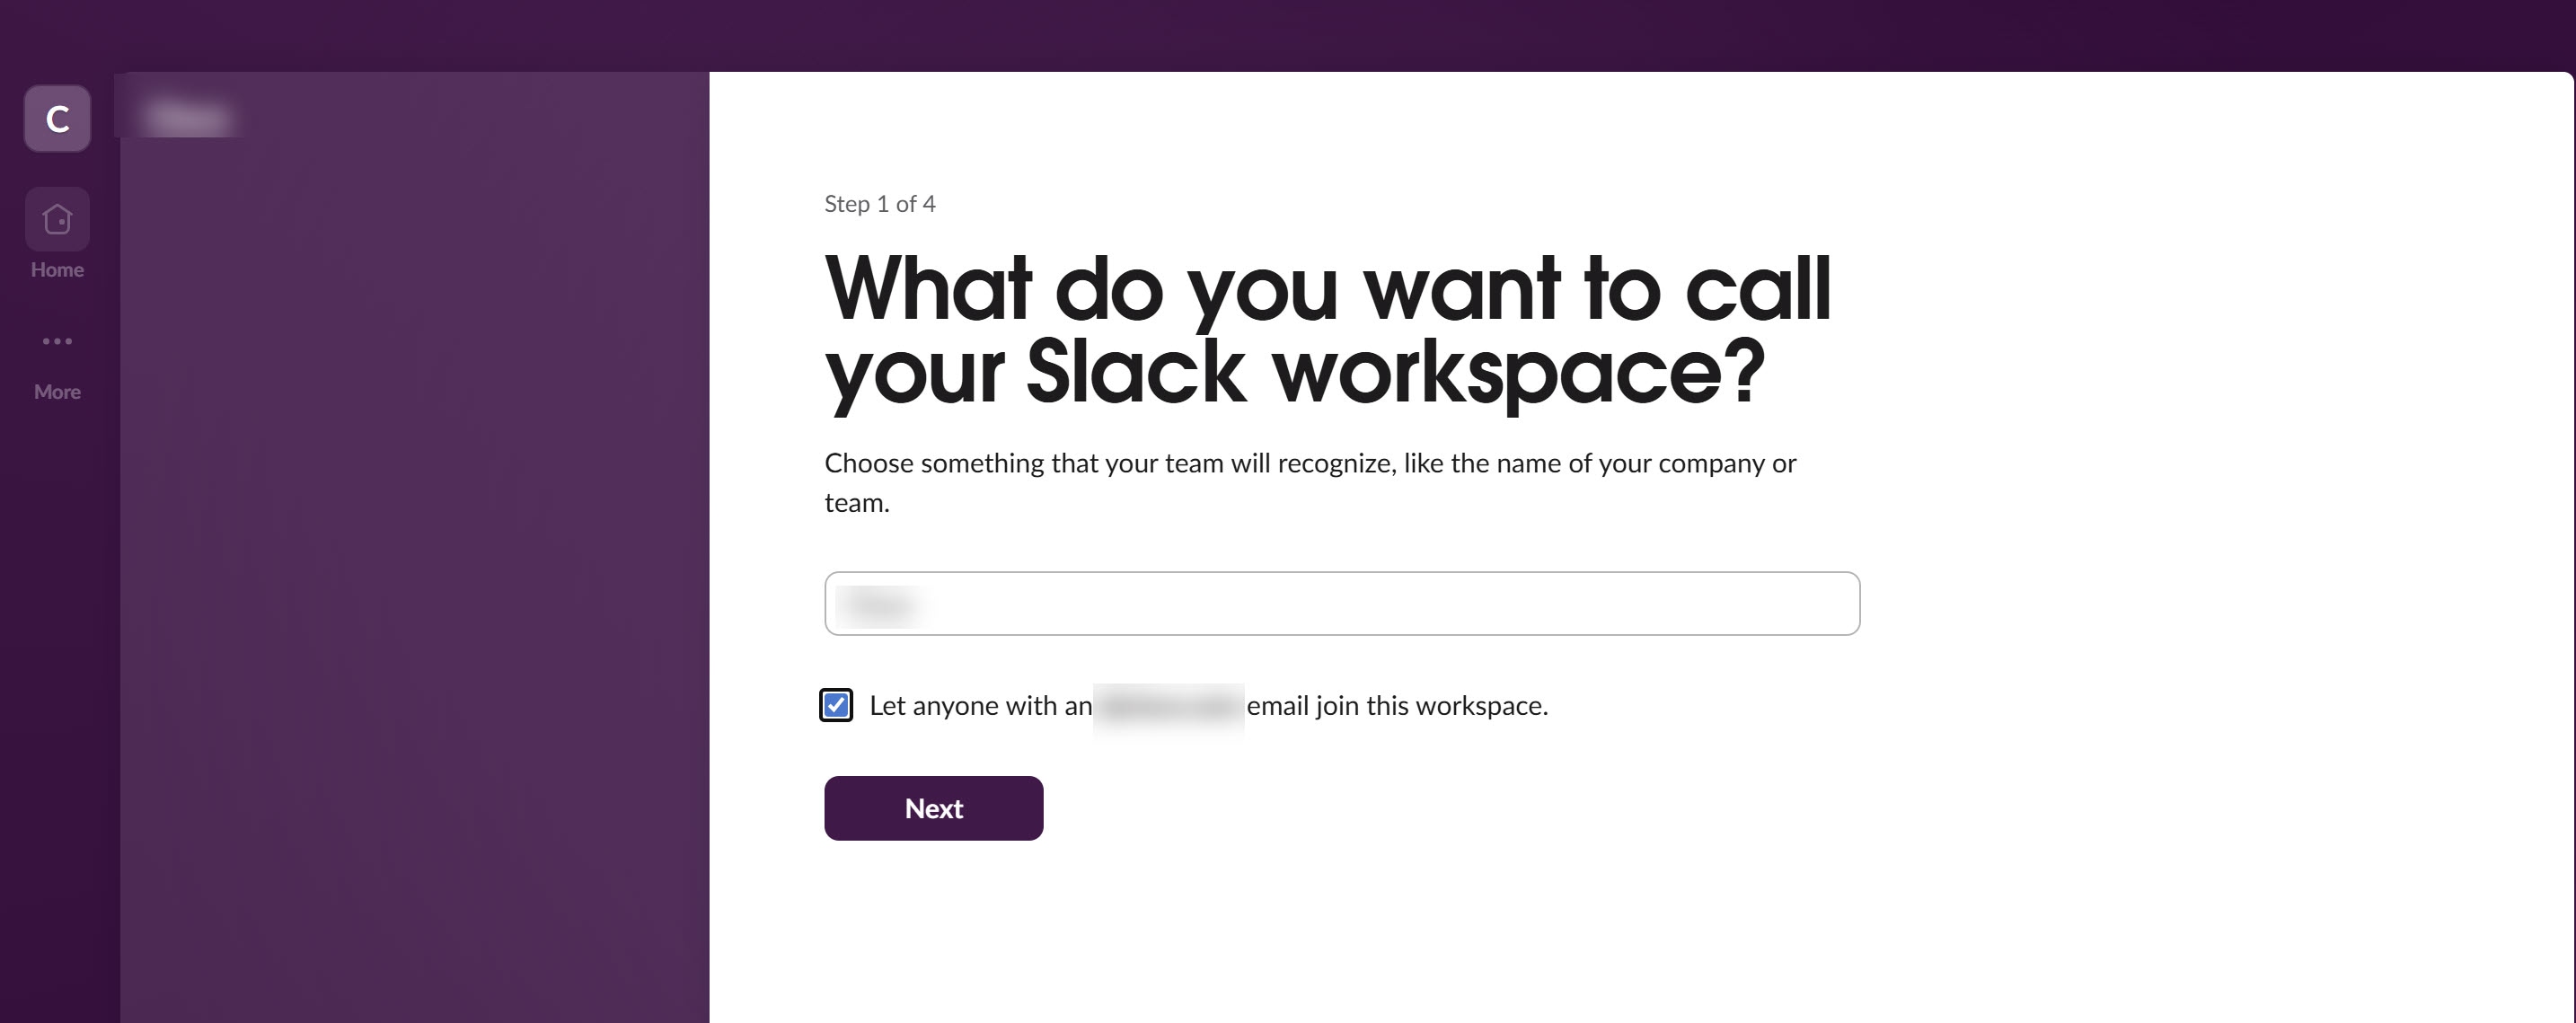
View Slack app settings dashboard
Follow these steps to view Slack app settings dashboard.
-
Navigate to the Slack API Portal: Go to Slack API: Your Apps.
-
Click the required app name to view the Slack app settings dashboard.
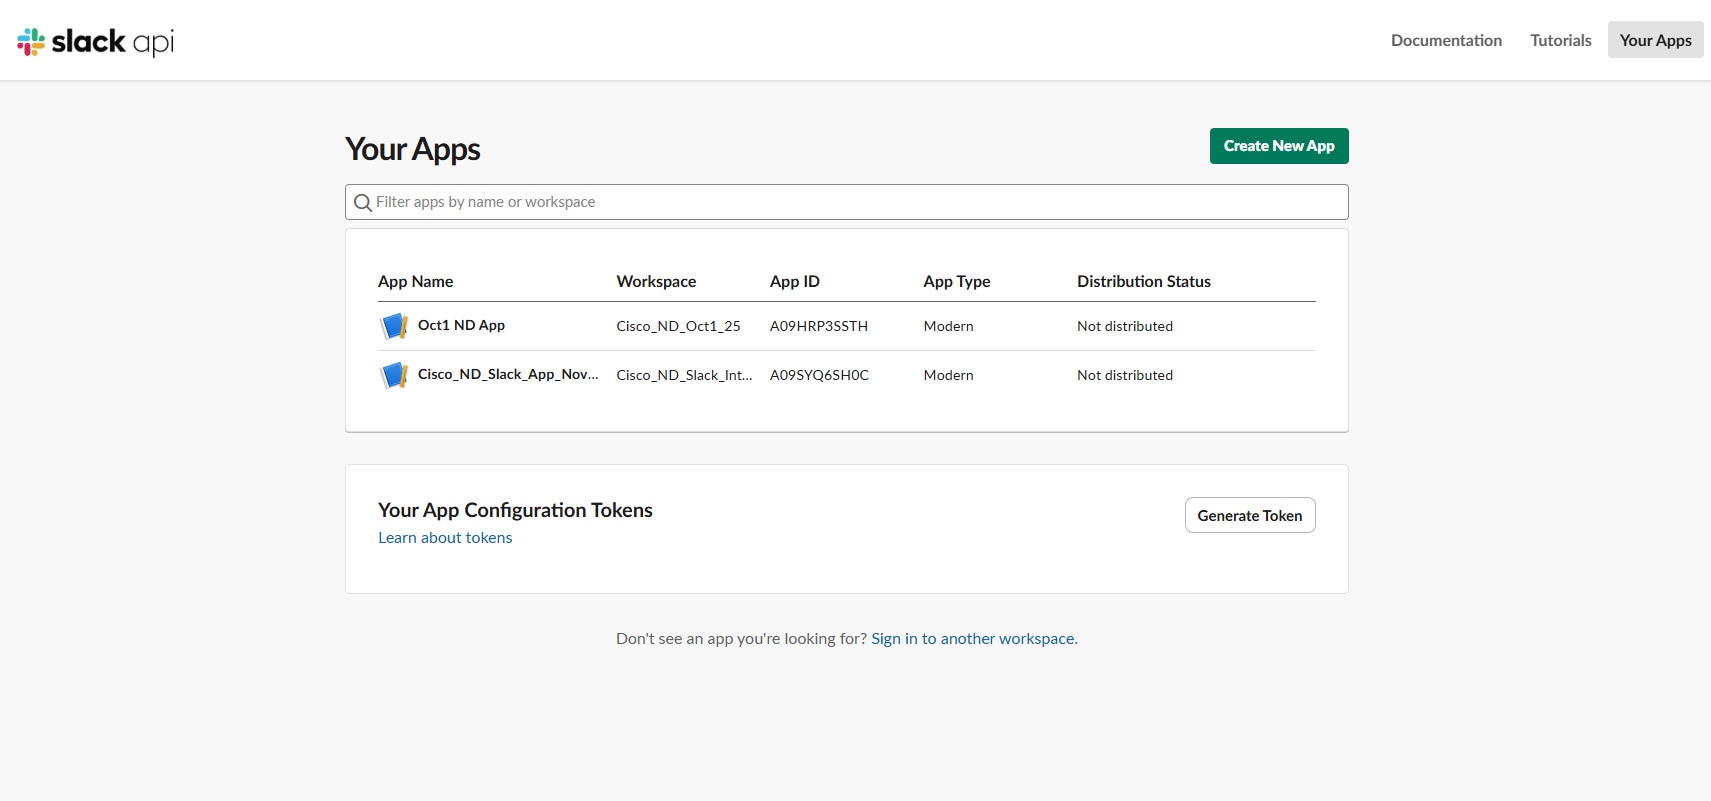
Create Slack app
Follow these steps to create and configure Slack app.
-
Navigate to the Slack API Portal: Go to Slack API: Your Apps.
-
Click Create New App.
The Create an app dialog box displays.
-
Choose one of the following options.
-
From a manifest
-
From scratch
-
Create Slack app from manifest
Follow these steps to create Slack app from a manifest file.
-
In the Create an app dialog box, choose From a manifest.
-
Choose a workspace to install Slack app.
-
Click Next.
The Create app from manifest dialog box containing basic info, scopes, settings, and features displays.
-
Choose the format (JSON or YAML) and paste the entire content of your manifest file into the text area.
For more information, see View app manifest.
-
Click Next.
-
Review the details and click Create to create Slack app.
The Slack app settings dashboard displays.
View app manifest
The app manifest displays the current configuration of your Slack app. You can change your basic information, settings, or feature configurations.
Follow these steps to view the app manifest
-
In the Slack app settings dashboard, go to App Manifest.
-
Choose the format (JSON or YAML) and copy the entire content of your manifest file.
Sample JSON manifest file
{
    "display_information": {
        "name": "Cisco_ND_Slack_App_Nov13"
    },
    "features": {
        "bot_user": {
            "display_name": "Cisco_ND_Slack_App_Nov13",
            "always_online": false
        },
        "slash_commands": [
            {
                "command": "/get_switch_health",
                "description": "gets switch health from Nexus Dashboard",
                "usage_hint": "fabricName* switchName* interfaceName severity startDate endDate maxResults",
                "should_escape": false
            },
            {
                "command": "/get_endpoint_location",
                "description": "gets endpoints data from Nexus Dashboard using ip or mac",
                "usage_hint": "endPointIpOrMacAddress* maxResults",
                "should_escape": false
            },
            {
                "command": "/get_link_util_alerts",
                "description": "Retrieves real-time link utilization alerts to monitor network traffic load",
                "should_escape": false
            },
            {
                "command": "/get_link_util_alert_details",
                "description": "Provides detailed information about specific link utilization alerts",
                "should_escape": false
            },
            {
                "command": "/get_switch_anomaly_details",
                "description": "Retrieves detailed anomaly reports detected on network switches",
                "should_escape": false
            }
        ]
    },
    "oauth_config": {
        "scopes": {
            "bot": [
                "commands"
            ]
        }
    },
    "settings": {
        "interactivity": {
            "is_enabled": true
        },
        "org_deploy_enabled": true,
        "socket_mode_enabled": true,
        "token_rotation_enabled": false
    }
}
Sample YAML manifest file
display_information:
  name: Cisco_ND_Slack_App_Nov13
features:
  bot_user:
    display_name: Cisco_ND_Slack_App_Nov13
    always_online: false
  slash_commands:
    - command: /get_switch_health
      description: gets switch health from Nexus Dashboard
      usage_hint: fabricName* switchName* interfaceName severity startDate endDate maxResults
      should_escape: false
    - command: /get_endpoint_location
      description: gets endpoints data from Nexus Dashboard using ip or mac
      usage_hint: endPointIpOrMacAddress* maxResults
      should_escape: false
    - command: /get_link_util_alerts
      description: Retrieves real-time link utilization alerts to monitor network traffic load
      should_escape: false
    - command: /get_link_util_alert_details
      description: Provides detailed information about specific link utilization alerts
      should_escape: false
    - command: /get_switch_anomaly_details
      description: Retrieves detailed anomaly reports detected on network switches
      should_escape: false
oauth_config:
  scopes:
    bot:
      - commands
settings:
  interactivity:
    is_enabled: true
  org_deploy_enabled: true
  socket_mode_enabled: true
  token_rotation_enabled: false
Create Slack app from scratch
Follow these steps to create Slack app from scratch.
-
In the Create an app dialog box, choose From scratch.
The Name app & choose workspace dialog box displays.
-
In the App Name field, provide a name for your Slack app.
-
Choose a workspace to install Slack app.
-
Click Create App.
Generate app-level token
You need app-level tokens to enable socket mode, which allows your Slack app to communicate with Slack using WebSockets.
Follow these steps to generate app-level token.
-
In the Slack app settings dashboard, go to Basic Information.
-
Scroll to App-Level Tokens and click Generate Token and Scopes.
The Generate an app-level token dialog box displays.
-
In the Token Name field, enter a name for your token.
-
Click Add Scope and choose
connections:write.
The
connections:writescope grants permission to generate WebSocket URIs and connect to socket mode.
-
Click Generate.
-
Copy the token.
This token is necessary to connect your app to Nexus Dashboard using WebSockets.
-
(Optional) Click Revoke, if you need to invalidate the token later.
Enable socket mode
The socket mode allows Nexus Dashboard to receive events and interactions directly from Slack over WebSockets, bypassing the need for public HTTP endpoints.
Follow these steps to enable socket mode in Slack app settings.
-
In the Slack app settings dashboard, go to Socket Mode.
-
Under Connect using Socket Mode, toggle the Enable Socket Mode option on.
Create slash commands
Slash commands allow you to interact with your app directly from Slack messages.
Follow these steps to create slash commands.
-
In the Slack app settings dashboard, go to Slash Commands.
-
Click Create New Command.
The Create New Command page displays.
-
Fill in the command details for each of your required commands.
-
Command — Provide the keyword, starting with a slash (/).
-
Short Description — Provide brief description of the command.
-
Usage Hint — (Optional) Provide help text for users. For mandatory parameters, add an asterisk (*) beside the parameter name (For example, *Username).
You can add one or more of the following commands as needed.
Slack slash commands Description Command parameters /get_link_util_alerts
Retrieves real-time link utilization alerts to monitor network traffic load.
-
fabricName*
-
switchName*
-
interfaceName
-
severity
-
startDate
-
endDate
-
maxResults
/get_link_util_alert_details
Provides detailed information about specific link utilization alerts.
-
fabricName*
-
anomalyId*
-
startDate*
-
endDate*
/get_switch_health
Performs an on-demand health check of network switches to assess device status.
-
fabricName*
-
switchName*
-
severity
-
startDate
-
endDate
-
maxResults
-
If a severity level is specified, the function returns anomalies with that severity. If there are no anomalies matching the specified severity, it returns "no data found". If no severity is specified, the function returns anomalies of all severity levels.
-
If the maxResults parameter is not specified, the function returns all results.
-
/get_switch_anomaly_details
Retrieves detailed anomaly reports detected on network switches.
-
fabricName*
-
anomalyId*
-
startDate*
-
endDate*
/get_endpoint_location
Searches for the location of an end host within the network.
-
endPointIpOrMacAddress*
-
maxResults
-
If maxResults is not specified, the function returns all results.
-
The maxResults parameter limits the number of returned IP or MAC addresses associated with the input address.
-
-
The asterisk (*) indicates a mandatory (non-empty) input parameter.
-
Parameters without an asterisk (*) are optional. You can leave optional parameters empty by using empty single quotes (' ').
-
All command parameters are strings except for
maxResults, which is an integer. -
Provide the input dates in the following formats.
-
Dates are in ISO 8601 formats as follows.
-
YYYY-MM-DDTHH:MM:SSZ -
YYYY-MM-DDTHH:MM:SS±hh:mm
-
-
You can also specify the start and end dates as
now-7h/d/wornow.-
now-7hindicates hours,dindicates days, andwindicates weeks. If you omit the unit (For example,now-7), the system interprets it as now minus 7 days.
-
-
If you do not provide input dates, the system sets the start date to
now-2hand end date tonow.
-
-
-
-
Click Save.
-
Repeat steps 2-4 for each command you want to configure.
You can configure as many slash commands as needed, with each command pointing to the appropriate endpoint.
After you complete the setup, install the app to your Slack workspace from the OAuth & Permissions section in the Slack app settings dashboard.
Enable org readiness
Follow these steps to enable readiness.
-
In the Slack app settings dashboard, navigate to Org Level Apps.
-
Click Enable org-readiness.
Set up Slack integration in Nexus Dashboard
Add Slack CA certificate
Before you integrate Slack with Nexus Dashboard, you must add the Slack CA certificate to ensure secure communication between Nexus Dashboard and Slack.
Configure the proxy settings before you add a Slack CA certificate. For more information on configuring proxy settings, see Proxy configuration. You need to configure an HTTPS proxy only on Nexus Dashboard setups that use a proxy for external connectivity.
Follow these steps to add Slack CA certificate.
-
Navigate to Admin > Integrations.
-
If there are no existing integrations, click Add integration.
The Add integration page displays.
-
Under Integration type, go to Bot integration > Slack.
-
Click Before adding integration, add a Slack CA Certificate here.
The Certificate Management page displays.
You can also go to the Certificate Management page by navigating to Admin > Certificate Management.
-
Click the CA certificates tab.
-
From the Actions drop-down list, choose Add CA certificate.
The Add CA certificate page displays.
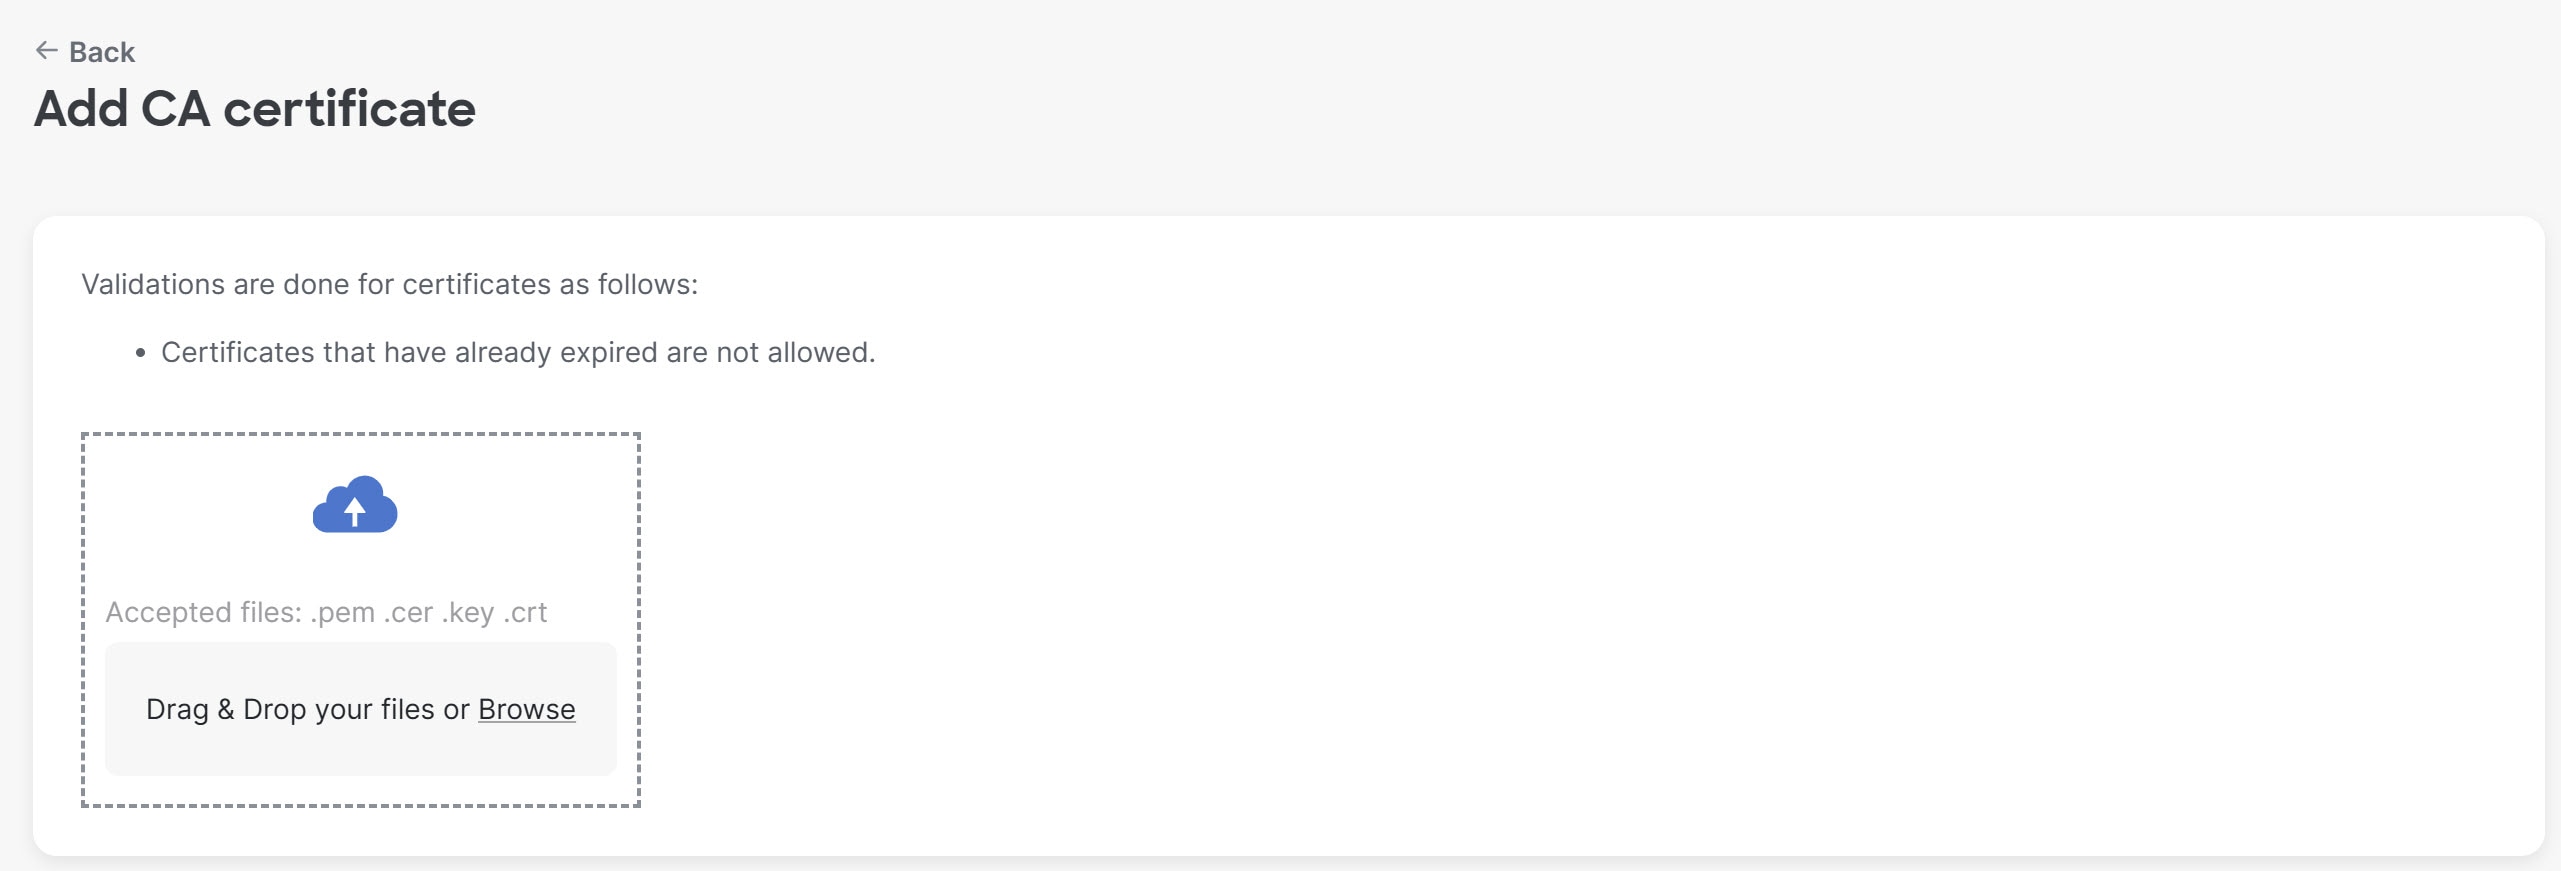
You can download the Slack CA certificate from Slack.com. The certificate is downloaded in Privacy Enhanced Mail (PEM) format from ISRG Root X1.
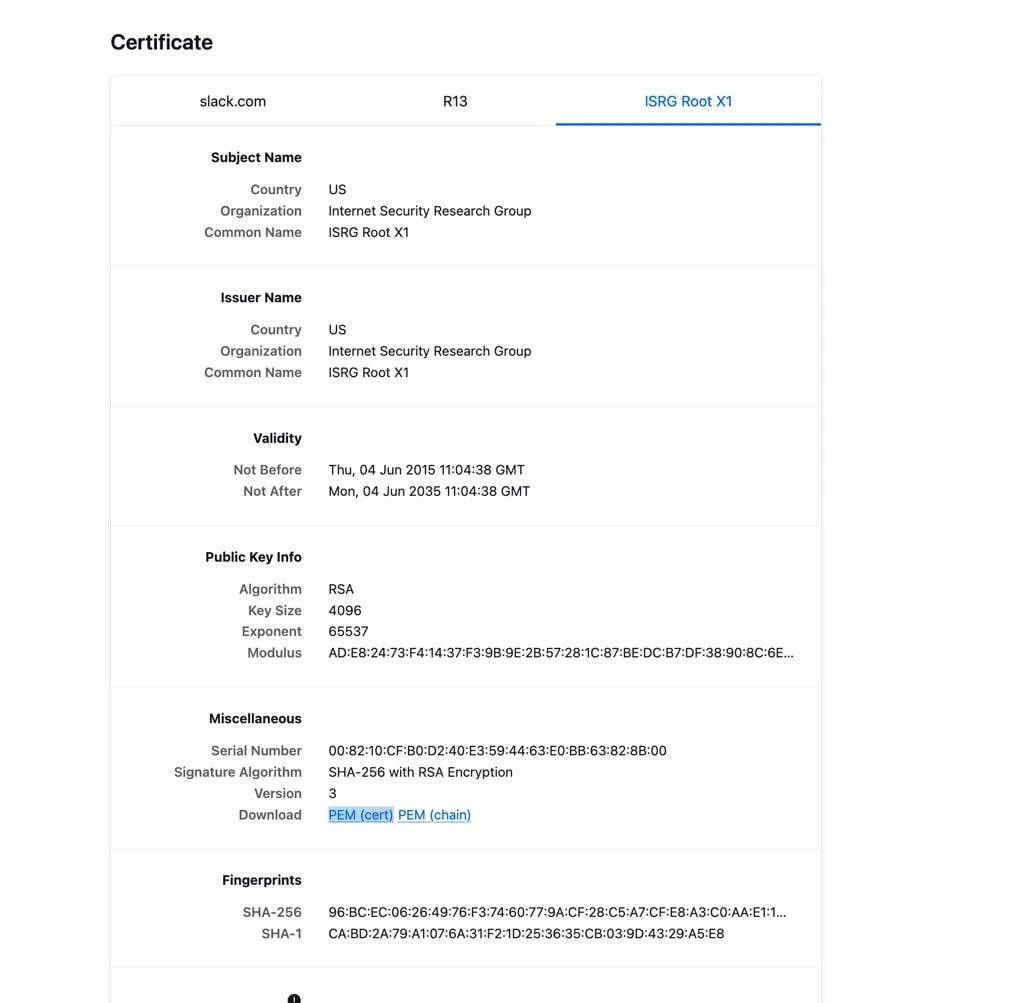
-
You can drag and drop your Slack CA certificate files or click Browse to locate and choose the Slack certificate files from your device.
-
Click Save.
The CA certificate that you added appears in the certificates table on the Certificate Management page.
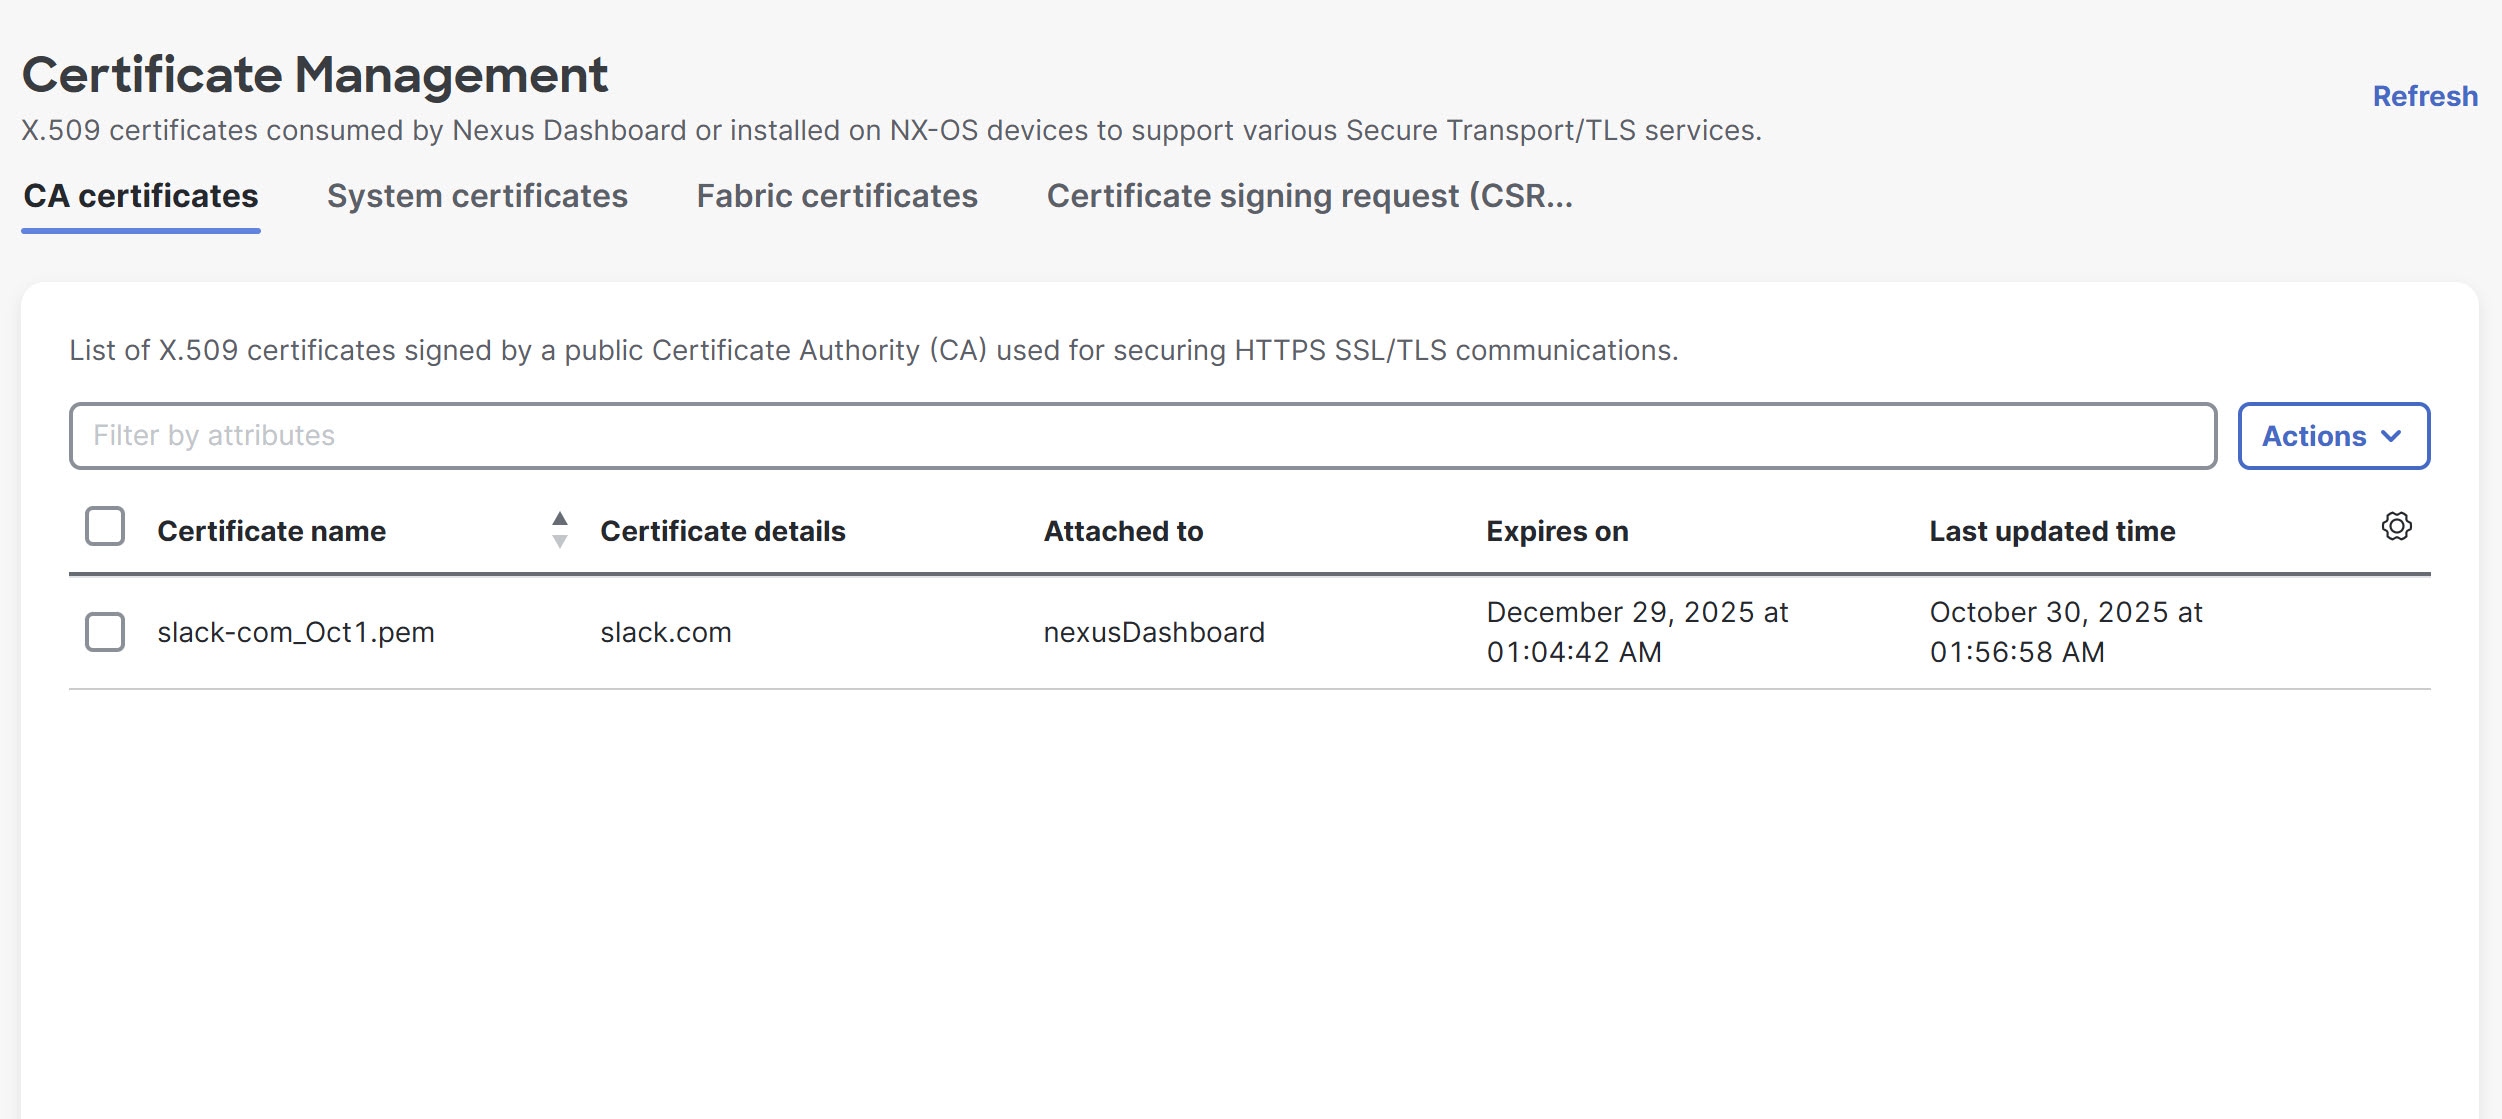
Guidelines and limitations of CA certificate
-
When you renew a CA certificate, Nexus Dashboard issues a new server certificate. Client applications, including the Slack integration, must trust this new certificate.
-
For WebSocket connections (used by Slack integration), Nexus Dashboard explicitly checks the validity of the CA certificate during connection. A CA certificate renewal triggers a reconnection attempt to ensure secure communication.
-
Nexus Dashboard reconnects to Slack after you renew the CA certificate or change HTTPS proxy settings only if it is currently disconnected and attempting to reconnect, or during specific integration events (such as when Slack disconnects due to a stale certificate, or when a super admin disables and re-enables the Slack integration).
-
If Nexus Dashboard is already connected to Slack, removing the CA certificate or HTTPS proxy does not immediately disconnect it. Nexus Dashboard only attempts to reconnect when it needs to re-establish the Slack integration.
Add Slack integration
Slack integration allows Nexus Dashboard to communicate and collaborate with Slack channels. To establish secure and seamless communication, you must configure the Slack app with the appropriate tokens and authorizations.
Follow these steps to add Slack integration.
-
Navigate to Admin > Integrations.
-
If there are no existing integrations, click Add integration.
The Add integration page displays.
-
Under Integration type, go to Bot integration > Slack.
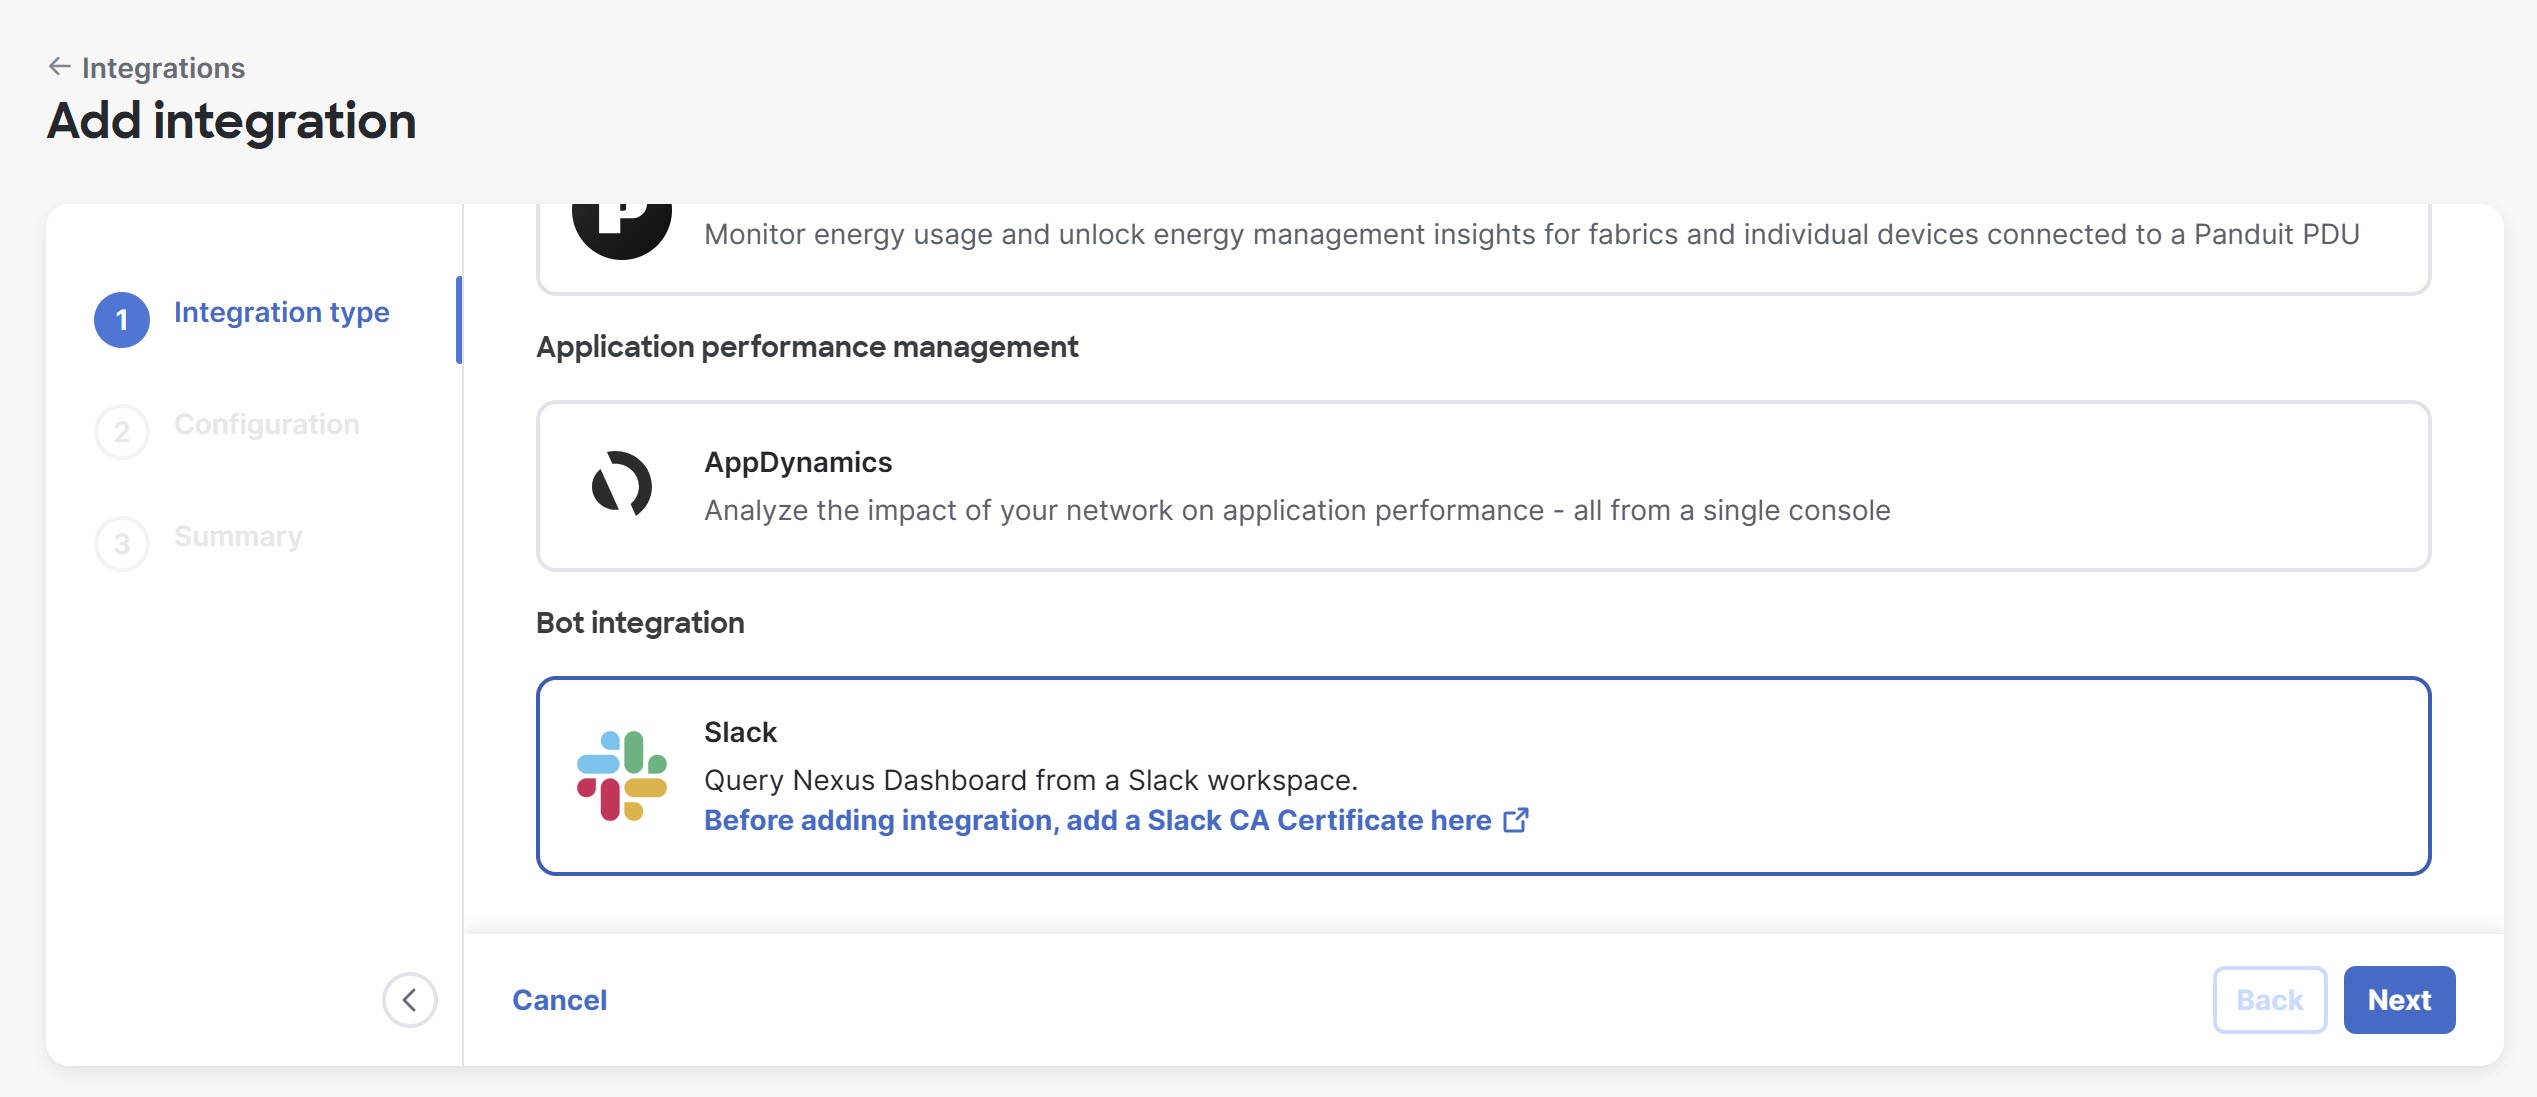
-
Click Next.
The Configuration page displays.
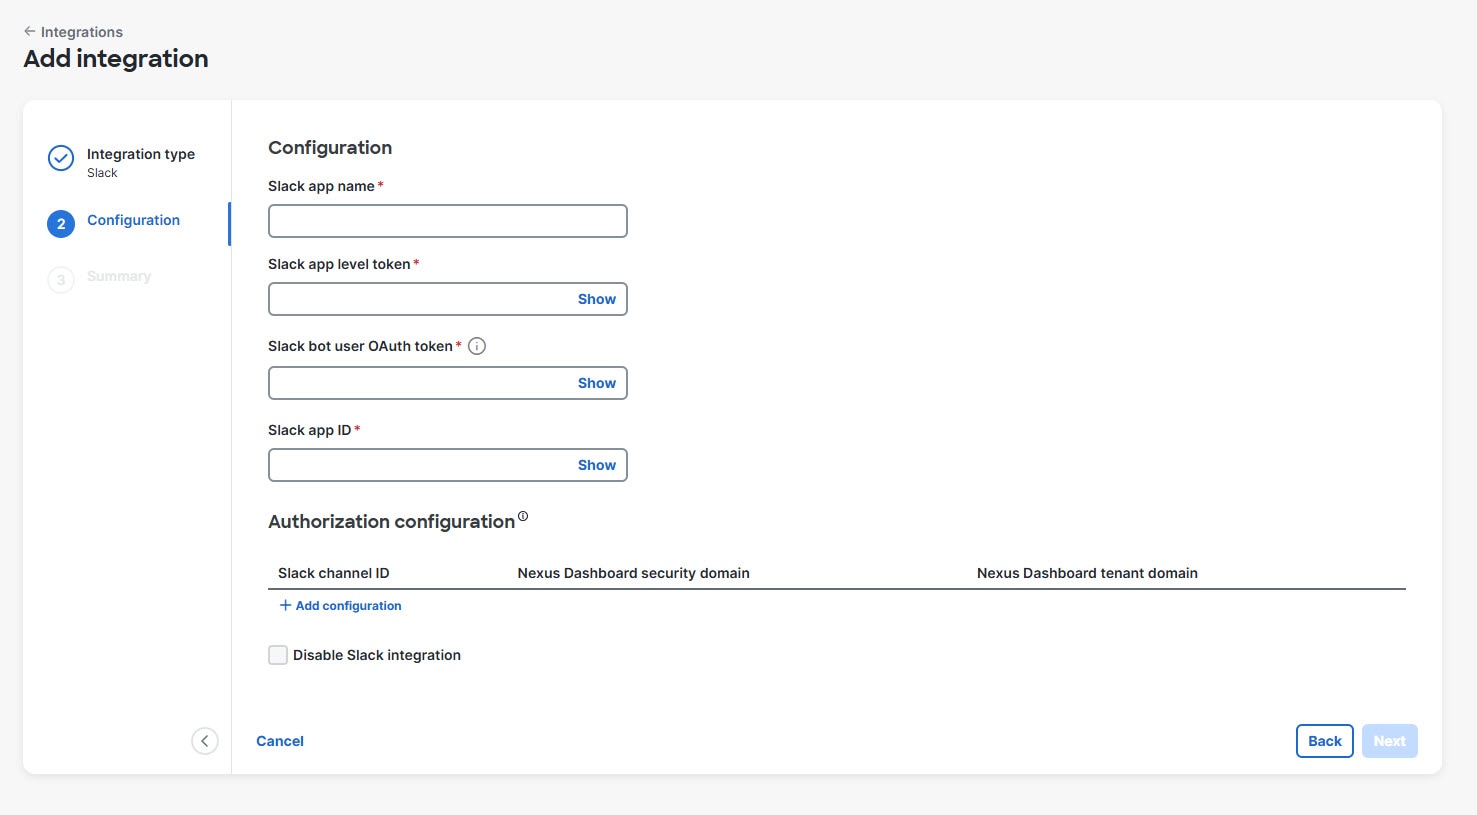
-
In the Slack app name field, provide the name of the Slack app.
-
In the Slack app level token field, enter the Slack app level token.
This is the token that you generate in Slack app and is essential for Nexus Dashboard to authenticate with Slack and establish a WebSocket connection for real-time communication. For more information, see Generate app-level token.
If the Slack app level token is invalid, Nexus Dashboard displays an error message and prevents further setup until you provide a valid token.
-
In the Slack bot user OAuth token field, provide the OAuth token.
This token is automatically generated when you install the Slack app and is required to authorize uploading files to Slack from Nexus Dashboard. To get the OAuth token, in the Slack app settings dashboard go to OAuth & Permissions and copy the token under Bot User OAuth Token field.
-
In the Slack app ID field, enter the Slack app ID.
You can get the Slack app ID from the Slack app settings dashboard under Basic Information.
-
Under Authorization configuration, click Add configuration to configure the following parameters.
-
Slack channel ID — Obtain this from your Slack app for the channel where notifications will be sent.
-
Nexus Dashboard security domain — Specify the relevant security domain.
-
Nexus Dashboard tenant domain — Specify the tenant domain.
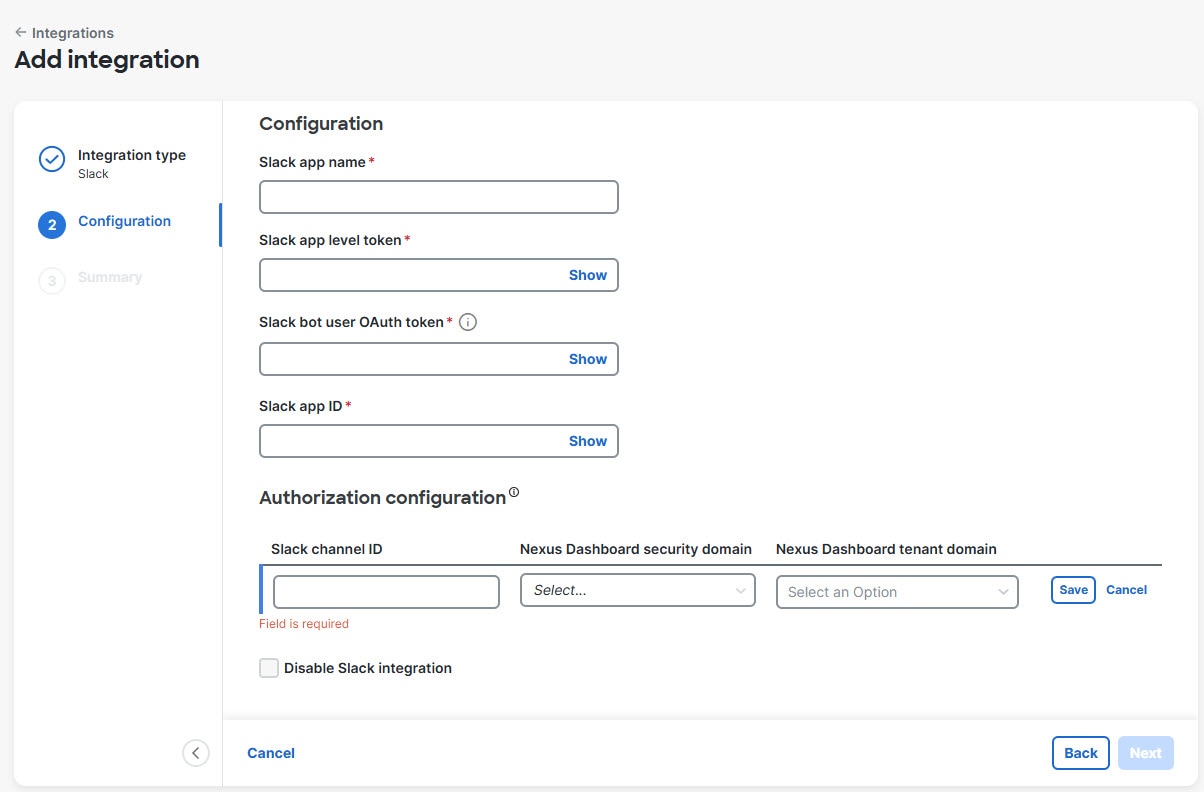
You must configure at least one and no more than four Slack channel IDs. When you add a fourth channel, the system disables the option to add new channels. Authorize each channel ID for one or more security domains and one tenant domain.
-
-
Optionally, check the Disable Slack integration check box to temporarily suspend the integration. This option is disabled when you add integration for the first time.
-
Click Next.
The Summary page displays.
-
Review the summary and click Save to complete the integration setup.
Query using Slack slash commands
Once the integration setup is complete, you can use the slash commands directly within Slack to query.
As a sample query to test your Slack integration, you can use the following command to query an endpoint.
/get_endpoint_location <identifier> [maxResults]
-
<identifier>— This is a mandatory parameter. It can be either the IP address or the MAC address of the network endpoint you wish to query. -
[maxResults]— This is an optional parameter. It specifies the maximum number of endpoint records to return. However, you cannot omit optional parameters. If you do not want to provide a value, enter ("). The system defaults to returning a single, most relevant result. If you omit the parameter entirely, the Slack app displays a message indicating that the number of parameters is incorrect.
For example, to query for an endpoint with the IP address 9.1.201.158 and retrieve a result, provide the following command.
/get_endpoint_location 9.1.201.158 1
When you execute the command, you receive a comprehensive JSON-formatted response containing various details about the endpoint.
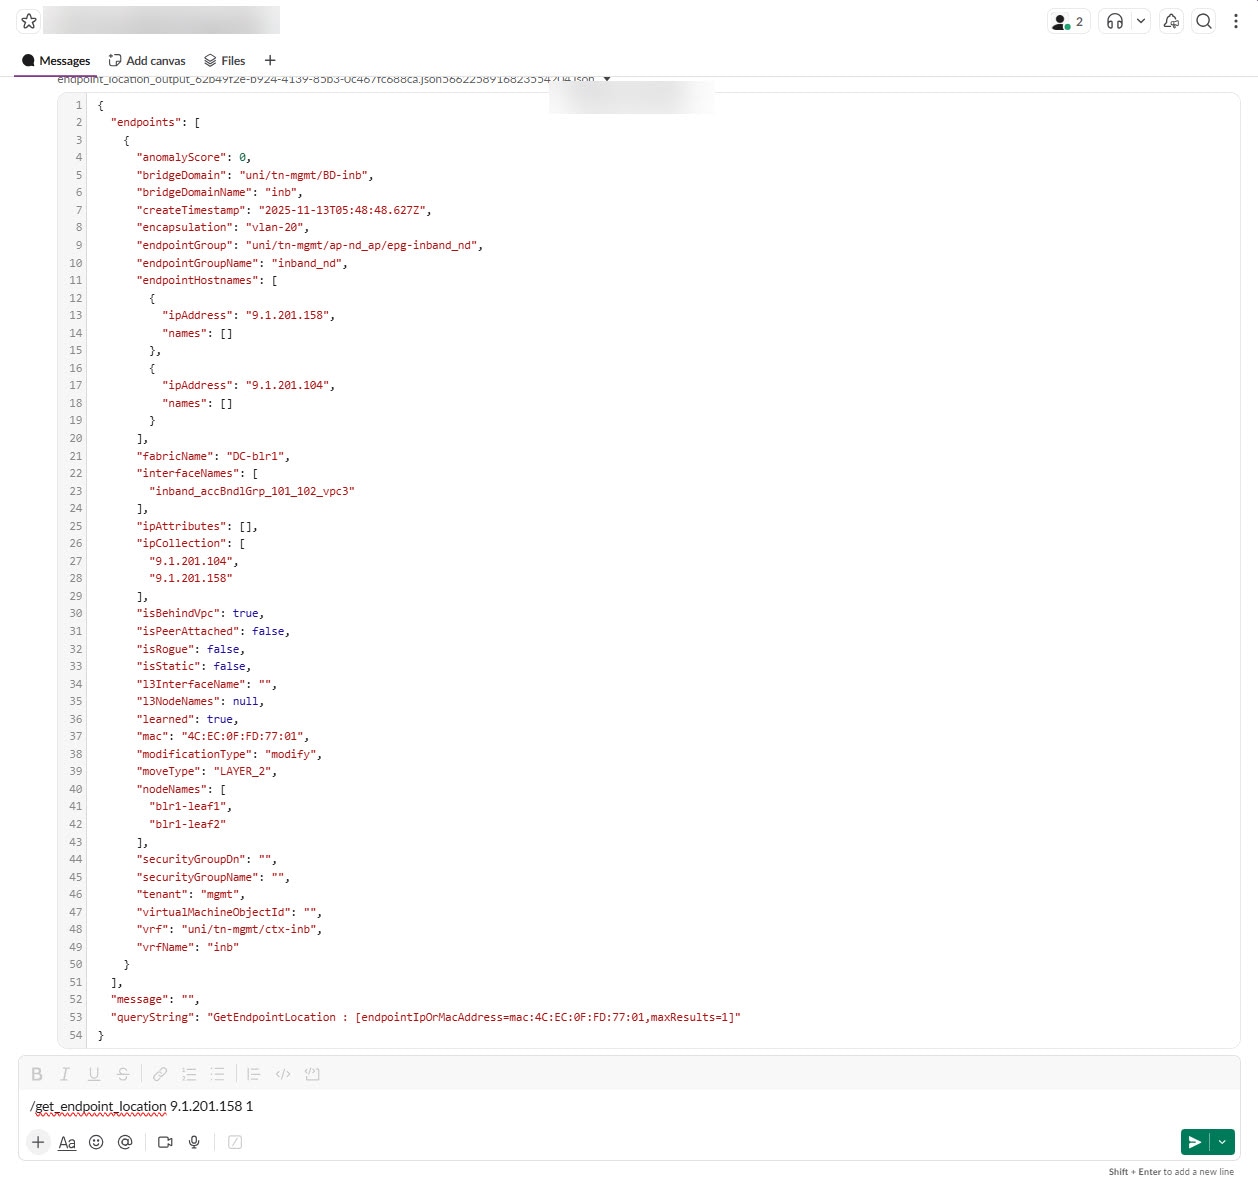
Troubleshoot Slack integration
This section provides guidance on resolving common anomalies that may arise with your Slack integration on Nexus Dashboard.
You can find the anomalies related to Slack integration in Nexus Dashboard under system anomalies. For more information, see View platform and system alerts in global anomalies table.
| Anomaly | Category | Impact | How to fix it? |
|---|---|---|---|
|
Nexus Dashboard fails to connect to Slack using WebSocket connection (Severity: CRITICAL). |
System |
Nexus Dashboard loses its connection to the Slack app and prevents queries. |
|
|
Nexus Dashboard fails to upload files to Slack (Severity: MAJOR). |
System |
Users do not receive query results for large data sets. However, users can view small query results directly in Slack. |
|
Copyright
THE SPECIFICATIONS AND INFORMATION REGARDING THE PRODUCTS IN THIS MANUAL ARE SUBJECT TO CHANGE WITHOUT NOTICE. ALL STATEMENTS, INFORMATION, AND RECOMMENDATIONS IN THIS MANUAL ARE BELIEVED TO BE ACCURATE BUT ARE PRESENTED WITHOUT WARRANTY OF ANY KIND, EXPRESS OR IMPLIED. USERS MUST TAKE FULL RESPONSIBILITY FOR THEIR APPLICATION OF ANY PRODUCTS.
THE SOFTWARE LICENSE AND LIMITED WARRANTY FOR THE ACCOMPANYING PRODUCT ARE SET FORTH IN THE INFORMATION PACKET THAT SHIPPED WITH THE PRODUCT AND ARE INCORPORATED HEREIN BY THIS REFERENCE. IF YOU ARE UNABLE TO LOCATE THE SOFTWARE LICENSE OR LIMITED WARRANTY, CONTACT YOUR CISCO REPRESENTATIVE FOR A COPY.
The Cisco implementation of TCP header compression is an adaptation of a program developed by the University of California, Berkeley (UCB) as part of UCB’s public domain version of the UNIX operating system. All rights reserved. Copyright © 1981, Regents of the University of California.
NOTWITHSTANDING ANY OTHER WARRANTY HEREIN, ALL DOCUMENT FILES AND SOFTWARE OF THESE SUPPLIERS ARE PROVIDED “AS IS" WITH ALL FAULTS. CISCO AND THE ABOVE-NAMED SUPPLIERS DISCLAIM ALL WARRANTIES, EXPRESSED OR IMPLIED, INCLUDING, WITHOUT LIMITATION, THOSE OF MERCHANTABILITY, FITNESS FOR A PARTICULAR PURPOSE AND NONINFRINGEMENT OR ARISING FROM A COURSE OF DEALING, USAGE, OR TRADE PRACTICE.
IN NO EVENT SHALL CISCO OR ITS SUPPLIERS BE LIABLE FOR ANY INDIRECT, SPECIAL, CONSEQUENTIAL, OR INCIDENTAL DAMAGES, INCLUDING, WITHOUT LIMITATION, LOST PROFITS OR LOSS OR DAMAGE TO DATA ARISING OUT OF THE USE OR INABILITY TO USE THIS MANUAL, EVEN IF CISCO OR ITS SUPPLIERS HAVE BEEN ADVISED OF THE POSSIBILITY OF SUCH DAMAGES.
Any Internet Protocol (IP) addresses and phone numbers used in this document are not intended to be actual addresses and phone numbers. Any examples, command display output, network topology diagrams, and other figures included in the document are shown for illustrative purposes only. Any use of actual IP addresses or phone numbers in illustrative content is unintentional and coincidental.
The documentation set for this product strives to use bias-free language. For the purposes of this documentation set, bias-free is defined as language that does not imply discrimination based on age, disability, gender, racial identity, ethnic identity, sexual orientation, socioeconomic status, and intersectionality. Exceptions may be present in the documentation due to language that is hardcoded in the user interfaces of the product software, language used based on RFP documentation, or language that is used by a referenced third-party product.
Cisco and the Cisco logo are trademarks or registered trademarks of Cisco and/or its affiliates in the U.S. and other countries. To view a list of Cisco trademarks, go to this URL: https://www.cisco.com/go/trademarks. Third-party trademarks mentioned are the property of their respective owners. The use of the word partner does not imply a partnership relationship between Cisco and any other company. (1110R)
© 2017-2026 Cisco Systems, Inc. All rights reserved.
Americas Headquarters
Cisco Systems, Inc.
170 West Tasman Drive
San Jose, CA 95134-1706
USA
https://www.cisco.com
Tel: 408 526-4000
800 553-NETS (6387)
Fax: 408 527-0883