
New and changed information
The following table provides an overview of the significant changes up to this current release. The table does not provide an exhaustive list of all changes or of the new features up to this release.
| Release Version | Feature | Description |
|---|---|---|
|
Nexus Dashboard 4.2.1 |
Nexus Data Broker integration |
Beginning with release 4.2.1, Nexus Dashboard supports a new fabric type dedicated to Data Broker networks. You can also configure and manage SPAN settings for Data Broker switches directly within Nexus Dashboard, which enhances connectivity and monitoring capabilities. |
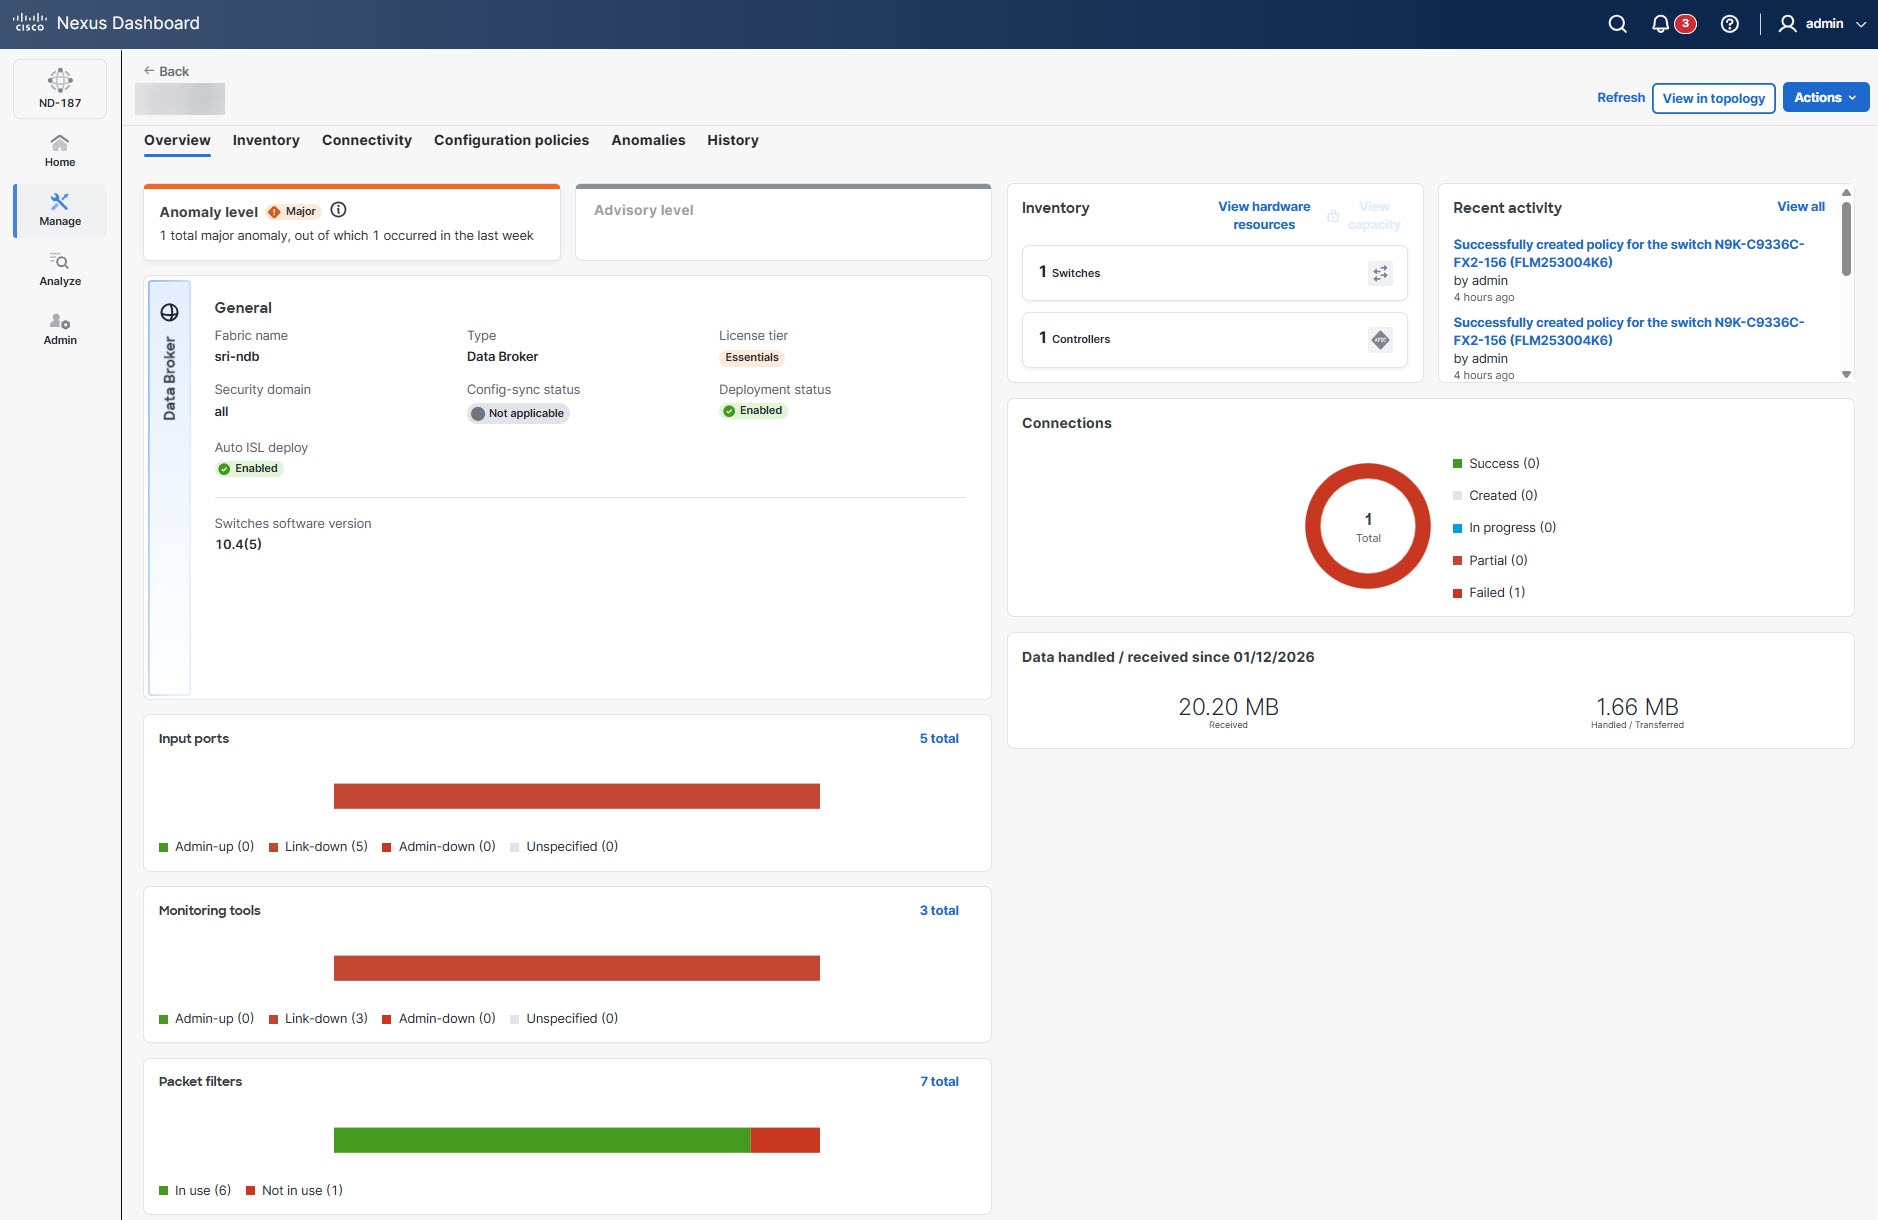
The Fabrics page provides a centralized view of Nexus Data Broker (NDB) operations, inventory health, connectivity metrics, configuration, and operational status of the network monitoring infrastructure.
The Fabrics page includes the following tabs.
Overview
The Overview tab provides a summary of the health and status of the NDB fabric. You can also view the anomaly level, general fabric details (such as software versions and license tier), inventory summaries, and real-time status of input ports, monitoring tools, and packet filters. It also tracks data throughput and recent administrative activity.
Follow these steps to navigate to the Overview tab.
-
Navigate to the Fabrics page .
Go to Manage > Fabrics.
-
From the Fabrics table, click an NDB fabric.
The Fabrics page displays.
-
Click the Overview tab.
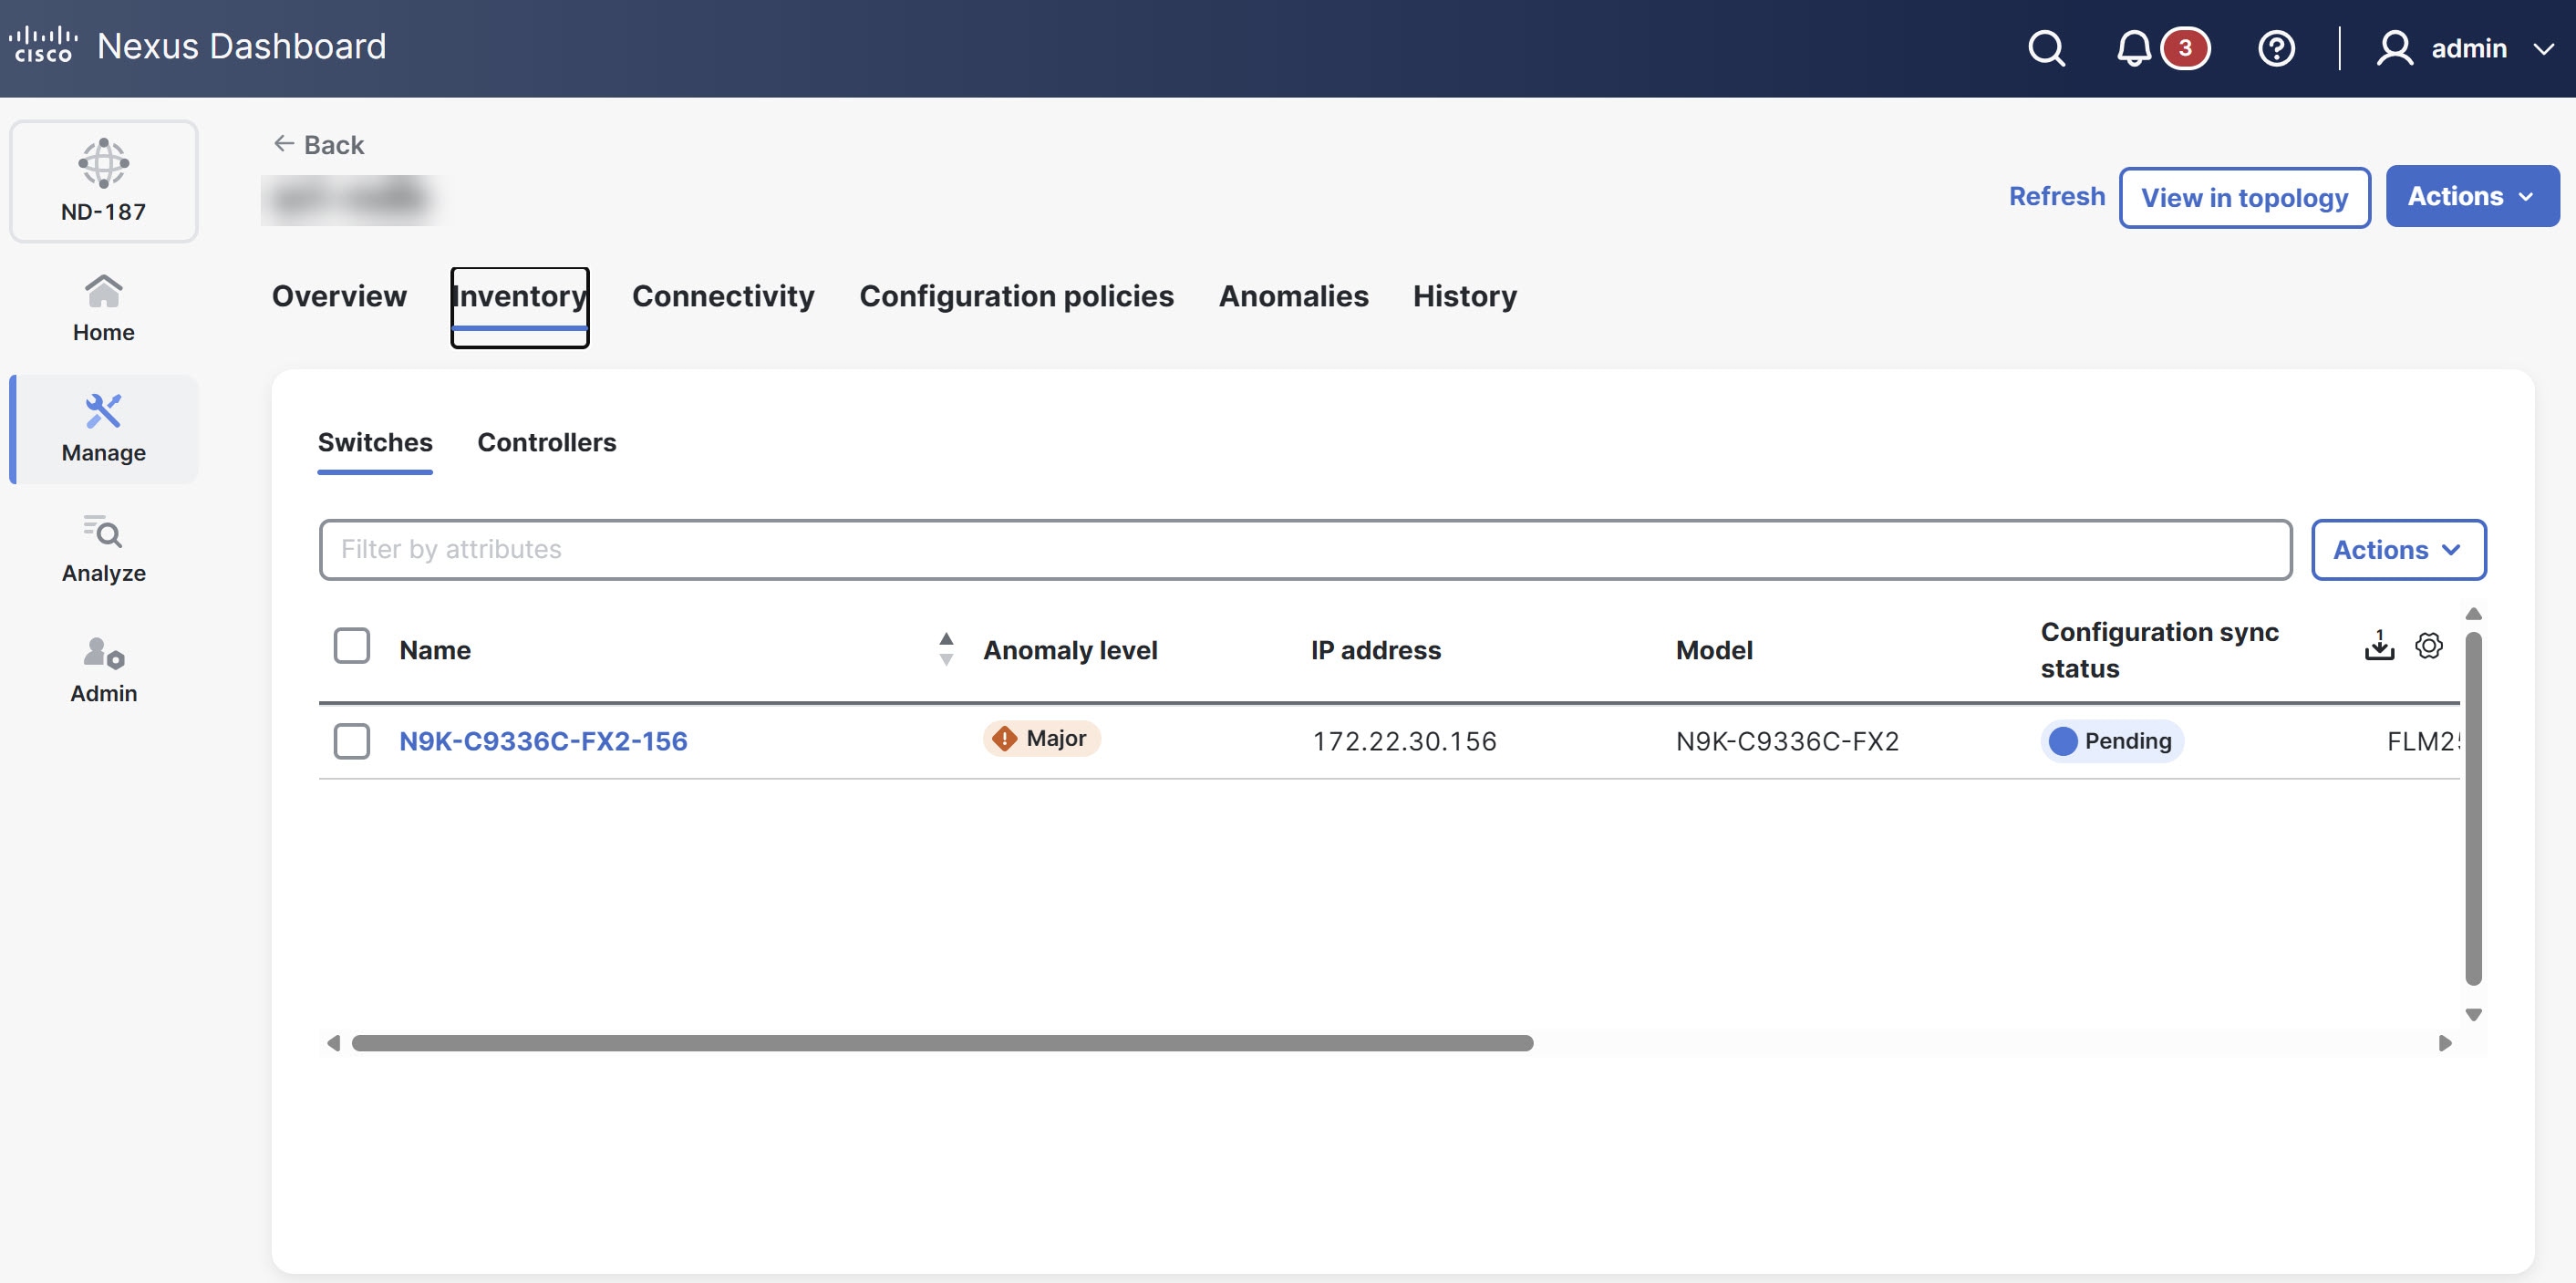
Inventory
The Inventory tab lists all hardware assets managed within the NDB fabric including switches and controllers. It allows you to monitor hardware resources, view capacity, and verify the operational status of each device in the network.
Follow these steps to navigate to the Inventory tab.
-
Navigate to the Fabrics page .
Go to Manage > Fabrics.
-
From the Fabrics table, click an NDB fabric.
The Fabrics page displays.
-
In the Fabrics page, click the Inventory tab.
The Inventory tab displays the following tabs.
-
Switches
-
Controllers
Switches
Cisco Nexus series devices act as programmable packet brokers within the network monitoring infrastructure in the NDB fabric. These switches aggregate, filter, replicate, and forward copies of production traffic from TAP or SPAN sources to monitoring and security tools. Switches enable scalable TAP and SPAN aggregation, redirect inline traffic, and provide advanced traffic management features such as packet truncation, time stamping, and tag stripping.
The Switches table provides the following information.
| Field | Description |
|---|---|
|
Name |
Specifies the name of the switch. |
|
Anomaly level |
Displays the anomaly level of the switch, classified as Critical, Major, or Warning based on operational issues. |
|
IP address |
Specifies the IP address of the switch. |
|
Model |
Specifies the switch model. |
|
Configuration sync status |
Indicates whether the switch configuration is In-Sync or Out of sync. |
|
Serial number |
Specifies the serial number of the switch. |
|
Discovery status |
Indicates the discovery status of the switch, such as Discovering, Ok, Rediscovering, Unreachable, or Paused. The status is set to Paused when you enable Pause mode (Go to Actions > Pause). |
|
Mode |
Specifies whether the switch is in Normal, Migration, or Maintenance mode. |
|
Software version |
Specifies the software version running on the switch. |
|
Uptime |
Specifies the time the switch has been operational since last reboot. |
Configure switches
Follow these steps to configure the switches.
-
Navigate to the Fabrics page.
Go to Manage > Fabrics.
-
From the Fabrics table, click an NDB fabric.
The Fabrics page displays.
-
In the Fabrics page, click the Inventory tab.
-
Click the Switches tab.
-
Choose a switch.
-
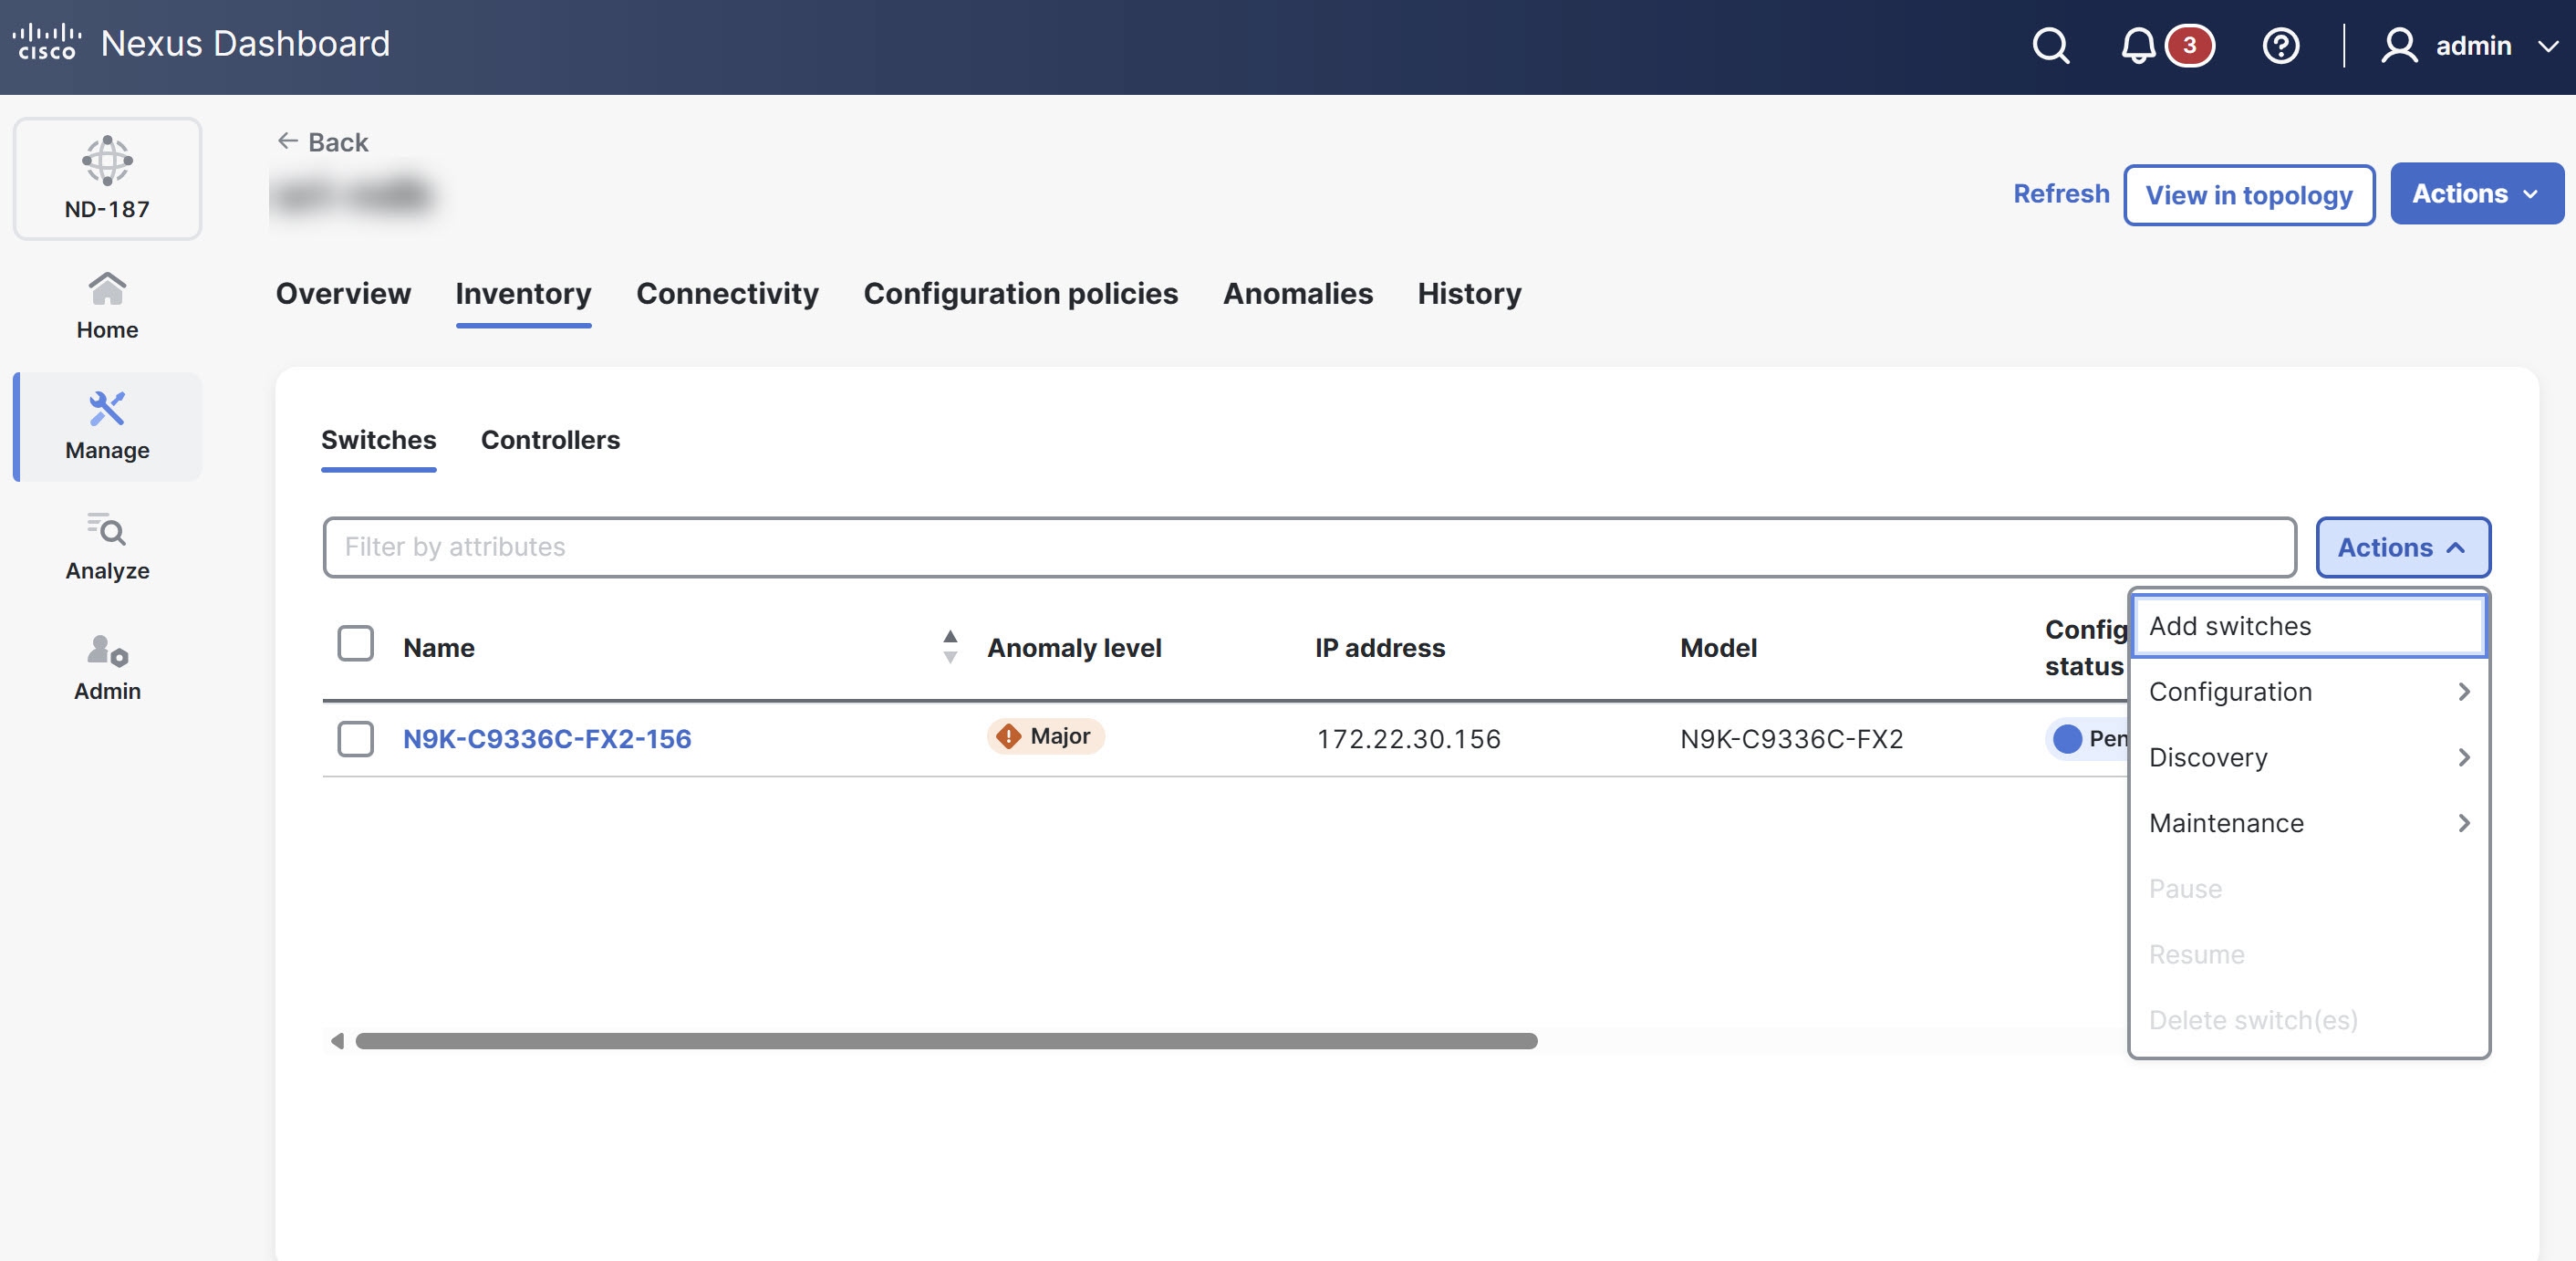
From the Actions drop-down list, choose one of the following options.
-
Add switches — allows you to add switches to the fabric. For more information, see Add switches.
-
Configuration — allows you to preview generated configurations or deploy configurations to the switch.
-
Discovery — allows you to trigger discovery processes for the chosen device.
-
Maintenance — provides options for operational tasks such as reboots or firmware management.
-
Pause/Resume — temporarily stops or restarts management/monitoring of the switch.
-
Delete switch(s) — removes the device from the fabric inventory.
-
For more information, see Working with Inventory in Your Nexus Dashboard.
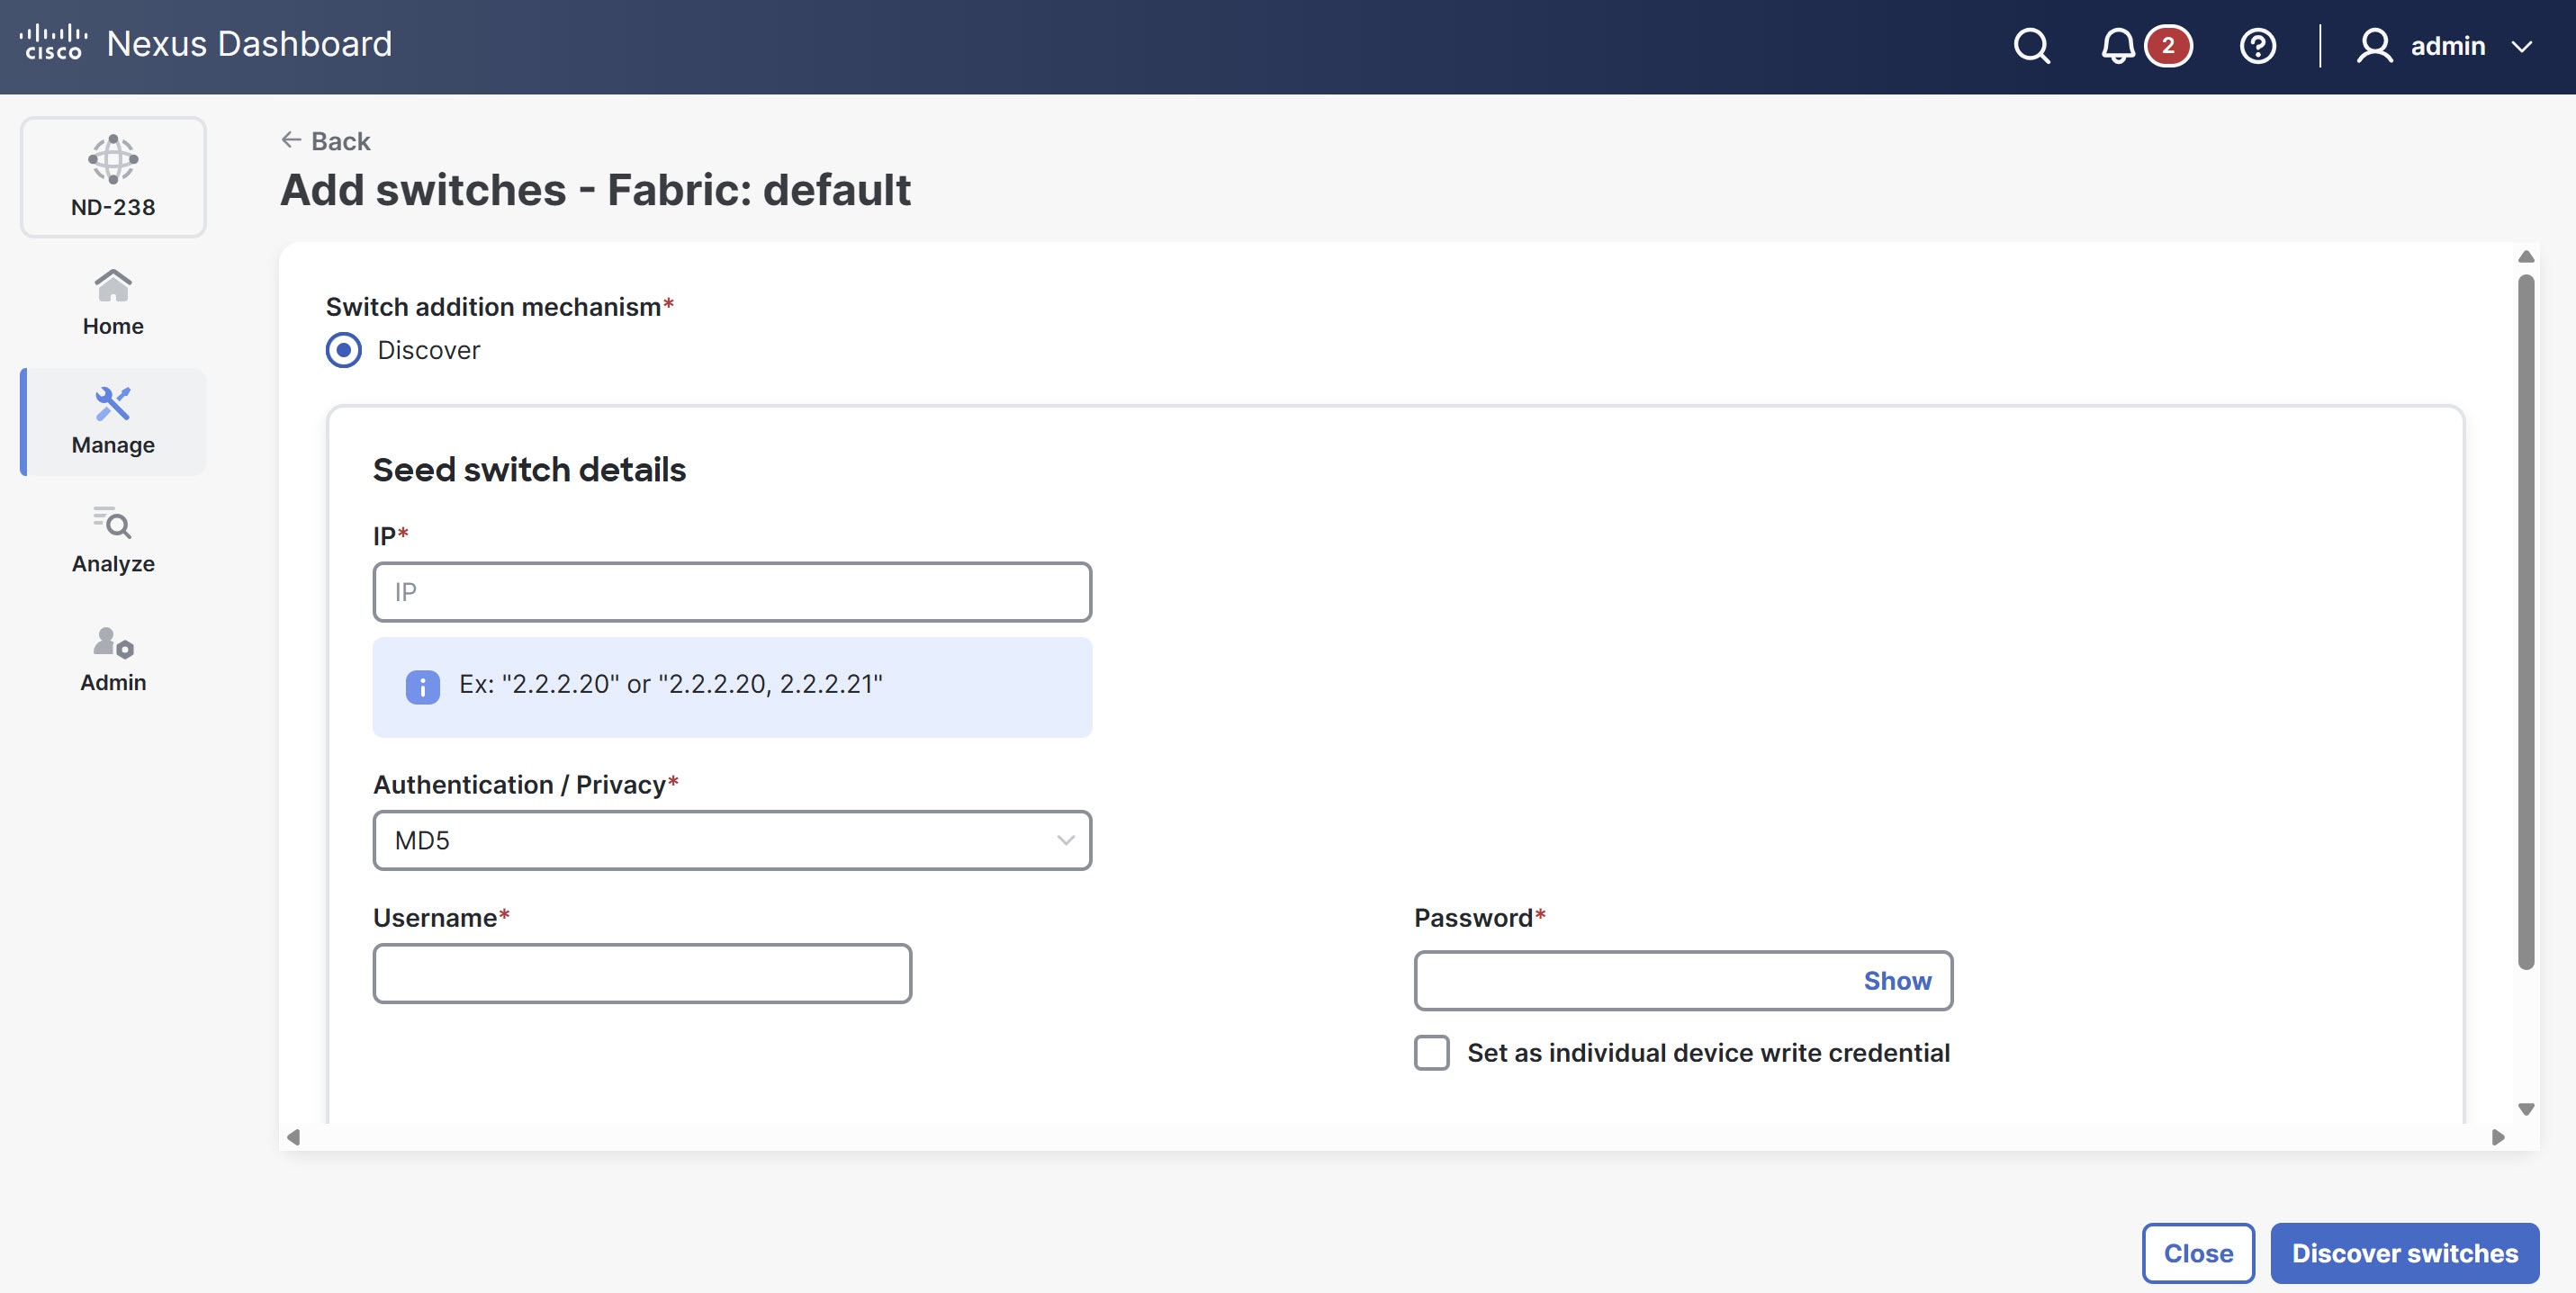
Add switches
The Add switches option allows you to add switches to the NDB fabric using a discovery mechanism. Ensure that you have the management IP addresses and the necessary administrative credentials (username and password) for the switches you intend to add. You can add multiple switches simultaneously.
Follow these steps to add switches to the NDB fabrics.
-
Navigate to the Fabrics page.
Go to Manage > Fabrics.
-
From the Fabrics table, click an NDB fabric.
The Fabrics page displays.
-
In the Fabrics page, click the Inventory tab.
-
Click the Switches tab.
-
From the Actions drop-down list, choose Add switches.
The Add switches page displays.

You can also access the Add switches page from the Inventory page. Go to Manage > Inventory and choose Add switches from the Actions drop-down list.
-
The Switch addition mechanism defaults to Discover.
-
Under Seed switch details, provide the following information.
-
IP — provide the management IP address of the switch. You can provide multiple IP addresses separated by commas.
-
Authentication / Privacy — choose the authentication protocol from the drop-down list.
-
Username — enter the administrative username for the switch.
-
Password — enter the password for the specified username.
-
Set as individual device write credential — check this option if you want to use these credentials specifically for write operations on these devices.
-
-
Click Discover switches to initiate the process.
Nexus Dashboard attempts to communicate with the switches. After Nexus Dashboard discovers the switches, they appear in the Switches table with a Discovering or Ok status.
By default, Nexus Dashboard sets the device TCAM (specialized hardware memory used for high-speed traffic matching) scale to 2048 entries. This memory allows the switch to store and process your traffic filtering and forwarding rules.
Controllers
The Controllers tab is used to manage and monitor the controller instances associated with a specific NDB fabric.
The Controllers table provides the following information.
| Field | Description |
|---|---|
|
Active IP |
Displays the IP address Nexus Dashboard currently uses to communicate with the controller. |
|
Username |
Specifies the username. |
|
Name |
Identifies the unique name assigned to the controller. |
|
Fabric name |
Identifies the specific NDB fabric associated with the controller. |
|
Device type |
Specifies the model or software version assigned to the controller. |
|
Primary IP address |
Specifies the main IP address assigned to the controller. |
|
Secondary IP address |
Specifies the backup IP address for high-availability configurations |
|
Tertiary IP address |
Specifies a third IP address for additional redundancy, if applicable. |
|
Status description |
Provides real-time details regarding the operational state or connection health. |
Configure controllers
Follow these steps to configure the switches.
-
Navigate to the Fabrics page .
Go to Manage > Fabrics.
-
From the Fabrics table, click an NDB fabric.
The Fabrics page displays.
-
In the Fabrics page, click the Inventory tab.
-
Click the Controllers tab.
-
Choose a switch.
-
From the Actions drop-down list, choose one of the following options.
-
Onboard controller-- allows you to add a new controller.
-
Reconnect controller — allows you to restore communication between NDB and a controller that is offline or lost its connection.
-
Delete controller — allows you to remove a controller from the inventory.
-
Connectivity
The Connectivity tab provides a centralized location to manage and monitor the physical and logical connections within your NDB fabric. It allows you to verify that interfaces function correctly and traffic follows your defined policies.
Follow these steps to navigate to the Connectivity tab.
-
Navigate to the Fabrics page .
Go to Manage > Fabrics.
-
From the Fabrics table, click an NDB fabric.
The Fabrics page displays.
-
Click the Connectivity tab.
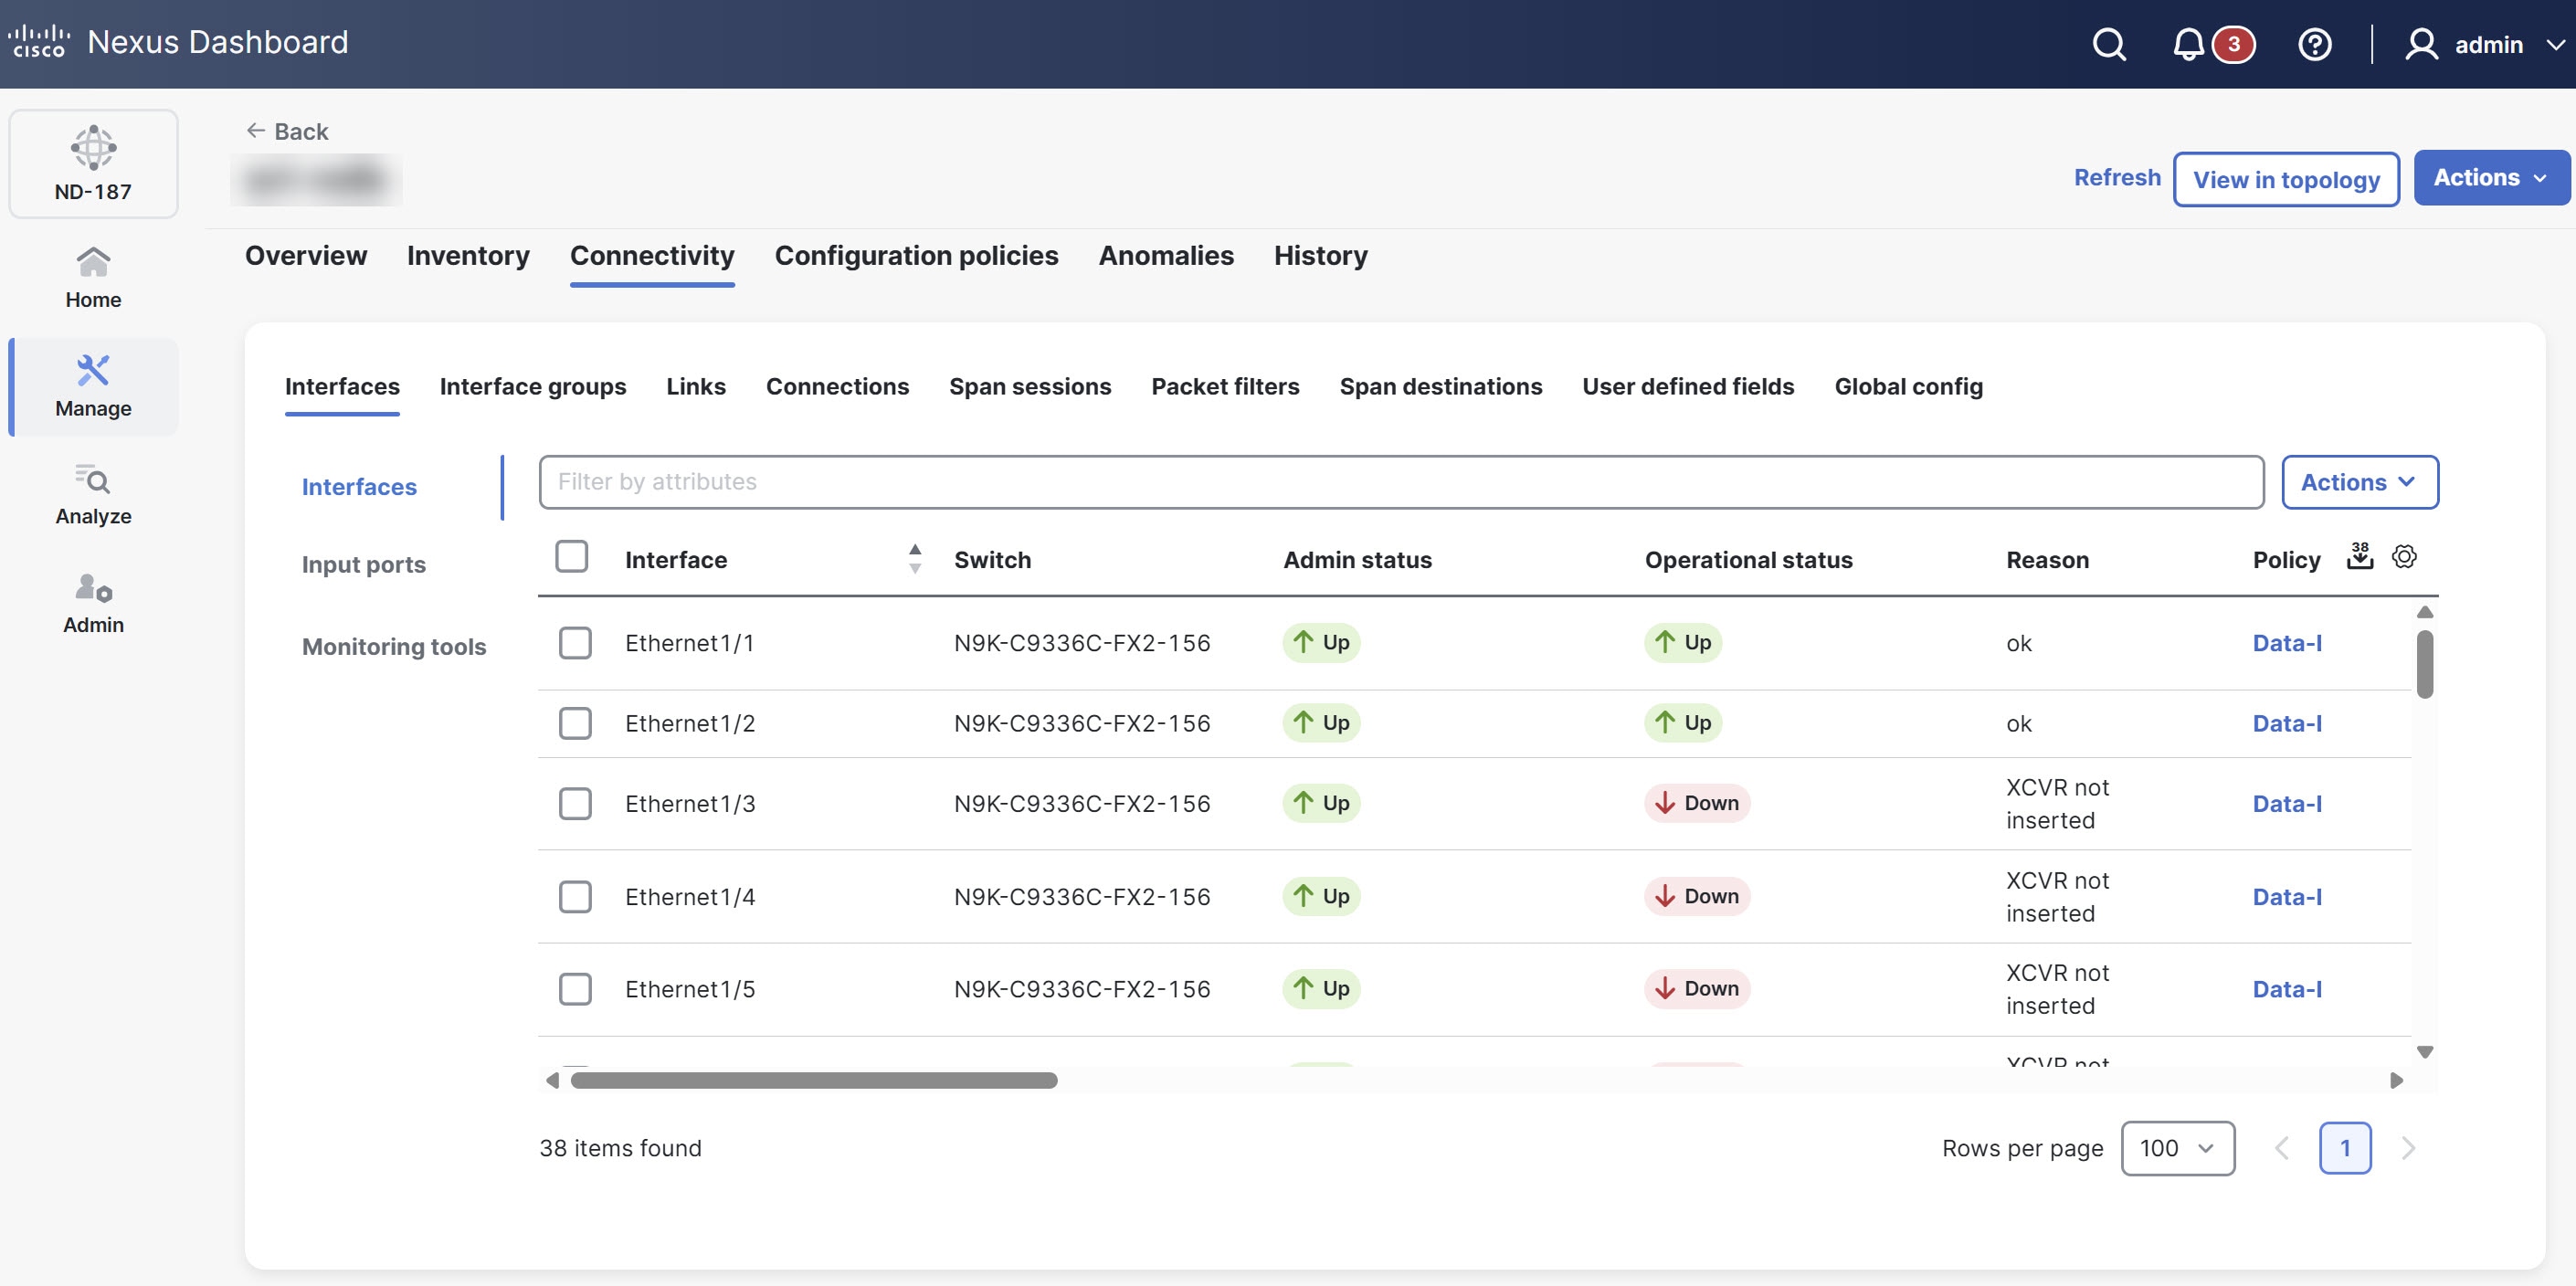
For more information, see Working with Connectivity in Your Nexus Dashboard NDB fabrics.
Configuration policies
The Configuration policies tab allows you to manage and deploy CLI-based configuration templates to the switches within the NDB fabric. It applies settings such as interface breakouts and system features directly to the hardware.
Follow these steps to navigate to the Configuration policies tab.
-
Navigate to the Fabrics page .
Go to Manage > Fabrics.
-
From the Fabrics table, click an NDB fabric.
The Fabrics page displays.
-
Click the Configuration policies tab.
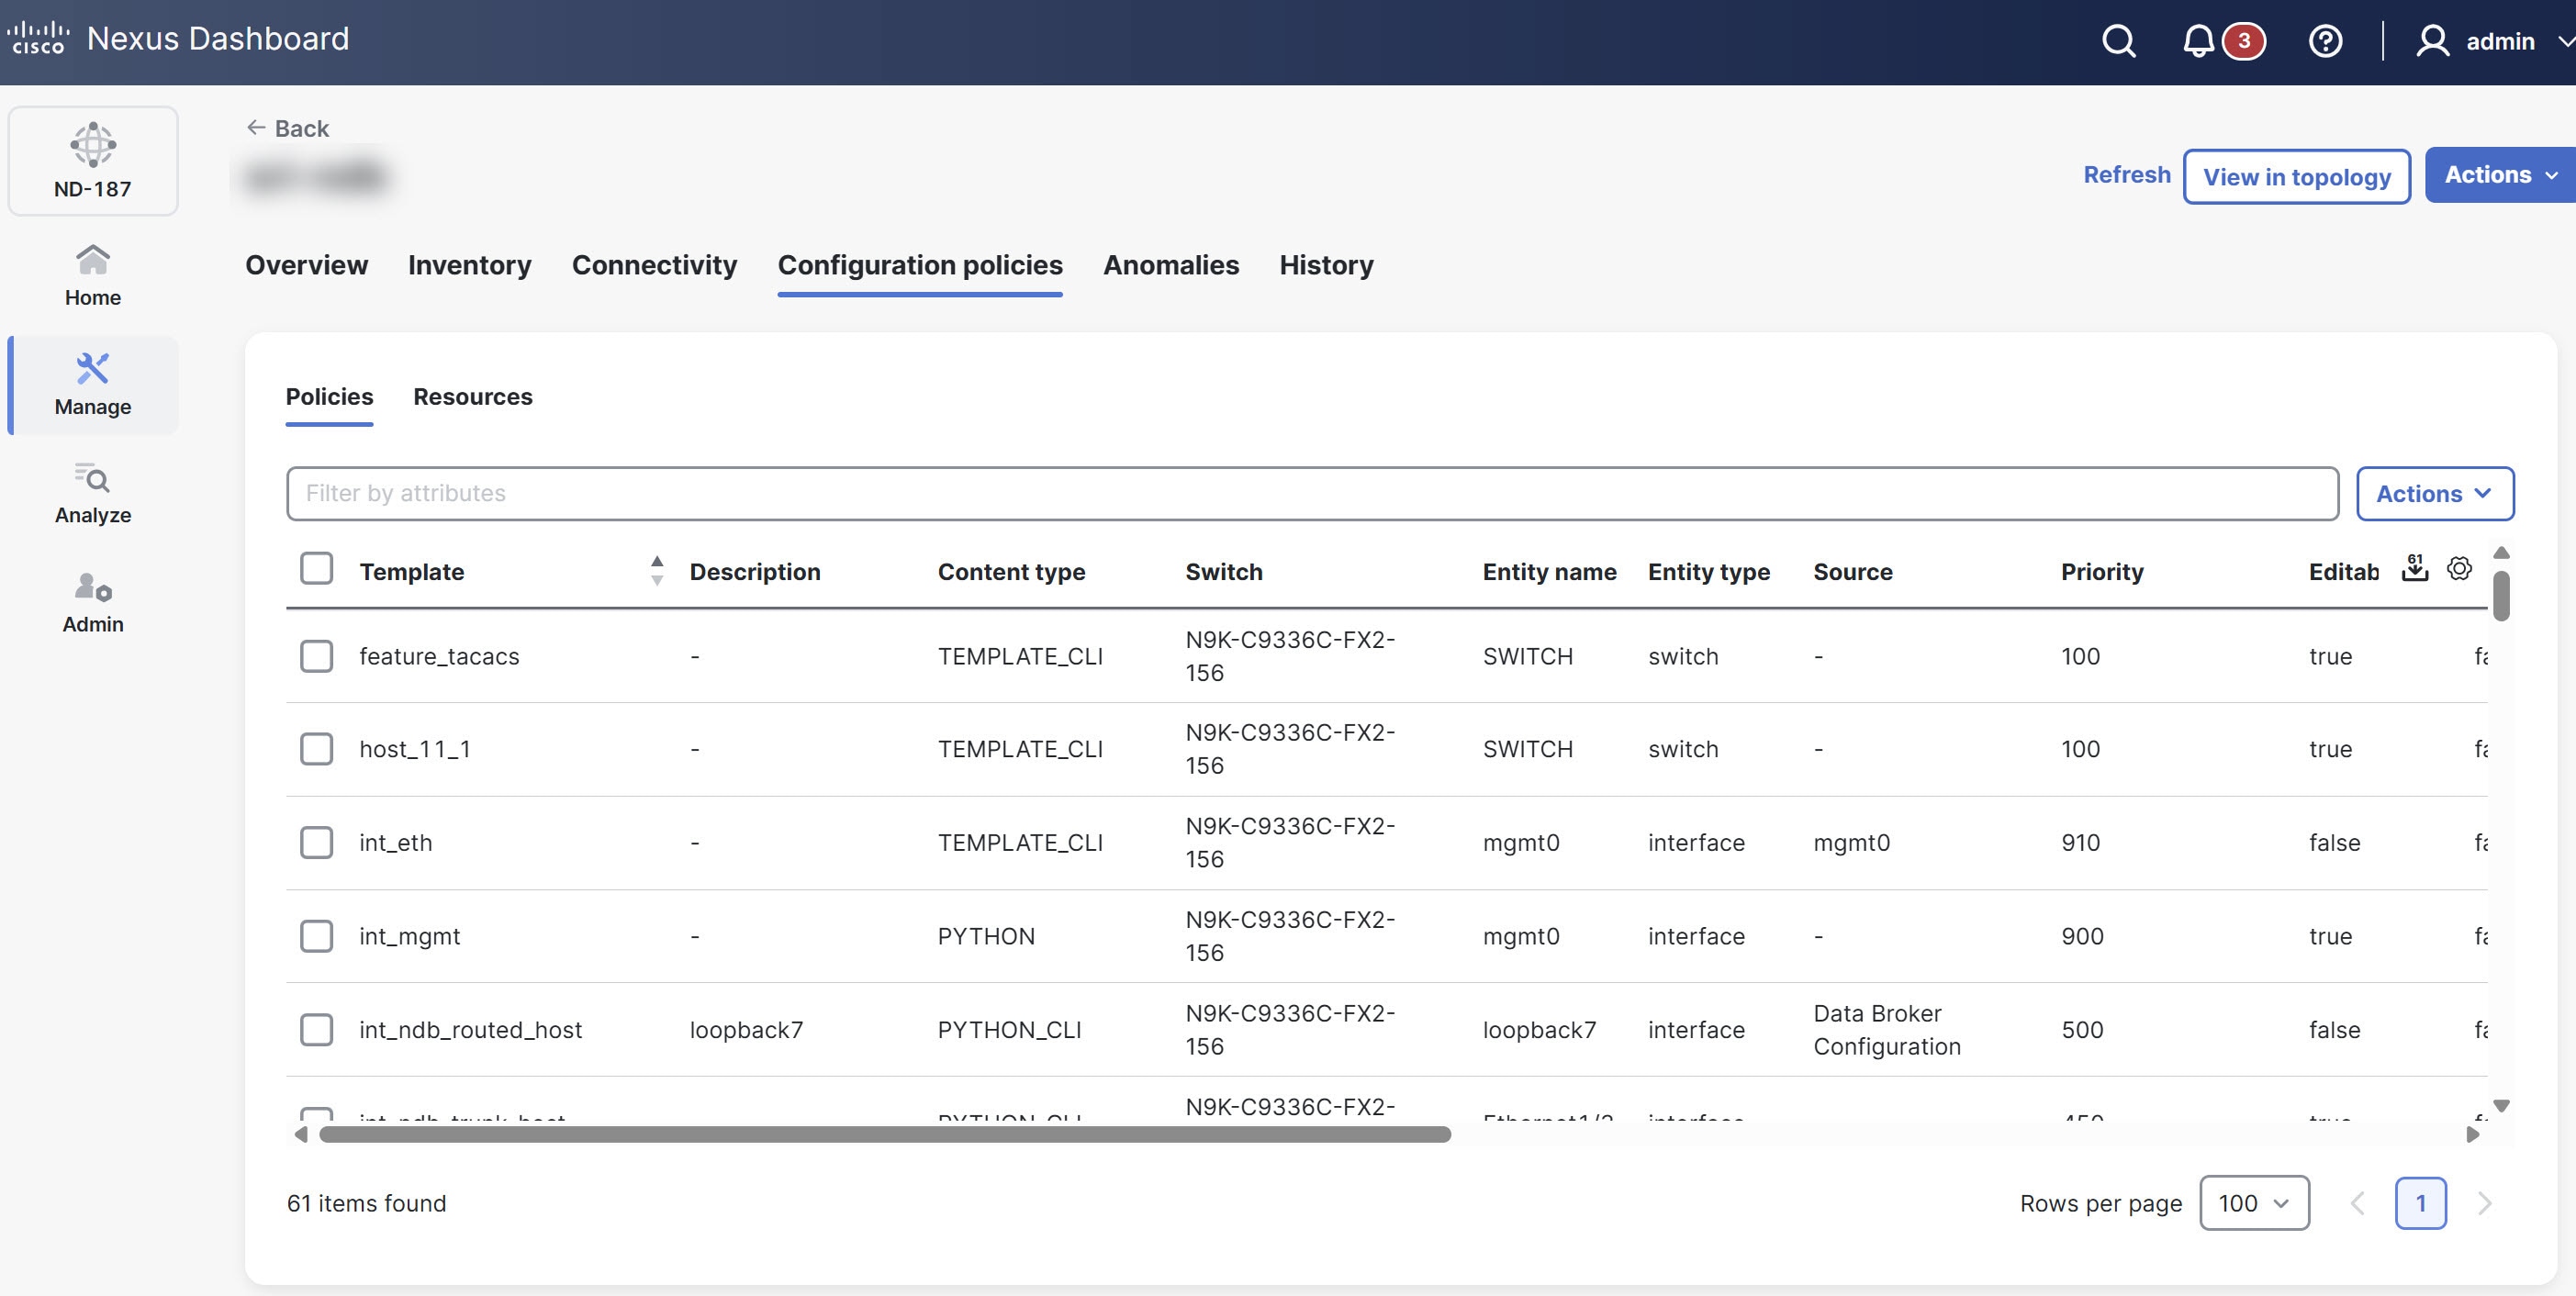
For more information, see Working with Configuration Policies.
Anomalies
The Anomalies tab displays all detected anomalies within the NDB fabric. It organizes the anomalies by severity level and category, allowing you to filter and group events to identify and troubleshoot specific problems like hardware health issues.
Follow these steps to navigate to the Anomalies tab.
-
Navigate to the Fabrics page .
Go to Manage > Fabrics.
-
From the Fabrics table, click an NDB fabric.
The Fabrics page displays.
-
Click the Anomalies tab.
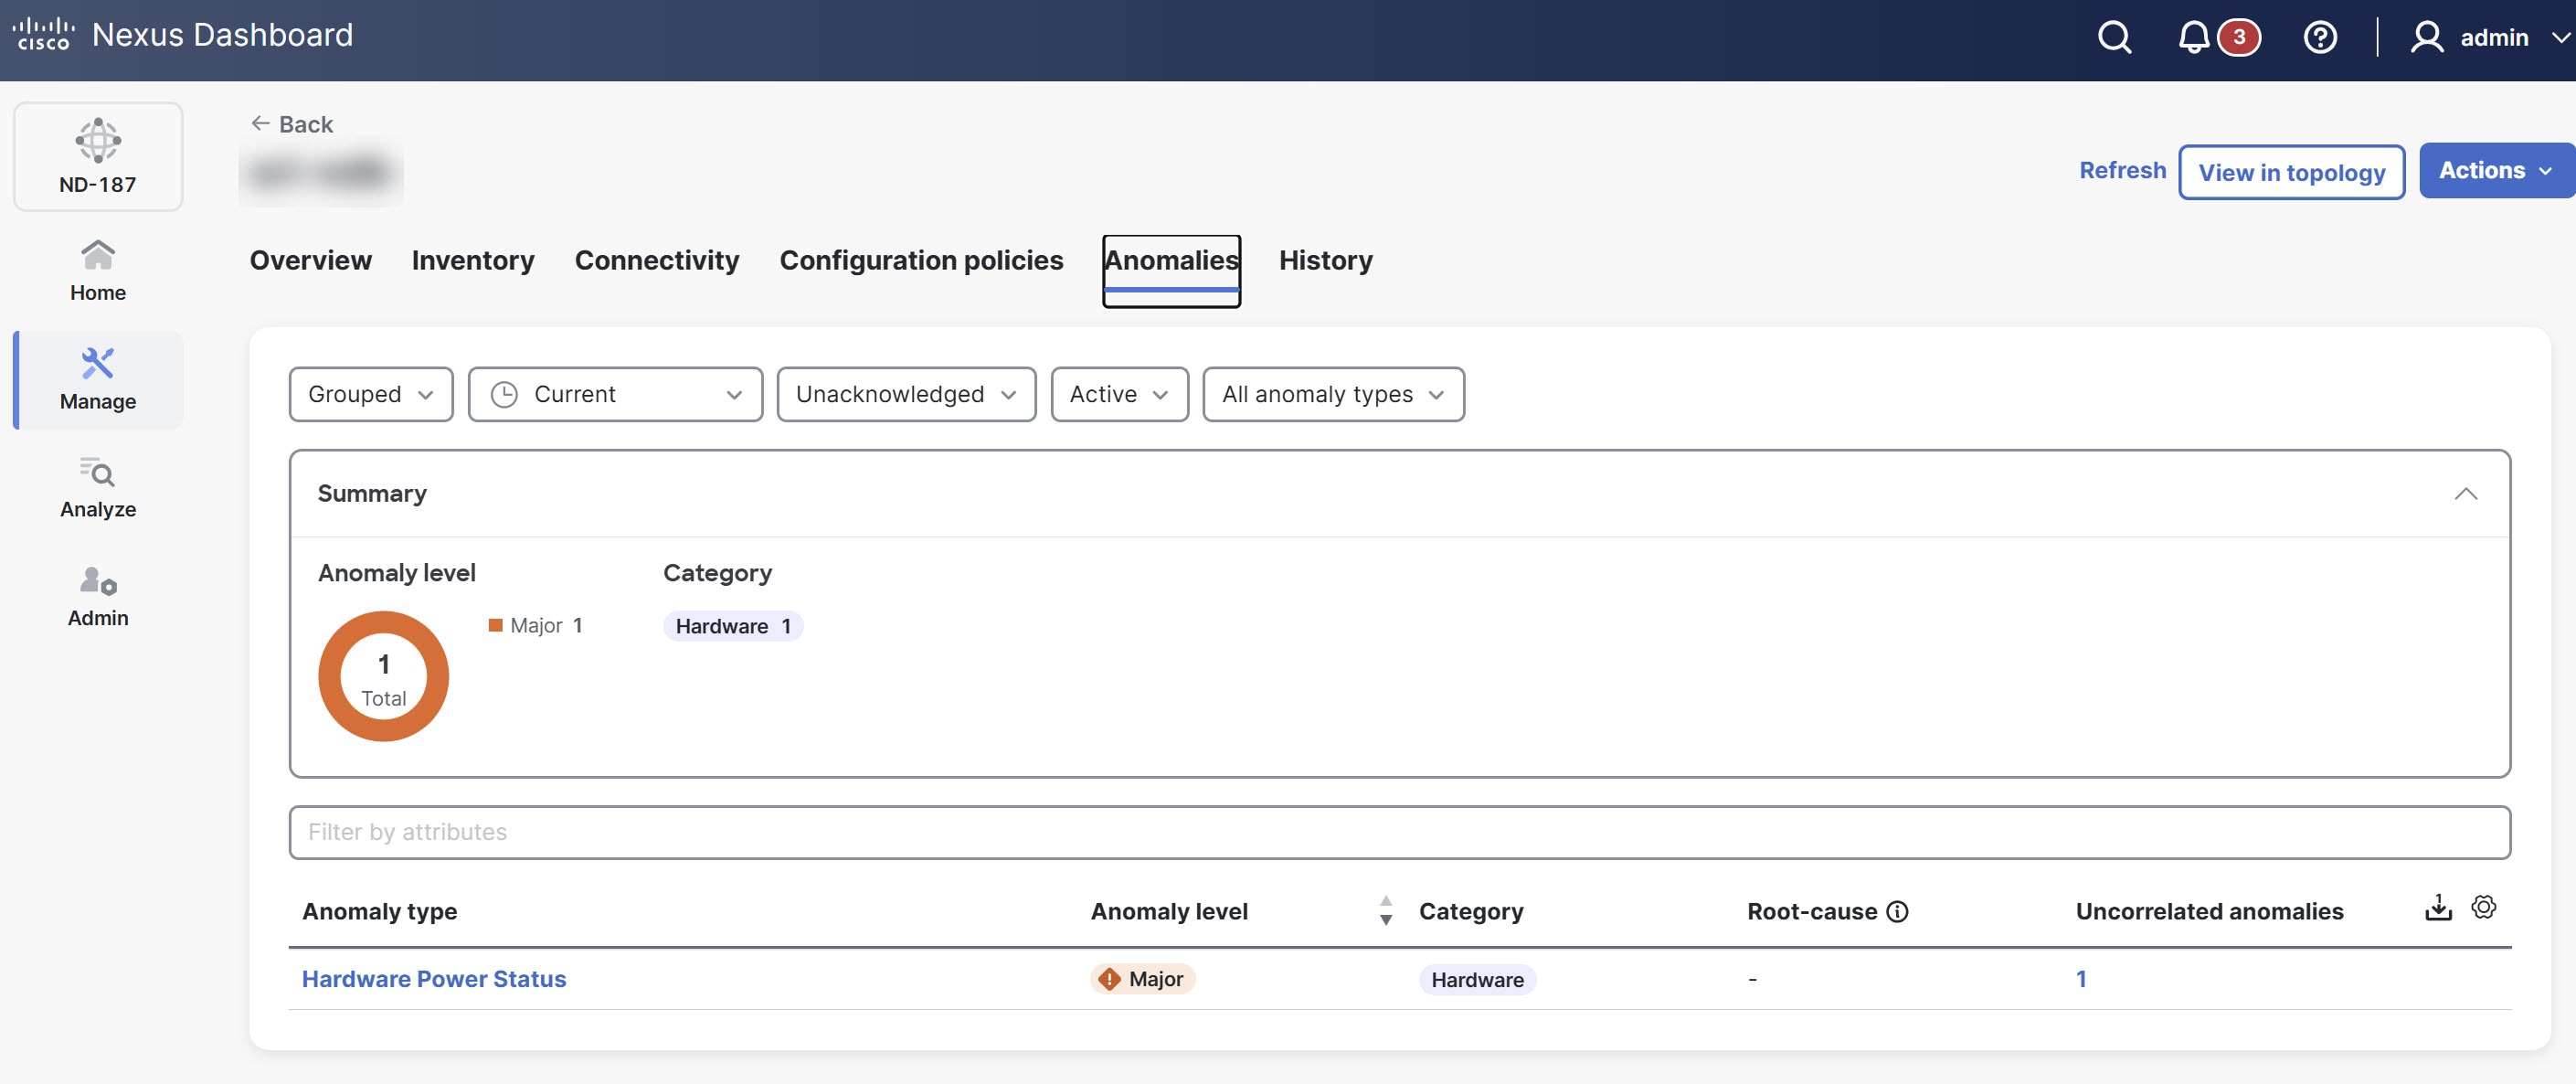
For more information, see Anomalies.
History
The History tab provides a comprehensive activity log of all actions taken within the NDB fabric. It provides details about audit logs, deployment history, policy change history, and system events in chronological order, which is essential for compliance, auditing, and tracking the root cause of configuration changes.
Follow these steps to navigate to the History tab.
-
Navigate to the Fabrics page .
Go to Manage > Fabrics.
-
From the Fabrics table, click an NDB fabric.
-
The Fabrics page displays.
-
Click the History tab.
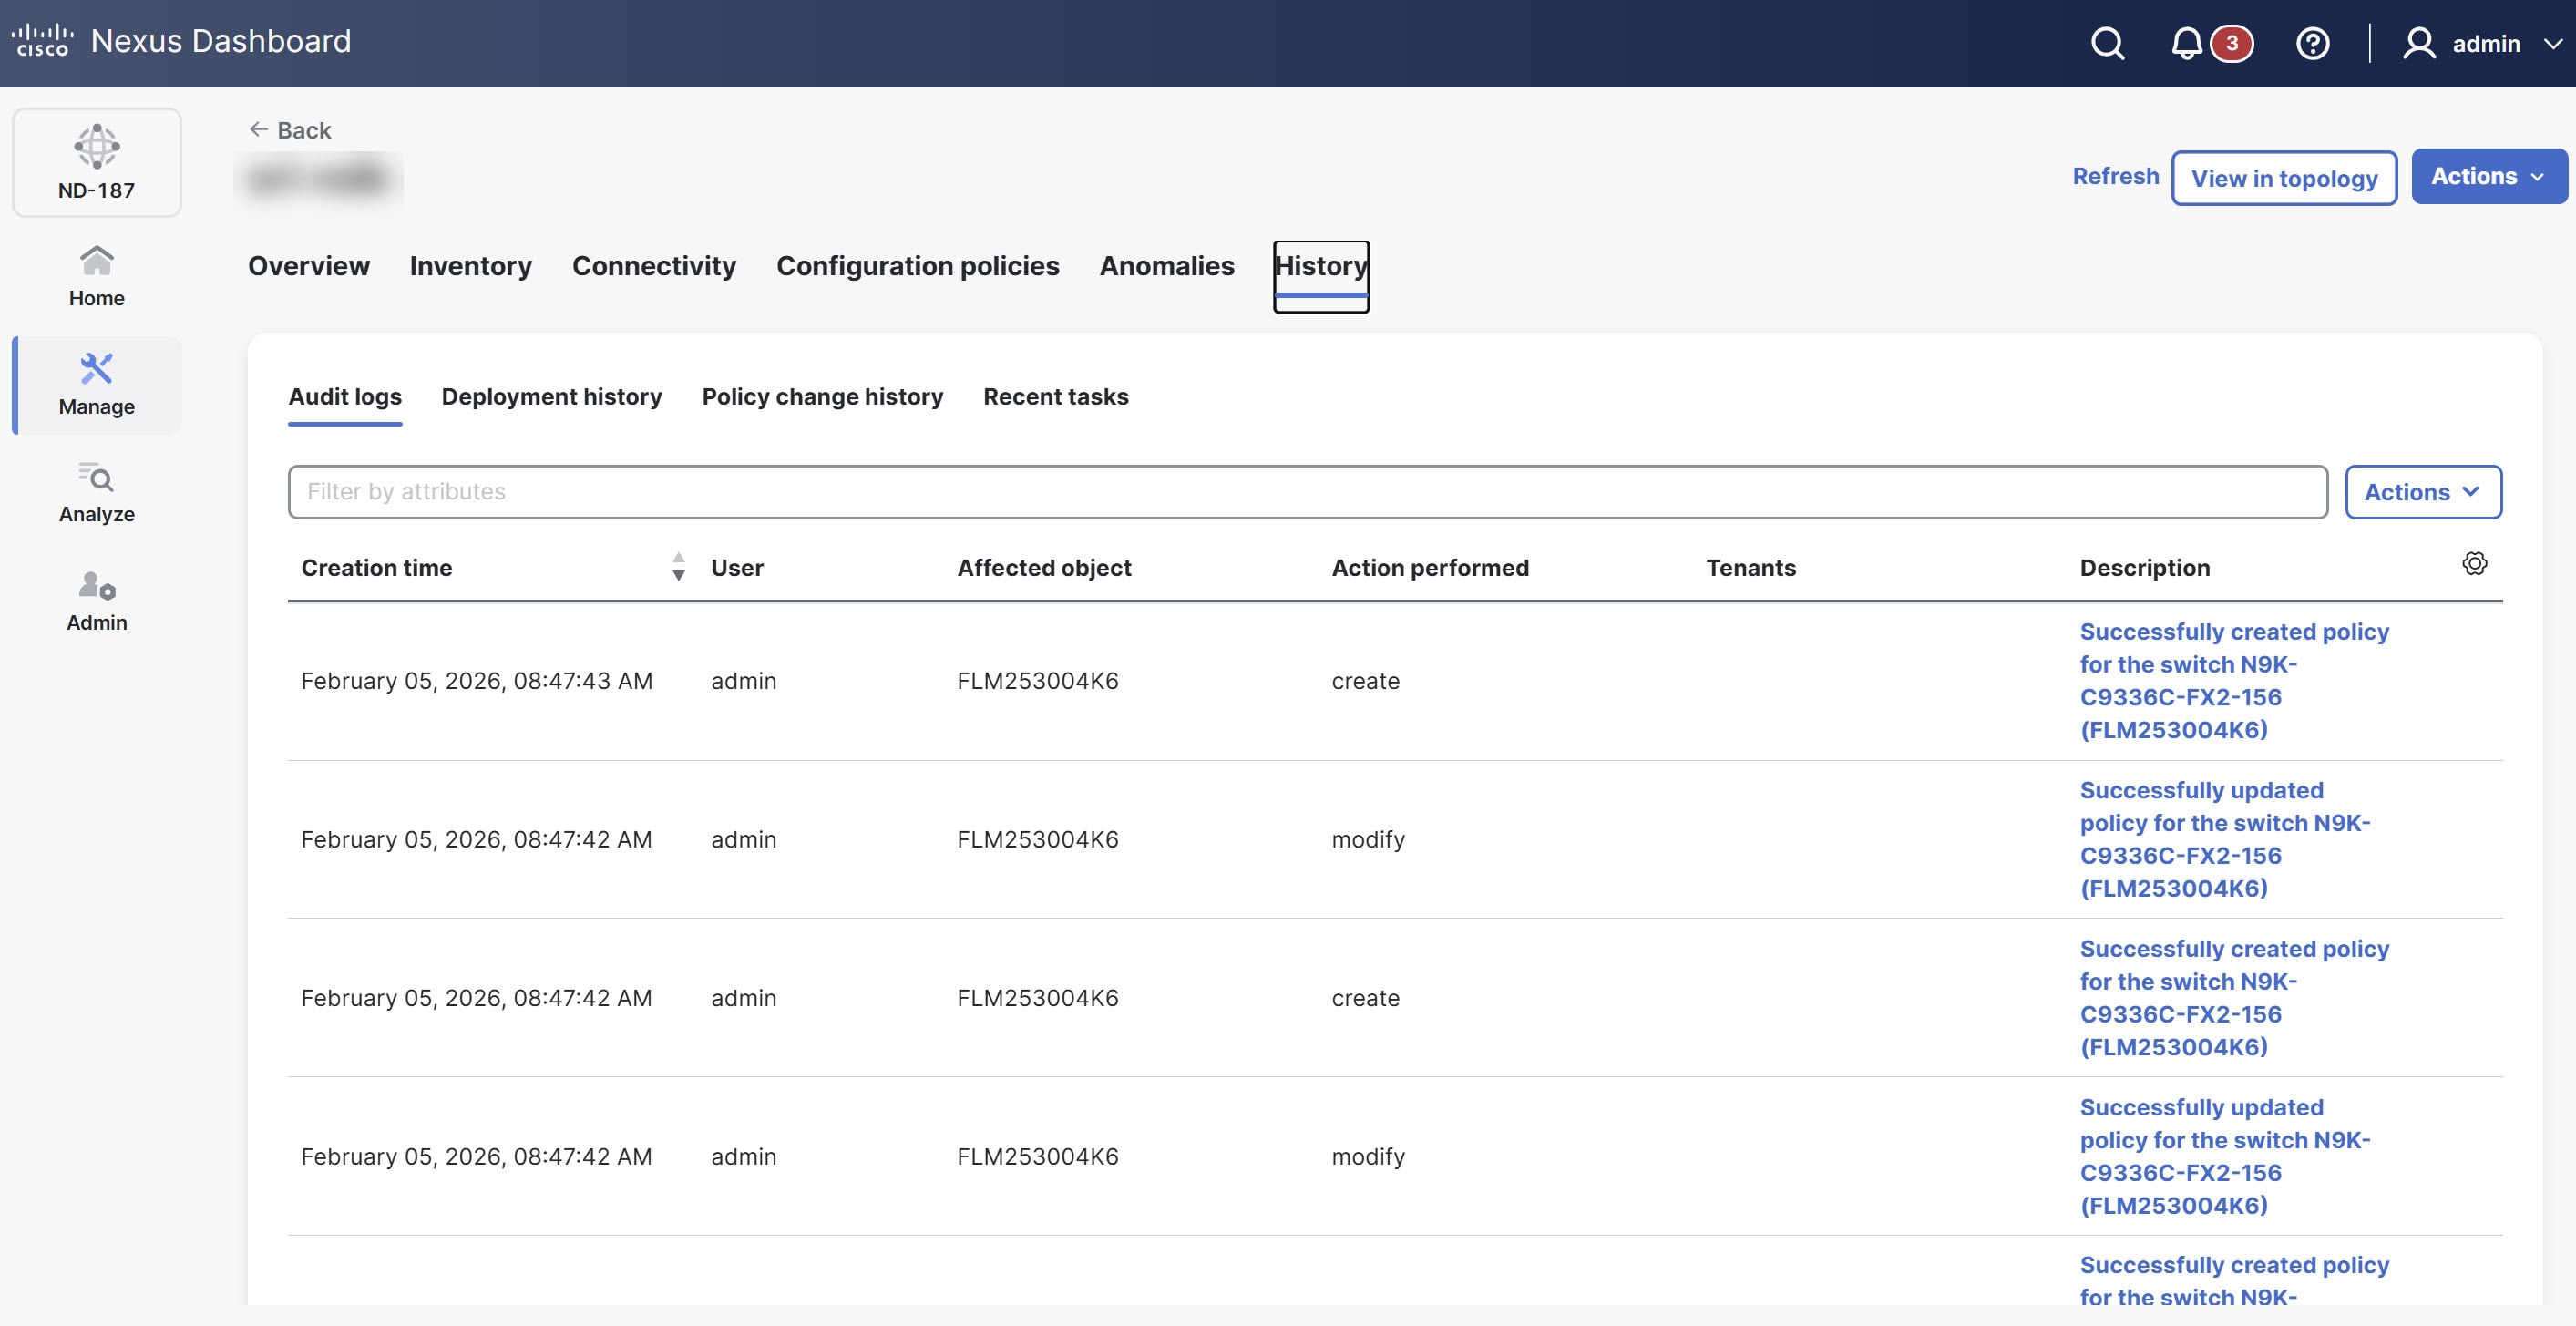
For more information, see Reviewing History and Logs in Your Nexus Dashboard.
Monitor individual switches
The Switch overview page provides detailed visibility into the health, traffic flows, and hardware components of an individual switch.
Follow these steps to navigate to the Switch overview page of an NDB fabric.
-
Navigate to the Inventory page.
Go to Manage > Inventory.
-
Click an NDB switch
The Switch overview page displays.
The Switch overview page includes the following tabs.
-
Overview
-
Hardware
-
Connectivity
-
Statistics
-
Configuration policies
-
Anomalies
-
History
For more information on each tab, see View information on a single switch.
Statistics
The Statistics tab provides real-time traffic telemetry and performance data for the chosen switch. The Statistics tab is specific to NDB fabrics and allows you to monitor how traffic moves through the hardware to ensure your monitoring policies are active.
Follow these steps to navigate to the Statistics page.
-
Navigate to the Inventory page.
Go to Manage > Inventory.
-
Click an NDB switch
The Switch overview page displays.
-
Click the Statistics tab.
The Statistics page displays the following subtabs.
-
Flows
-
Ports
-
Flows
The Flows tab shows device flows for NDB devices.
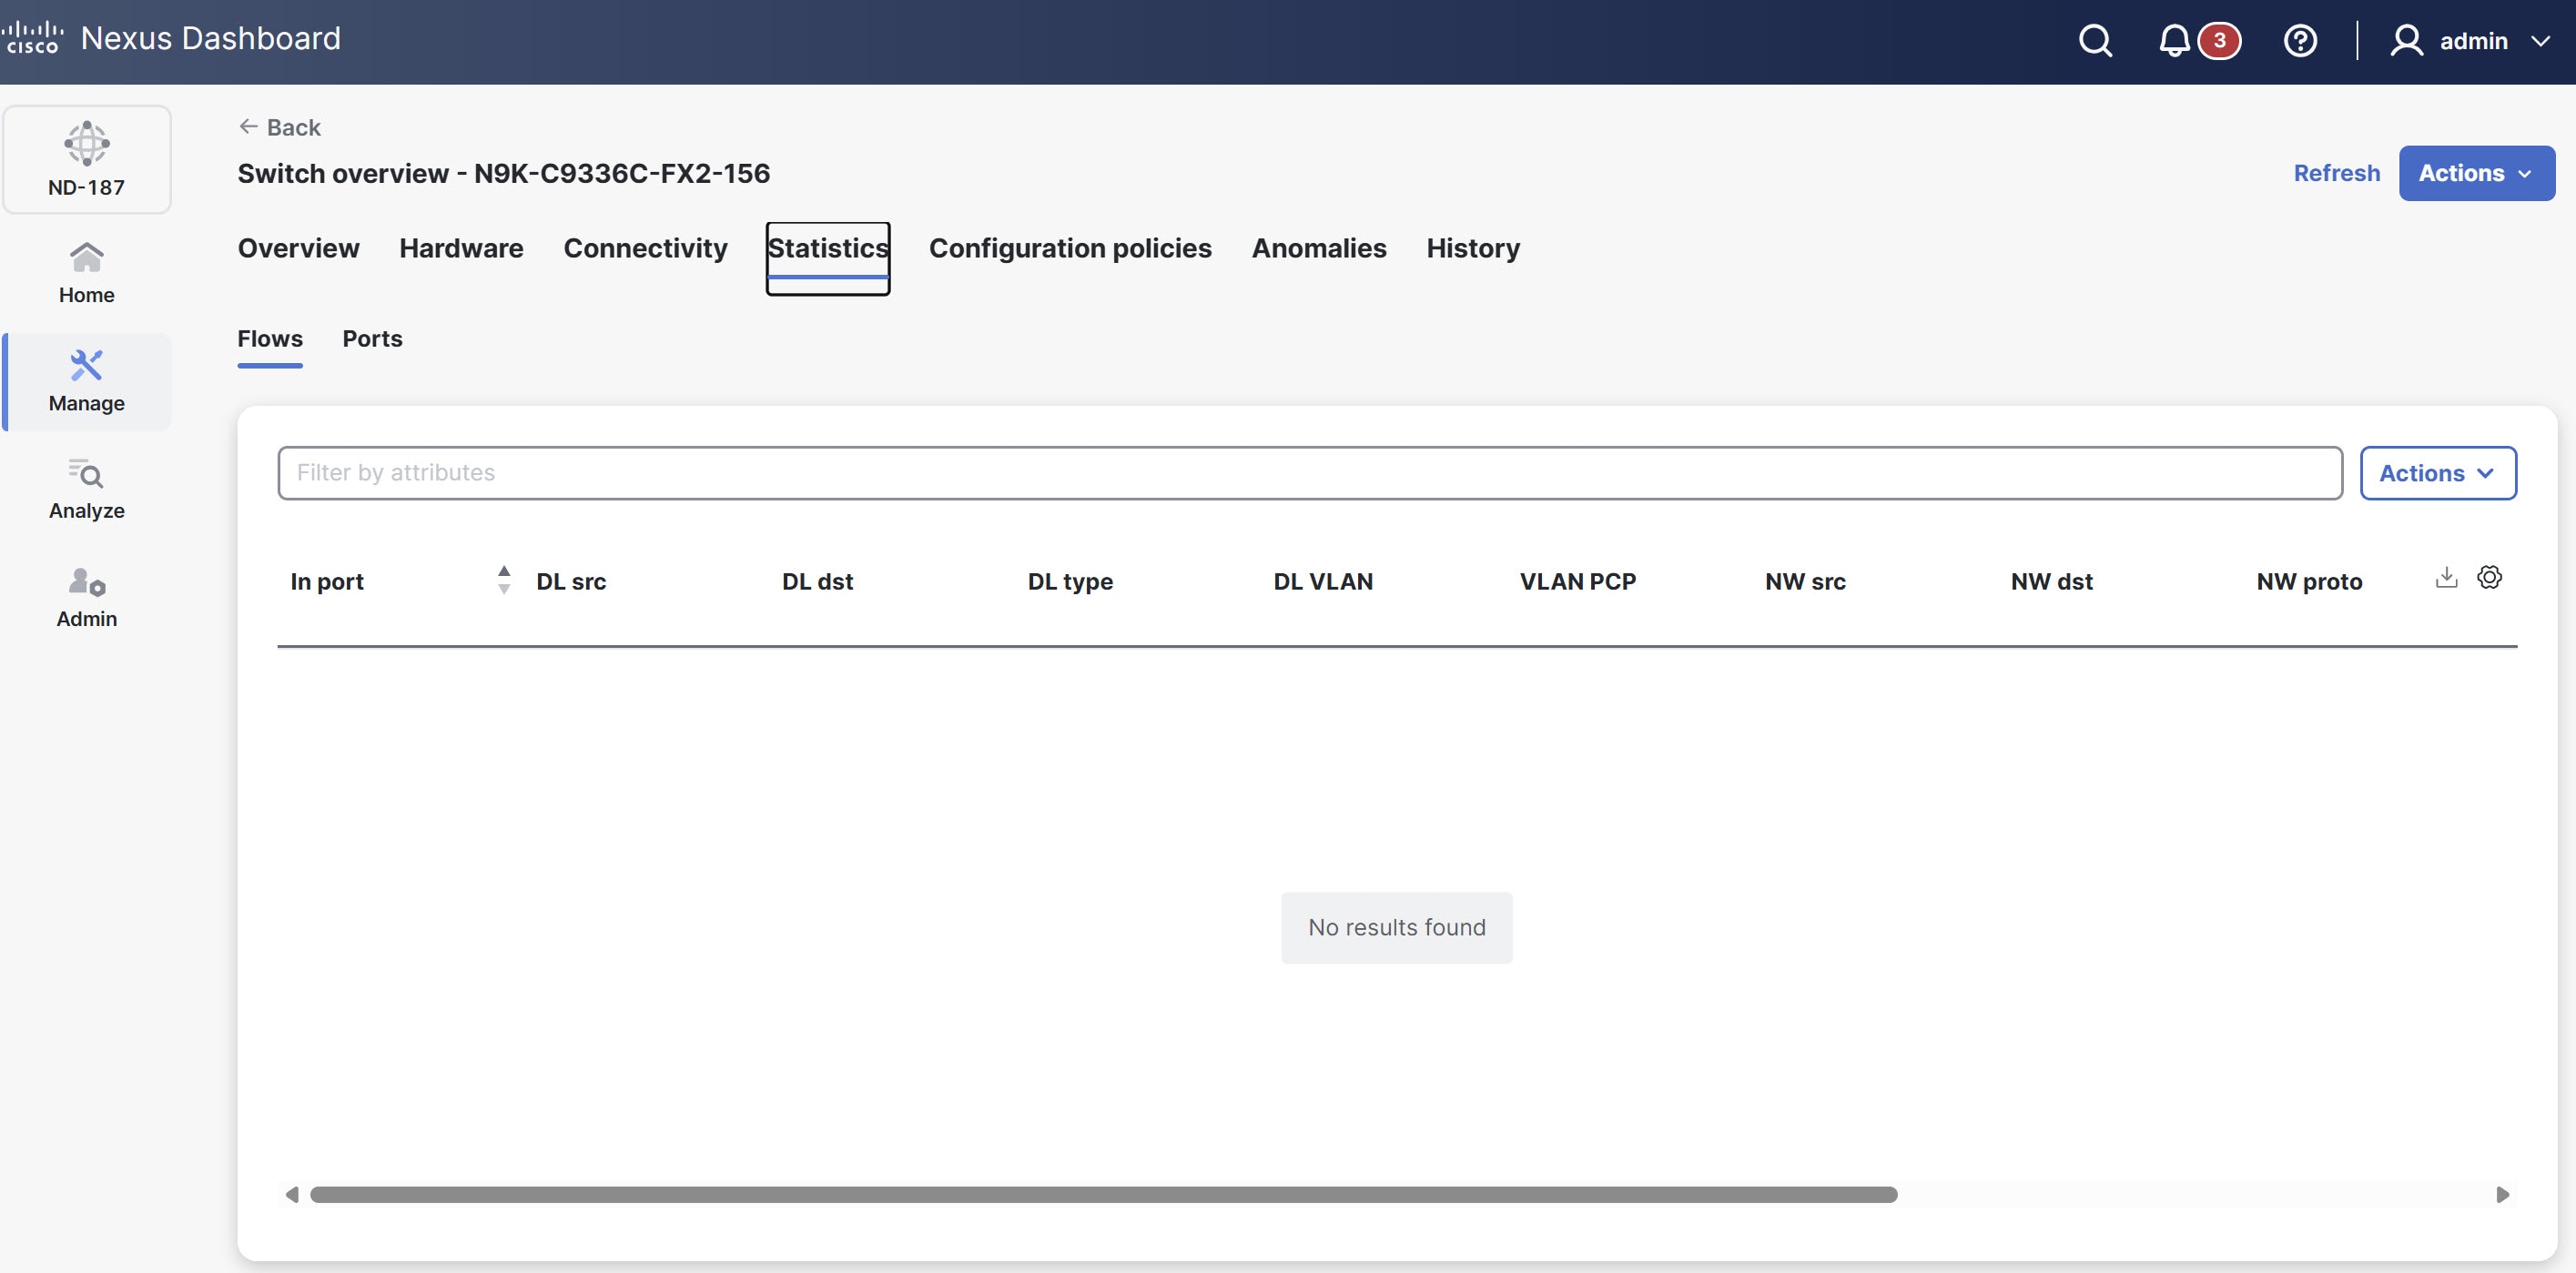
The Flows table provides the following information.
| Field | Description |
|---|---|
|
In port |
Indicates the input port(s) that match the traffic. |
|
DL src |
Shows the source MAC address that matches the incoming traffic. |
|
DL dst |
Shows the destination MAC address that matches the incoming traffic. |
|
DL type |
Displays the Ethertype that matches the incoming traffic. For example, IPv4 or IPv6. |
|
DL VLAN |
Displays the VLAN ID that matches the incoming traffic. |
|
VLAN PCP |
Shows the VLAN priority that matches the incoming traffic. |
|
NW src |
Displays the IPv4 or IPv6 source address for the incoming traffic. |
|
NW dst |
Displays the IPv4 or IPv6 destination address for the incoming traffic. |
|
NW proto |
Shows the network protocol that matches the incoming traffic, such as "6" for TCP. |
|
TP src |
Indicates the source port associated with the network protocol for the incoming traffic. |
|
TP dst |
Indicates the destination port associated with the network protocol for the incoming traffic. |
|
Packet count |
Shows the aggregate traffic volume, in packets, that match the specified flow connection. |
Ports
The Ports tab shows statistics for the ports of an NDB device.
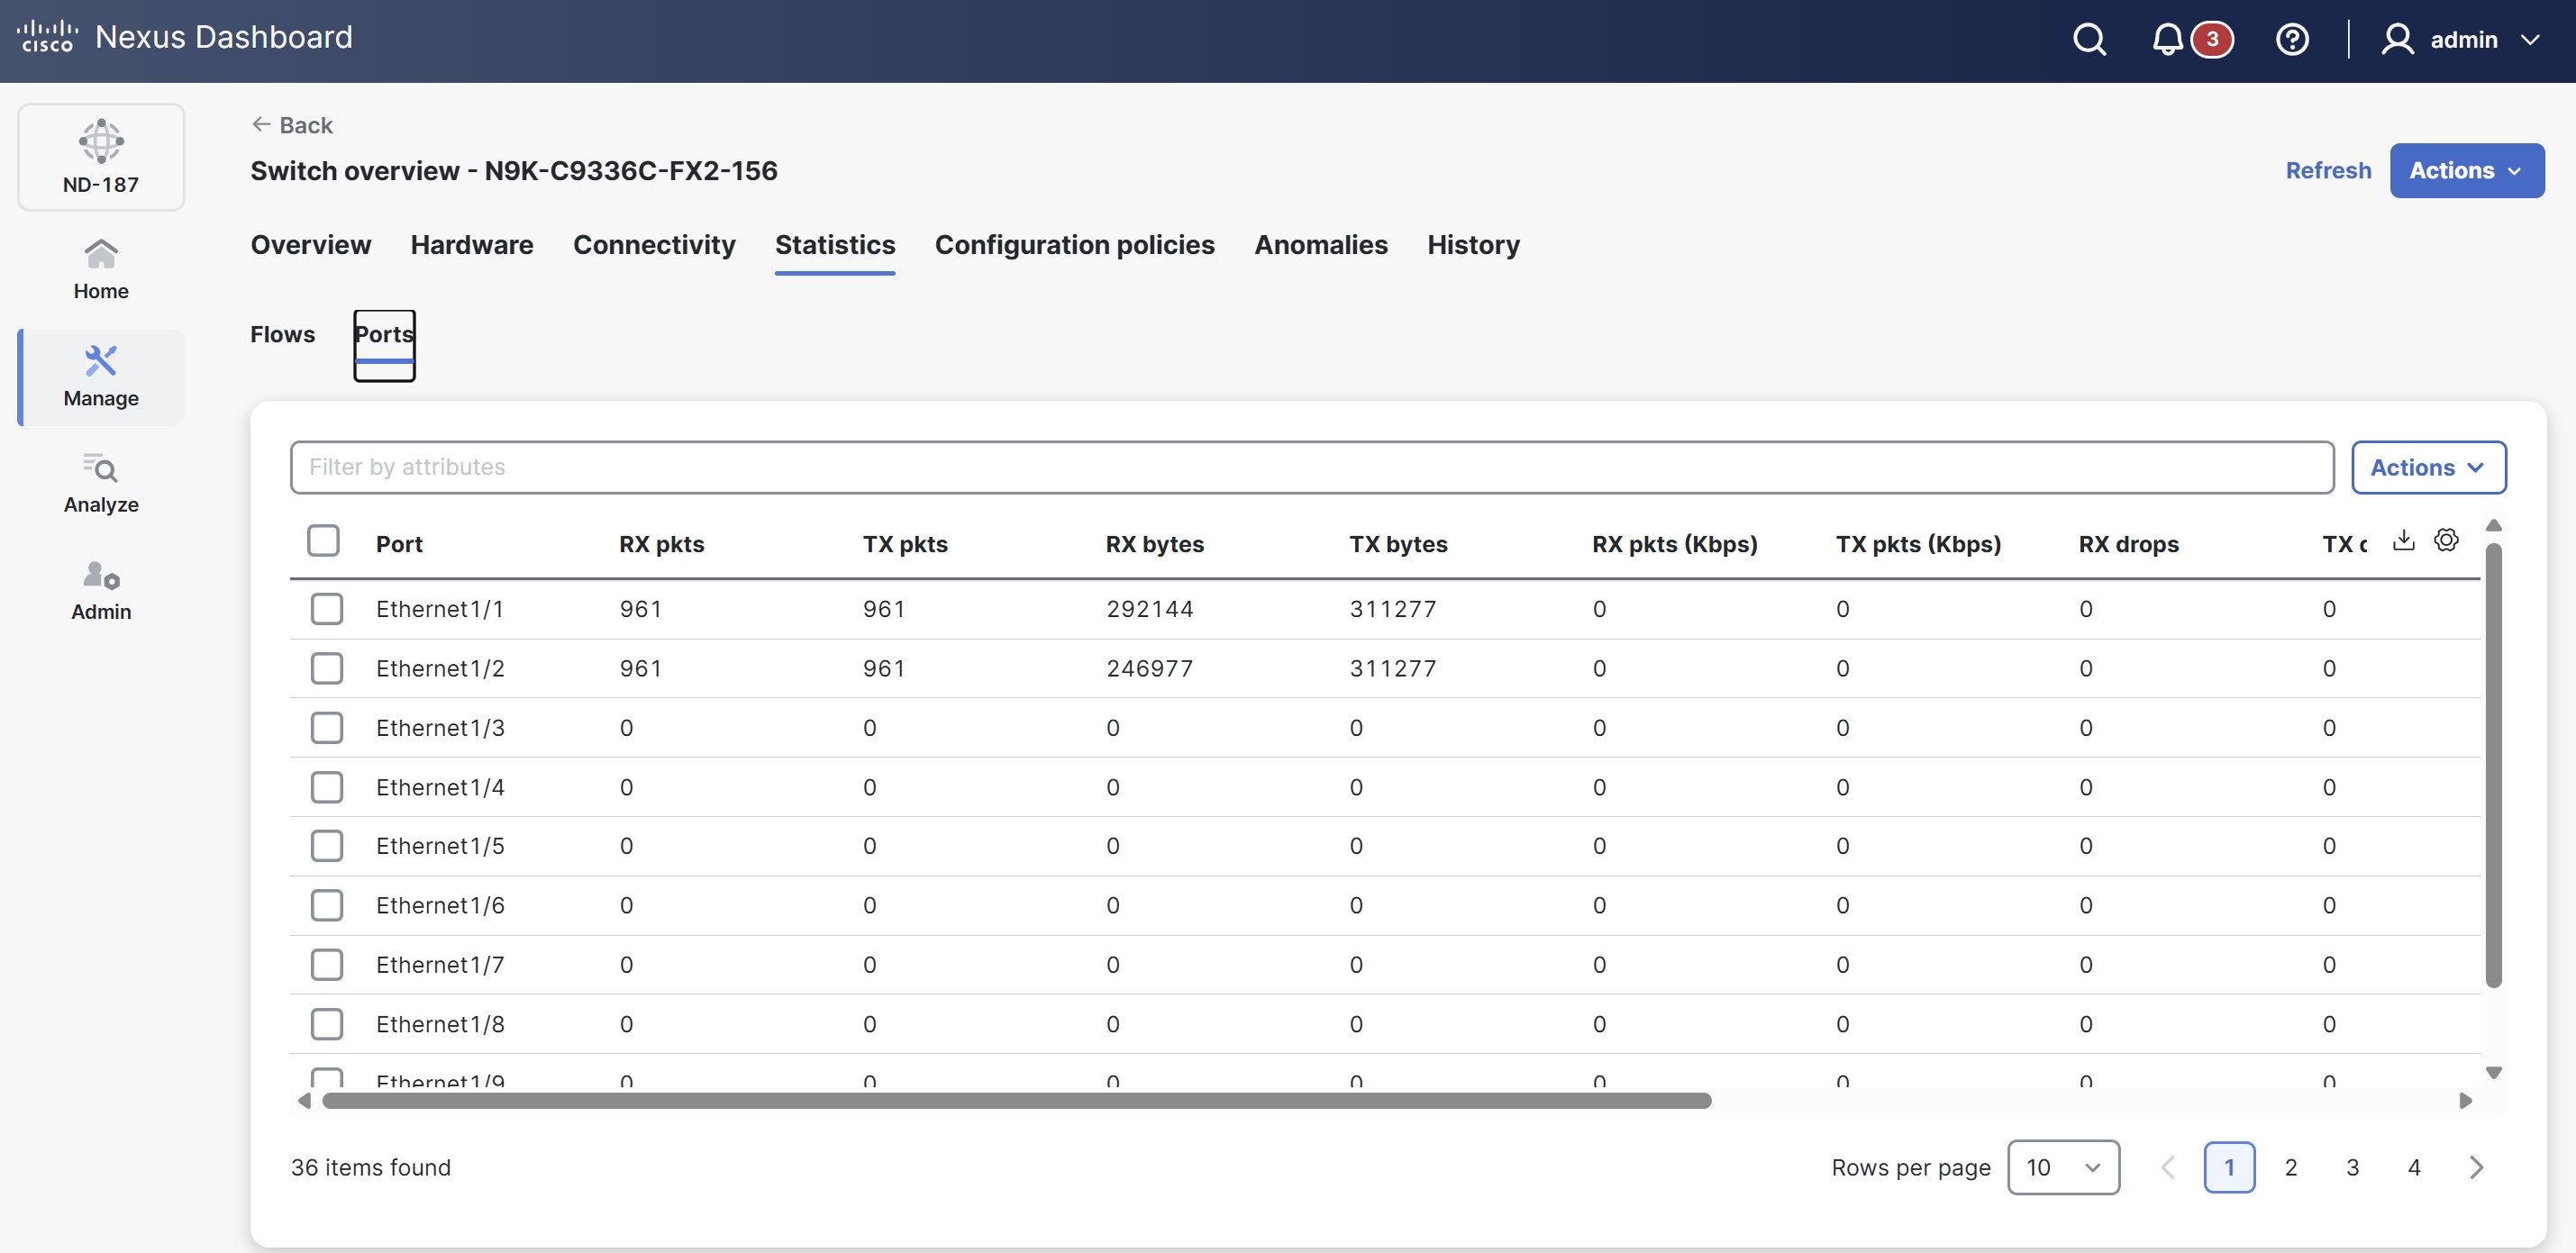
The Ports table provides the following information.
| Field | Description |
|---|---|
|
Port |
Shows the device interface for which statistics appear. |
|
RX pkts |
Shows the number of packets the port received. |
|
TX pkts |
Shows the number of packets the port transmitted. |
|
RX bytes |
Shows the number of bytes the port received. |
|
TX bytes |
Shows the number of bytes the port transmitted. |
|
RX pkts (Kbps) |
Displays the rate at which the port receives packets. |
|
TX pkts (Kbps) |
Displays the rate at which the port transmits packets. |
|
RX drops |
Shows the rate at which the port drops packets while receiving. |
|
TX drops |
Shows the rate at which the port drops packets while transmitting. |
|
RX errs |
Indicates errors that occur while the port receives packets. |
|
TX errs |
Indicates errors that occur while the port transmits packets. |
|
RX frame errs |
Shows frame errors that occur while the port receives packets. |
|
RX overRu |
Shows overrun errors that occur while the port receives packets. |
Copyright
THE SPECIFICATIONS AND INFORMATION REGARDING THE PRODUCTS IN THIS MANUAL ARE SUBJECT TO CHANGE WITHOUT NOTICE. ALL STATEMENTS, INFORMATION, AND RECOMMENDATIONS IN THIS MANUAL ARE BELIEVED TO BE ACCURATE BUT ARE PRESENTED WITHOUT WARRANTY OF ANY KIND, EXPRESS OR IMPLIED. USERS MUST TAKE FULL RESPONSIBILITY FOR THEIR APPLICATION OF ANY PRODUCTS.
THE SOFTWARE LICENSE AND LIMITED WARRANTY FOR THE ACCOMPANYING PRODUCT ARE SET FORTH IN THE INFORMATION PACKET THAT SHIPPED WITH THE PRODUCT AND ARE INCORPORATED HEREIN BY THIS REFERENCE. IF YOU ARE UNABLE TO LOCATE THE SOFTWARE LICENSE OR LIMITED WARRANTY, CONTACT YOUR CISCO REPRESENTATIVE FOR A COPY.
The Cisco implementation of TCP header compression is an adaptation of a program developed by the University of California, Berkeley (UCB) as part of UCB’s public domain version of the UNIX operating system. All rights reserved. Copyright © 1981, Regents of the University of California.
NOTWITHSTANDING ANY OTHER WARRANTY HEREIN, ALL DOCUMENT FILES AND SOFTWARE OF THESE SUPPLIERS ARE PROVIDED “AS IS" WITH ALL FAULTS. CISCO AND THE ABOVE-NAMED SUPPLIERS DISCLAIM ALL WARRANTIES, EXPRESSED OR IMPLIED, INCLUDING, WITHOUT LIMITATION, THOSE OF MERCHANTABILITY, FITNESS FOR A PARTICULAR PURPOSE AND NONINFRINGEMENT OR ARISING FROM A COURSE OF DEALING, USAGE, OR TRADE PRACTICE.
IN NO EVENT SHALL CISCO OR ITS SUPPLIERS BE LIABLE FOR ANY INDIRECT, SPECIAL, CONSEQUENTIAL, OR INCIDENTAL DAMAGES, INCLUDING, WITHOUT LIMITATION, LOST PROFITS OR LOSS OR DAMAGE TO DATA ARISING OUT OF THE USE OR INABILITY TO USE THIS MANUAL, EVEN IF CISCO OR ITS SUPPLIERS HAVE BEEN ADVISED OF THE POSSIBILITY OF SUCH DAMAGES.
Any Internet Protocol (IP) addresses and phone numbers used in this document are not intended to be actual addresses and phone numbers. Any examples, command display output, network topology diagrams, and other figures included in the document are shown for illustrative purposes only. Any use of actual IP addresses or phone numbers in illustrative content is unintentional and coincidental.
The documentation set for this product strives to use bias-free language. For the purposes of this documentation set, bias-free is defined as language that does not imply discrimination based on age, disability, gender, racial identity, ethnic identity, sexual orientation, socioeconomic status, and intersectionality. Exceptions may be present in the documentation due to language that is hardcoded in the user interfaces of the product software, language used based on RFP documentation, or language that is used by a referenced third-party product.
Cisco and the Cisco logo are trademarks or registered trademarks of Cisco and/or its affiliates in the U.S. and other countries. To view a list of Cisco trademarks, go to this URL: https://www.cisco.com/go/trademarks. Third-party trademarks mentioned are the property of their respective owners. The use of the word partner does not imply a partnership relationship between Cisco and any other company. (1110R)
© 2017-2026 Cisco Systems, Inc. All rights reserved.
Americas Headquarters
Cisco Systems, Inc.
170 West Tasman Drive
San Jose, CA 95134-1706
USA
https://www.cisco.com
Tel: 408 526-4000
800 553-NETS (6387)
Fax: 408 527-0883