
New and changed information
The following table provides an overview of the significant changes up to this current release. The table does not provide an exhaustive list of all changes or of the new features up to this release.
| Release Version | Feature | Description |
|---|---|---|
|
Nexus Dashboard 4.2.1 |
Nexus Data Broker integration |
Beginning with release 4.2.1, Nexus Dashboard supports a new fabric type dedicated to Data Broker networks. You can also configure and manage SPAN settings for Data Broker switches directly within Nexus Dashboard, which enhances connectivity and monitoring capabilities. |
Navigate to the Connectivity page
Follow these steps to navigate to the Connectivity page.
-
Navigate to the Fabrics page.
Go to Manage > Fabrics.
-
In the Fabrics table, choose the Nexus Data Broker (NDB) fabric for which you want to configure connectivity.
The Fabric Overview page appears.
-
Click the Connectivity tab.
The following subtabs provide more focused connectivity options.
Interfaces
The Interfaces tab includes the following subtabs.
-
Interfaces
-
Input ports
-
Monitoring tools
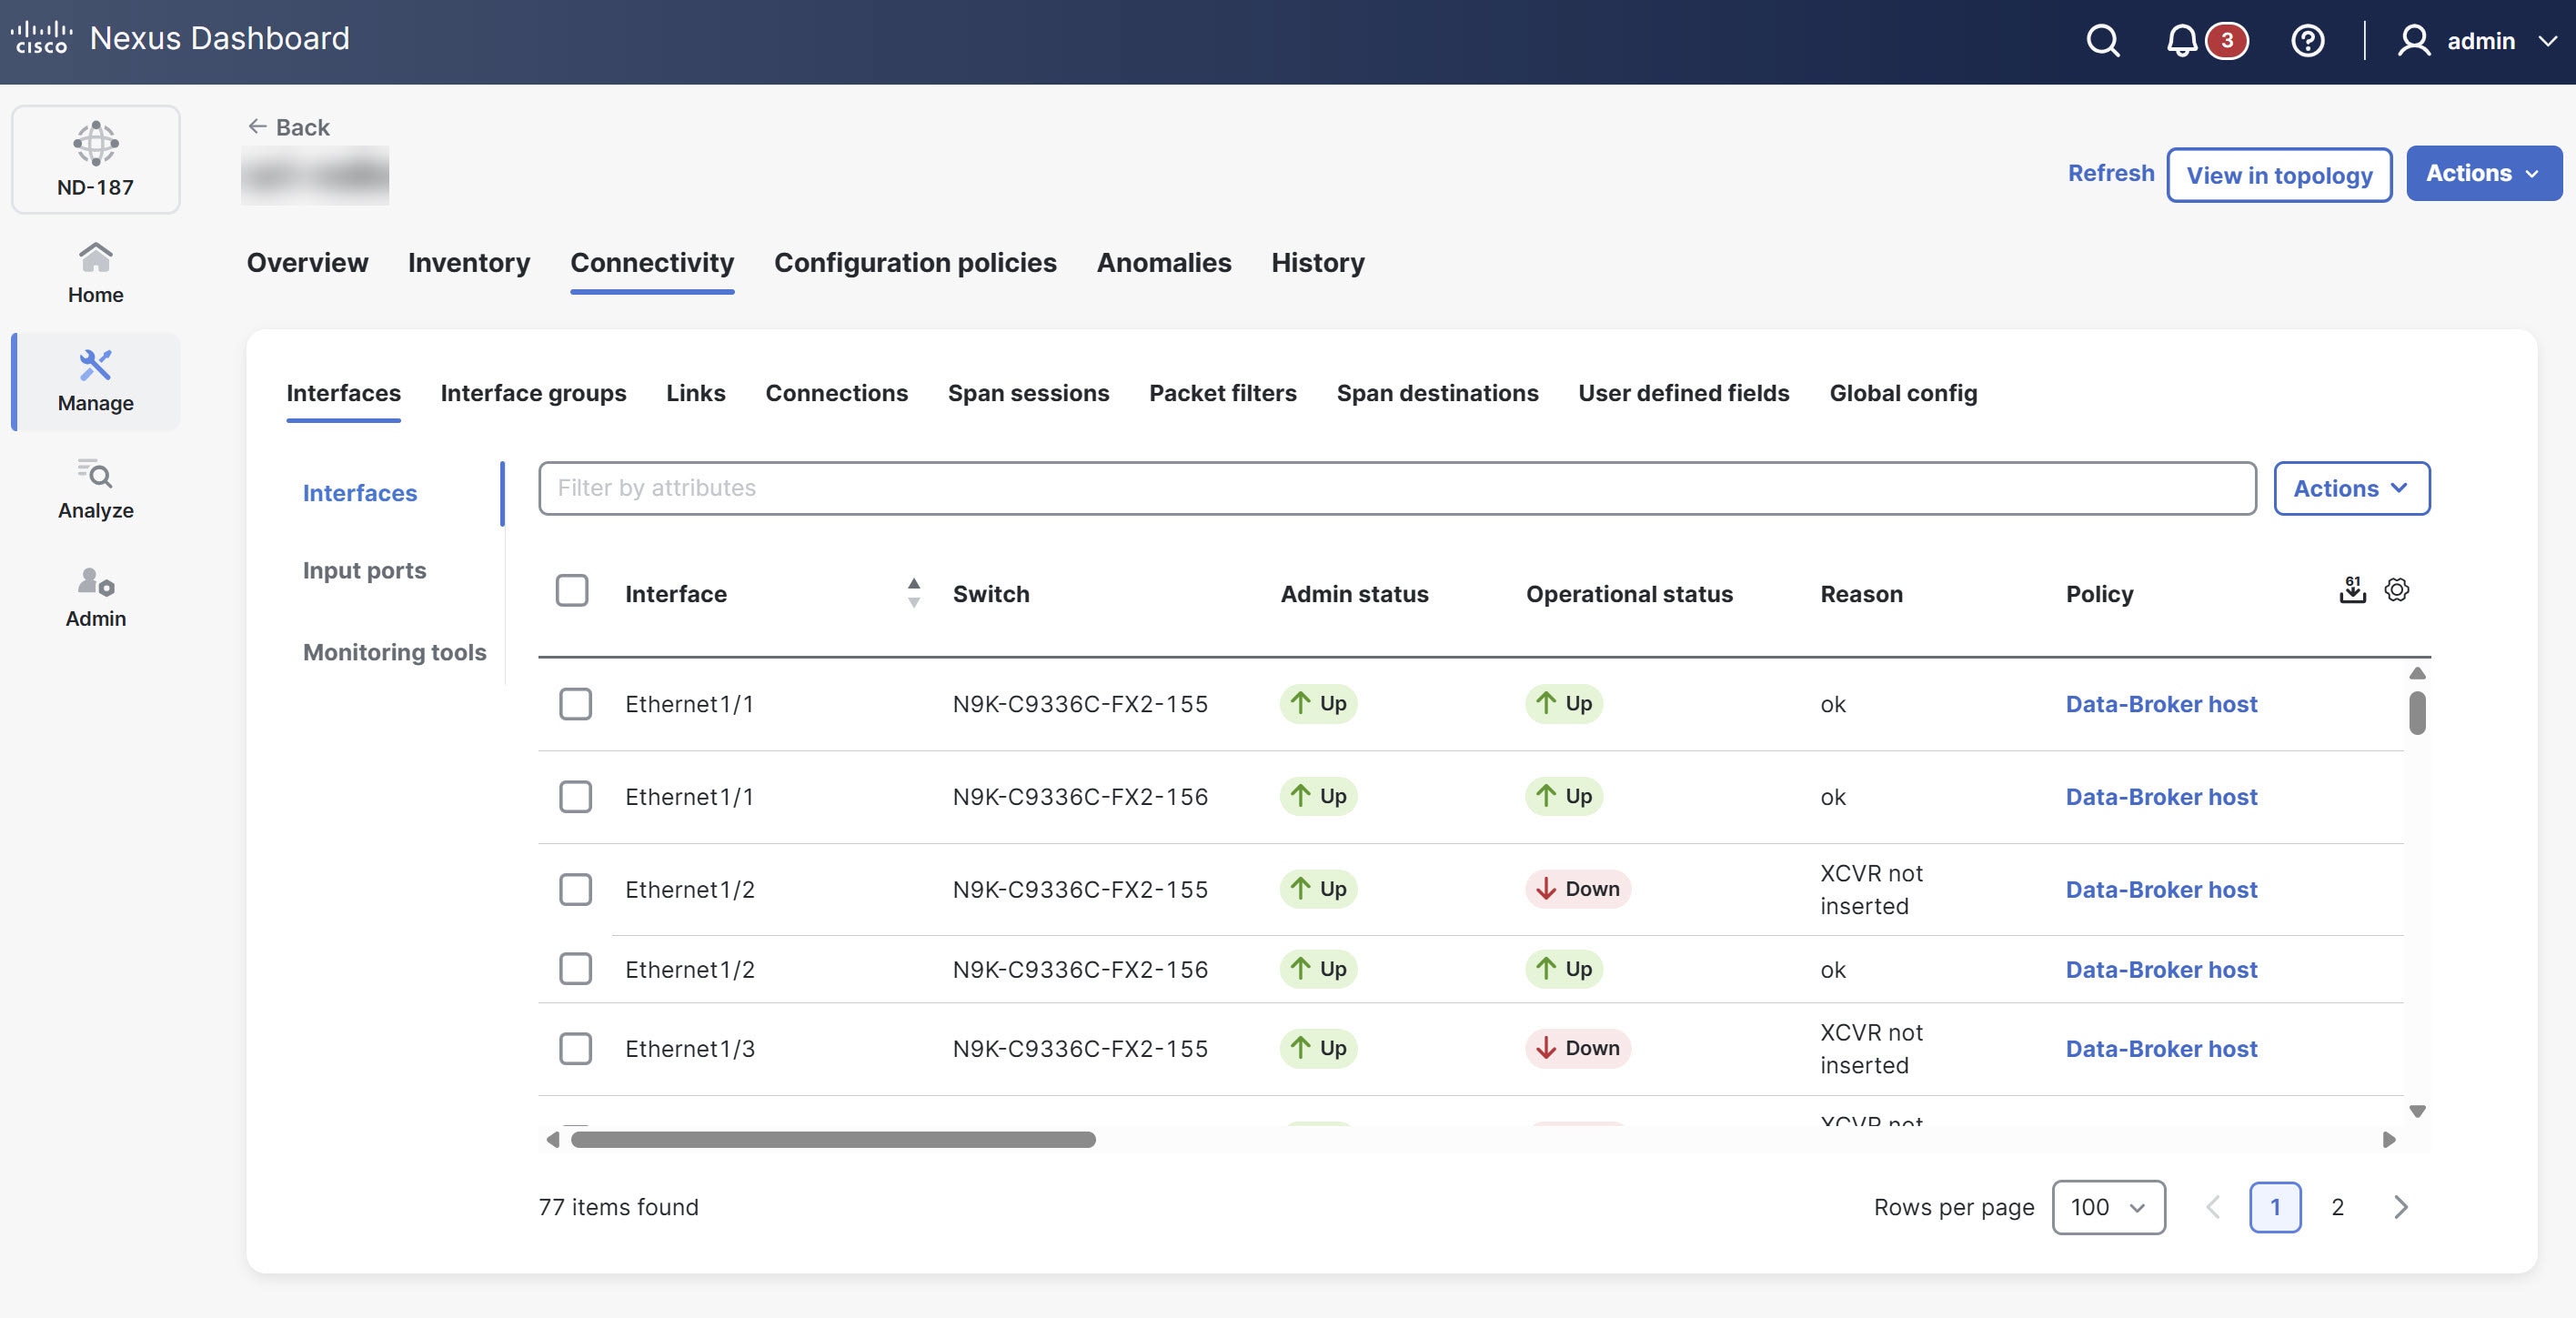
Interfaces
The Interfaces tab displays a list of network interfaces. It shows details such as the interface name, associated switch, administrative status, operational status, the reason for its status, and any applied policies. It allows you to view and manage the individual network ports within the NDB fabric.
View interfaces
Follow these steps to view the configured interfaces.
-
Click the Interfaces tab and then click Interfaces.
Nexus Dashboard displays the details of the existing interfaces.
For more information, see Interfaces.
Port channels
A port channel is a logical interface created by aggregating multiple physical interfaces. In an NDB fabric, port channels bundle up to eight active links to increase bandwidth and redundancy. If a member port fails, traffic automatically switches to the remaining ports in the bundle.
You can choose a port channel as the underlying interface when you configure connectivity for the input ports and monitoring tools.
Follow these steps to create a port channel.
-
Click the Interfaces tab and then click Interfaces.
-
From the Actions drop-down list, choose Create interface.
The Create interface page displays.
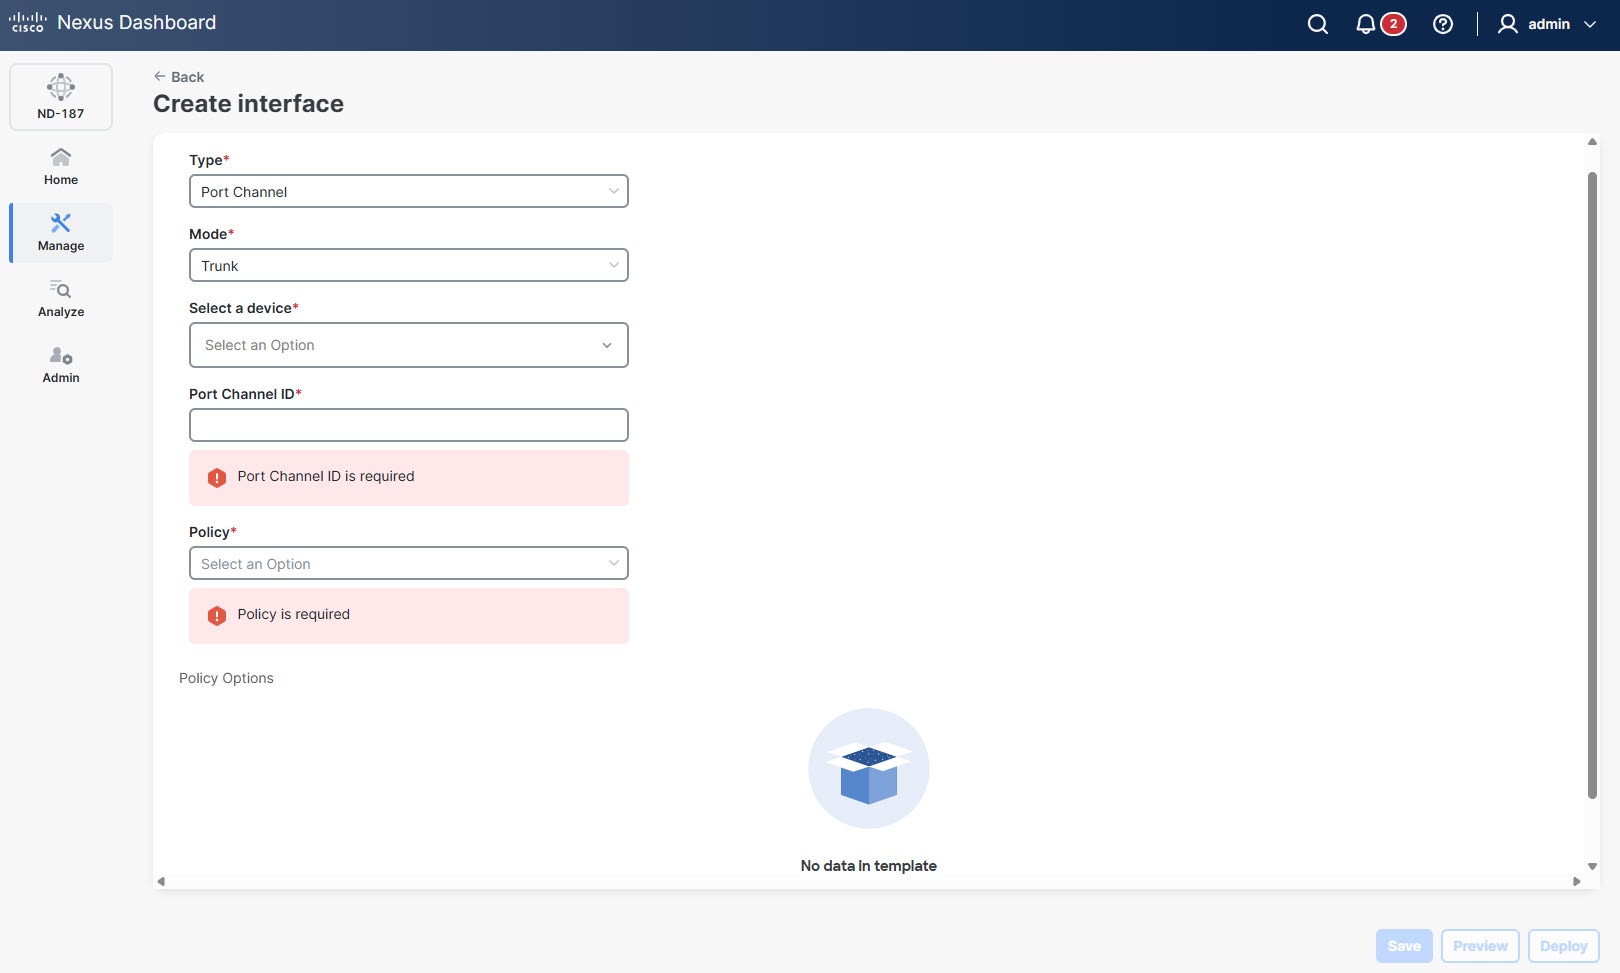
-
In the Type drop-down list, choose Port Channel.
-
Click Save.
Guidelines and limitations of port channels
-
NDB fabrics use simplified parameters and specific policy types for port channel configurations.
-
Nexus Dashboard prevents you from deleting a port channel that an active NDB port configuration (such as Input ports or Monitoring tools) uses. You must remove all dependent port configurations or connections before you delete the port channel.
-
Nexus Dashboard applies any configuration changes you make to the port channel to each member interface in that bundle.
Input ports
The Input ports tab displays details of the input ports on the NDB devices. An input port is a specific port on a device that acts as an entry point for traffic managed by the data broker.
When you define an Edge-SPAN, Edge-TAP, or a Remote Source Edge-SPAN port in the NX-API configuration mode, Nexus Dashboard automatically configures the spanning-tree bpdufilter enable command in the interface mode on these ports to filter BPDU packets. This configuration applies to all Cisco Nexus 9000 series switches.
Ensure to configure the spanning-tree bpdufilter enable command on all the inter-switch ports for Cisco Nexus series switches.
View input ports
Follow these steps to view the configured input ports.
-
Click the Interfaces tab and then click Input ports.
Nexus Dashboard displays the details of the existing input ports.
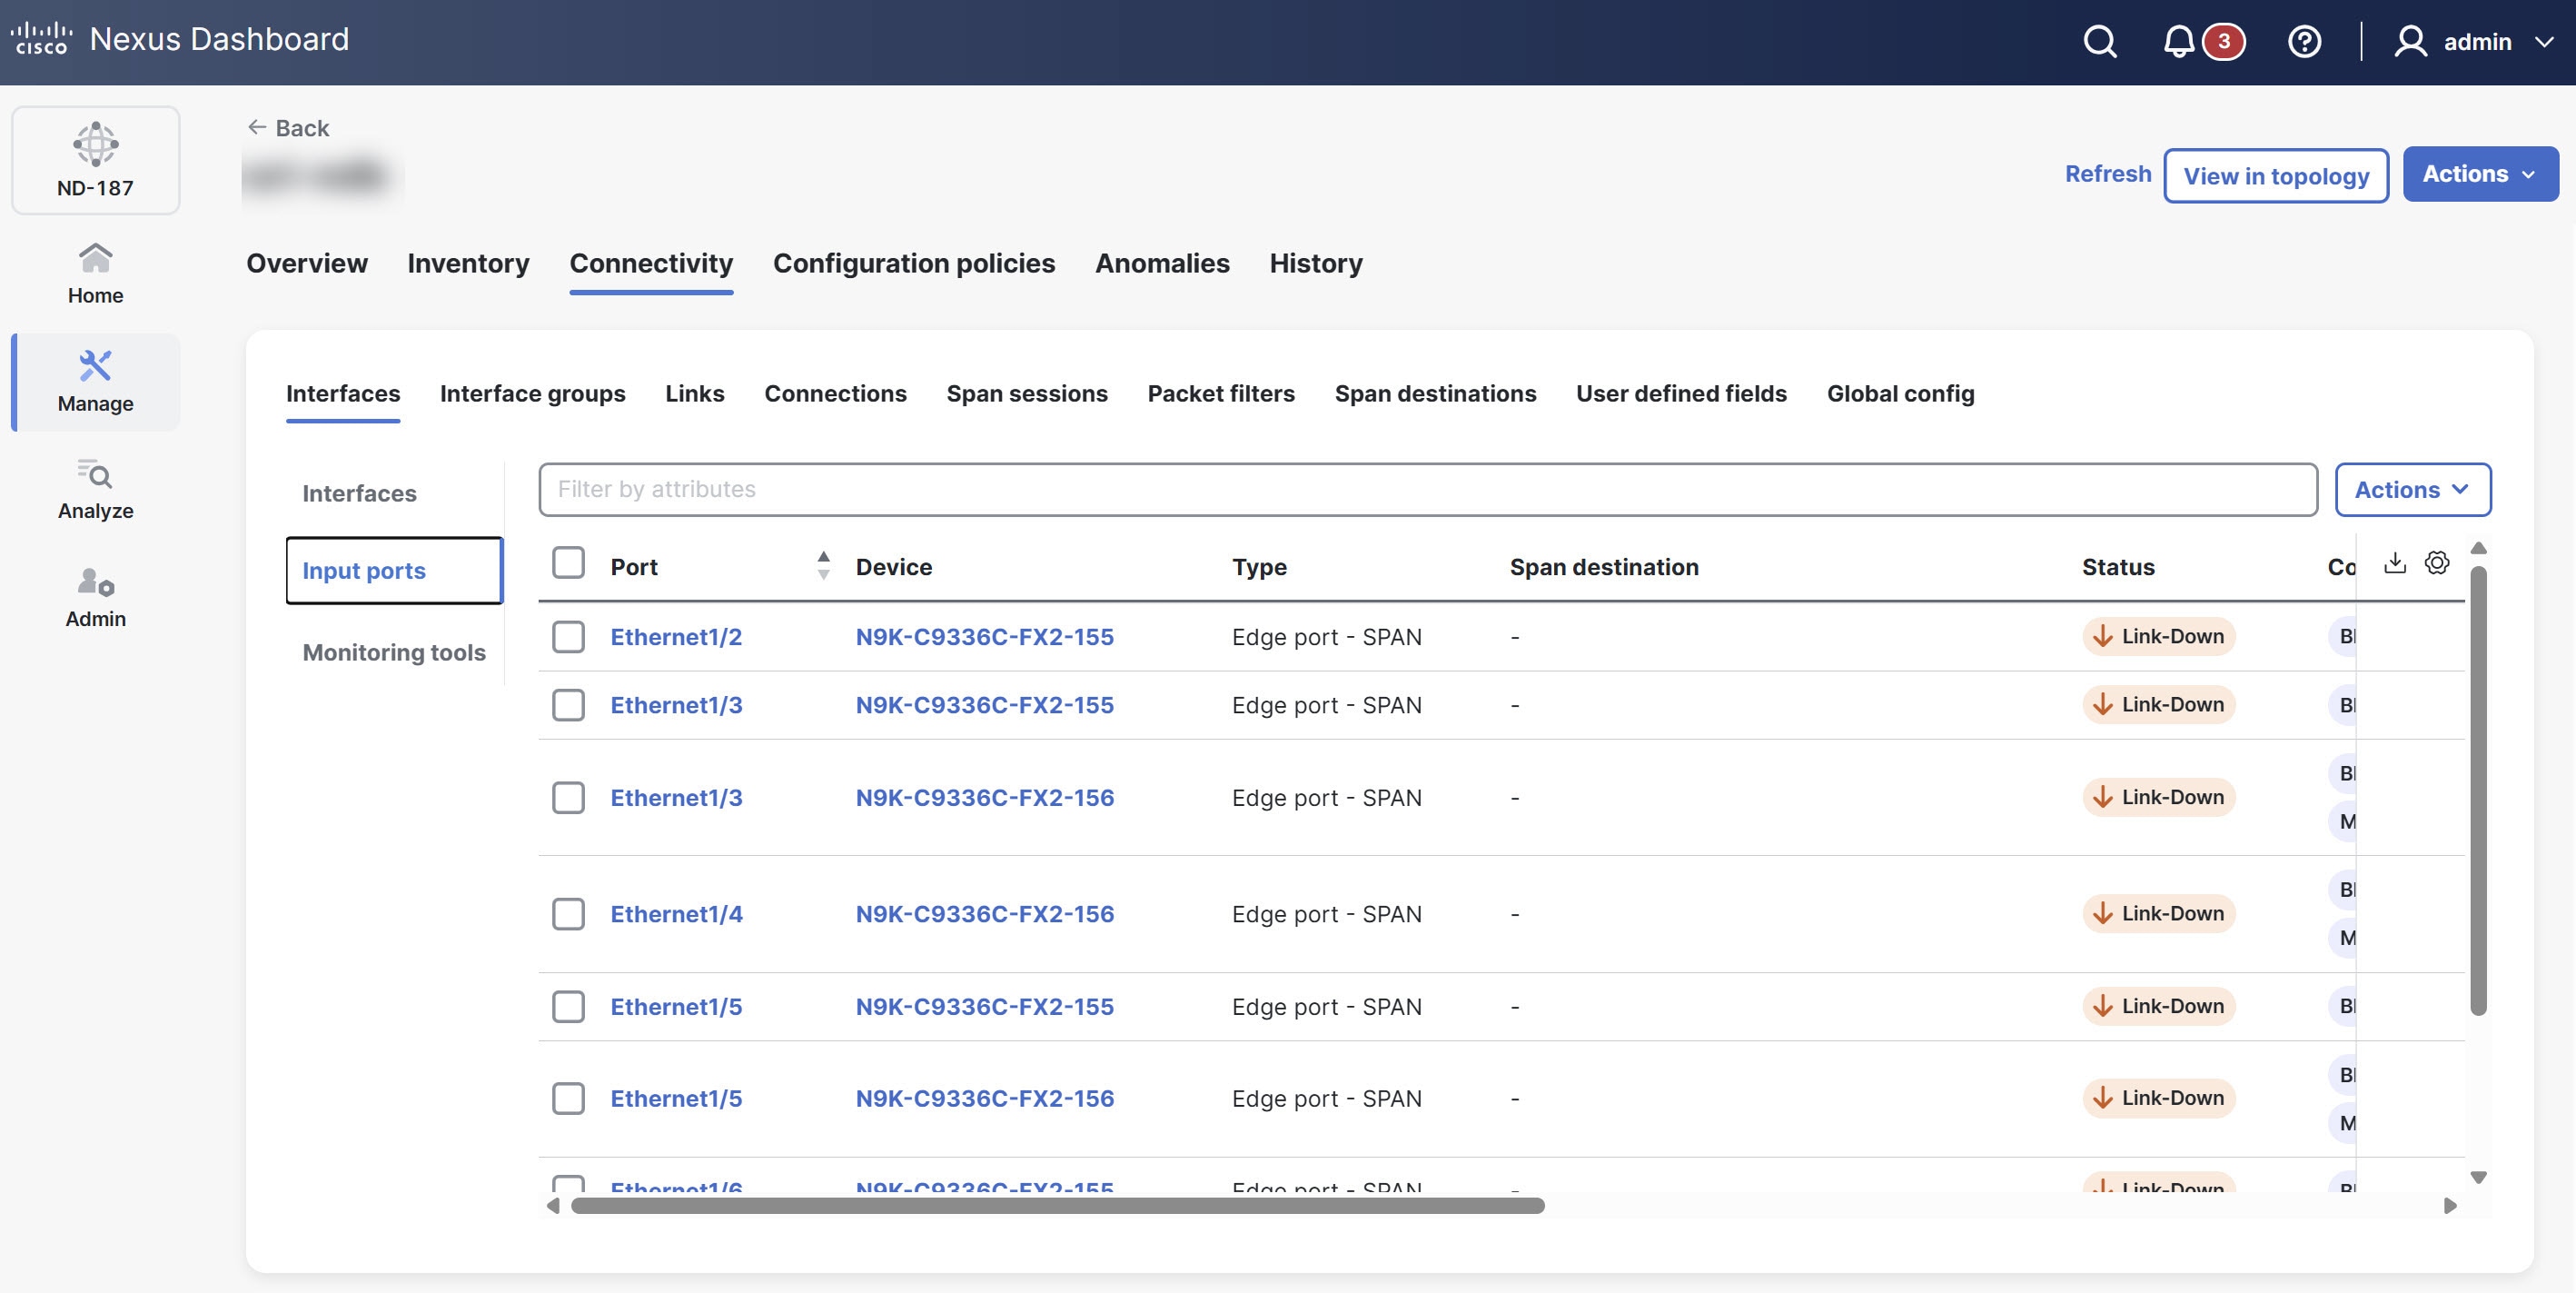
The Input ports table provides the following information for each input port.
| Field | Description |
|---|---|
|
Port |
The unique identifier for the network port (For example, Ethernet1/1). |
|
Device |
The name or identifier of the network device on which the input port is configured. |
|
Type |
Specifies the port type. The following options display.
|
|
Span destination |
Indicates if the port is configured as a SPAN destination. |
|
Status |
The current operational status of the port. This reflects active state of the port. |
|
Configuration |
Provides a summary or link to the detailed configuration settings applied to this specific port. |
|
Description |
Description of the port. |
|
In use |
Displays Yes or No to indicate if the port is currently active and processing traffic, or if it is provisioned but idle. |
|
Status description |
Provides a detailed explanation about the current status of the port. |
|
Created by |
The user who created the input port. |
|
Modified by |
The user who modified the input port. |
Add input port
-
You must have added one or more devices to Nexus Dashboard.
-
Some input port parameters are defined at the device level from the Global config tab. To define the following parameters, see [Edit global config].
-
PTP
-
NetFlow
-
MPLS filtering
-
Jumbo MTU
-
Follow these steps to add an input port.
-
Click the Interfaces tab and then click Input ports.
-
From the Actions drop-down list, choose Add input port.
The Device page displays.
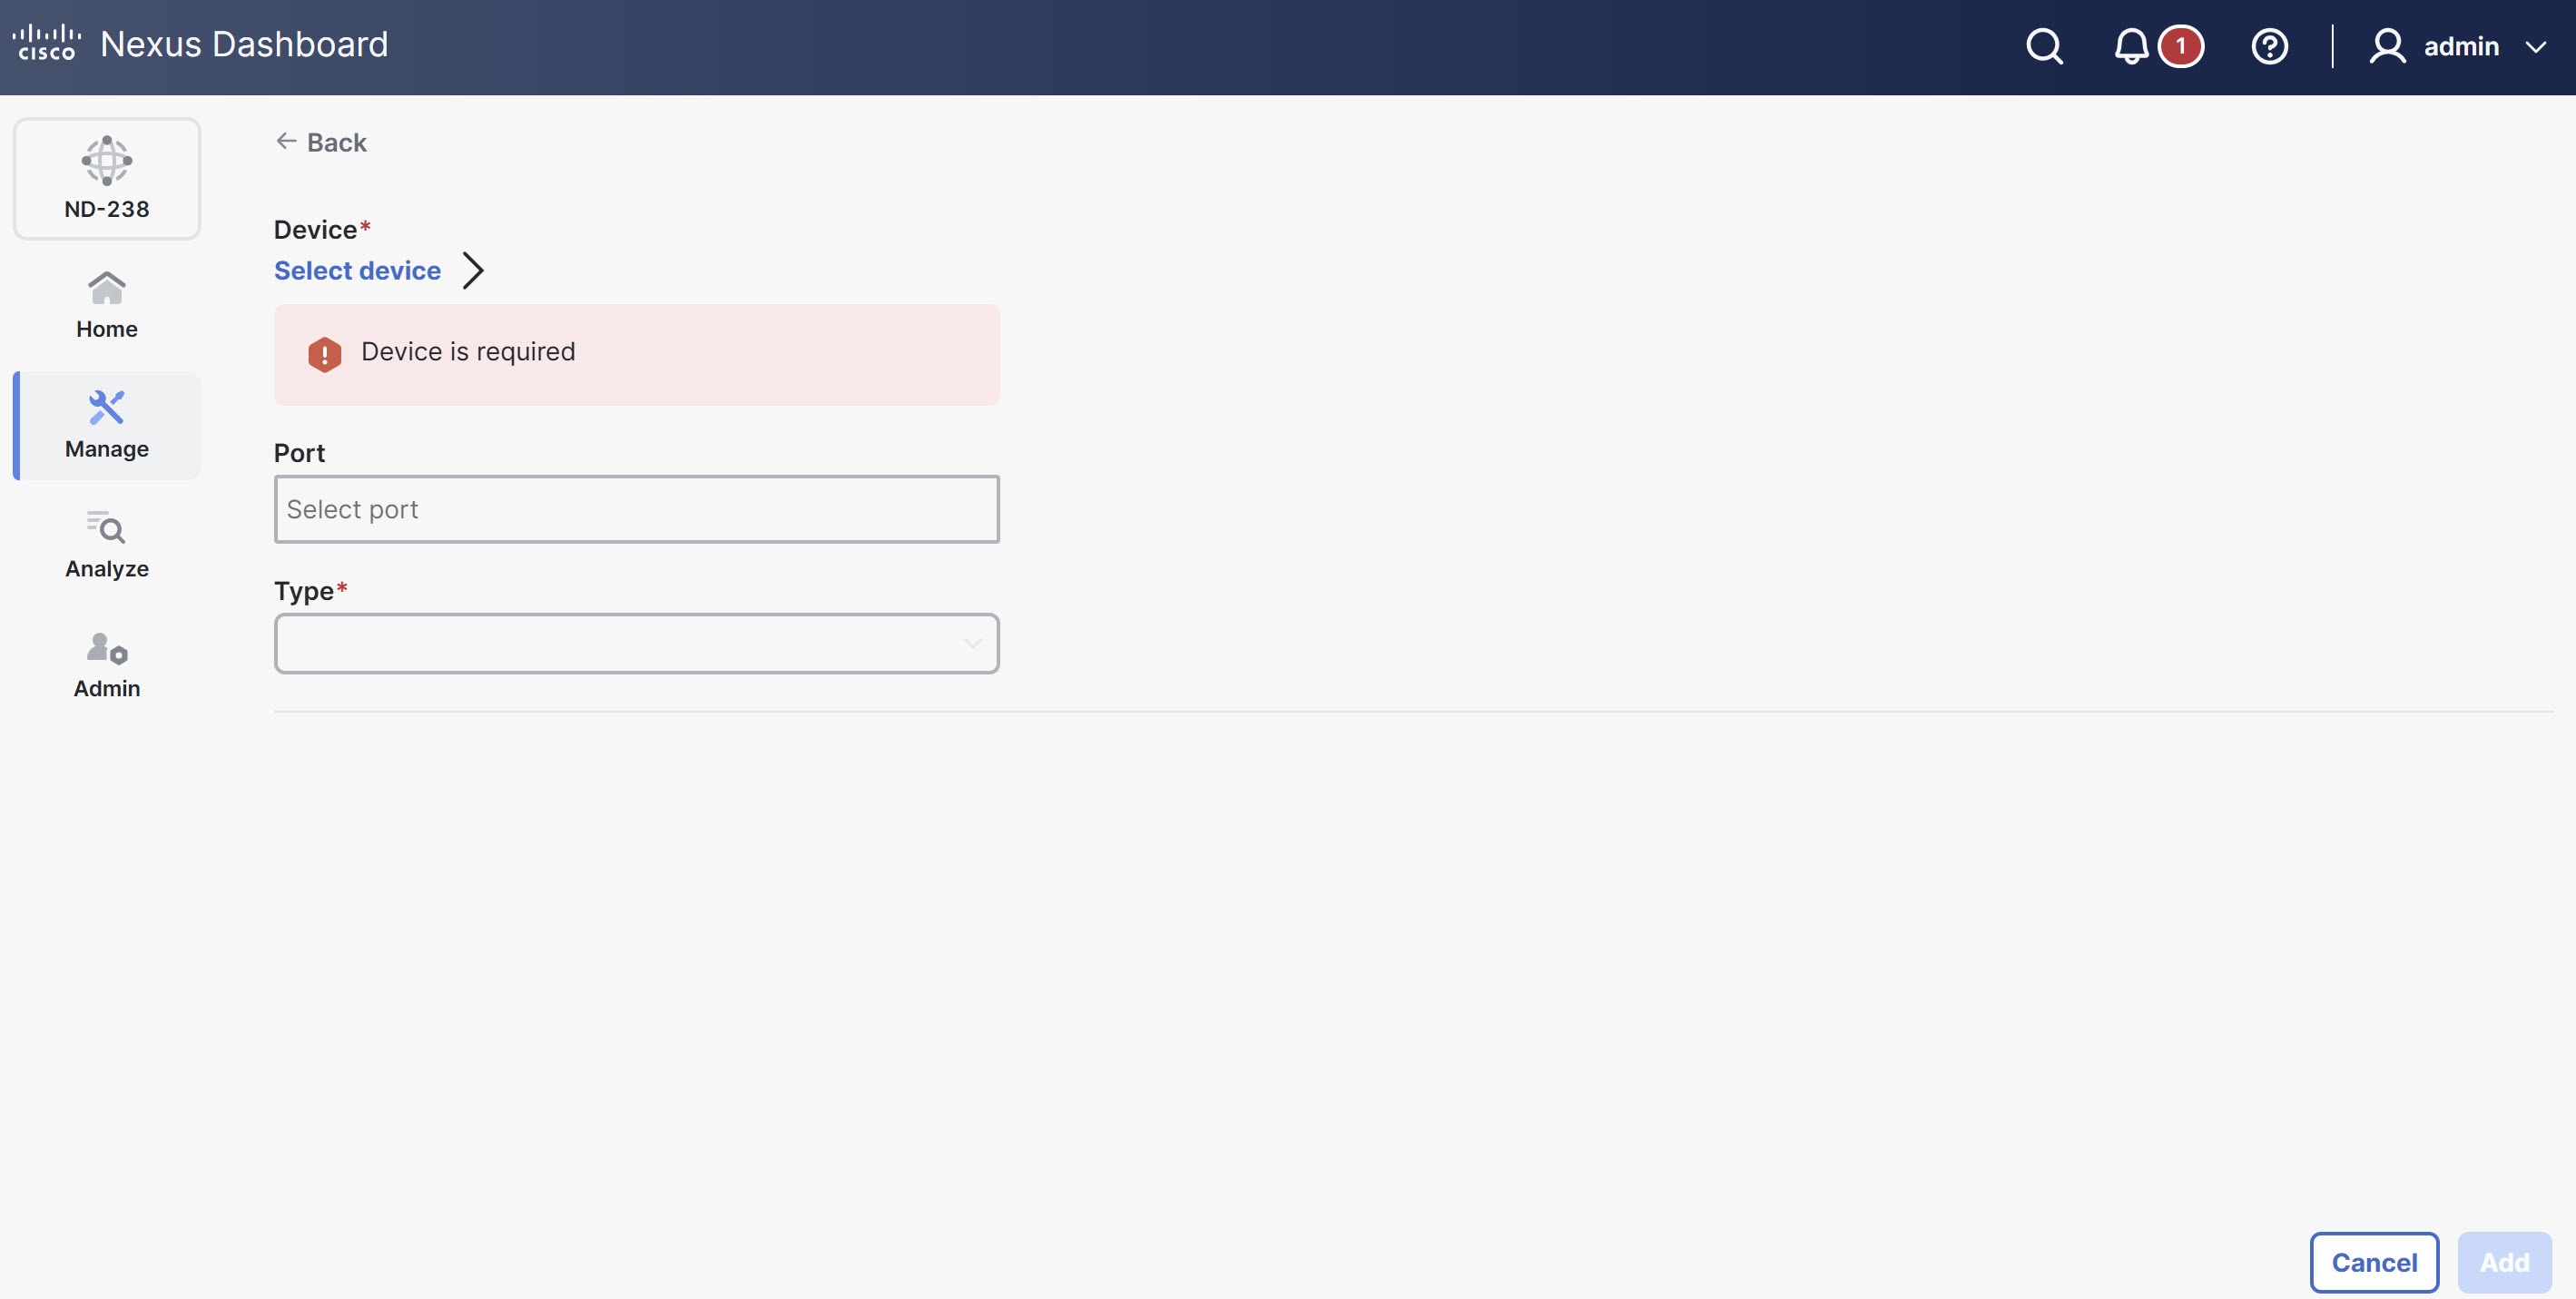
-
Click Select device.
The Select device dialog box displays.
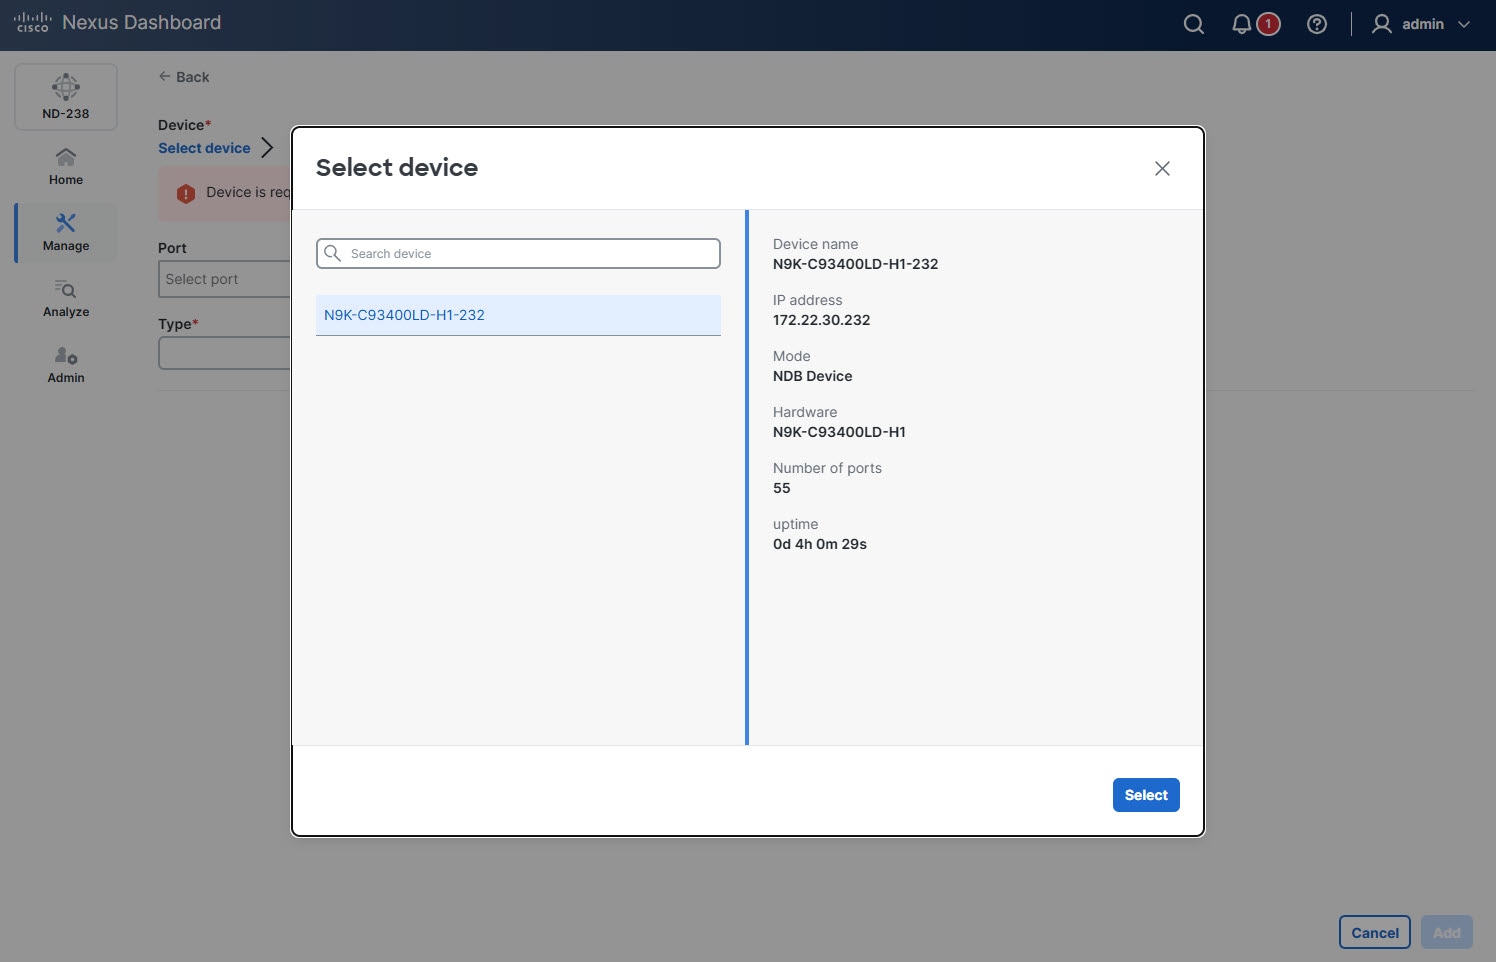
-
Choose the device and click Select.
-
In the Port field, click Select port.
The Select port dialog box displays.
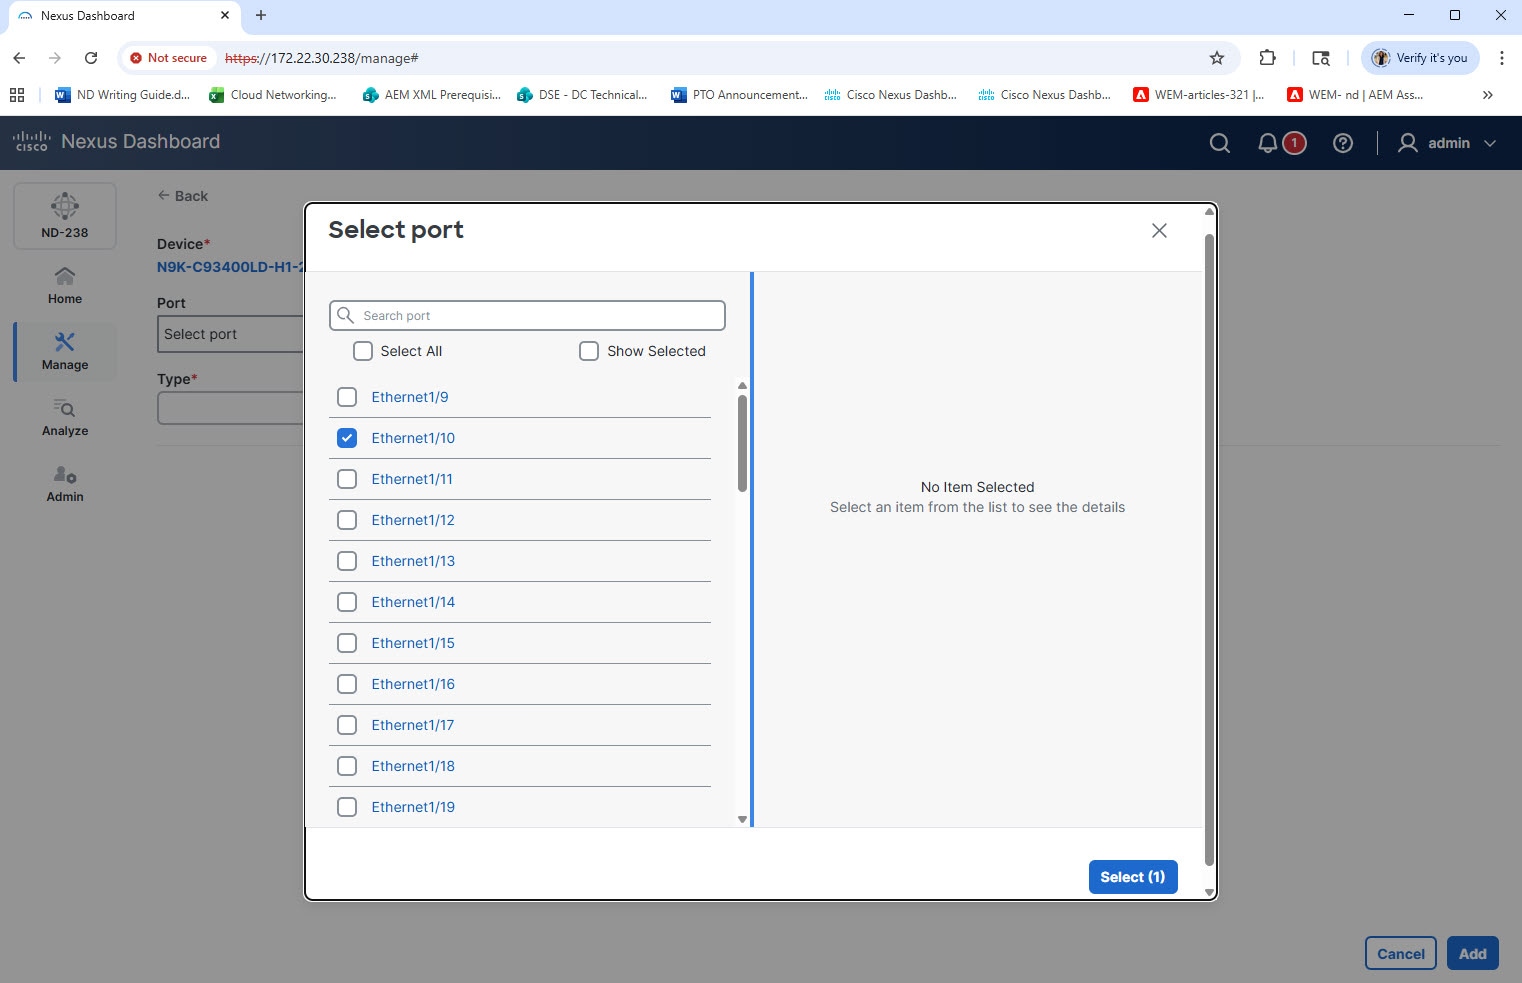
-
Choose the port(s) and click Select.

Choose either a physical port or a pre-configured port channel. Retain the port channel configuration for as long as the input port or monitoring tool uses it.
-
From the Type drop-down list, choose one of the following.
-
Edge port-SPAN — creates an edge-port for incoming traffic from a configured SPAN session of the production switch.
-
Edge port-TAP — creates an edge port for incoming traffic from a physical TAP device on an ISL.
-
Remote source edge-SPAN — creates an edge-port that handles incoming traffic from a configured remote session of the production switch. (You can use the SPAN destination when an APIC controller is connected.)
-
Packet truncation — creates a port for redirecting the traffic from the input port to the packet truncation port. The truncated packets from the packet truncation port reach the monitoring tool.
The configuration fields update dynamically based on the Type you choose.
-
-
In the Port description field, provide description for the port.
-
In the VLAN ID field, enter the VLAN ID.
Nexus Dashboard configures the port as dot1q to preserve any production VLAN information. The VLAN ID identifies the port from which the traffic originates.
You must configure Q-in-Q VLAN on all input ports in an ISL connection. After you configure an interface with Q-in-Q, do not apply VLAN filters to that Q-in-Q configured interface.
-
Choose one of the following options.
-
Block Rx
-
Block ICMP v6 Neighbour Solicitation
-
Enable timestamp tagging
-
Enable MPLS filtering
-
Apply Jumbo MTU
-
-
From the Netflow monitor drop-down list, choose Select netflow monitor.
-
From the Destination device type drop-down list, choose Controller.
-
Provide additional details based on the type of device you choose.
-
Click Add.
Edit input port
Follow these steps to edit an input port.
-
Click the Interfaces tab and then click Input ports.
-
Choose a port.
The Port name page displays.
-
From the Actions drop-down list, choose Edit.
Delete input port
Follow these steps to delete an input port.
-
Click the Interfaces tab and then click Input ports.
-
Choose a port.
The Port name page displays.
-
From the Actions drop-down list, choose Delete.
Monitoring tools
The Monitoring Tools tab displays details of the monitoring tool ports for NDB devices. The monitoring tool receives traffic sent from the monitoring tool port of an NDB device.
View monitoring tools
Follow these steps to view the configured input ports.
-
Click the Interfaces tab and then click Monitoring tools.
Nexus Dashboard displays the details of the monitoring tool ports.
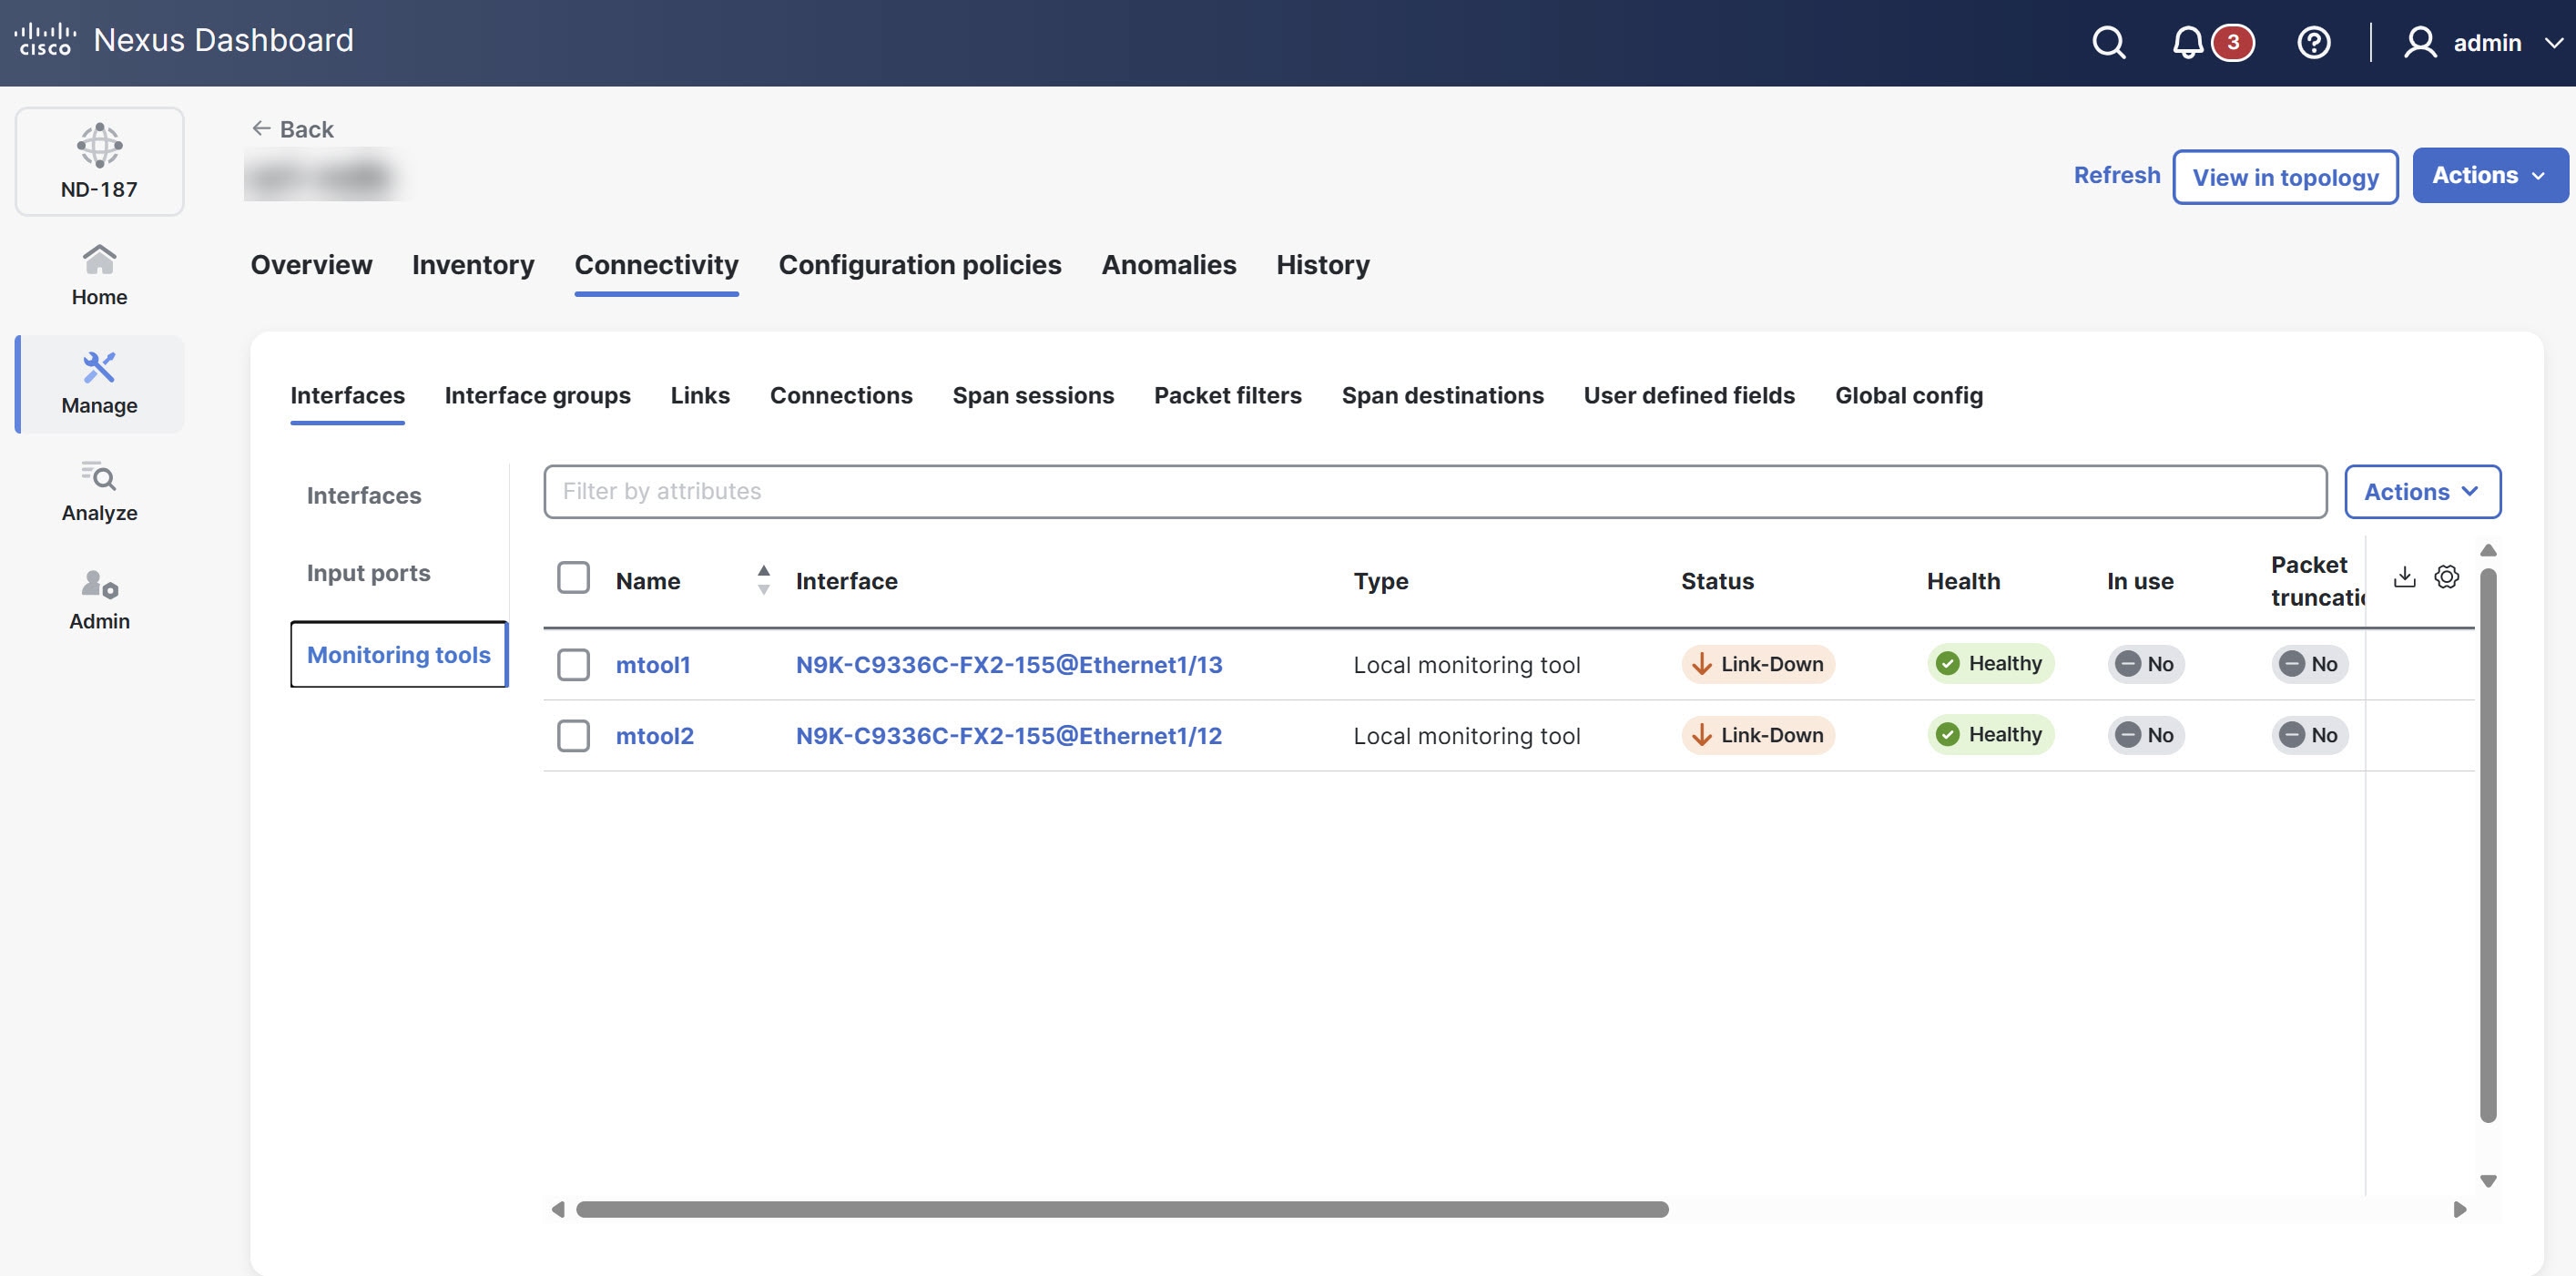
The Monitoring tools table provides the following information.
| Field | Description |
|---|---|
|
Name |
Specfies the name assigned to the monitoring tool configuration. |
|
Interface |
Indicates the specific device and port identifier where the monitoring tool is connected. |
|
Type |
Specifies the type of monitoring tool. The following options display.
|
|
Status |
Specifies the current operational state of the link (for example, Link-Down or Link-Up). |
|
Health |
Indicates the health status of the monitoring tool port using color indicators based on traffic flow. A green status signifies active traffic flow, while a red status indicates that the port detects no traffic. |
|
In use |
Indicates whether the monitoring tool port is currently active or assigned to a session (Yes/No). |
|
Packet truncation |
Indicates whether packet truncation is enabled for the traffic sent to this port. |
|
Block Rx |
Indicates whether the port is configured to block incoming (received) traffic. |
|
Status description |
Provides additional details regarding the current status. |
|
Created by |
The user who created the monitoring tool. |
|
Modified by |
The user who last modified the monitoring tool. |
Add monitoring tool
Follow these steps to add a monitoring tool port for a device.
-
Click the Interfaces tab and then click Monitoring tools.
-
From the Actions drop-down list, choose Add monitoring tool.
-
In the Name field, provide a name for the monitoring tool.
-
Click Select device.
The Select device dialog box displays.
-
Choose the device and click Select.
-
In the Port field, click Select port.
The Select port dialog box displays.
-
Choose the port(s) and click Select.
Choose either a physical port or a pre-configured port channel. Retain the port channel configuration for as long as the input port or monitoring tool uses it.
-
In the Port description field, provide a description for the port.
-
Choose one of the following Type.
-
Local monitoring tool
-
Remote monitoring tool
When you choose Local monitoring tool, choose one of the following options.
-
Block Rx
Rx traffic is blocked using unidirectional ethernet for Cisco N9K-95xx switches with N9K-X97160YC-EX line card (NX-OS 9.3(3) or later).
-
Block ICMP v6 Neighbour Solicitation
-
Enable timestamp tagging
-
Packet truncation
-
Enable timestamp strip
-
Apply Jumbo MTU
When you choose Remote monitoring tool, provide the following information.
-
Interface IP
-
Destination IP
-
ERSPAN ID
-
-
Click Add.
Delete monitoring tool
Follow these steps to delete a monitoring tool port for a device.
-
Click the Interfaces tab and then click Monitoring tools.
-
From the Actions drop-down list, choose Delete monitoring tool.
Interface groups
The Interface groups tab allows you to organize and manage different types of port and tool groups for efficient network configuration.
The Interface groups tab includes the following subtabs.
-
Input port groups
-
Monitoring tools groups
Input port groups
A port group consists of input ports from a device or from different devices. You can combine edge-span and edge-tap ports from various devices to create port groups. When you create a connection, you can choose multiple input ports at once by choosing an input port group, rather than choosing each input port separately.
View input port groups
Follow these steps to view the configured input ports.
-
Click the Interface groups tab and then click Input port groups.
Nexus Dashboard displays the details of the existing input port groups.
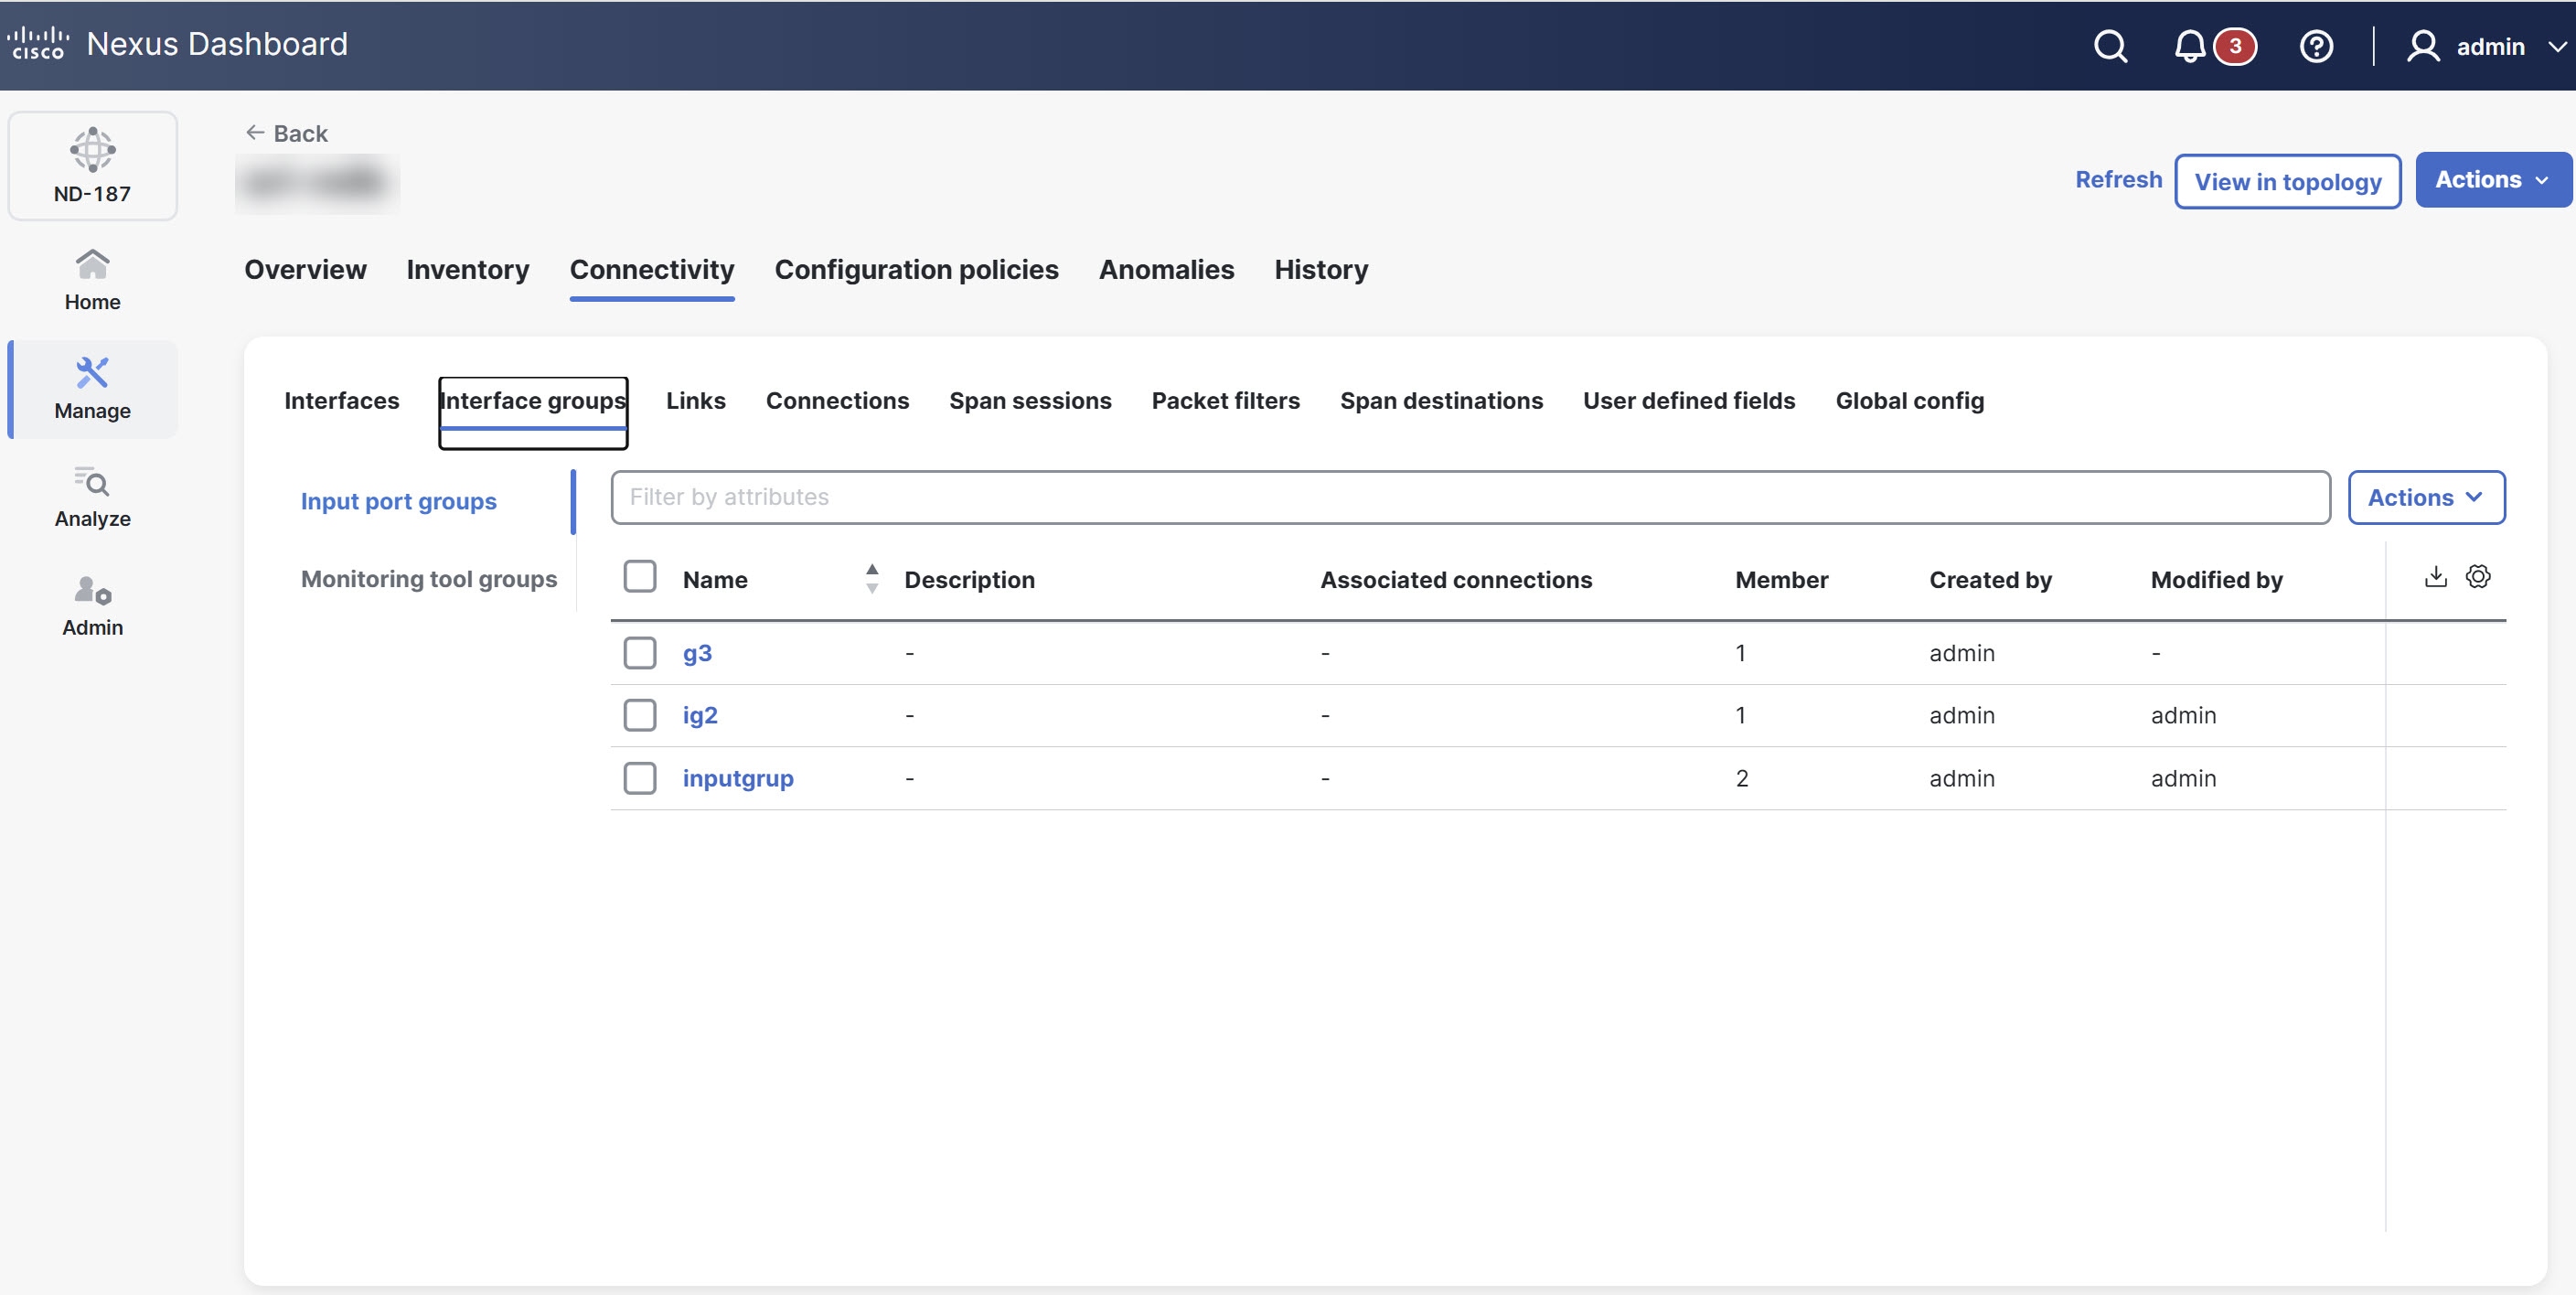
The Input port groups table provides the following information for each input port.
| Field | Description |
|---|---|
|
Name |
Name of the input port group. Click the Input port group name. The Input port groups page displays. You can perform the following actions here.
|
|
Description |
Description of the input port group. |
|
Associated connections |
The connection(s) associated with the group. |
|
Member |
The number of member input ports of the group. |
|
Created by |
The user who created the input port. |
|
Modified by |
The user who modified the input port. |
Add input port groups
Follow these steps to add an input port group.
-
Click the Interface groups tab and then click Input port groups.
-
From the Actions drop-down list, choose Add input ports group.
Provide the following details in the page that displays.
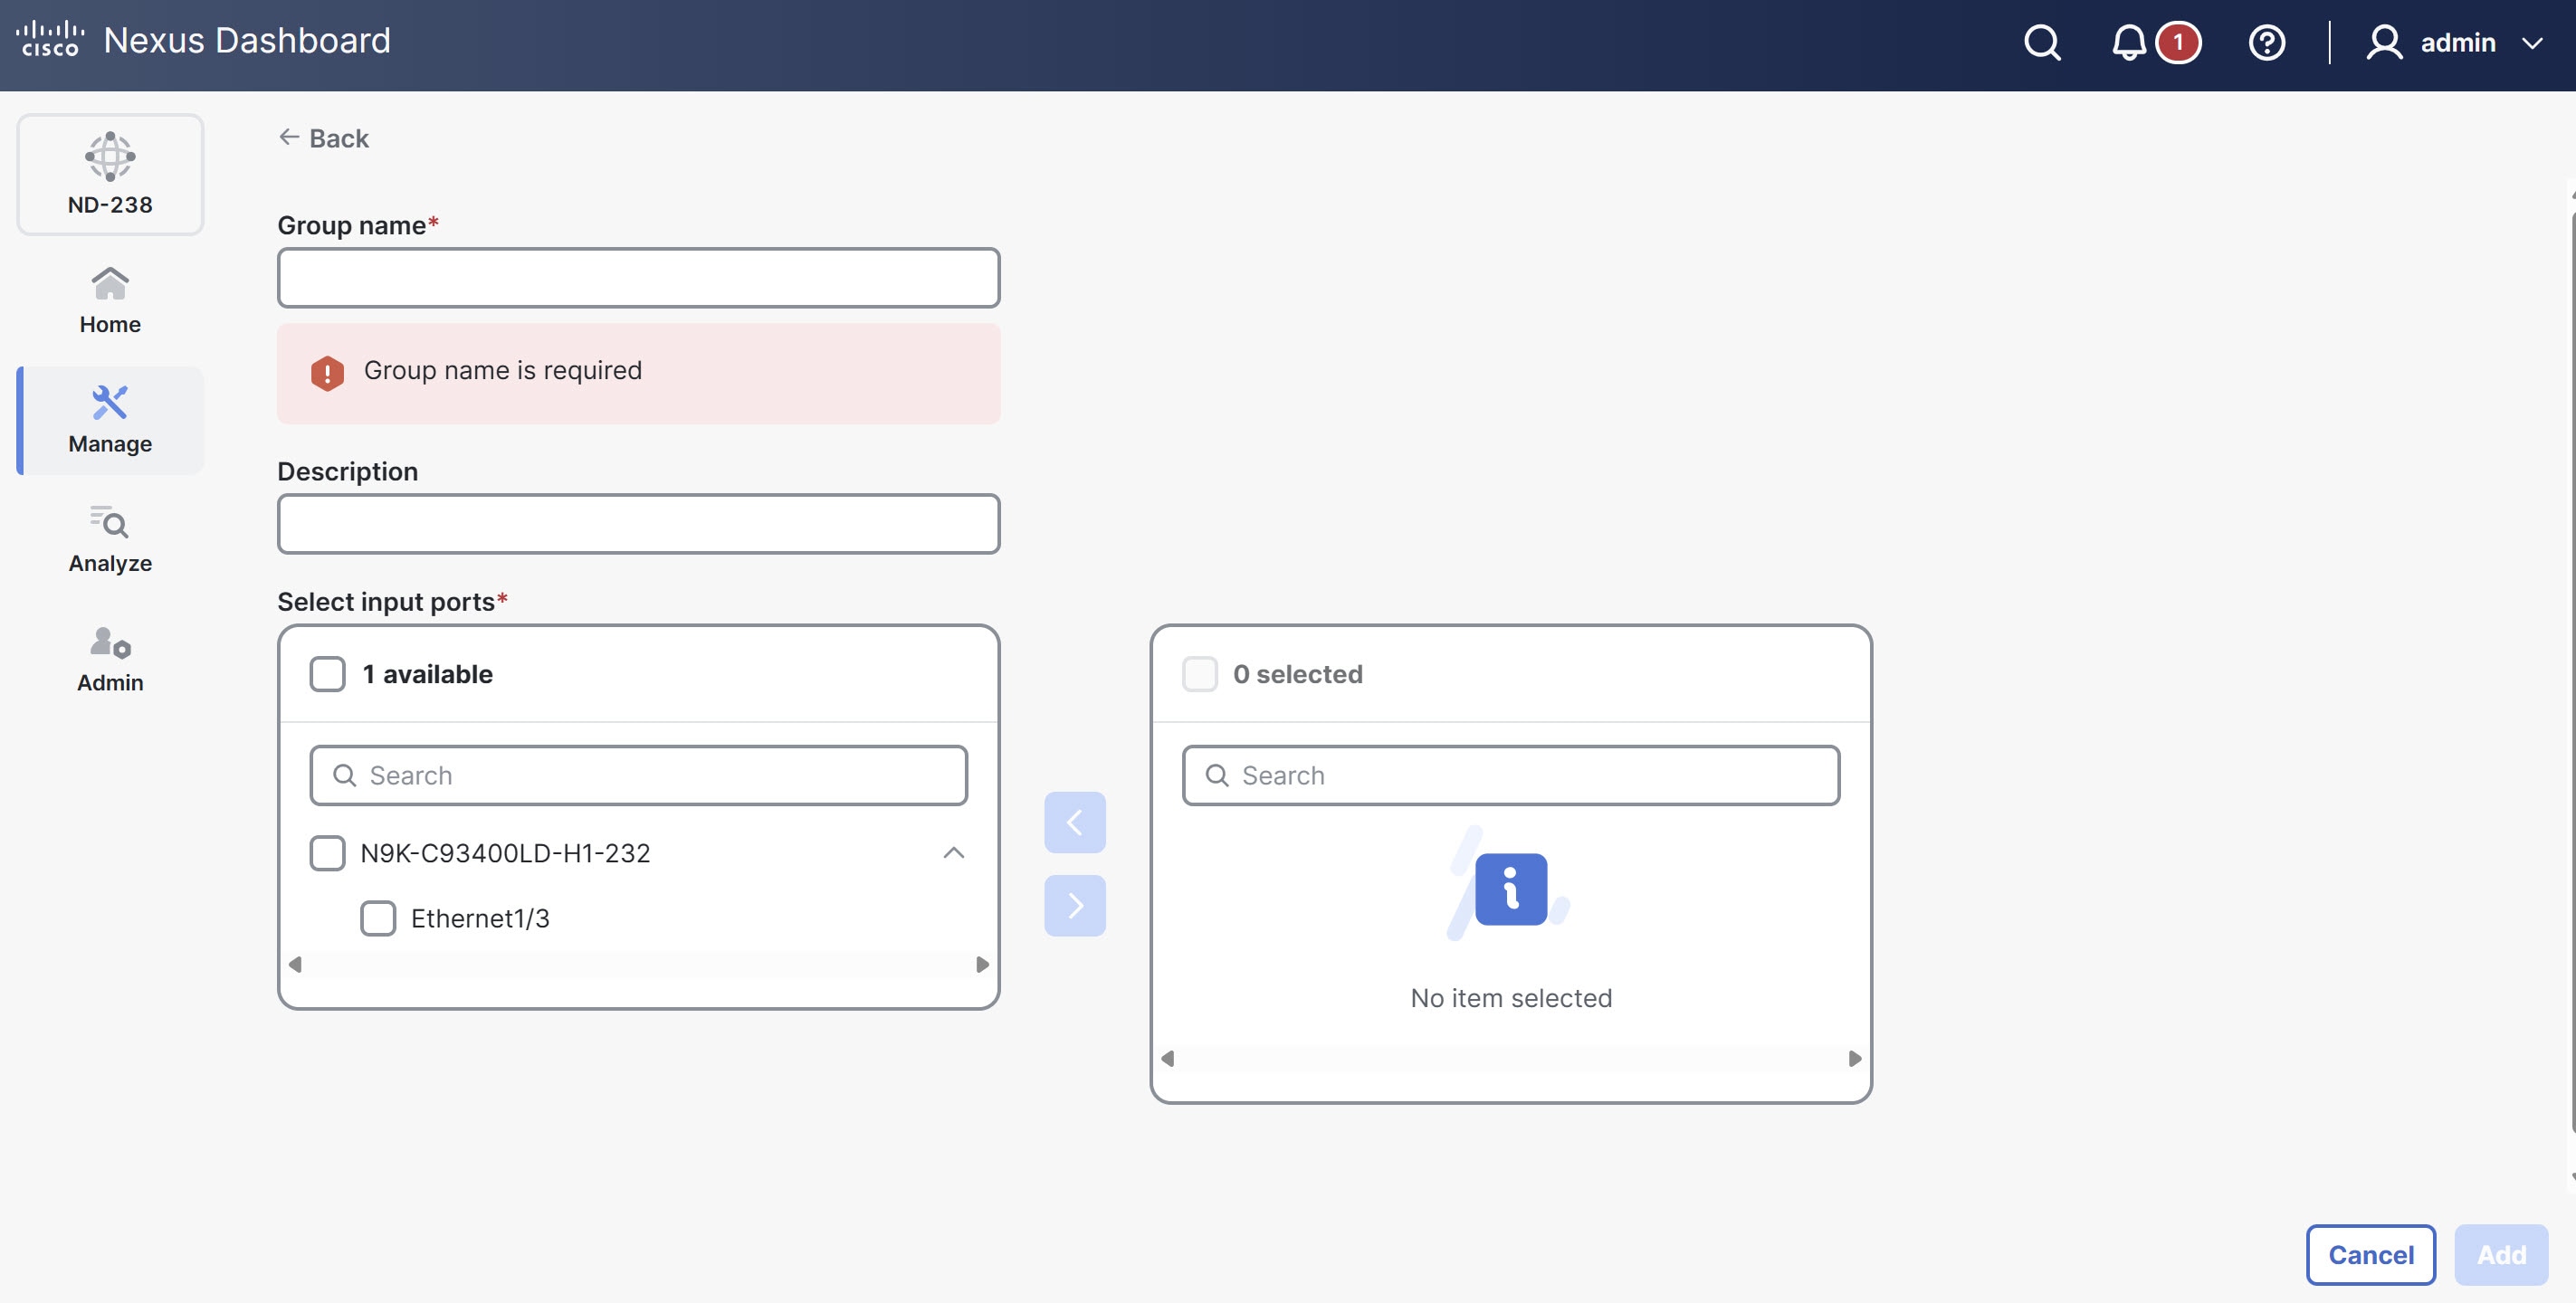
Field Description Group name
Name of the input port group.
Description
Description of the input port group.
Select input ports
This section provides two distinct areas for managing input ports. The left panel lists all available input ports, categorized by device.
Follow these steps to manage input ports for a group.
-
Choose a port to add to the group by checking its corresponding box.
-
Click the arrow (>) to move the chosen port(s) to the right panel.
The right panel displays all input ports currently assigned to the group.
-
To remove a port from the group, choose it in the right panel and click the arrow (<).
-
-
Click Add.
Edit input port groups
Follow these steps to edit an input port group.
-
Click the Interface groups tab and then click Input port groups.
-
Click the Input port group name.
The Input port groups page displays.
-
From the Actions drop-down list, choose Edit.
-
Click Save, to save the changes.
Delete input port groups
Follow these steps to delete an input port group.
-
Click the Interface groups tab and then click Input port groups.
-
From the Actions drop-down list, choose Delete input ports group.
Monitoring tool groups
A monitoring tool group consists of monitoring tool ports grouped together across devices. When you create a connection, you can choose multiple monitoring tool ports at once by choosing the required tool group, rather than choosing each port individually.
View monitoring tool groups
Follow these steps to view the configured monitoring tool groups.
-
Click the Interface groups tab and then click Monitoring tool groups.
Nexus Dashboard displays the details of the existing monitoring tool groups.
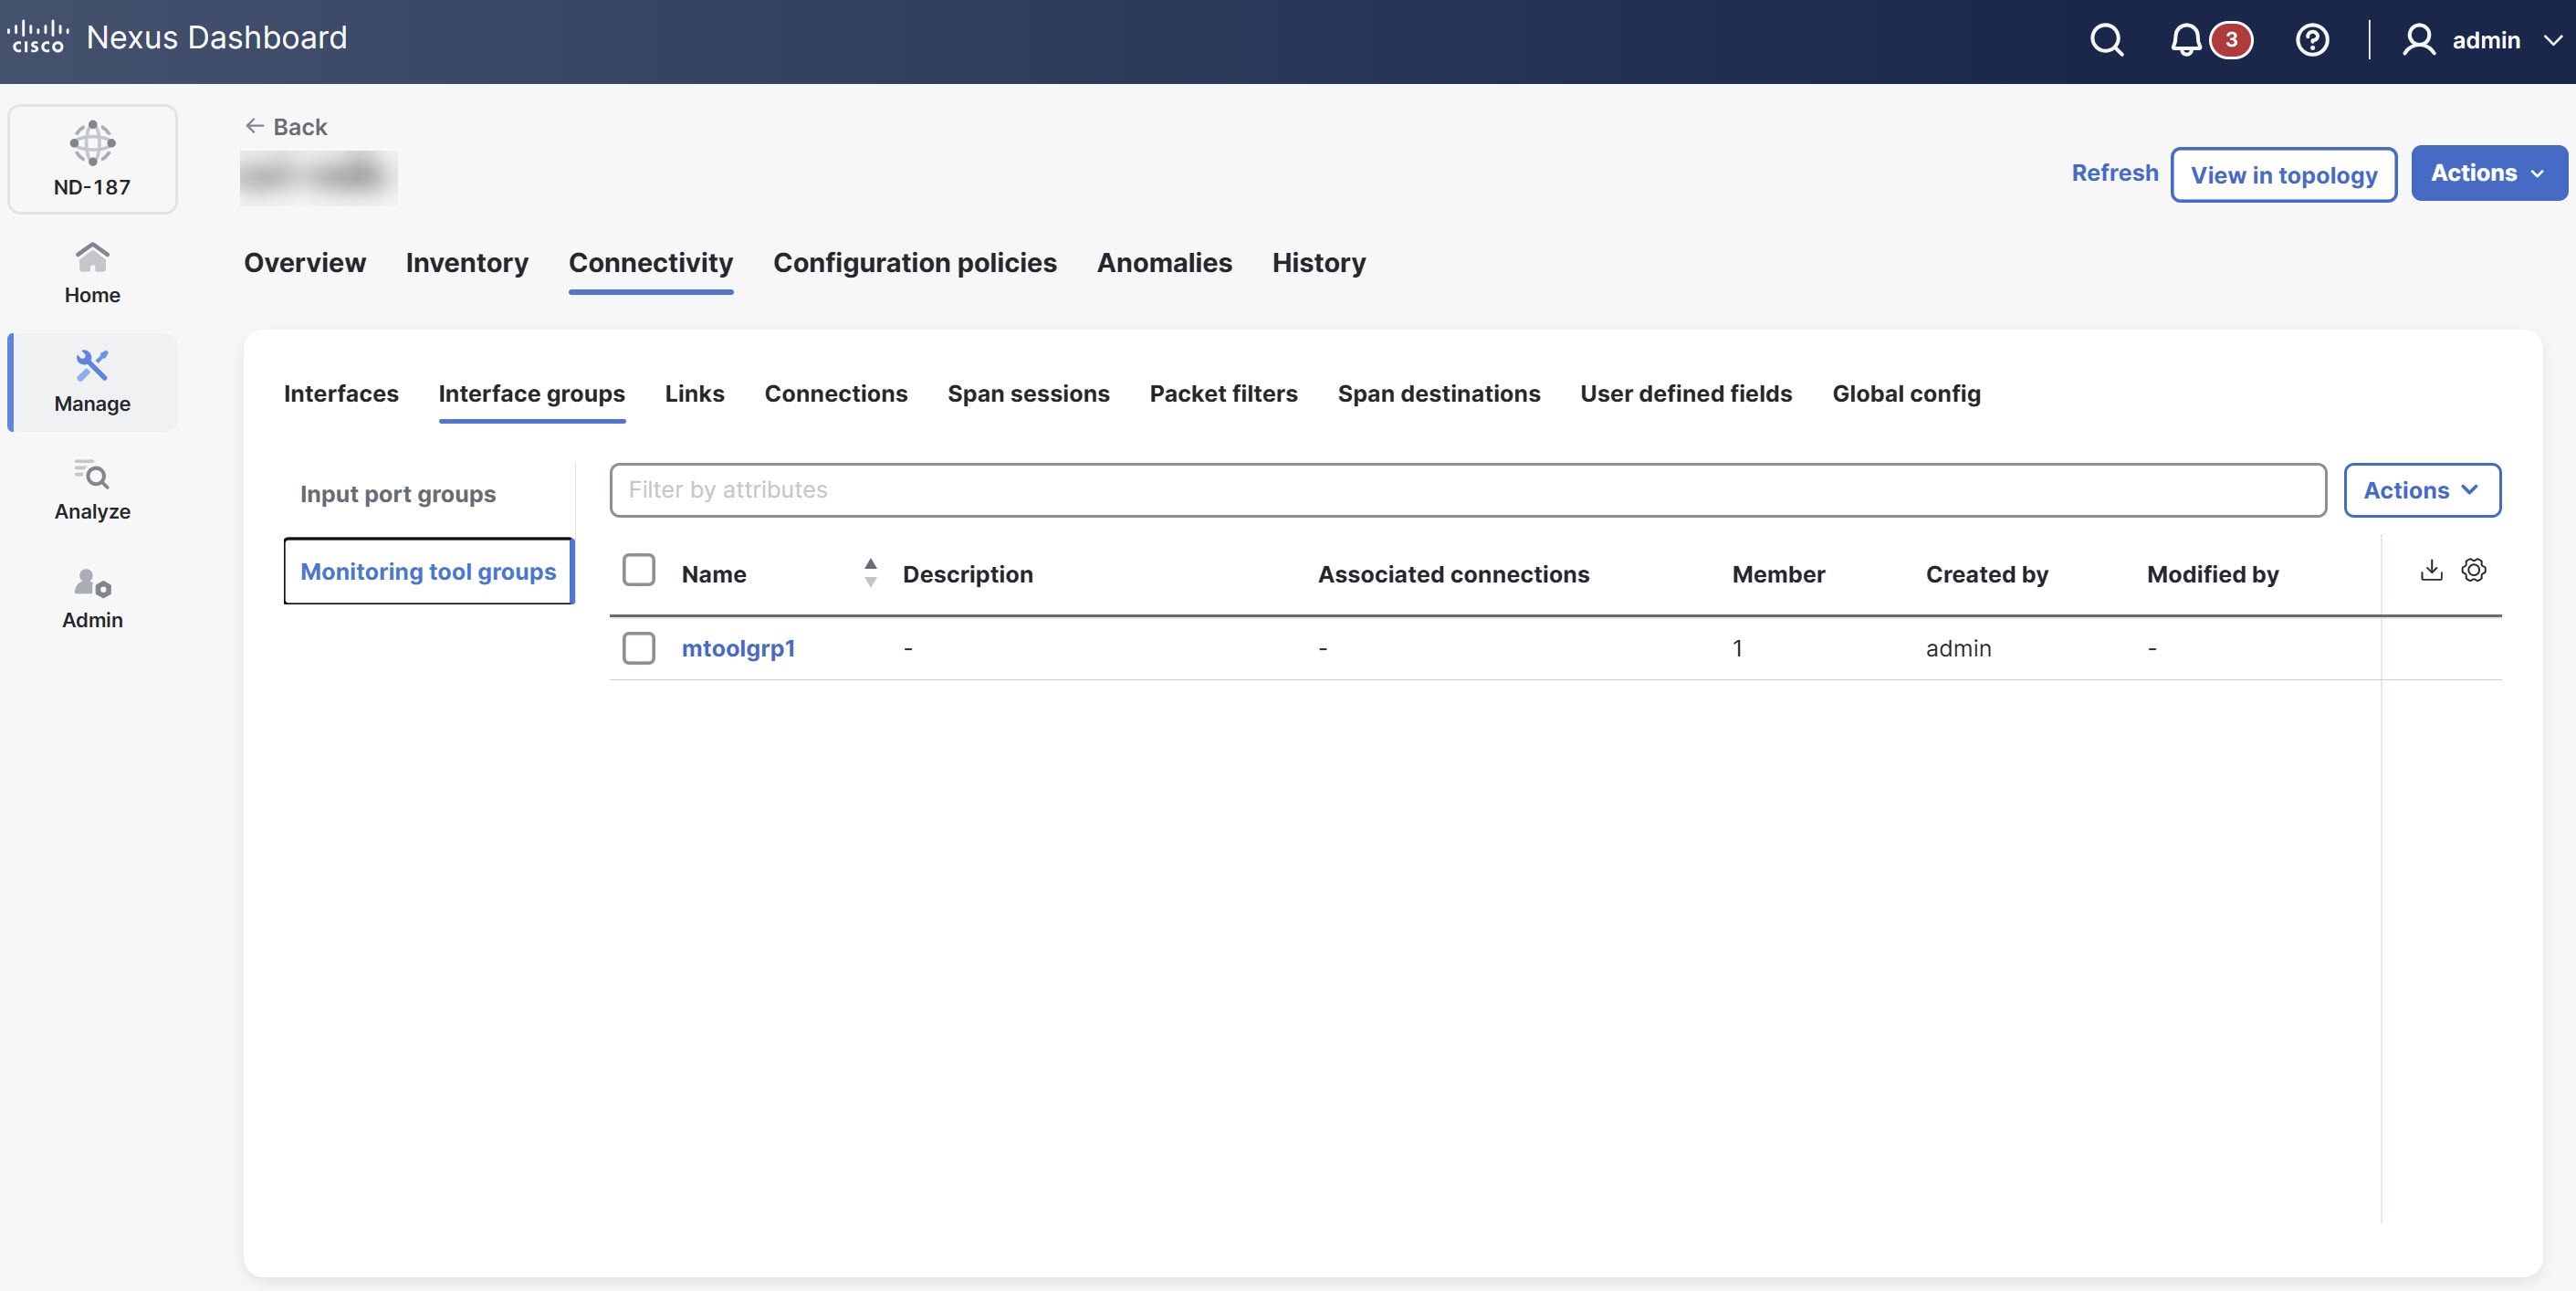
The Monitoring tool groups table provides the following information for each input port.
| Field | Description |
|---|---|
|
Name |
Name of the monitoring tool group. Click the Monitoring tool group name. The Monitoring tool groups page displays. You can perform the following actions here.
|
|
Description |
Description of the monitoring tool groups. |
|
Associated connections |
The connection(s) associated with the group. |
|
Member |
The number of member monitoring tool ports of the group. |
|
Created by |
The user who created the group. |
|
Modified by |
The user who modified the group. |
Add monitoring tool group
Follow these steps to add a monitoring tool group.
-
Click the Interface groups tab and then click Monitoring tool groups.
-
From the Actions drop-down list, choose Add monitoring tool group.
Provide the following details in the page that displays.
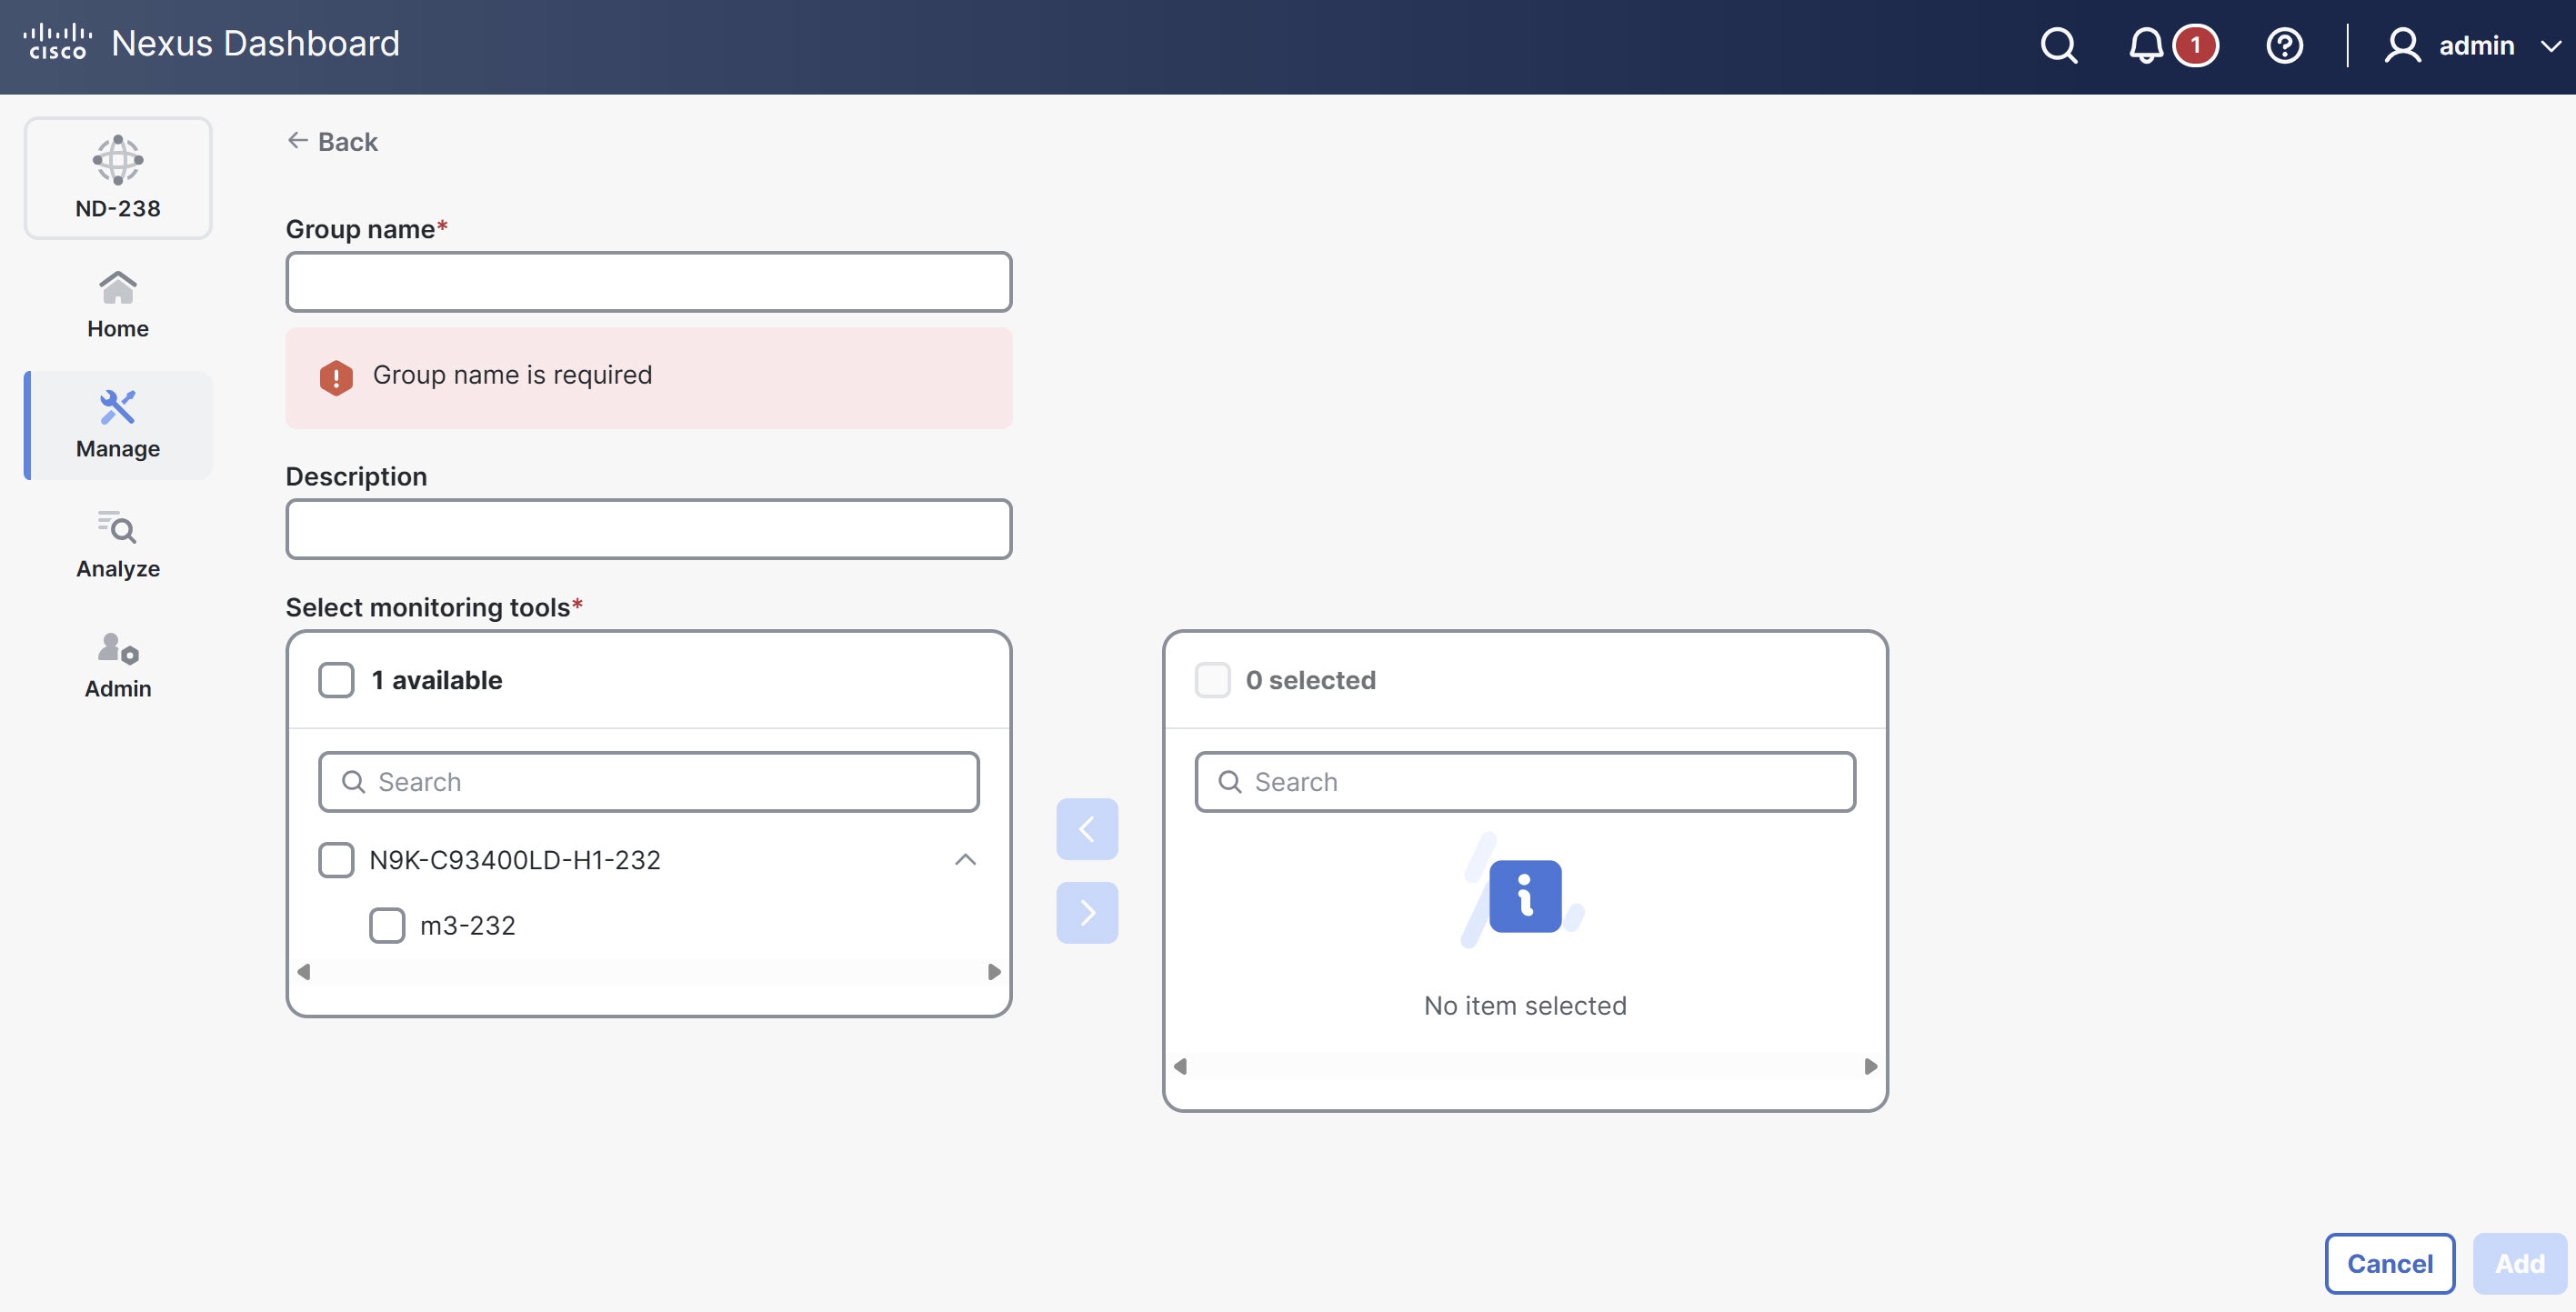
Field Description Group name
Name of the monitoring tool group.
Description
Description of the monitoring tool group.
Select input ports
This section provides two distinct areas for managing monitoring tool ports. The left panel lists all available ports, categorized by device.
Follow these steps to manage ports for a group.
-
Choose a port to add to the group by checking its corresponding box.
-
Click the arrow (>) to move the chosen port(s) to the right panel.
The right panel displays all input ports currently assigned to the group.
-
To remove a port from the group, choose it in the right panel and click the arrow (<).
-
-
Click Add.
Edit monitoring tool group
Follow these steps to edit a monitoring tool group.
-
Click the Interface groups tab and then click Monitoring tool groups.
-
Click the Monitoring tool groups name.
The Monitoring tool groups page displays.
-
From the Actions drop-down list, choose Edit.
-
Click Save, to save the changes.
Delete monitoring tool group
Follow these steps to delete a monitoring tool group.
-
Click the Interface groups tab and then click Monitoring tool groups.
-
From the Actions drop-down list, choose Delete monitoring tool group(s).
Links
The Links tab provides a centralized view for monitoring and managing the various physical and logical connections within your NDB fabric. It offers detailed insights into configured links, their operational status, and protocol-specific information.
Follow these steps to view the configured links.
-
Click the Links tab.
Nexus Dashboard displays the details of the existing links.
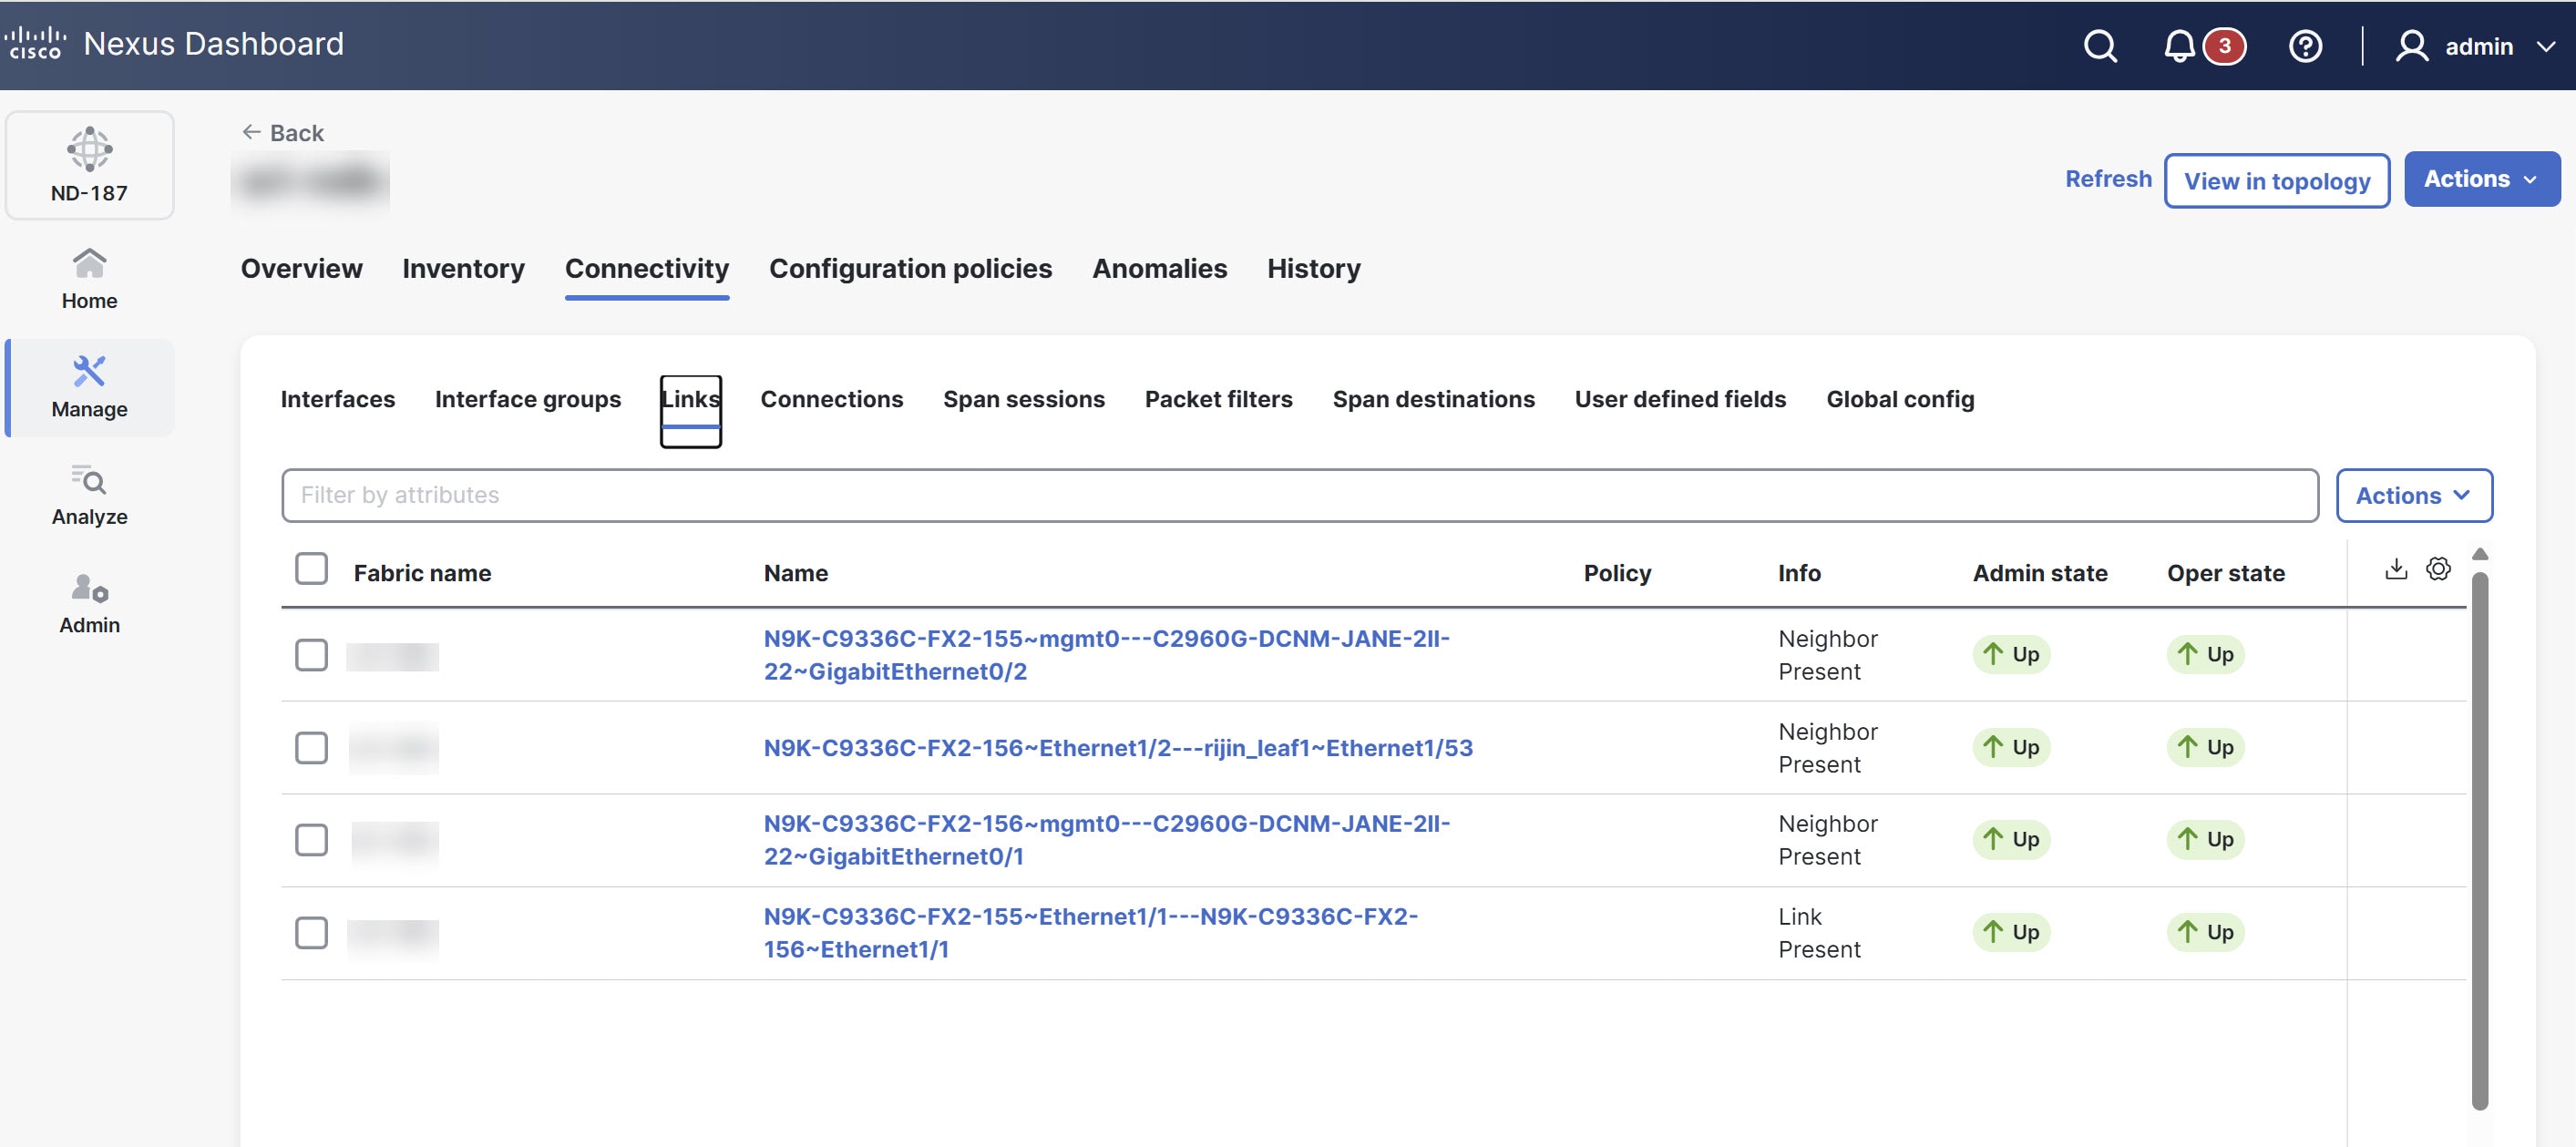
For more information, see Links.
Connections
The Connections tab provides a comprehensive interface for managing and monitoring network connections within Nexus Dashboard.
The Connections tab includes the following subtabs.
-
User connections
-
Default connections
User connections
The User Connections tab displays details of all the user-defined connections between input port(s) and monitoring tool port(s).
Follow these steps to view the user connections.
-
Click the Connections tab and then click User connections.
Nexus Dashboard displays the details of the user connections.
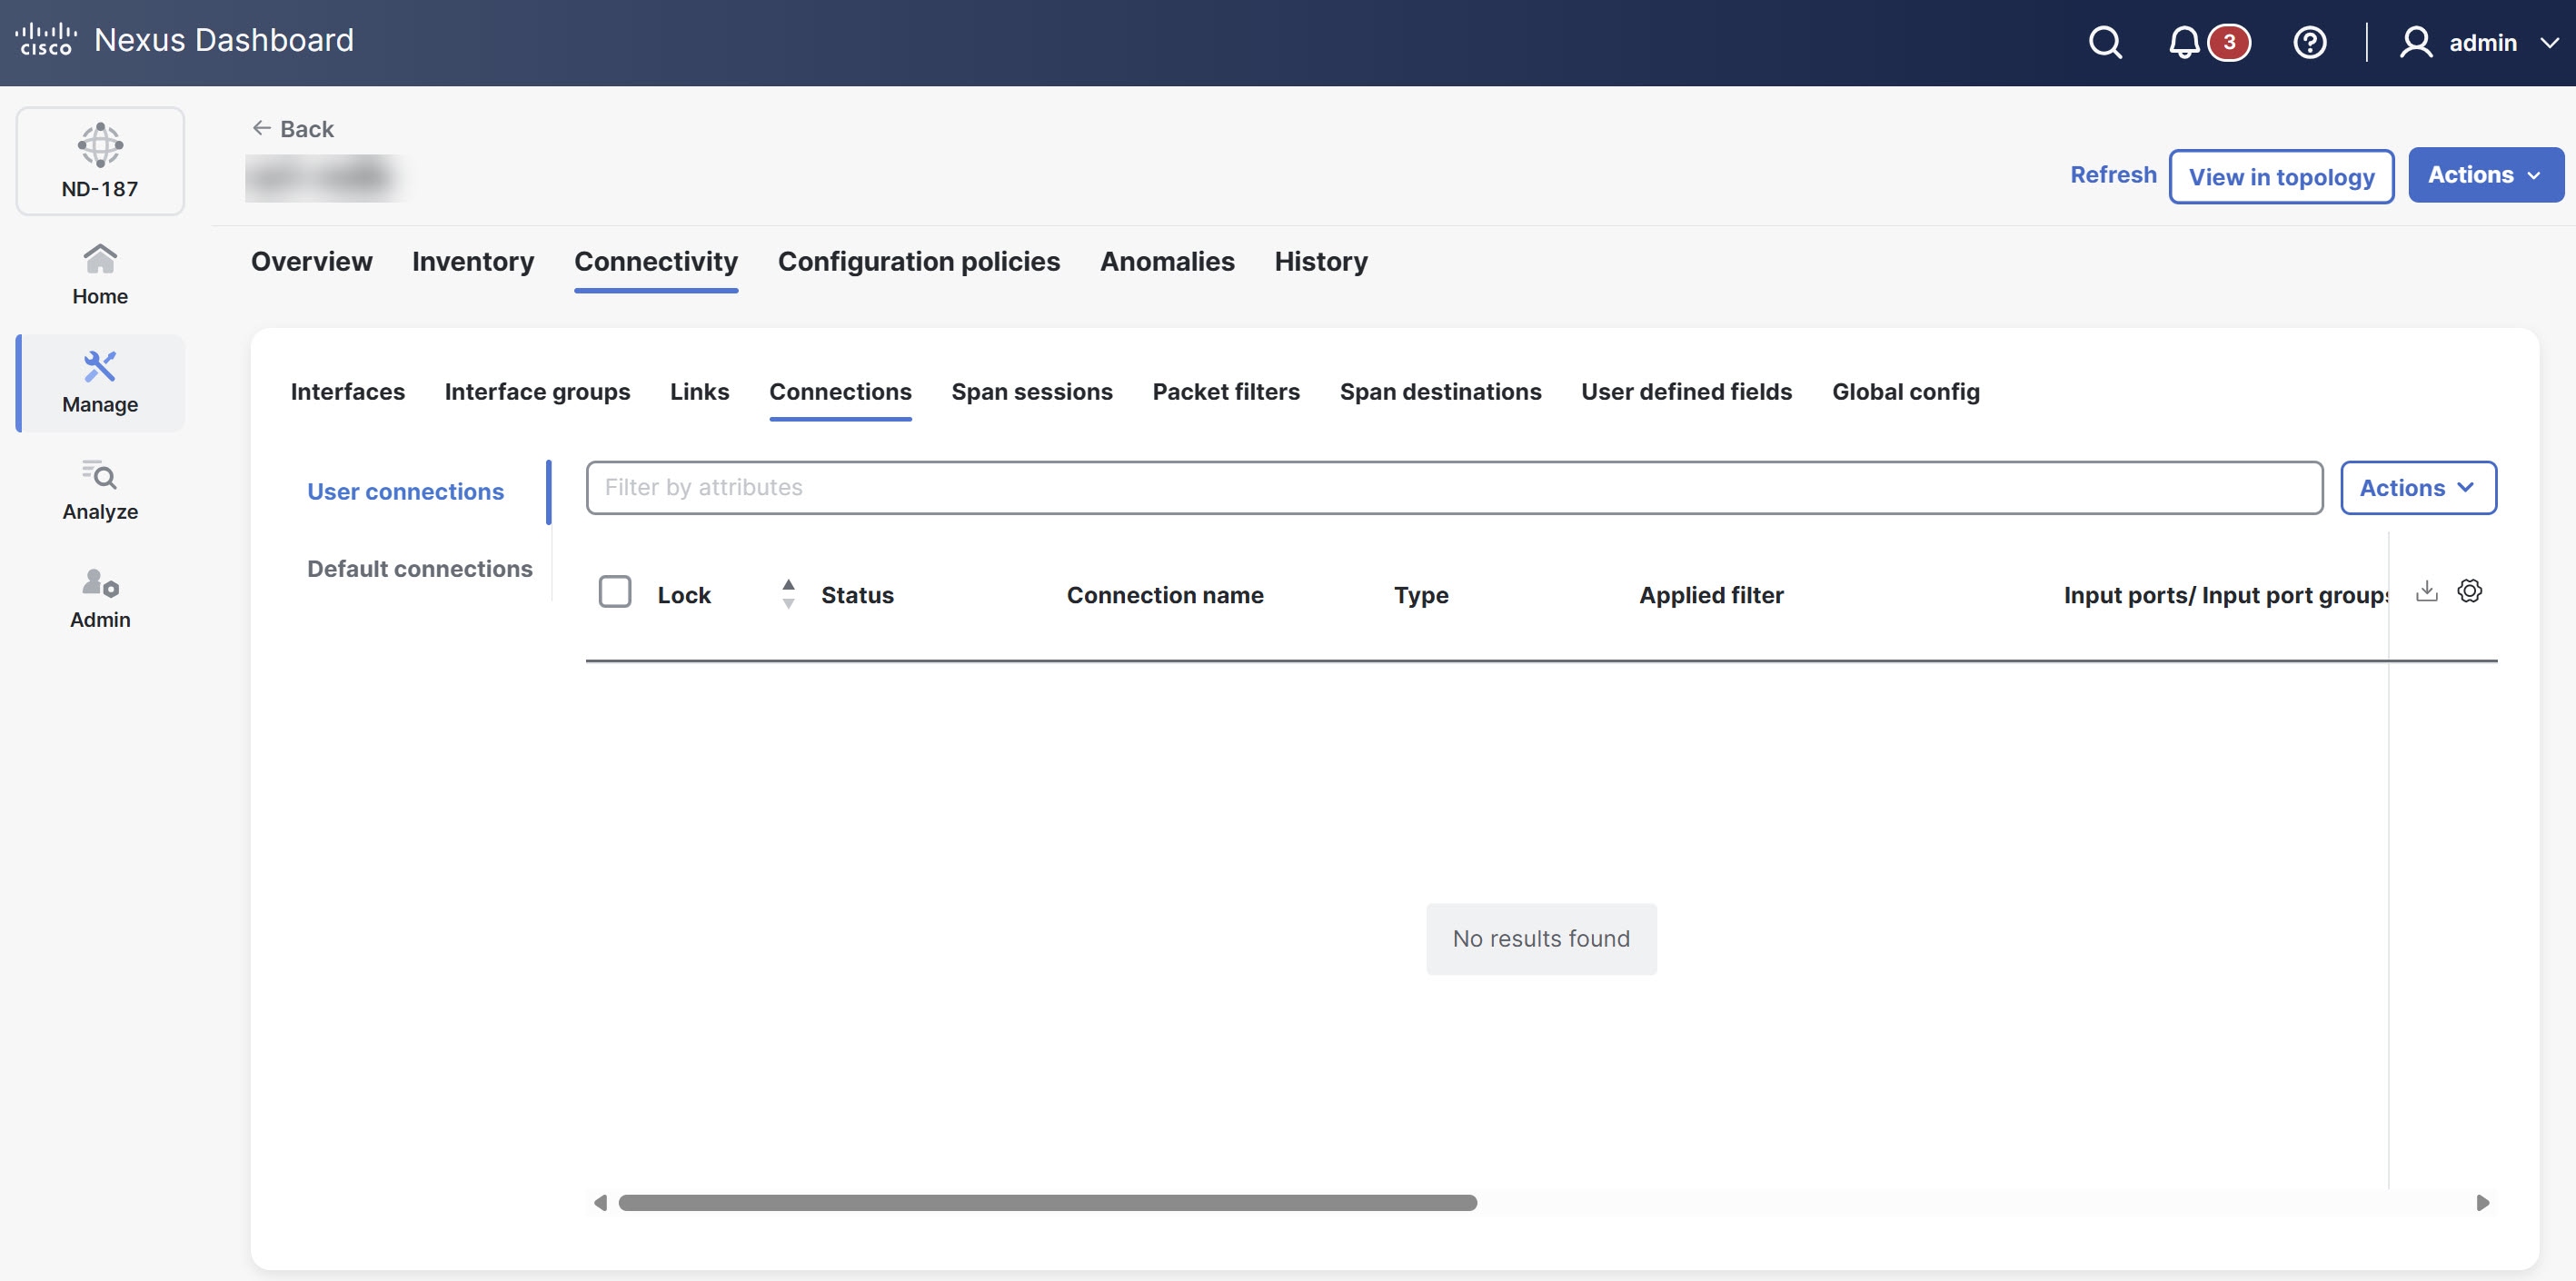
The User connections table provides the following information.
| Field | Description |
|---|---|
|
Lock |
The lock symbol shows that the connection is locked, and Nexus Dashboard prevents unauthorized users from modifying the connection parameters. Only the user (or administrator) who created the connection or the user who locked it can make the required changes. You can lock a connection when you add it. |
|
Status |
The current status of the connection. |
|
Connection name |
The name of the connection. Click the name to open the Connections page with more details about the connection. From this page, you can perform these actions.
|
|
Type |
Type of connection. The following types display.
|
|
Applied filter |
Displays a list of all the filters applied to the connection. |
|
Input ports/ Input port groups |
The number of input ports and/or input port groups of the connection. |
|
Monitoring tools/ Monitoring tools groups |
The number of monitoring tools and/or monitoring tool groups of the connection. |
|
Description |
Description of the connection. |
|
Priority |
Set the priority for the connection when you create it. Nexus Dashboard matches incoming traffic from the ports based on priority. If two connections use the same input ports and filters, Nexus Dashboard directs the traffic to the connection with the higher priority. |
|
Status description |
The status of the connection between the input port and monitoring tool port. |
|
Created by |
The user who created the connection. |
|
Modified by |
The user who last modified the connection. |
Auto priority
Auto priority allows you to map filters to multiple destination devices within a connection. Nexus Dashboard sets the priority of a connection with auto-priority to the value you configure in the config.ini file. To specify the priority for all new connections with auto-priority, set the connection.autopriority.priorityValue attribute in the config.ini file.
Add connection
A connection establishes a link between the input ports (with filters) of a device to the monitoring tool ports of the device.
-
Define a filter for the connection.
-
Configure a monitoring tool (recommended).
-
Configure an edge port (recommended).
Guidelines and limitations
-
You must configure QinQ VLAN on the input port to enable connections that span multiple devices (multi-hops).
-
You can configure only one connection with auto priority per input port or port group.
Follow these steps to add connection.
-
Click the Connections tab and then click User connections.
-
From the Actions drop-down list, choose Add connection.
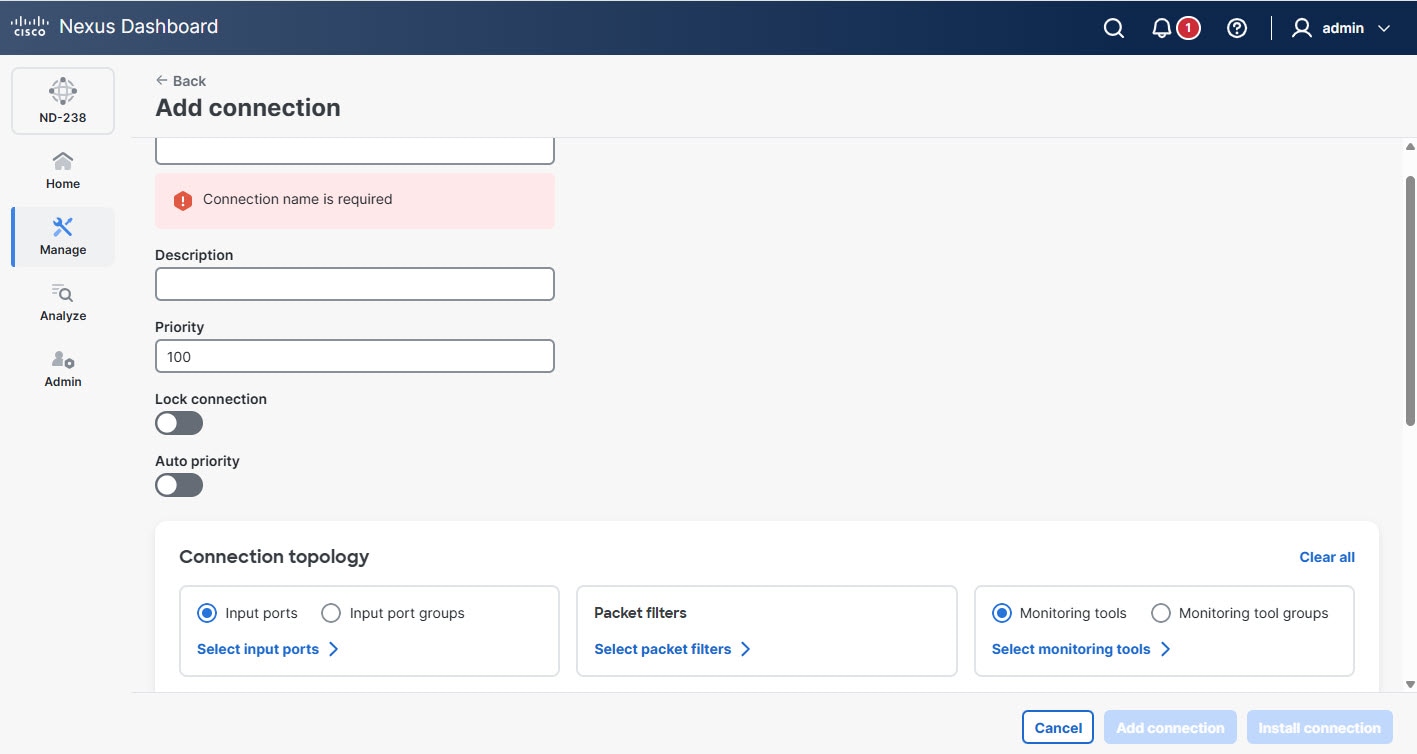
The Add connection page displays.
-
Provide the following details.
Field Description Connection name
Provide the connection name.
Priority
Enter the priority you want to set for the connection. By default, Nexus Dashboard sets the priority level to 100. You can choose a value from 2 to 10,000. A higher number means a higher priority. For example, 200 has a higher priority than 100.
Nexus Dashboard matches incoming traffic from the ports based on priority. If two connections use the same input ports and filters, the connection with the higher priority receives the traffic.
Lock connection
Enables lock connection. Locking a connection prevents unauthorized changes to a connection.
Auto priority
Enables Auto priority. NDB automatically assigns a priority to the connection based on certain criteria, such as monitoring tools and filters.
Auto priority allows you to map filters to multiple monitoring tools within a connection. For more information, see Auto priority.
Connection topology
Define Input port(s), Packet filter(s), and Monitoring tool(s) for a connection.
-
Click Add connection to add the connection, or click Install connection to add and deploy the connection.
If NDB detects that two connections have the same Q-in-Q VLAN when you add a new connection or modify an existing one, you can merge the connections. After you click Add connection or Install connection, a dialog box appears. Click Yes to merge the two connections.
Toggle install a connection
Follow these steps to toggle install a connection.
-
Click the Connections tab and then click User connections.
-
From the User connections table, choose a connection.
-
From the Actions drop-down list, choose Toggle install.
A confirmation dialog box appears.
-
Click Toggle.
Edit or clone connection
Follow these steps to edit or clone a connection.
-
Click the Connections tab and then click User connections.
-
From the User connections table, click a connection.
The Connections page displays.
-
From the actions drop-down list, choose Edit or Clone.
-
After you make the required changes, click Save.
Cloning a connection is similar to editing a connection. When you clone a connection, you create a new connection with the same parameters as an existing one and then modify the required parameters. Make sure to change the name of the connection before you save it.
Delete connection
Follow these steps to delete a connection.
-
Click the Connections tab and then click User connections.
-
From the User connections table, choose a connection.
-
From the Actions drop-down list, choose Delete connection.
Default connections
The Default connections tab displays the details of the default NDB connections. Nexus Dashboard configures default deny rules on all configured interfaces, including input ports, monitoring tools, and packet truncation ports. By default, Nexus Dashboard denies traffic received on the input ports until you configure a user-defined connection.
By default, Nexus Dashboard enables deny ACLs configured interfaces, including inter switch links (ISL) and remote edge span interfaces. This causes Nexus Dashboard to drop all traffic on these interfaces if no connection is installed. Nexus Dashboard installs the following default connections on the interfaces.
-
Default-Deny-ISL-device_name connection, which uses
Default-Deny-All,Default-Deny-MPLS, andDefault-Deny-ARPfilters. All switch types in NXAPI mode support this connection. -
Default-Deny-ISL-ICMP-device_name connection, which uses
Default-Deny-ICMPandDefault-Deny-ICMP-Allfilters. Nexus 9300EX, 9300FX, 9500EX, and 9500FX switches in NXAPI mode support this connection.
Span sessions
The Span sessions tab displays the details of the span sessions managed by NDB controller.
A span session links the span destination of span devices to the input port of an NDB device. A span session is partially outside the NDB network and defines the path of the packets from the span destination to the monitoring tool port.
The following actions can be performed from the Span sessions tab.
-
Add span session — Allows you to add a span session. For more information, see Add span session.
-
Delete span session — Allows you to delete a span session. For more information, see Delete span session.
-
Toggle install — Allows you to install or uninstall a span session. You can install a span session on the Nexus switch or APIC controller, or uninstall a span session without removing it from the NDB controller. When you uninstall the SPAN session from the switch or controller, Nexus Dashboard retains it on the NDB controller for future use.
-
Synchronize Span Session / Destination — allows you to synchronize the information on the production Nexus switch or APIC controller with the NDB controller. If you delete or remove span session information on the switch or controller, this action synchronizes the span destination and span session configurations on the switch or controller with the configurations on the NDB controller.
View span sessions
Follow these steps to view the span sessions.
-
Click the Span sessions tab.
The Span sessions table provides the following information.
| Field | Description |
|---|---|
|
Span session |
Specifies the name of the span session. You can perform the following actions.
|
|
IP address |
Specifies the IP address of the span session source (span device). |
|
Status |
Indicates the status of the span session, which depends on the operational status of the session and its connection. |
|
Span sources |
Indicates the number of source ports for the span session.
For VLAN sources, the source ports are EPGs on the ACI device. |
|
Span destination |
Indicates the number of span destinations for the session.
Only ACI devices can have multiple destinations; Nexus devices support only one per session. |
|
Connection |
Specifies the name(s) of connection(s) associated with the span session. |
|
Created by |
The user who created the span session. |
|
Modified by |
The user who modified the span session. |
|
Status description |
Provides the description of the current status of the span session. |
Add span session
Follow these steps to add a span session.
-
Click the Span sessions tab.
-
From the Actions drop-down list, choose Add span session.
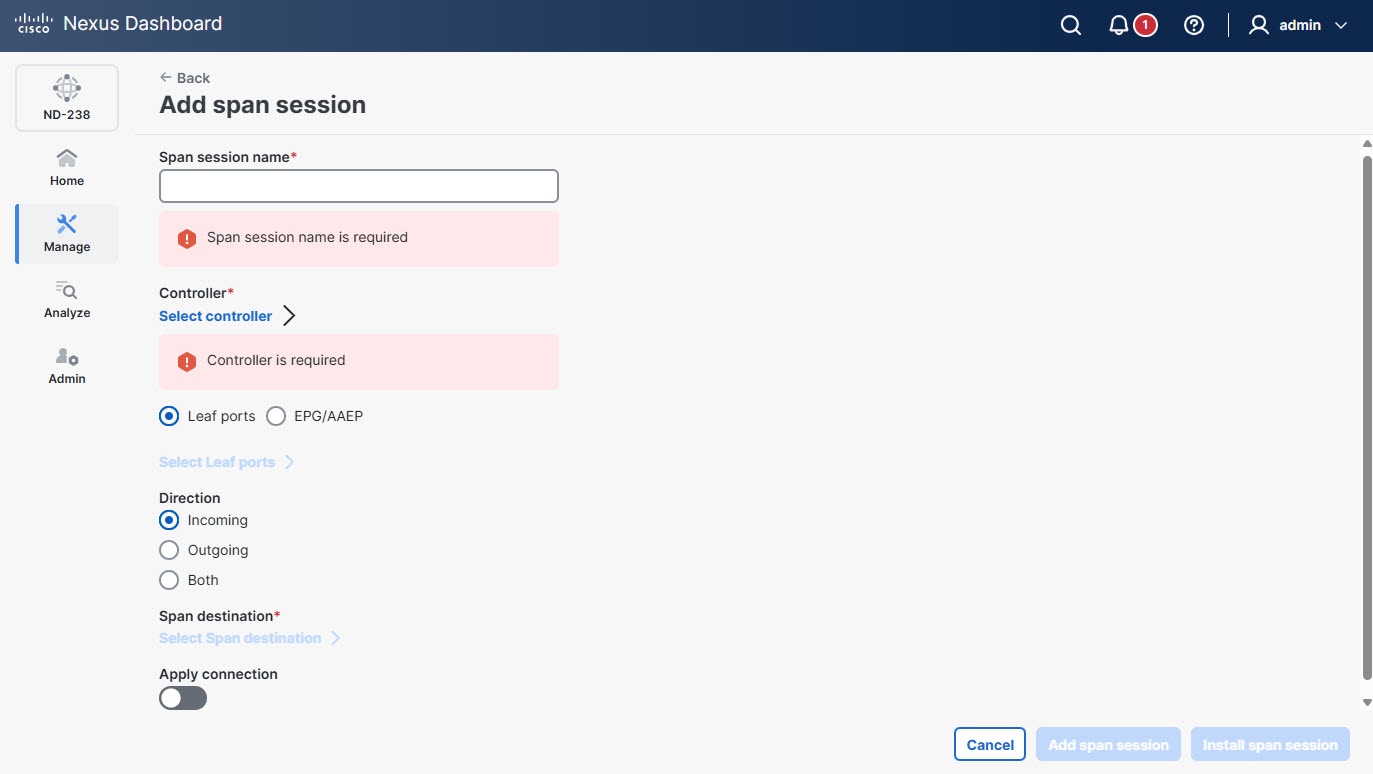
The Add span session page displays.
-
Provide the following details.
Field Description Span session name
Provide a name for the span session.
Controller
Click Select controller and choose a controller from the list.
Leaf ports
Click Leaf ports to add a leaf port to capture the traffic from multiple leaf ports. Click Select Leaf ports. In the Select Leaf ports page, choose a pod and choose the devices and ports.
EPG/AAEP
Click EPG/AAEP to add an EPG/ AAEP source. Click Select EPG/AAEP. In the Select EPG/AAEP page, choose a Tenant, Profile, EPG, and EPG Members. For more information, see Guidelines for EPG selection.
EPG interfaces work only when all the ports are within the same leaf switch. If an EPG is spread across multiple switches, choose the corresponding Span destination on all the leaf switches.
Direction
Indicates traffic for the session source port of the device. Choose one of the following options.
-
Incoming
-
Outgoing
-
Both
Span destination
Click Select Span destination and choose the span destination port. Nexus Dashboard displays fields based on your earlier Span Sources selection.
Apply connection
Enable the Apply connection option to add connection to the span session.
-
-
Click Add span session to add span session you created, without installing it on the production switch or controller. Click Install span session to save and install the span session you created on the production switch or controller.
Guidelines for EPG selection
-
When you choose an EPG, the NDB controller, by default, monitors for changes in the statically or dynamically configured interfaces of that EPG. When any changes occur, the controller applies them to the span session. The WebSocket connection does not use certificates for security. To disable event monitoring, add
enableWebSocketHandle=falsein theconfig.inifile under thendb/configurationfolder. -
When you add a new EPG member to the APIC controller, if no span destination exists on the leaf switch that matches the newly added EPG member as part of the configured span session, NDB ignores it and does not display the new EPG member.
Edit or clone span session
Follow these steps to edit or clone a span session.
-
Click the Span sessions tab.
-
From the Span session table, click a span session.
The Span session page displays.
-
From the Actions drop-down list, choose Edit or Clone.
-
After you make the required changes, click Save.
Cloning a span session is similar to editing a span session. When you clone a span session, you create a new span session with the same parameters as an existing one and then modify the required parameters. Make sure to change the name of the span session before you save it.
Delete span session
Follow these steps to delete a span session.
-
Click the Span sessions tab.
-
From the Span session table, click a span session.
The Span session page displays.
-
From the Actions drop-down list, choose Delete span session.
Packet filters
The Packet filters tab displays all filters available on the NDB controller. This tab lists the filtering criteria used in a connection for incoming traffic. By default, the following protocols are included for packet filtering.
-
Default-match-all
-
Default-match-IP
-
Default-match-ARP
-
Default-match-MPLS (unicast and multicast)
-
Default-match-ICMP
-
Default-match-ICMP-All
-
Default-match-IGMP
View packet filters
Follow these steps to view the packet filters.
-
Click the Packet filters tab.

The Packet filters table provides the following information.
| Field | Description |
|---|---|
|
Name |
Name of the packet filter. |
|
Bidirectional |
Indicates whether a filter applies to both incoming and outgoing traffic on the same port. Displays "Yes" if the filter applies to both incoming and outgoing traffic on the same port; otherwise, displays "No". |
|
Ether type |
Indicates the Layer 2 EtherType value used by the packet filter. |
|
In use |
A green tick mark with Yes indicates you are currently using the packet filter in a connection. A No indicates you are not using the packet filter in the connection. |
|
Default |
If the packet filter is a default filter, it is marked Yes, else No. |
|
Protocol |
Indicates Layer 3 protocol used by the packet filter. |
|
Advanced filter |
Lists the advanced filter(s) associated with the packet filter. |
|
Created by |
The user who created the filter. |
|
Modified by |
The user who modified the filter. |
Add packet filters
Follow these steps to add packet filters.
-
Click the Packet filters tab.
-
From the Actions drop-down list, choose Add packet filters.
The add packet filter details page displays.

-
Provide the following details.
Field Description Name
Provide a name for the packet filter.
Bidirectional
Check this check box if you want the packet filter to capture bidirectional traffic information.
Layer 2
The following fields appear under the Layer 2 tab.
-
Ethernet type — Allows you to choose the Ethernet protocol type (EtherType) to be filtered.
-
VLAN ID — Enter the specific VLAN ID (ranging from 1 to 4094) to filter traffic belonging to a particular virtual LAN.
-
VLAN priority — Enter the VLAN priority for the traffic. Nexus Dashboard matches the VLAN priority for Layer 2 traffic only.
-
Source MAC address — Enter the MAC address of the source device.
-
Destination MAC address — Enter the MAC address of the destination device.
-
MPLS label value — Enter the MPLS value for Label 1, Label 2, Label 3, Label 4.
Nexus Dashboard displays the MPLS label value fields only if you choose the Ethernet type as MPLS. Nexus Dashboard then matches the MPLS label values.
Layer 3
The following fields appear under the Layer 3 tab.
-
L3 protocol — Displays the Ethernet type you chose while configuring Layer 2.
-
Source IP Address — The source IP address of the Layer 3 traffic.
-
Destination IP Address — The destination IP address of the Layer 3 traffic.
-
L4 protocol — The Internet protocol of the Layer 3 traffic. You can choose from common protocols such as ICMP, TCP, UDP, or enter a protocol number in decimal format.
-
Advanced filter — Allows you to enable advanced filtering options that combine Ethernet type and attributes to manage traffic. For more information, see Advanced filters.
-
Custom filter — Allows you to enable custom filtering using User Defined Fields (UDF). Click Select Custom Filters to choose one or more UDFs from the available list. If no UDFs exist, you can create new UDFs. For more information, see Add UDF.
Layer 4
The following fields appear under the Layer 4 tab.
-
L4 protocol — Specifies the Layer 4 transport protocol used in the packet, such as TCP, UDP, or ICMP.
-
Source port — Allows you to choose the source port.
-
Destination port — Allows you to choose the destination port.
-
You must first choose TCP or UDP under the Layer 3 tab to enable and modify these Layer 4 options. After enabling TCP or UDP under the Layer 3 tab, you can specify the Layer 4 protocol and configure source and destination ports accordingly.
-
When you enter a range of Layer 4 destination ports you cannot configure ranges of Layer 2 VLAN identifiers or Layer 3 IP addresses.
-
-
Edit or clone packet filters
Follow these steps to edit packet filters.
-
Click the Packet filters tab.
-
From the Packet filters table, click a packet filter.
The Filter page displays.
-
From the Actions drop-down list, choose Edit or Clone.
-
After you make the required changes, click Save.
Cloning a packet filter is similar to editing a packet filter. When you clone a packet filter, you create a new packet filter with the same parameters as an existing one and then modify the required parameters. Make sure to change the name of the packet filter before you save it.
Delete packet filters
Follow these steps to delete packet filters.
-
Click the Packet filters tab.
-
From the Packet filters table, choose packet filter(s).
-
From the Actions drop-down list, choose Delete packet filters.
Advanced filters
You can use the advanced filtering option to permit or deny traffic based on Ethernet type and attributes such as Acknowledgment, FIN, Fragments, PSH, RST, SYN, DSCP, Precedence, TTL, packet length, and NVE. Advanced filtering supports the following Ethernet types and options.
| Data type | Supported options |
|---|---|
|
IPv4 |
DSCP, Fragment, Precedence, and TTL. |
|
IPv4 with TCP |
Acknowledgment, DSCP, Fragment, FIN, Precedence,PSH, RST, SYN, and TTL. |
|
IPv4 with UDP |
DSCP, Fragment, Precedence, and TTL. |
|
IPv6 |
DSCP and Fragment. |
|
IPv6 with TCP |
Acknowledgment, DSCP, Fragment, FIN, PSH, RST, and SYN. |
|
IPv6 with UDP |
DSCP and Fragment. |
You can use advanced filtering only with NX-API on the Cisco Nexus 9000 platform.
You can set the time to live (TTL) attribute to any value from 0 to 255. On Nexus 9200 devices, you can set the TTL to a maximum value of 3. For other Nexus 9000 series devices running NX-OS version 7.0(3)I6(1) and later, the maximum TTL value you can set is 3. For NX-OS versions 7.0(3)I4(1) and earlier, you can configure any value within the full range.
Limitations of using advanced filters
When you configure advanced filters, you cannot configure the following parameter combinations.
-
DSCP and Precedence together.
-
Fragments with ACK, SYN, FIN, PSH, or RST.
-
Fragments with port numbers when using UDP and an IPv4 or IPv6 combination.
-
Precedence with HTTP methods when using IPv4 and TCP.
Span destinations
The Span destinations tab displays details about the span ports that connect to the input ports of NDB devices. The input ports receive traffic from the span destination, which is a source on an ACI or NX-OS device. Nexus Dashboard creates a local L2 span destination on an edge span port and creates a remote L3 span destination on a remote edge span port.
You can connect a span destination (on an ACI or NX-OS device) to the input port of an NDB device. You can add a span destination only after you have successfully added an ACI or NX-OS device to the network.
-
For an APIC span destination, configure an input port as an edge span port and connect it to the ACI device. Choose the pod, node, and port on the ACI device and set the port as the span destination.
-
For an NX-OS (production switch) span destination, configure an input port as an edge span port and connect it to the NX-OS device. Choose the node and port on the NX-OS device and set the port as the span destination.
View span destinations
The Span destinations tab displays the monitored traffic destinations, source input ports, and the port types that Nexus Dashboard uses for monitoring.
Follow these steps to view the span destinations.
-
Click the Span destinations tab.
Nexus Dashboard displays the details of the span destinations.
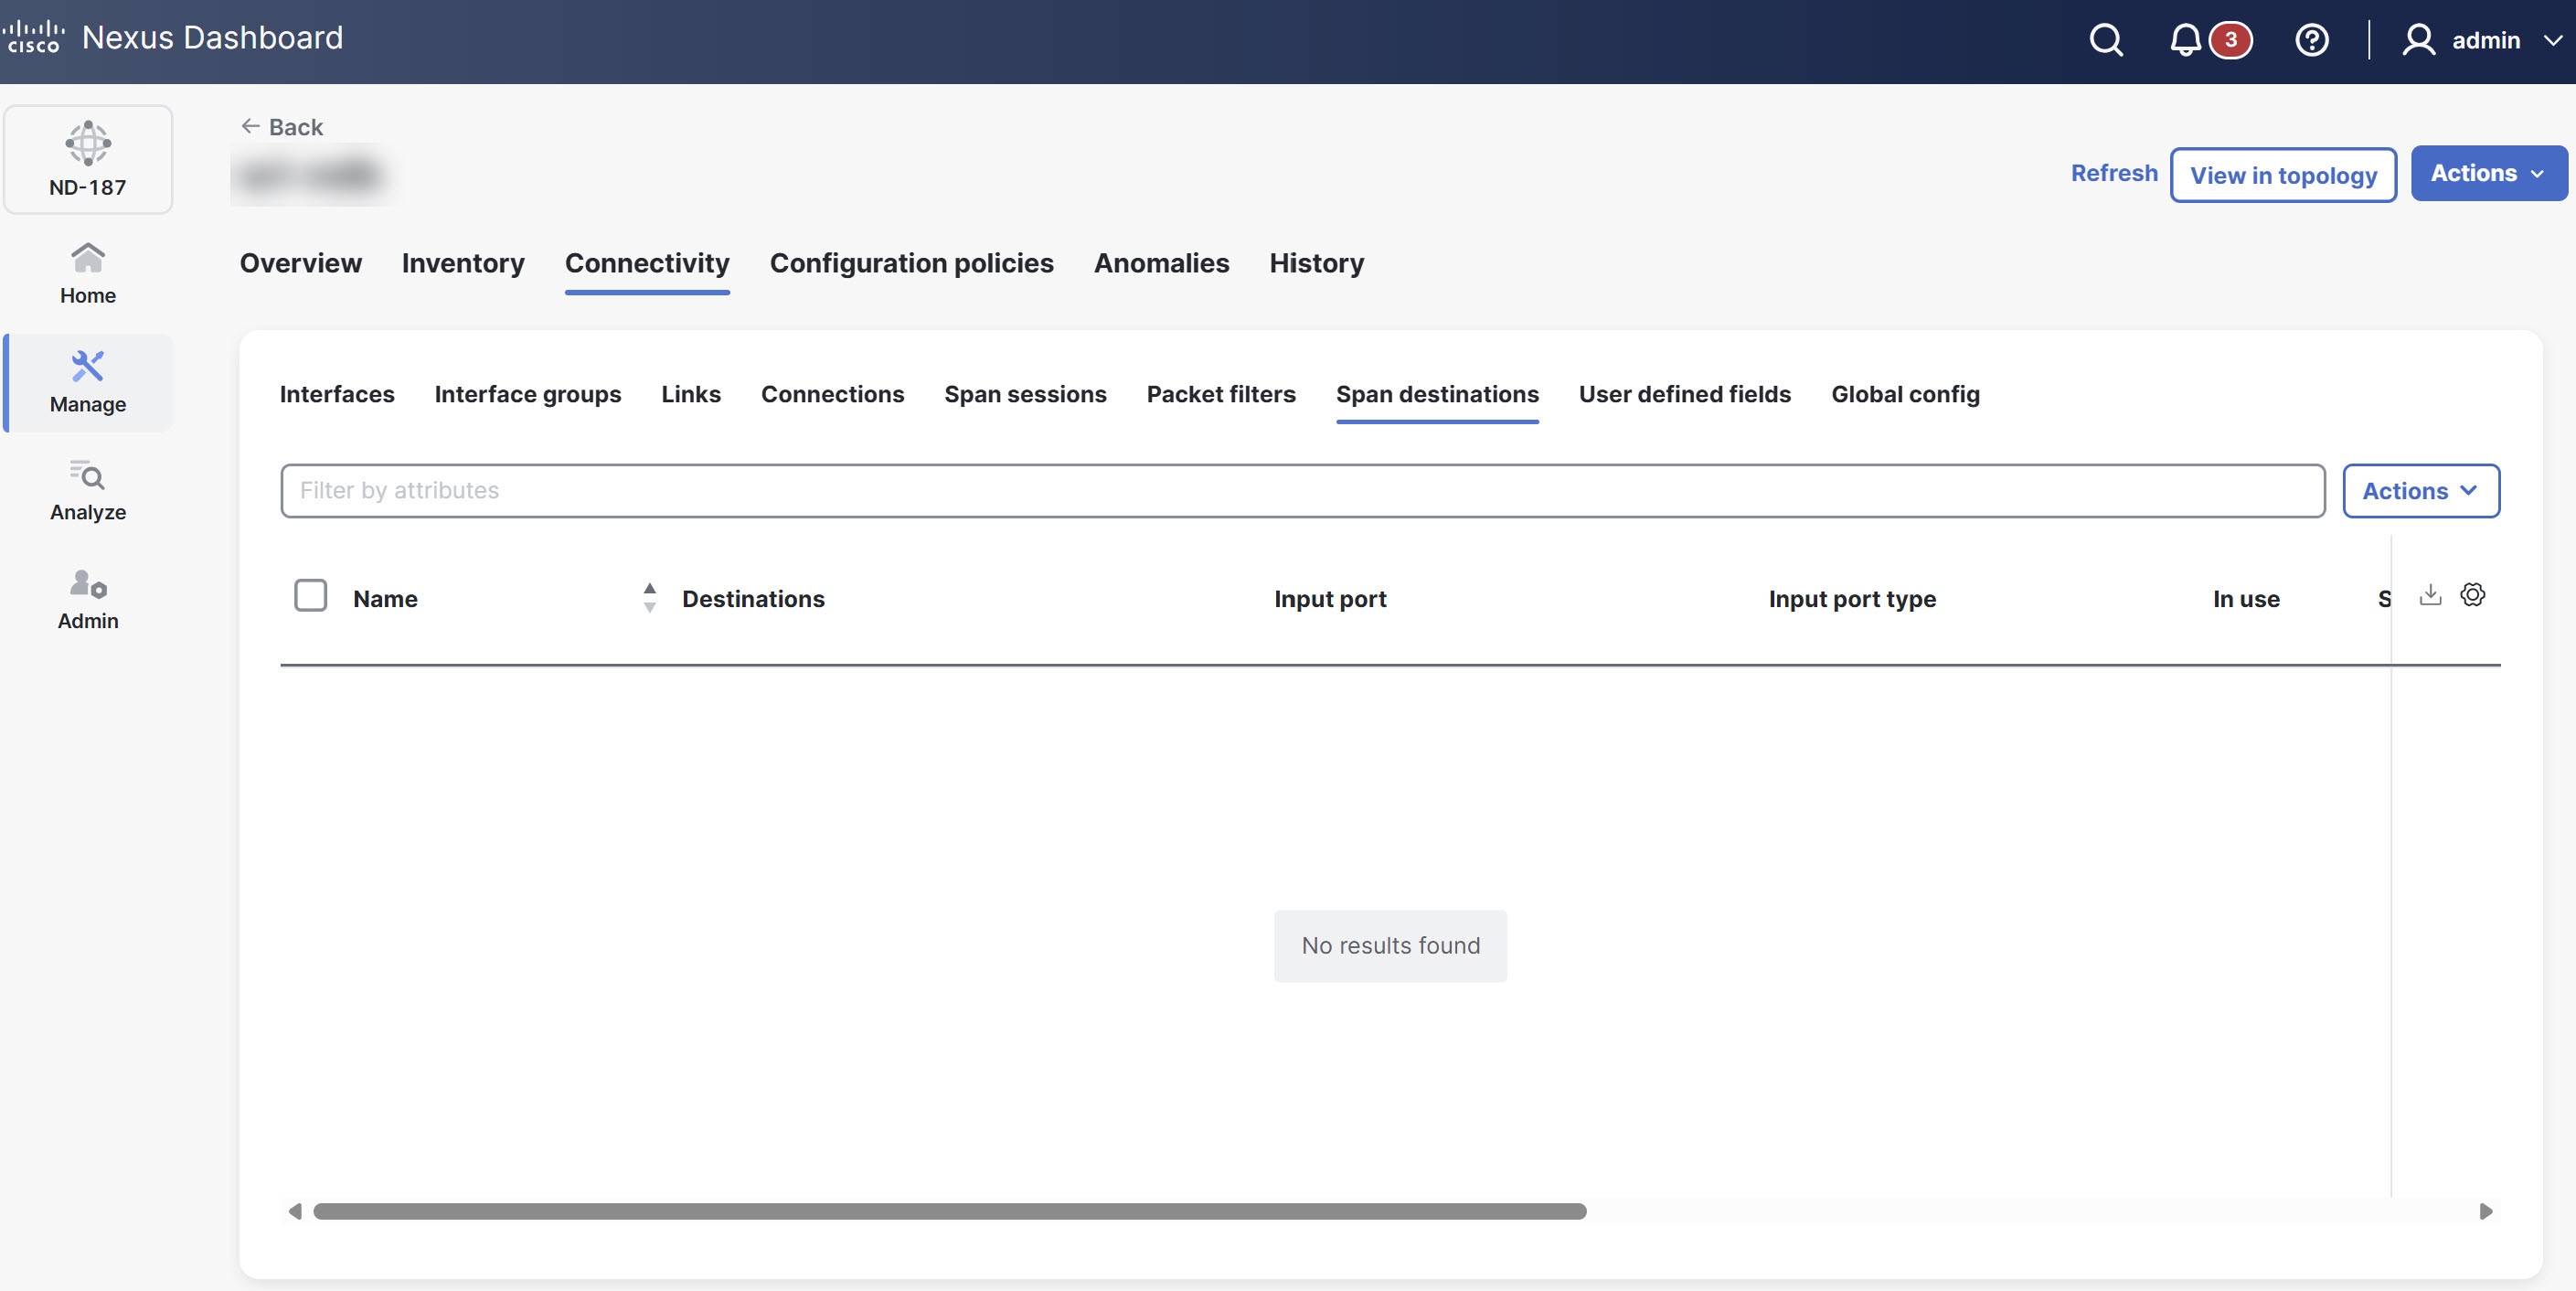
The Span destinations table provides the following information.
| Field | Description |
|---|---|
|
Name |
Specifies the name of the span destination port. |
|
Destinations |
Indicates if the span destination is on a Cisco ACI/APIC or other device. |
|
Input port |
Provides the input port of the NDB device connected to the span destination. |
|
Input port type |
Specifies the type of input port. The following options display.
|
|
In use |
Indicates whether the span destination is currently in use. |
|
Span device |
Provides the details of the span device (the traffic source). |
|
Created by |
The user who created the span destination. |
|
Modified by |
The user who modified the span destination. |
|
Status description |
Provides the description of the current status of the span destination. |
Delete span destinations
Follow these steps to delete the span destinations.
-
Click the Span destinations tab.
-
In the Span destinations table, choose the span destination(s) that you want to delete.
-
From the Actions drop-down list, choose Delete span destination.
User defined fields
The User defined fields (UDF) tab allows you to view and manage UDF configurations for your NDB devices. While NX-OS devices support many protocols by default, some protocols require manual definition for filtering. You can use UDFs to enable packet filtering on these devices by specifying custom criteria. UDFs allow you to filter traffic based on a specific offset value within a packet. You can match an offset value anywhere within the first 128 bytes of a packet.
The NDB controller automatically generates two default UDFs to support ISL ports.
-
udfInnerVlan — Used to match the inner VLAN in IPv4 packets.
-
udfInnerVlanv6 — Used to match the inner VLAN in IPv6 packets.
A UDF can match up to two offset bytes. To filter three consecutive bytes in a packet, use two UDFs together. Create the first UDF, then create a second one immediately after it. The second UDF is called the stacking UDF.
View UDF
Follow these steps to view the UDF.
-
Click the User defined fields tab.
Nexus Dashboard displays the details of UDFs.
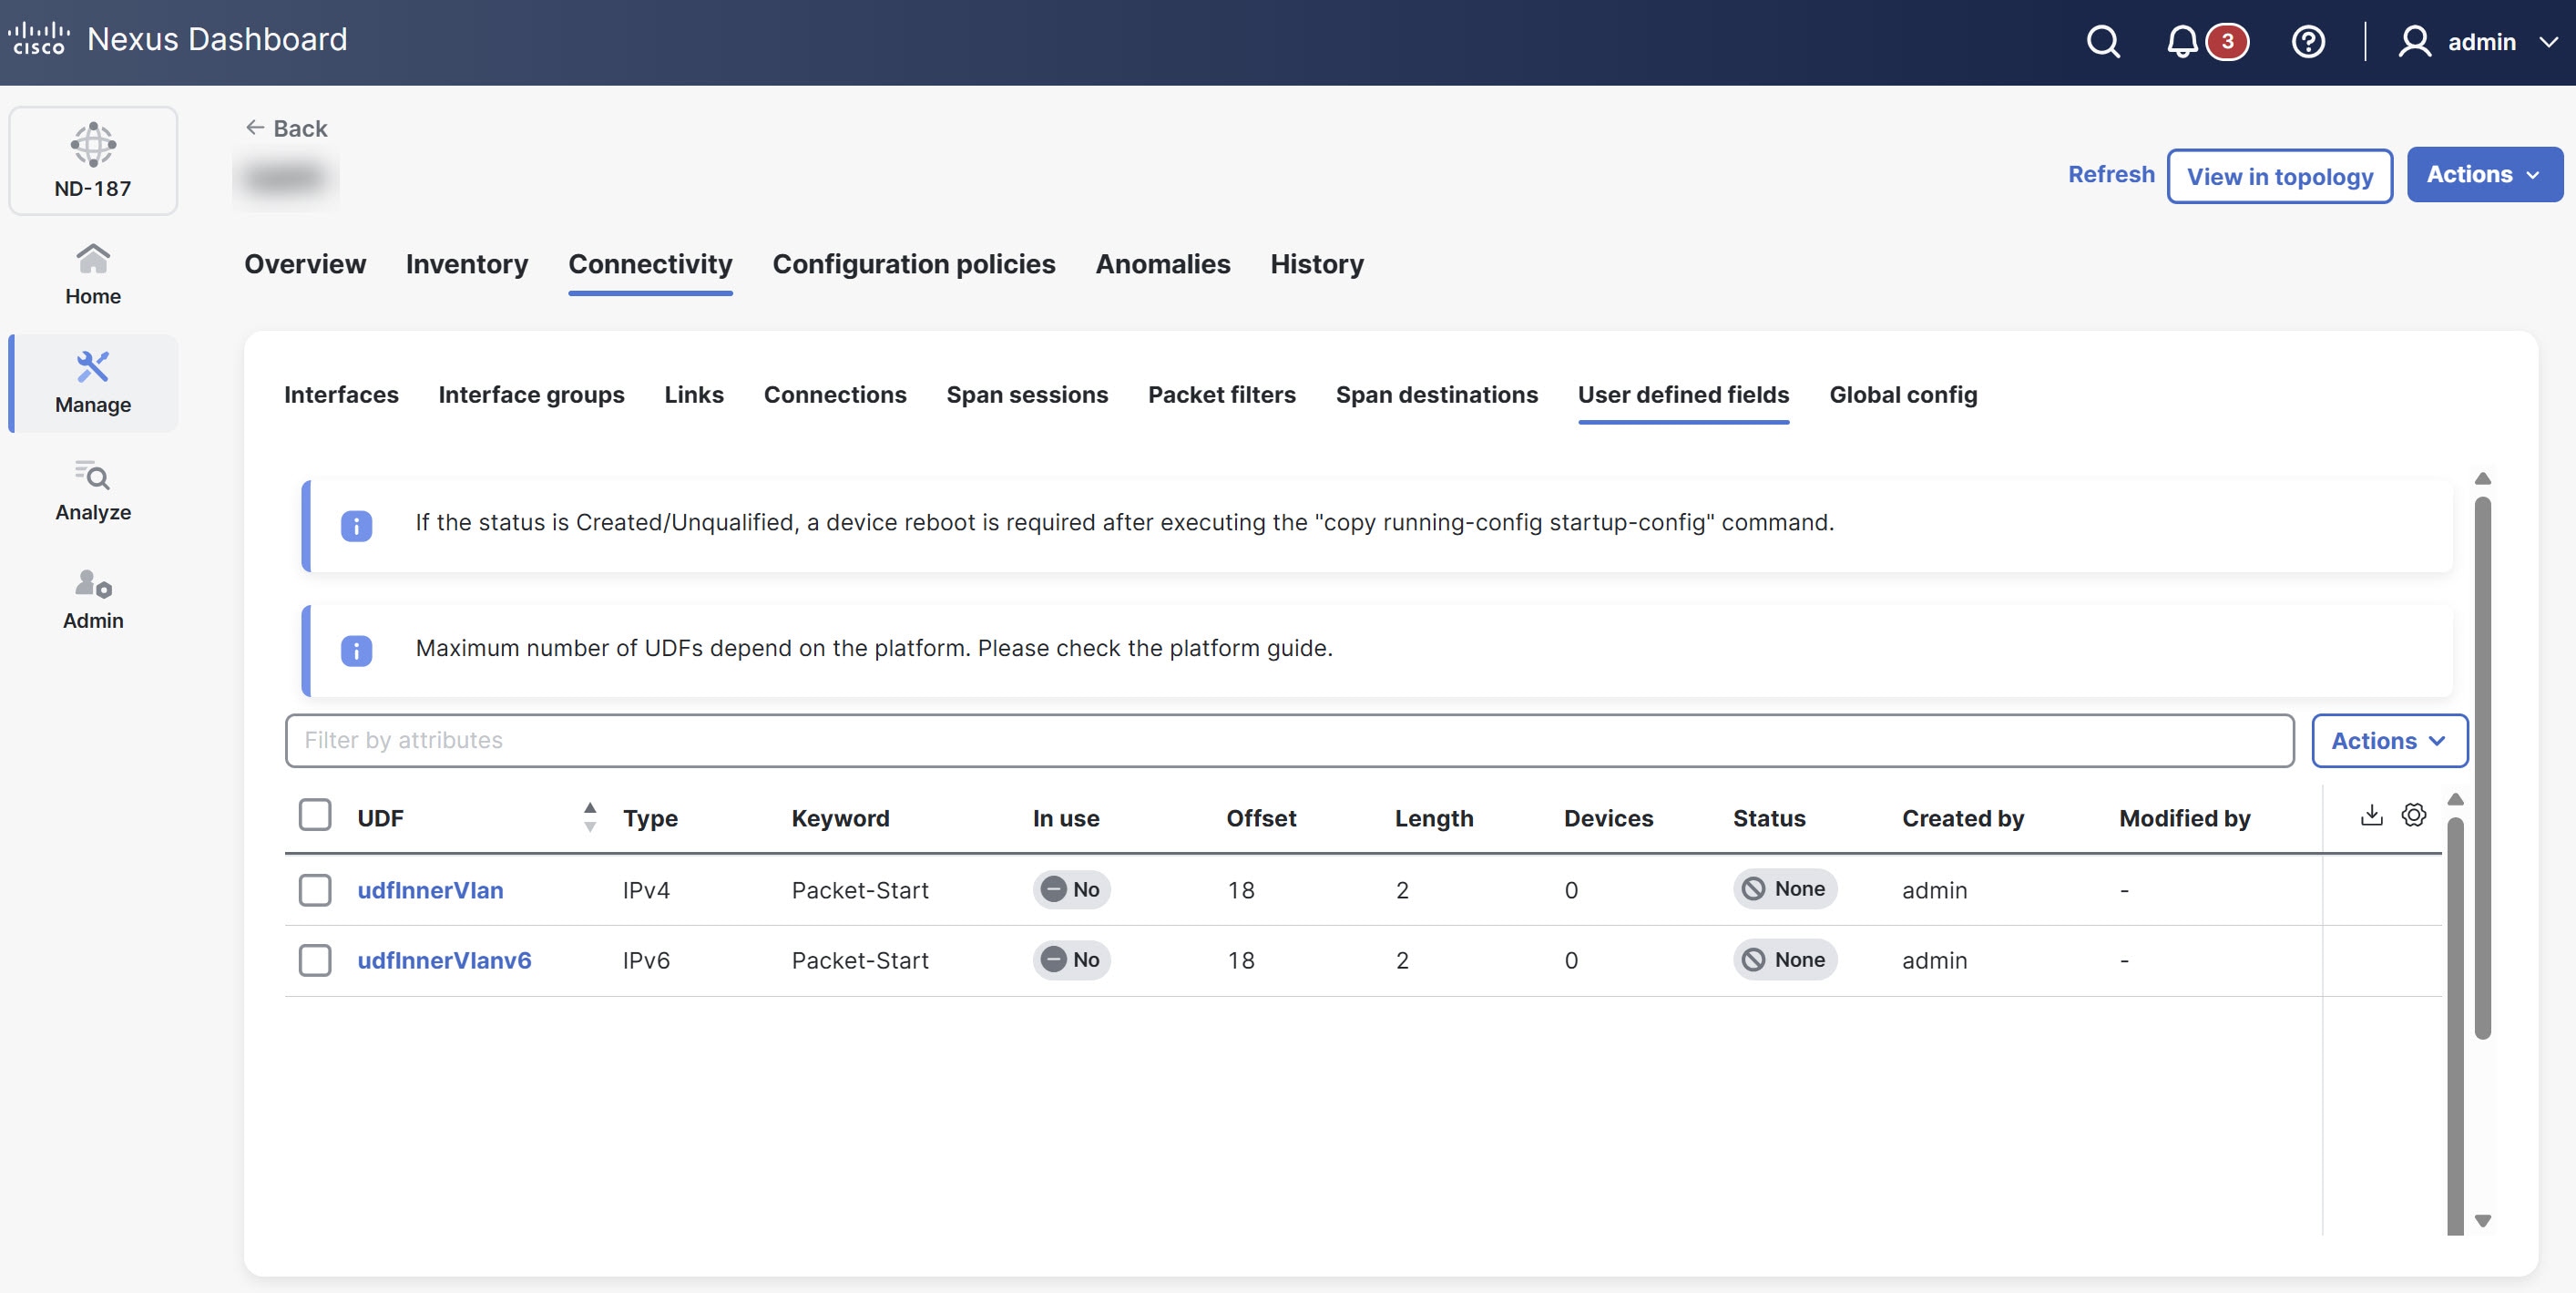
The User defined fields table provides the following information.
| Field | Description |
|---|---|
|
UDF |
Specifies the name of the UDF. Click the UDF to view more details. |
|
Type |
Displays the type of UDF, such as IPv4 or IPv6. |
|
Keyword |
Indicates whether the UDF is based on Packet-Start or Header. |
|
In use |
Indicates if the UDF is currently in use (often shown with a green tick mark). |
|
Offset |
Specifies the byte offset value. |
|
Length |
Specifies the number of bytes matched starting from the offset. |
|
Devices |
Specifies the number of devices the UDF is applied on. |
|
Status |
Indicates the current status of the UDF. |
|
Created by |
The user who created the UDF. |
|
Modified by |
The user who modified the UDF. |
Add UDF
Follow these steps to add UDF.
-
Click the User defined fields tab.
-
From the Actions drop-down list, choose Add UDF.
The Add UDF page displays.
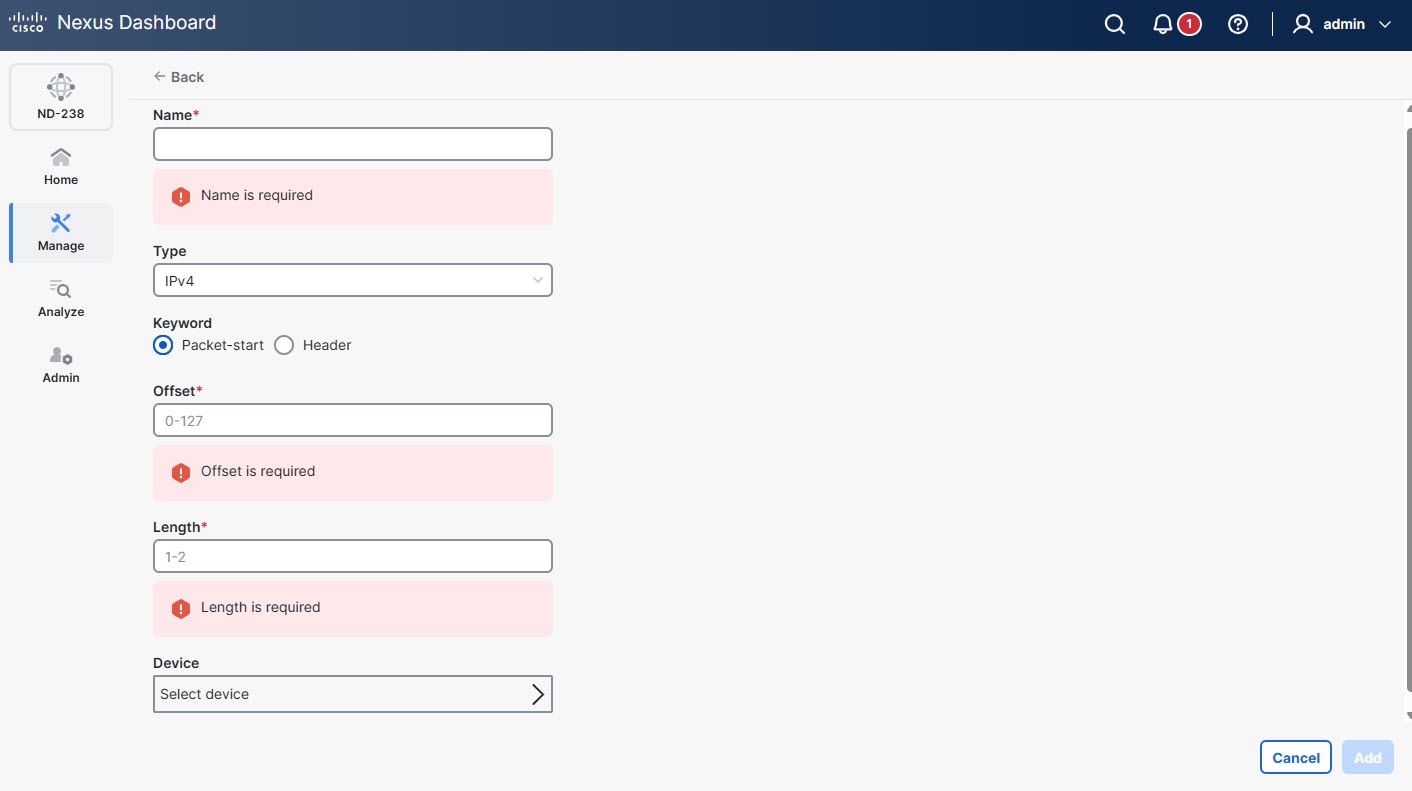
-
Provide the following details.
Field Description Name
Provide a name for the UDF.
Type
Choose the protocol type for the UDF from the drop-down list.
Keyword
Choose the reference point for the offset, such as Packet-start or Header.
Header
Choose the specific protocol header to use as the offset reference. The following options display.
-
Inner
-
Outer
The Header field appears only when you choose Header as the keyword.
Layer
Choose the network protocol layer (such as Layer 2, Layer 3, or Layer 4) for the UDF.
The Layer field appears only when you choose Header as the keyword.
Offset
Specify the starting position of the field.
Length
Specify the length of the UDF.
Device
Choose the device where you want to apply this UDF.
-
-
Click Add.
Use this UDF as a custom filter when you create packet filters for a connection.
Edit or clone UDF
Follow these steps to edit or clone UDF.
-
Click the User defined fields tab.
-
From the User defined fields table, click a UDF.
The User defined fields page displays.
-
From the Actions drop-down list, choose Edit or Clone.
-
After you make the required changes, click Save.
Cloning a UDF is similar to editing a UDF. When you clone a UDF, you create a new UDF with the same parameters as an existing one and then modify the required parameters. Make sure to change the name of the UDF before you save it.
Delete UDF
Follow these steps to delete UDF.
-
Click the User defined fields tab.
-
From the User defined fields table, choose UDF(s).
-
From the Actions drop-down list, choose Delete UDF(s).
Global config
The Global config tab lists all devices currently connected to the NDB controller. When you add a new device, the controller automatically displays it here if it has a Yes connection status. Nexus Dashboard excludes any devices from this view that maintain a No connection status.
View global configuration
Follow these steps to view the global configuration.
-
Click the Global config tab.
Nexus Dashboard displays the global configuration details.
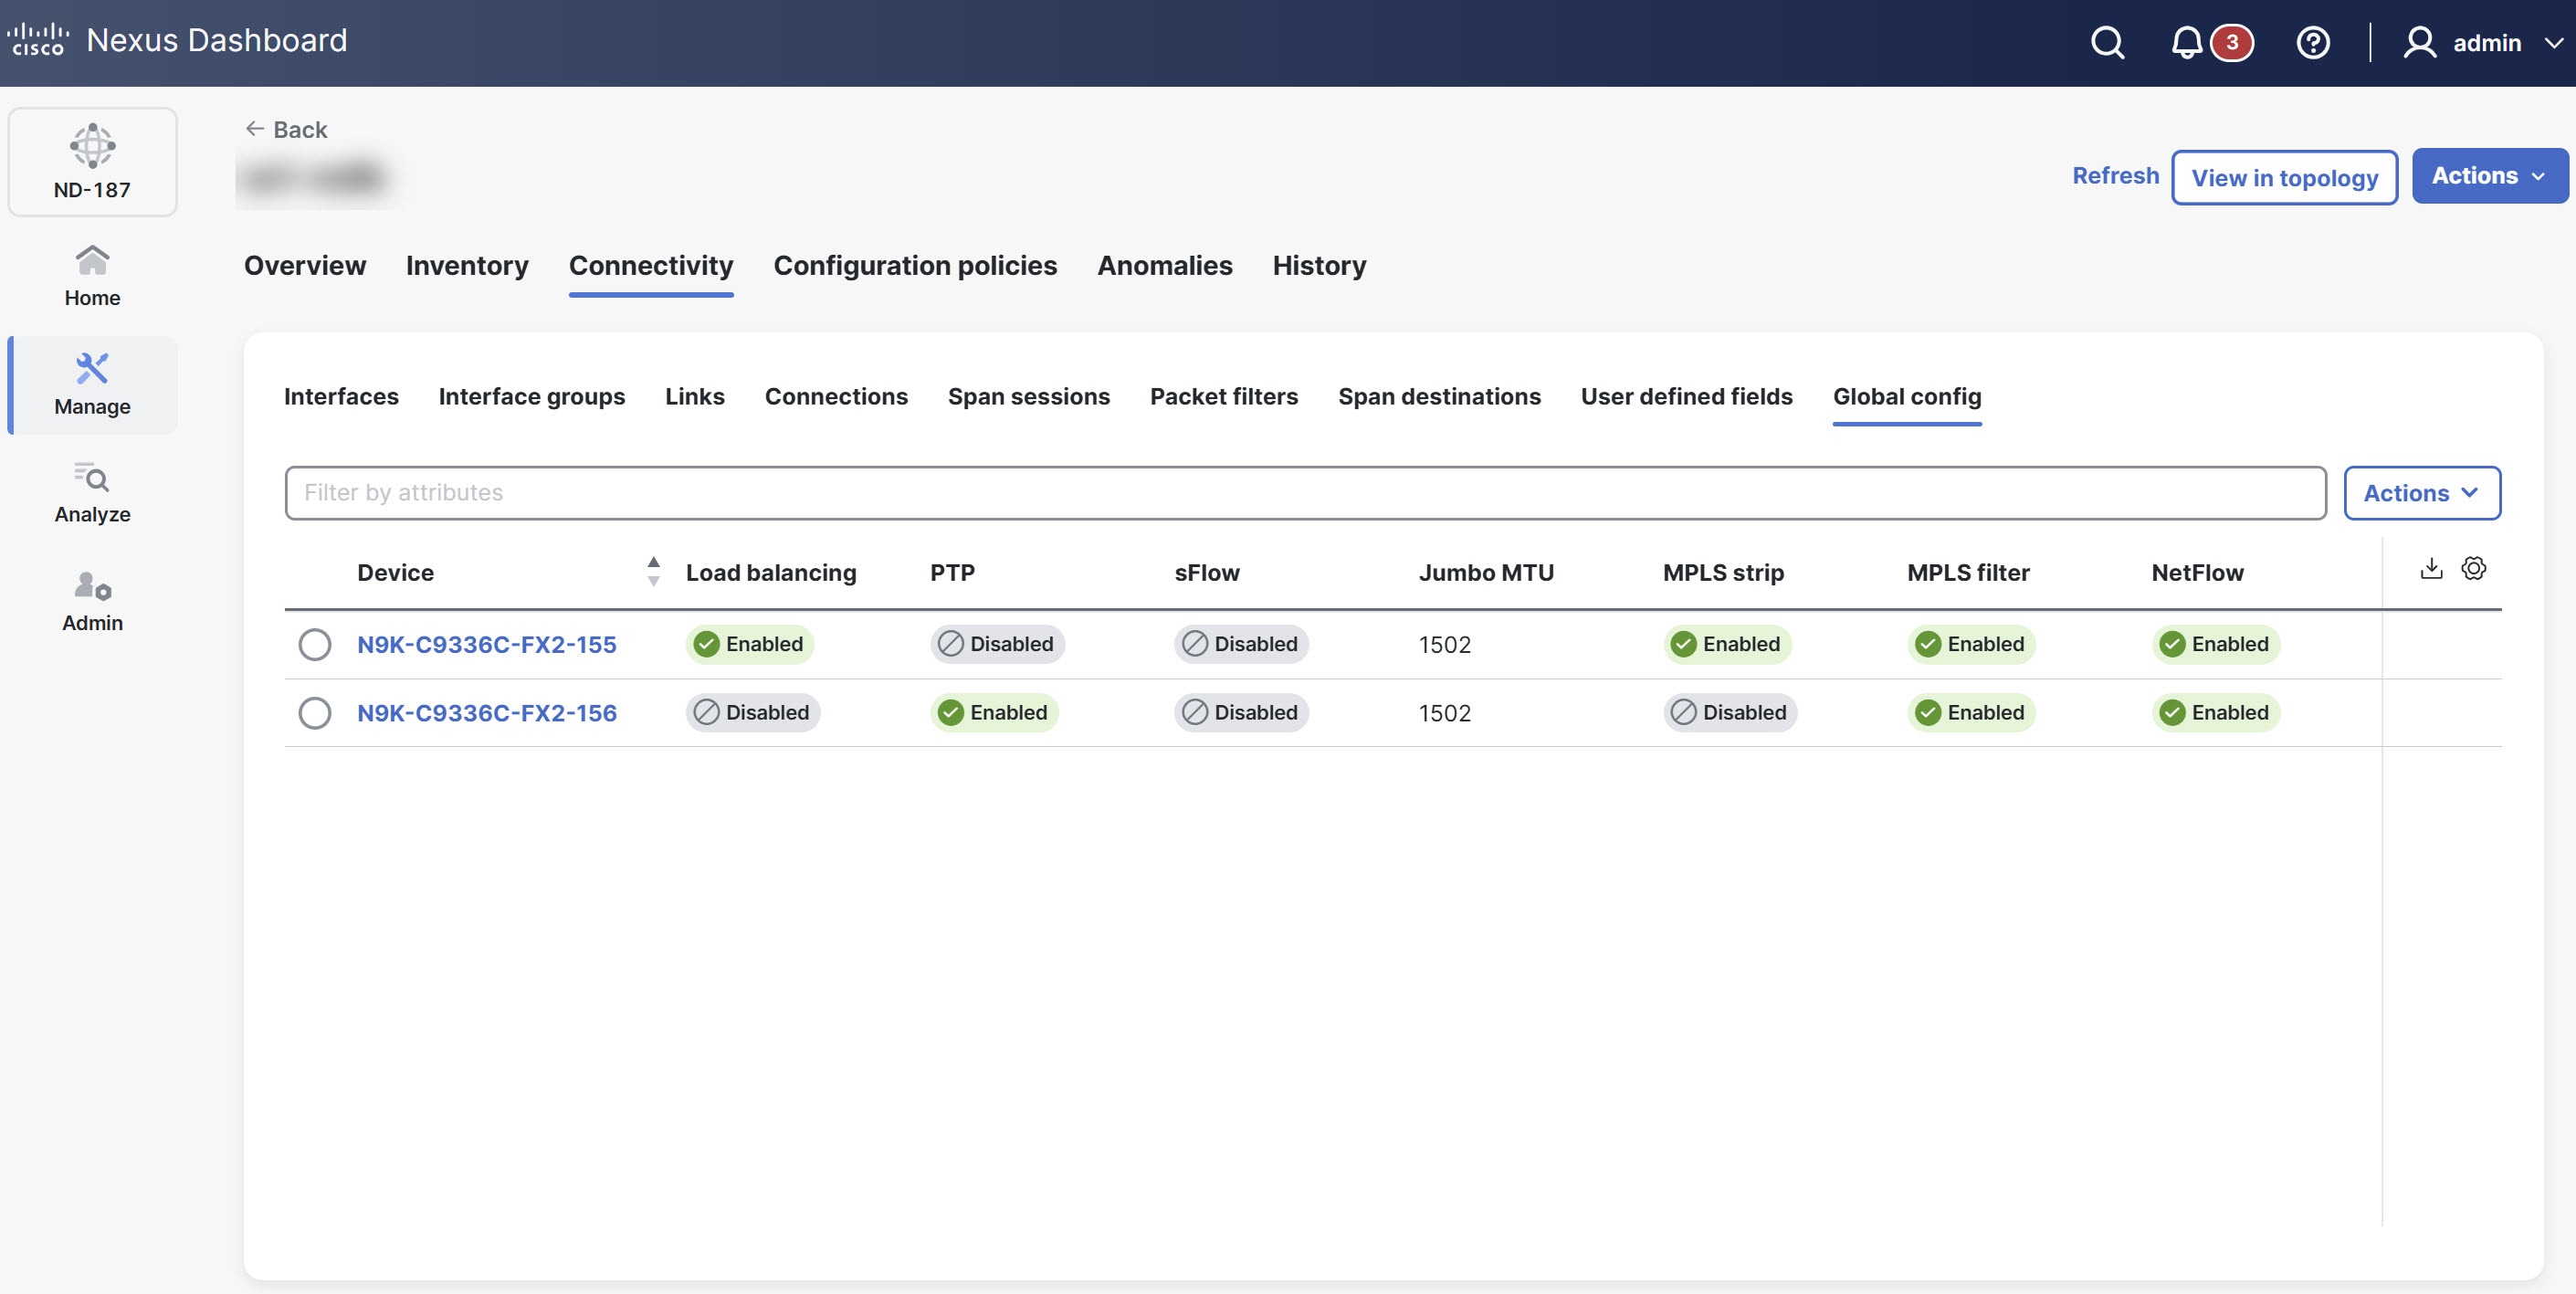
The Global config table provides the following information.
| Field | Description |
|---|---|
|
Device |
Displays the device name. Click the device name to view the global configuration details for that specific device. |
|
Load balancing |
Indicates the load balancing type. Options include Symmetric or Non-symmetric. |
|
PTP |
Displays whether the device enables or disables PTP. |
|
sFlow |
Indicates whether the device enables or disables sFlow monitoring. |
|
Jumbo MTU |
Specifies the maximum transmission unit (MTU) size you can configure for the device. |
|
MPLS strip |
Displays whether the device enables or disables MPLS stripping. |
|
MPLS filter |
Displays whether the device enables or disables MPLS filter. |
|
NetFlow |
Displays whether the device enables or disables NetFlow data collection. |
Edit global configuration
Follow these steps to edit the global configuration.
-
Click the Global config tab.
-
From the Global config, choose a device.
-
From the Actions drop-down list, choose Edit global configuration.
The Edit global configuration page displays.
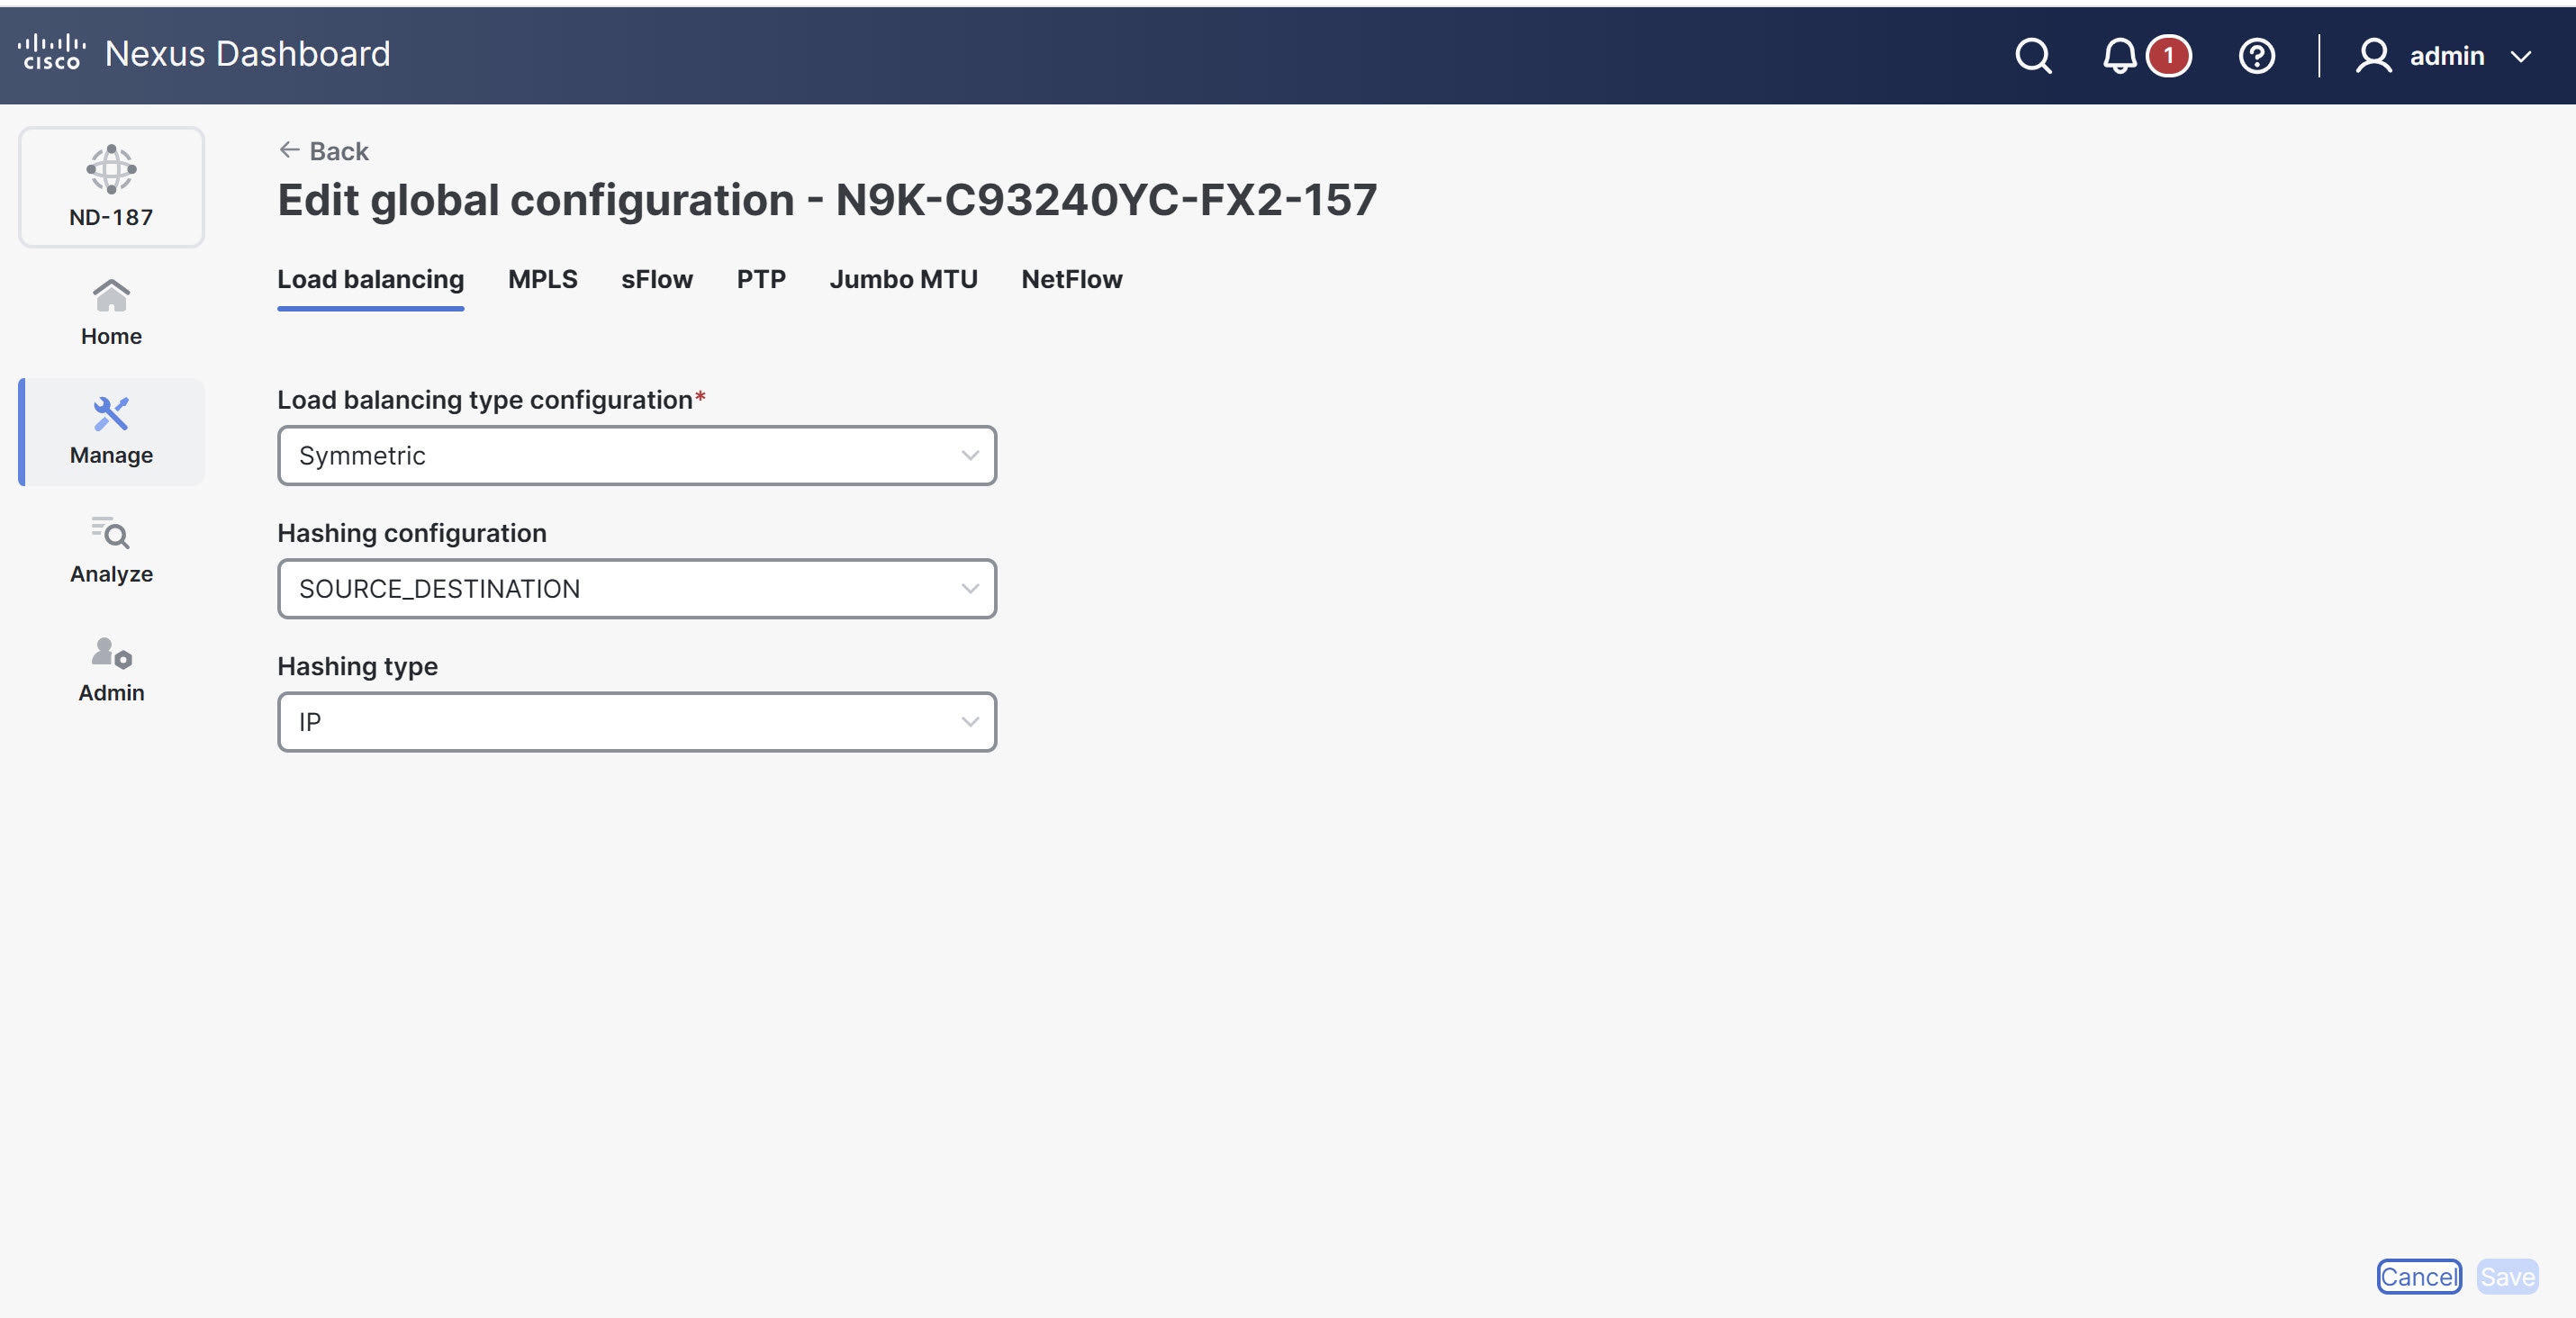
The following tabs display.
Field Description Load balancing
The Load balancing tab displays the following options.
-
Load Balancing type configuration list
-
Hashing configuration
-
Hashing type
MPLS
The MPLS tab displays the following options.
-
MPLS strip type configuration
-
Enable MPLS filter configuration
sFlow
Click Enable sFlow to view the following options.
-
Agent IP address
-
Select VRF
-
Collector IP address
-
Collector UDP port
-
Counter poll interval
-
Max datagram size
-
Max sampled size
-
Sampling rate
-
Data source(s)
Use the
show sFlowcommand to verify the sFlow configuration on a device.
PTP
Click Enable PTP to view the following options.
-
Source IP address
-
Ports
Enable PTP on all devices in the network to ensure PTP clock time synchronization. Nexus Dashboard uses PTP for timestamping on the input ports and for monitoring tools.
Jumbo MTU
Defines the maximum MTU value the device can accept. Enter an MTU value between 1502 and 9216.
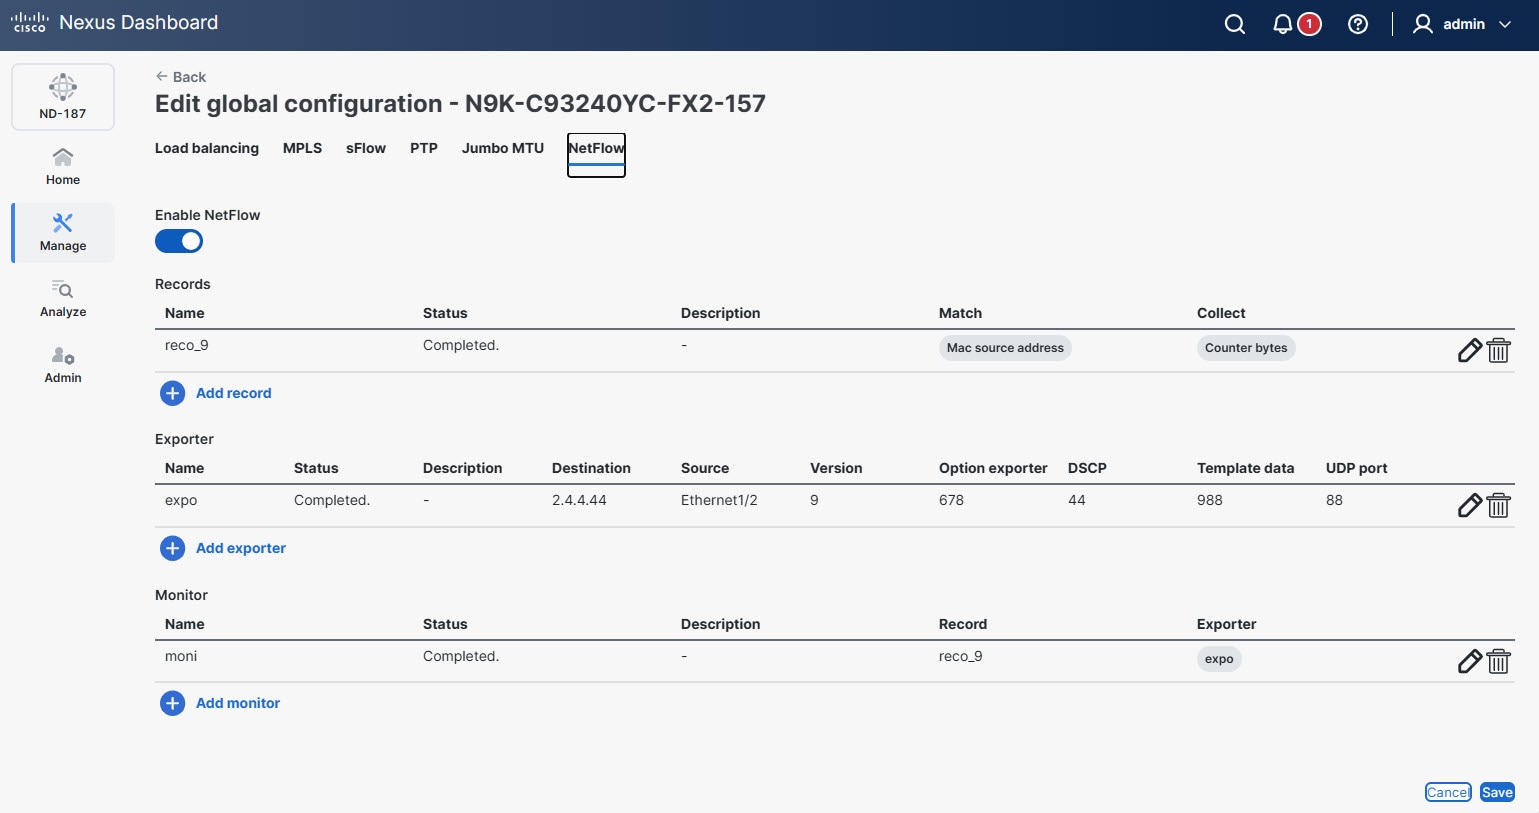
NetFlow
Click Enable NetFlow to view the following options.
To define the NetFlow parameters, complete the following configurations in the specified order.
-
-
After updating the required fields, click Save to apply the configuration changes.
Add record for NetFlow
A flow record specifies the keys that NetFlow uses to identify packets and the other fields of interest that NetFlow gathers for the flow. The flow record determines how much data NetFlow collects for a flow.
Follow these steps to add flow record.
-
Click the Global config tab.
-
From the Global config, choose a device.
-
From the Actions drop-down list, choose Edit global configuration.
The Edit global configuration page displays.
-
Click the NetFlow tab.
-
From the Records table, click Add record.
The Add record dialog box displays.
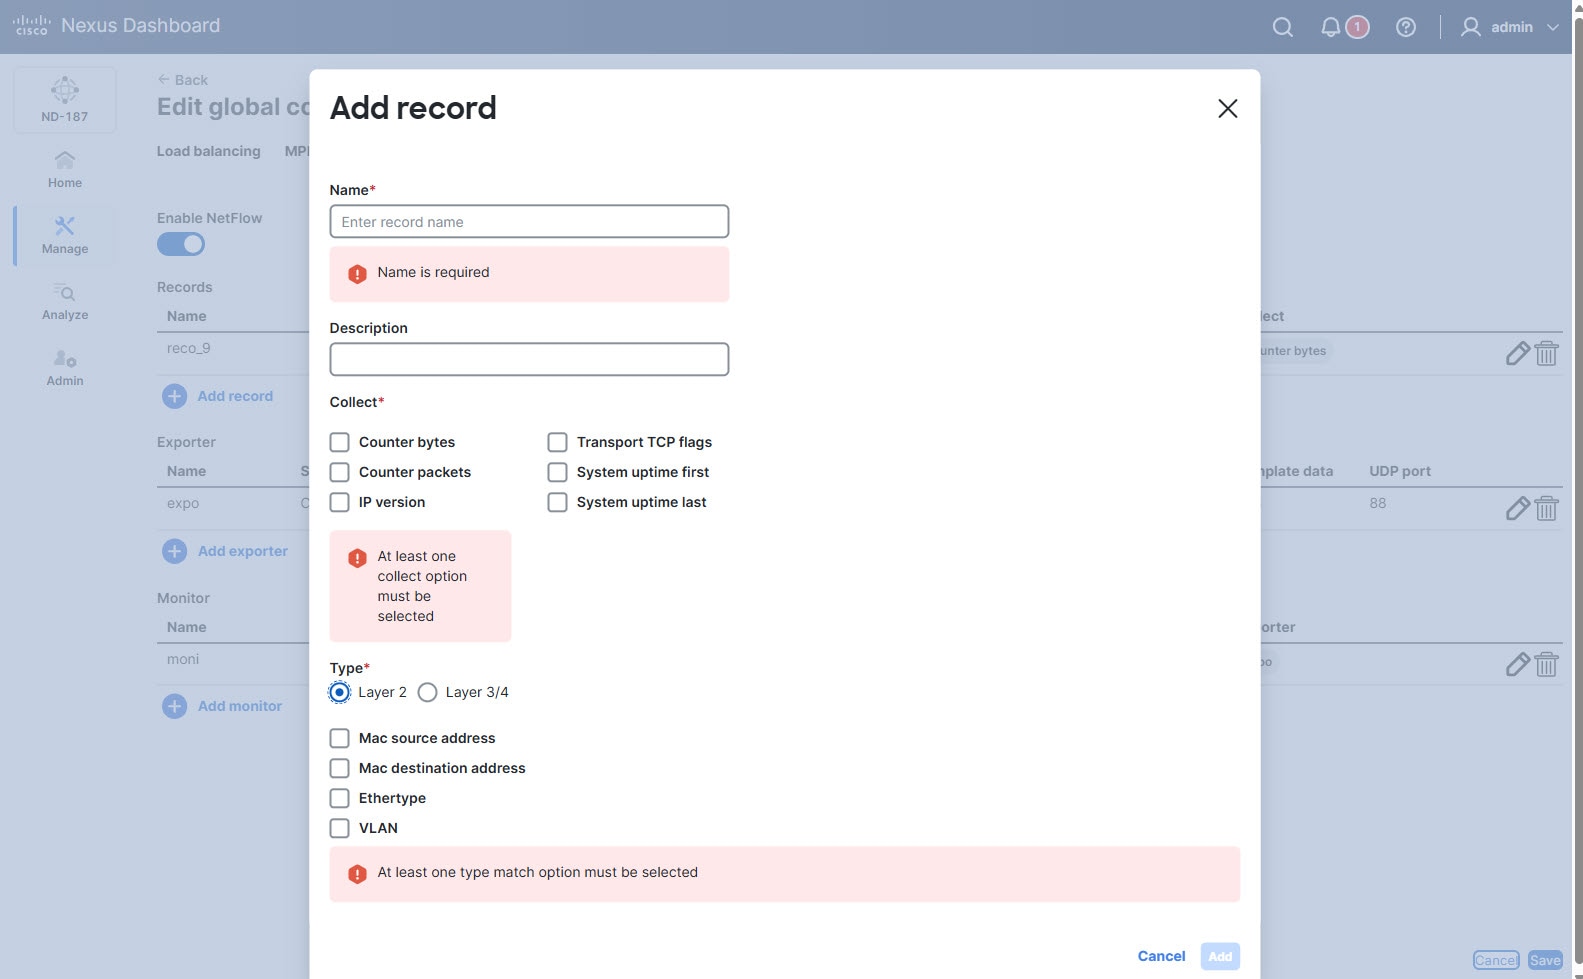
Provide the following details in the Add record dialog box.
Field Description Name
Provide a name for the flow record.
Description
Provide a brief description for the record.
Collect
Choose the options for the data you wish to collect.
-
Counter bytes
-
Counter packets
-
IP version
-
Transport TCP flags
-
System uptime first
-
System uptime last
Type
Choose one of the following options.
-
Layer 2
The following type match options appear when you choose Layer 2.
-
Mac source address
-
Mac destination address
-
Ethertype
-
VLAN
-
-
Layer 3/4
The following type match options appear when you choose Layer 3/4.
-
IP protocol
-
IP TOS
-
Transport source port
-
Transport destination port
-
IPv4 source address
-
IPv4 destination address
-
IPv6 source address
-
IPv6 destination address
-
IPv6 flow-label
-
IPv6 options
-
-
-
Click Add to save the record.
Add exporter for NetFlow
The flow exporter configuration defines the export parameters for a flow and specifies how to reach the remote NetFlow collector. A flow exporter includes network layer and transport layer details for the NetFlow export packet.
Follow these steps to add flow exporter.
-
Click the Global config tab.
-
From the Global config, choose a device.
-
From the Actions drop-down list, choose Edit global configuration.
The Edit global configuration page displays.
-
Click the NetFlow tab.
-
From the Exporter table, click Add exporter.
The Add exporter dialog box displays.
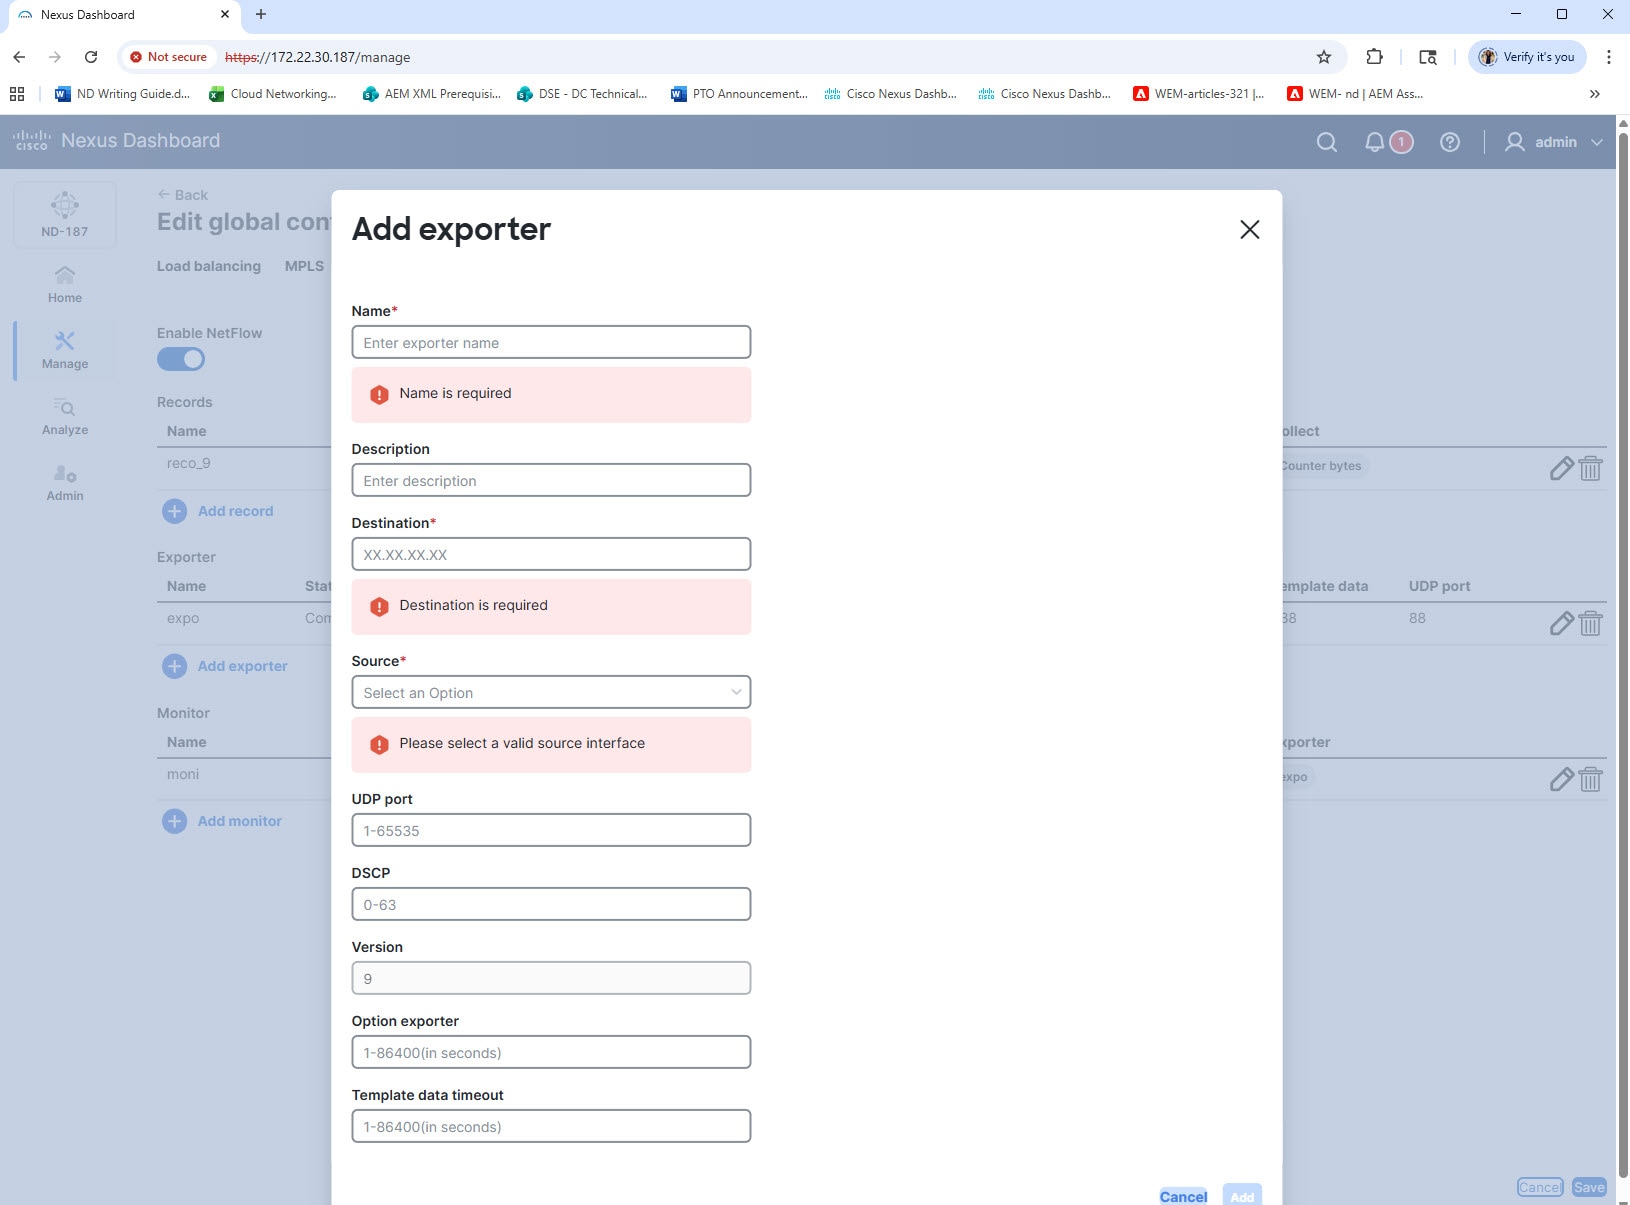
Provide the following details in the Add exporter dialog box.
Field Description Name
Provide a name for the exporter.
Description
Provide a brief description to identify the exporter.
Destination
Enter the IP address of the remote NetFlow collector.
Source
Choose a valid source interface from the drop-down list.
UDP port
Enter the UDP port number used for export.
DSCP
Enter the Differentiated Services Code Point (DSCP) value.
Version
Enter the NetFlow version (default is 9).
Option exporter
Enter the timeout interval for exporting options in seconds.
Template data timeout
Enter the timeout interval for exporting template data in seconds.
-
Click Add to save the exporter configuration.
Add monitor for NetFlow
You can create a flow monitor and associate it with a flow record and a flow exporter. The monitor uses the associated flow record to identify and analyze different fields in all its flows, and then exports the data to the specified flow exporter.
Follow these steps to add flow monitor.
-
Click the Global config tab.
-
From the Global config, choose a device.
-
From the Actions drop-down list, choose Edit global configuration.
The Edit global configuration page displays.
-
Click the NetFlow tab.
-
From the Monitor table, click Add monitor.
The Add monitor dialog box displays.
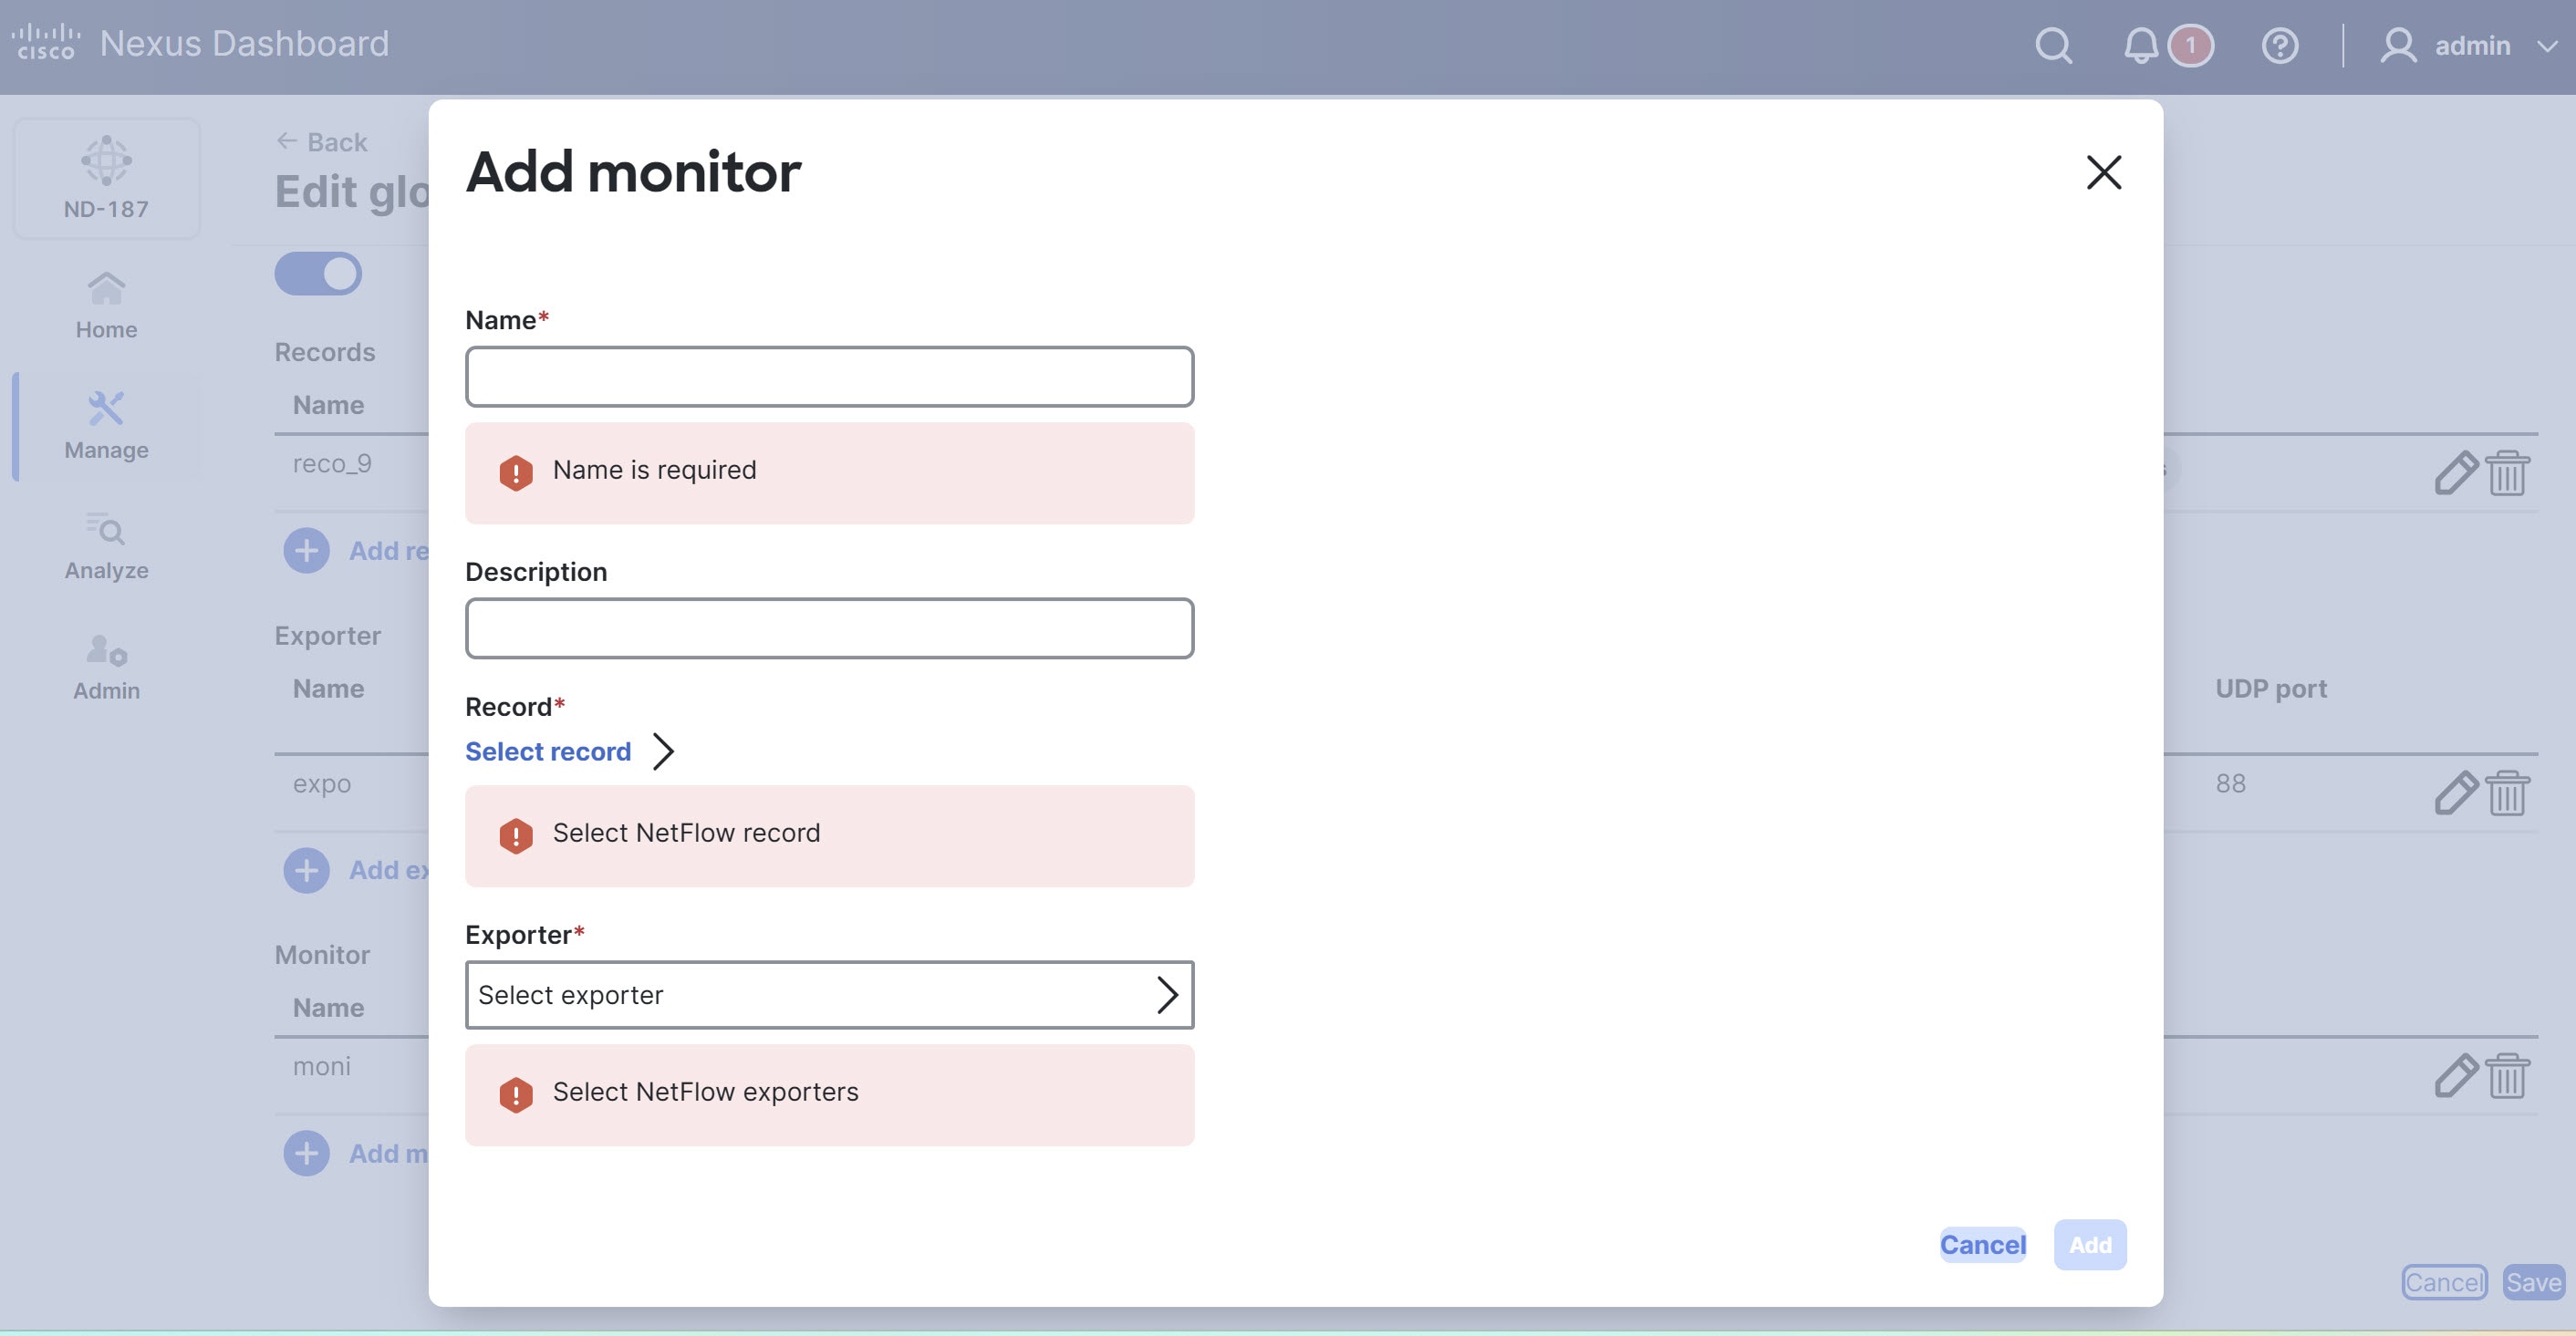
Provide the following details in the Add monitor dialog box.
Field Description Name
Provide a name for the monitor.
Description
Provide a brief description to help identify the monitor.
Record
Click Select record to choose the NetFlow record that defines the fields you monitor.
Exporter
Click Select exporter to choose the NetFlow exporter that receives the collected data.
You can choose a maximum of two flow exporters for a monitor.
-
Click Add to complete the configuration.
Copyright
THE SPECIFICATIONS AND INFORMATION REGARDING THE PRODUCTS IN THIS MANUAL ARE SUBJECT TO CHANGE WITHOUT NOTICE. ALL STATEMENTS, INFORMATION, AND RECOMMENDATIONS IN THIS MANUAL ARE BELIEVED TO BE ACCURATE BUT ARE PRESENTED WITHOUT WARRANTY OF ANY KIND, EXPRESS OR IMPLIED. USERS MUST TAKE FULL RESPONSIBILITY FOR THEIR APPLICATION OF ANY PRODUCTS.
THE SOFTWARE LICENSE AND LIMITED WARRANTY FOR THE ACCOMPANYING PRODUCT ARE SET FORTH IN THE INFORMATION PACKET THAT SHIPPED WITH THE PRODUCT AND ARE INCORPORATED HEREIN BY THIS REFERENCE. IF YOU ARE UNABLE TO LOCATE THE SOFTWARE LICENSE OR LIMITED WARRANTY, CONTACT YOUR CISCO REPRESENTATIVE FOR A COPY.
The Cisco implementation of TCP header compression is an adaptation of a program developed by the University of California, Berkeley (UCB) as part of UCB’s public domain version of the UNIX operating system. All rights reserved. Copyright © 1981, Regents of the University of California.
NOTWITHSTANDING ANY OTHER WARRANTY HEREIN, ALL DOCUMENT FILES AND SOFTWARE OF THESE SUPPLIERS ARE PROVIDED “AS IS" WITH ALL FAULTS. CISCO AND THE ABOVE-NAMED SUPPLIERS DISCLAIM ALL WARRANTIES, EXPRESSED OR IMPLIED, INCLUDING, WITHOUT LIMITATION, THOSE OF MERCHANTABILITY, FITNESS FOR A PARTICULAR PURPOSE AND NONINFRINGEMENT OR ARISING FROM A COURSE OF DEALING, USAGE, OR TRADE PRACTICE.
IN NO EVENT SHALL CISCO OR ITS SUPPLIERS BE LIABLE FOR ANY INDIRECT, SPECIAL, CONSEQUENTIAL, OR INCIDENTAL DAMAGES, INCLUDING, WITHOUT LIMITATION, LOST PROFITS OR LOSS OR DAMAGE TO DATA ARISING OUT OF THE USE OR INABILITY TO USE THIS MANUAL, EVEN IF CISCO OR ITS SUPPLIERS HAVE BEEN ADVISED OF THE POSSIBILITY OF SUCH DAMAGES.
Any Internet Protocol (IP) addresses and phone numbers used in this document are not intended to be actual addresses and phone numbers. Any examples, command display output, network topology diagrams, and other figures included in the document are shown for illustrative purposes only. Any use of actual IP addresses or phone numbers in illustrative content is unintentional and coincidental.
The documentation set for this product strives to use bias-free language. For the purposes of this documentation set, bias-free is defined as language that does not imply discrimination based on age, disability, gender, racial identity, ethnic identity, sexual orientation, socioeconomic status, and intersectionality. Exceptions may be present in the documentation due to language that is hardcoded in the user interfaces of the product software, language used based on RFP documentation, or language that is used by a referenced third-party product.
Cisco and the Cisco logo are trademarks or registered trademarks of Cisco and/or its affiliates in the U.S. and other countries. To view a list of Cisco trademarks, go to this URL: https://www.cisco.com/go/trademarks. Third-party trademarks mentioned are the property of their respective owners. The use of the word partner does not imply a partnership relationship between Cisco and any other company. (1110R)
© 2017-2026 Cisco Systems, Inc. All rights reserved.
Americas Headquarters
Cisco Systems, Inc.
170 West Tasman Drive
San Jose, CA 95134-1706
USA
https://www.cisco.com
Tel: 408 526-4000
800 553-NETS (6387)
Fax: 408 527-0883