
New and changed information
The following table provides an overview of the significant changes up to this current release. The table does not provide an exhaustive list of all changes or of the new features up to this release.
| Release Version | Feature | Description |
|---|---|---|
|
Nexus Dashboard 4.2.1 |
Search and Explore support for Security Groups |
Beginning with Nexus Dashboard 4.2.1, Search and Explore supports 'Can' queries for security groups, including Group Policy Objects (GPOs) in NX-OS and Endpoint Security Groups (ESGs) in ACI. For more information, see Supported query types. |
Search and Explore
How Search and Explore works
Search and Explore functionality allows you to quickly search for an IP or MAC address, interface name, or switch name across all the fabrics managed by Nexus Dashboard and view the results within a few seconds. You can also create a Show query to display anomalies, advisories, controllers and switches in inventory, interfaces, endpoints, and more. Search and Explore also enables you to ask questions or use explore queries to understand how different elements, including security groups, communicate with each other as well as other associations.
Supported query types
Search and Explore supports these queries.
-
What query — Answers how the different networking entities are related to each other.
Examples:
-
What EPGs are associated with VRF: uni/tn-AIOps/ctx-APP1
-
What endpoints are associated with interface: topology/pod-1/paths-101/pathep-[eth1/10]
-
What EPGs are associated with bridge domains: uni/tn-AIOps/BD-10.0.0.0_24 and leaf leaf-101
-
-
Can query — Answers whether the entities in the ACI policy or security groups in ACI/NX-OS can communicate with each other. Can queries allow you to determine if the entities in the ACI policy or security groups can communicate using protocols such as TCP, UDP, or ICMP and the source and destination ports used for communication.
Examples:
-
Can entity — Can A_ talk to entity B?
-
Can EPG — Can uni/tn-secure/ap-AP0/epg-B talk to EPG: uni/tn-secure/ap-AP0/epg-A on tcp dport: 80 sport: 10?
-
Can security-group — Can security-group uni/tn-demo-tenant/ap-demo-ap1/esg-demo-esg1 talk to security-group uni/tn-demo-tenant/ap-demo-ap1/esg-demo-esg2
-
Can security-group — Can security-group A talk to security-group B
-
-
Show query — Allows you to view any of the various objects across any fabric currently visible in Nexus Dashboard.
-
Search for single-word strings across inventory, endpoints (IP and MAC addresses), and fabrics.
-
You can perform Show queries on anomalies, advisories, switches, controllers, endpoints, interfaces, flows, and more.
-
Show security-group — show security-groups on switch/tenant/vrf and Show security segmentation.
-
Guidelines and limitations for Search and Explore
-
Nexus Dashboard supports Search and Explore, search supports both IPv4 and IPv6 addresses but explore supports only IPv4 address.
-
Show queries support IPv4 and IPv6 addresses. However, What and Can queries support only IPv4. What query results do not display IPv6 endpoints, including those in microsegmentation endpoint groups (uSeg EPGs).
-
When you enter a search string, auto-suggest displays the results that begin with the input string. The search string is case sensitive.
-
Search and Explore is not available for hardware and capacity resources on leaf switches.
-
In certain cases, single keyword search for interface types such as port channel, virtual port channel, and virtual port channel peer link is supported.
-
Scale limits for Search and Explore include:
-
On a virtual Nexus Dashboard, Nexus Dashboard supports snapshots with 100,000 logical rules and 350,000 (Vertices + Edges).
-
On a physical Nexus Dashboard, Nexus Dashboard supports snapshots with 300,000 logical rules and 1000,000 (Vertices + Edges).
-
-
The table lists additional limitations.
Category Limitation Real-time exploration
Real-time exploration supports ESG queries only. The system does not support objects from Nexus Dashboard 4.1.1 or earlier, such as EPG or VRF.
Query parameters
The system does not support any queries for security groups. For example, you cannot use Can any talk to security group or Can security group talk to any.
Fabric scope
Can security-group queries support a single fabric only. The system does not support these queries across fabric groups or orchestrated fabrics.
Query modeling
Existing Can explorer queries for objects such as VRF or Bridge Domain (BD) are EPG-based. These queries do not support ESG-based modeling, except for endpoints.
L4–L7 services
Can ESG queries do not include Layer 4 to Layer 7 (L4–L7) configurations.
Deployment types
The system does not support colocation for search or explorer queries.
Multisite support
Explorer does not support multisite configurations for Cisco ACI.
Data consistency
Explorer results are based on the last collected epoch, whereas connectivity analysis results are real-time. A mismatch may occur if fabric changes happen between the last epoch and the connectivity analysis job trigger.
Negative results
For "cannot talk" query results, Explorer provides the status but does not offer additional diagnostic information or root cause analysis.
Prefix view
The prefix view in the radial chart displays data only if both security groups have at least one IP subnet (ACI) or connectedEndpoint (NDFC) selector.
-
Software and hardware requirements for ESG and GPO support.
-
Supported Software versions:
-
NXOS -starting 10.5(2), SGACL is supported on all FX/FX2/H platforms
-
Starting 10.5(1), SGACL is supported on N9K-C9408
-
-
APIC - starting 5.2(g)
-
ACI switches - starting 15.2(g)
-
-
Supported Hardware platforms:
-
Switches and controllers that support ESG configurations
-
NX-OS Release 10.4(3)F, GPO is supported on 9300-FX3, 9300-GX, 9300-GX2, and 9300-GX3
-
ACI: ESGs are supported on 9300-EX, 9300-FX2, 9300-FX3, and 9300-GX
-
-
-
Guidelines and limitations for queries in any fabric
-
A What X to any association query is only supported for single fabrics.
-
The retention period for a What query is seven days. After that, the What query does not display in historical searches.
Guidelines and limitations for queries in a Cisco ACI fabric
-
A Can any-to-any query is not supported.
-
For a Can query between prefixes, if the number of EPGs shared by the prefixes is greater than 25, the endpoint table fails to load the data and displays an error message.
-
To explore the Cisco APIC resources successfully using the Search and Explore feature, the Cisco APIC policy must contain either valid endpoints such as fv:CEp or valid EPGs.
-
Connectivity analysis integration: Redirection to a connectivity analysis job from the Explorer interface is only available for Can endpoint talk to endpoint queries.
-
Connectivity analysis job results: In Security of a connectivity analysis job report, results for Cisco ACI are displayed specifically for Can endpoint talk to endpoint queries.
Guidelines and limitations for queries in an NX-OS fabric
-
Beginning with Nexus Dashboard 4.2.1, Can security-group query is supported on both ACI and NX-OS fabrics.
-
Data center VXLAN EVPN fabrics do not support brownfield import when security groups are configured.
-
Queries for Nexus Dashboard resources (such as interfaces, VRFs, or vPCs) are unavailable on Nexus Dashboard clusters integrated when telemetry is enabled on the local cluster.
-
Specific queries, such as show anomalies on interface, show anomalies on vpc, or show endpoints on interface, are unavailable on Nexus Dashboard clusters running on the same Nexus Dashboard instance when the controller is present on the local cluster.
-
A What X to any association query is only supported for single fabrics. Additionally, Can queries are not supported for NX-OS fabrics.
-
The retention period for a What query is seven days. After that, the What query does not display in historical searches.
-
For NX-OS fabrics, this feature provides a switch-wide view of VRFs, VLANs, interfaces, endpoints, and leaf switch resources in the fabric. Search and Explore also provides Layer 2 VNI and Layer 3 VNI as resources.
-
Resource aggregation is supported for VLAN and VRF resources. With resource aggregation, resources like VRF and VLAN are discovered for the entire fabric and all the leaf switches are aggregated by these resources. If you query What VLANs are associated with any? in the Query Results area, you see a list of all the VLANs available across the fabric. EP and LEAF counts are aggregated by VLAN, and you can find all the EPs and LEAFs associated with a single VLAN by clicking the aggregated resource counts.
Additionally, as the VLAN and VRF queries are fabric-wide, if you want to explore resources for a VLAN on a specific leaf switch, you must use the AND operator in your query.
Example: What EPs are associated with VRF:vrf-vrf_51020 and LEAF:CANDID-SYS-S1-L1
-
A networking asset, such as interfaces on a leaf switch, must be associated with an endpoint in the leaf switch for you to be able to explore it in Search and Explore.
-
When a VRF is not operational, Search and Explore discovers the endpoints as a Layer 2 endpoint. Search and Explore discovers endpoints as Layer 3 or Layer 2 endpoints. All endpoints present in a VLAN are discovered, and other endpoints are ignored.
-
In Search and Explore, if you do not see endpoints or other network assets, look for system anomalies in the associated snapshot. Verify that the collection has succeeded in all the leaf switches. If the collection failed, it may result in endpoints not being discovered.
-
Nexus Dashboard-based fabrics must have endpoints available in the VNIs or VRFs for certain What queries to work, since this feature is based on the endpoints that are learnt on VNIs and/or VRFs. If the endpoints are not available, the What query for the VRF or L3 VNI does not display accurate results.
-
Endpoint query results vary by query type: Results differ depending on whether you use the What or Show query.
-
What queries use the Assurance engine and display only Layer 3 (L3) IPv4 endpoints. They do not support the display of IPv6 endpoints, even if the fabric learns them or you define them using microsegmentation (uSeg) attributes.
-
Show queries use the Telemetry engine and display both Layer 2 (L2) and Layer 3 (L3) endpoints for both IPv4 and IPv6. If an IPv6 endpoint is visible in the APIC but missing from a What query, use a Show query to verify the telemetry status.
-
-
Supported queries: Cisco NDFC iBGP EVPN VXLAN fabrics support the Can security-group talk to security-group query only.
-
Deployment models: The Can security-group talk to security-group query on NDFC supports co-host deployments only. Colocation deployments are not supported for this query.
Key capabilities for security groups
This feature introduces the key capabilities for Endpoint Security Groups (ESGs) in ACI and security groups in NX-OS.
-
Enhanced Can query support includes these enhancements:
-
The Can endpoint A talk to endpoint B query supports ACI ESGs.
-
The Can security-group X talk to security-group Y query supports the ESG explorer.
-
-
Enhanced show show redirection support:
-
show security-groups on switch
-
show security-groups on tenant
-
show security segmentation
-
show security-groups vrf
-
Multi-cluster connectivity global search across all clusters
The Nexus Dashboard 4.1.1 multi-cluster supports unified search for IP and MAC addresses across multiple Nexus Dashboard clusters. This feature allows you to view these resources (both local and remote) and caches your past search strings.
Guidelines and limitations for multi-cluster connectivity global search
-
Primarily supports single-word searches for MAC and IP addresses.
-
Auto-suggest provides detailed results including switch, interface, and VLAN information.
-
Results are limited to 10,000 entries and display fabric names.
-
Refine search results by applying filters to columns or description sections within the results table.
-
The search bar is unavailable, and a warning appears if no fabrics across your clusters have telemetry enabled.
-
-
The Details column provides additional information with links to external resources.
-
You can view the details of remote resources within the context of the current clusters.
-
Clicking an endpoint loads its details page within the search view; external links from this page are restricted.
-
Redirecting to a remote cluster does not retain endpoint filters, takes you only to the fabric-level, and provides no direct return to the search view.
Perform a Search and Explore operation
Follow these steps to perform a search and explore operation.
-
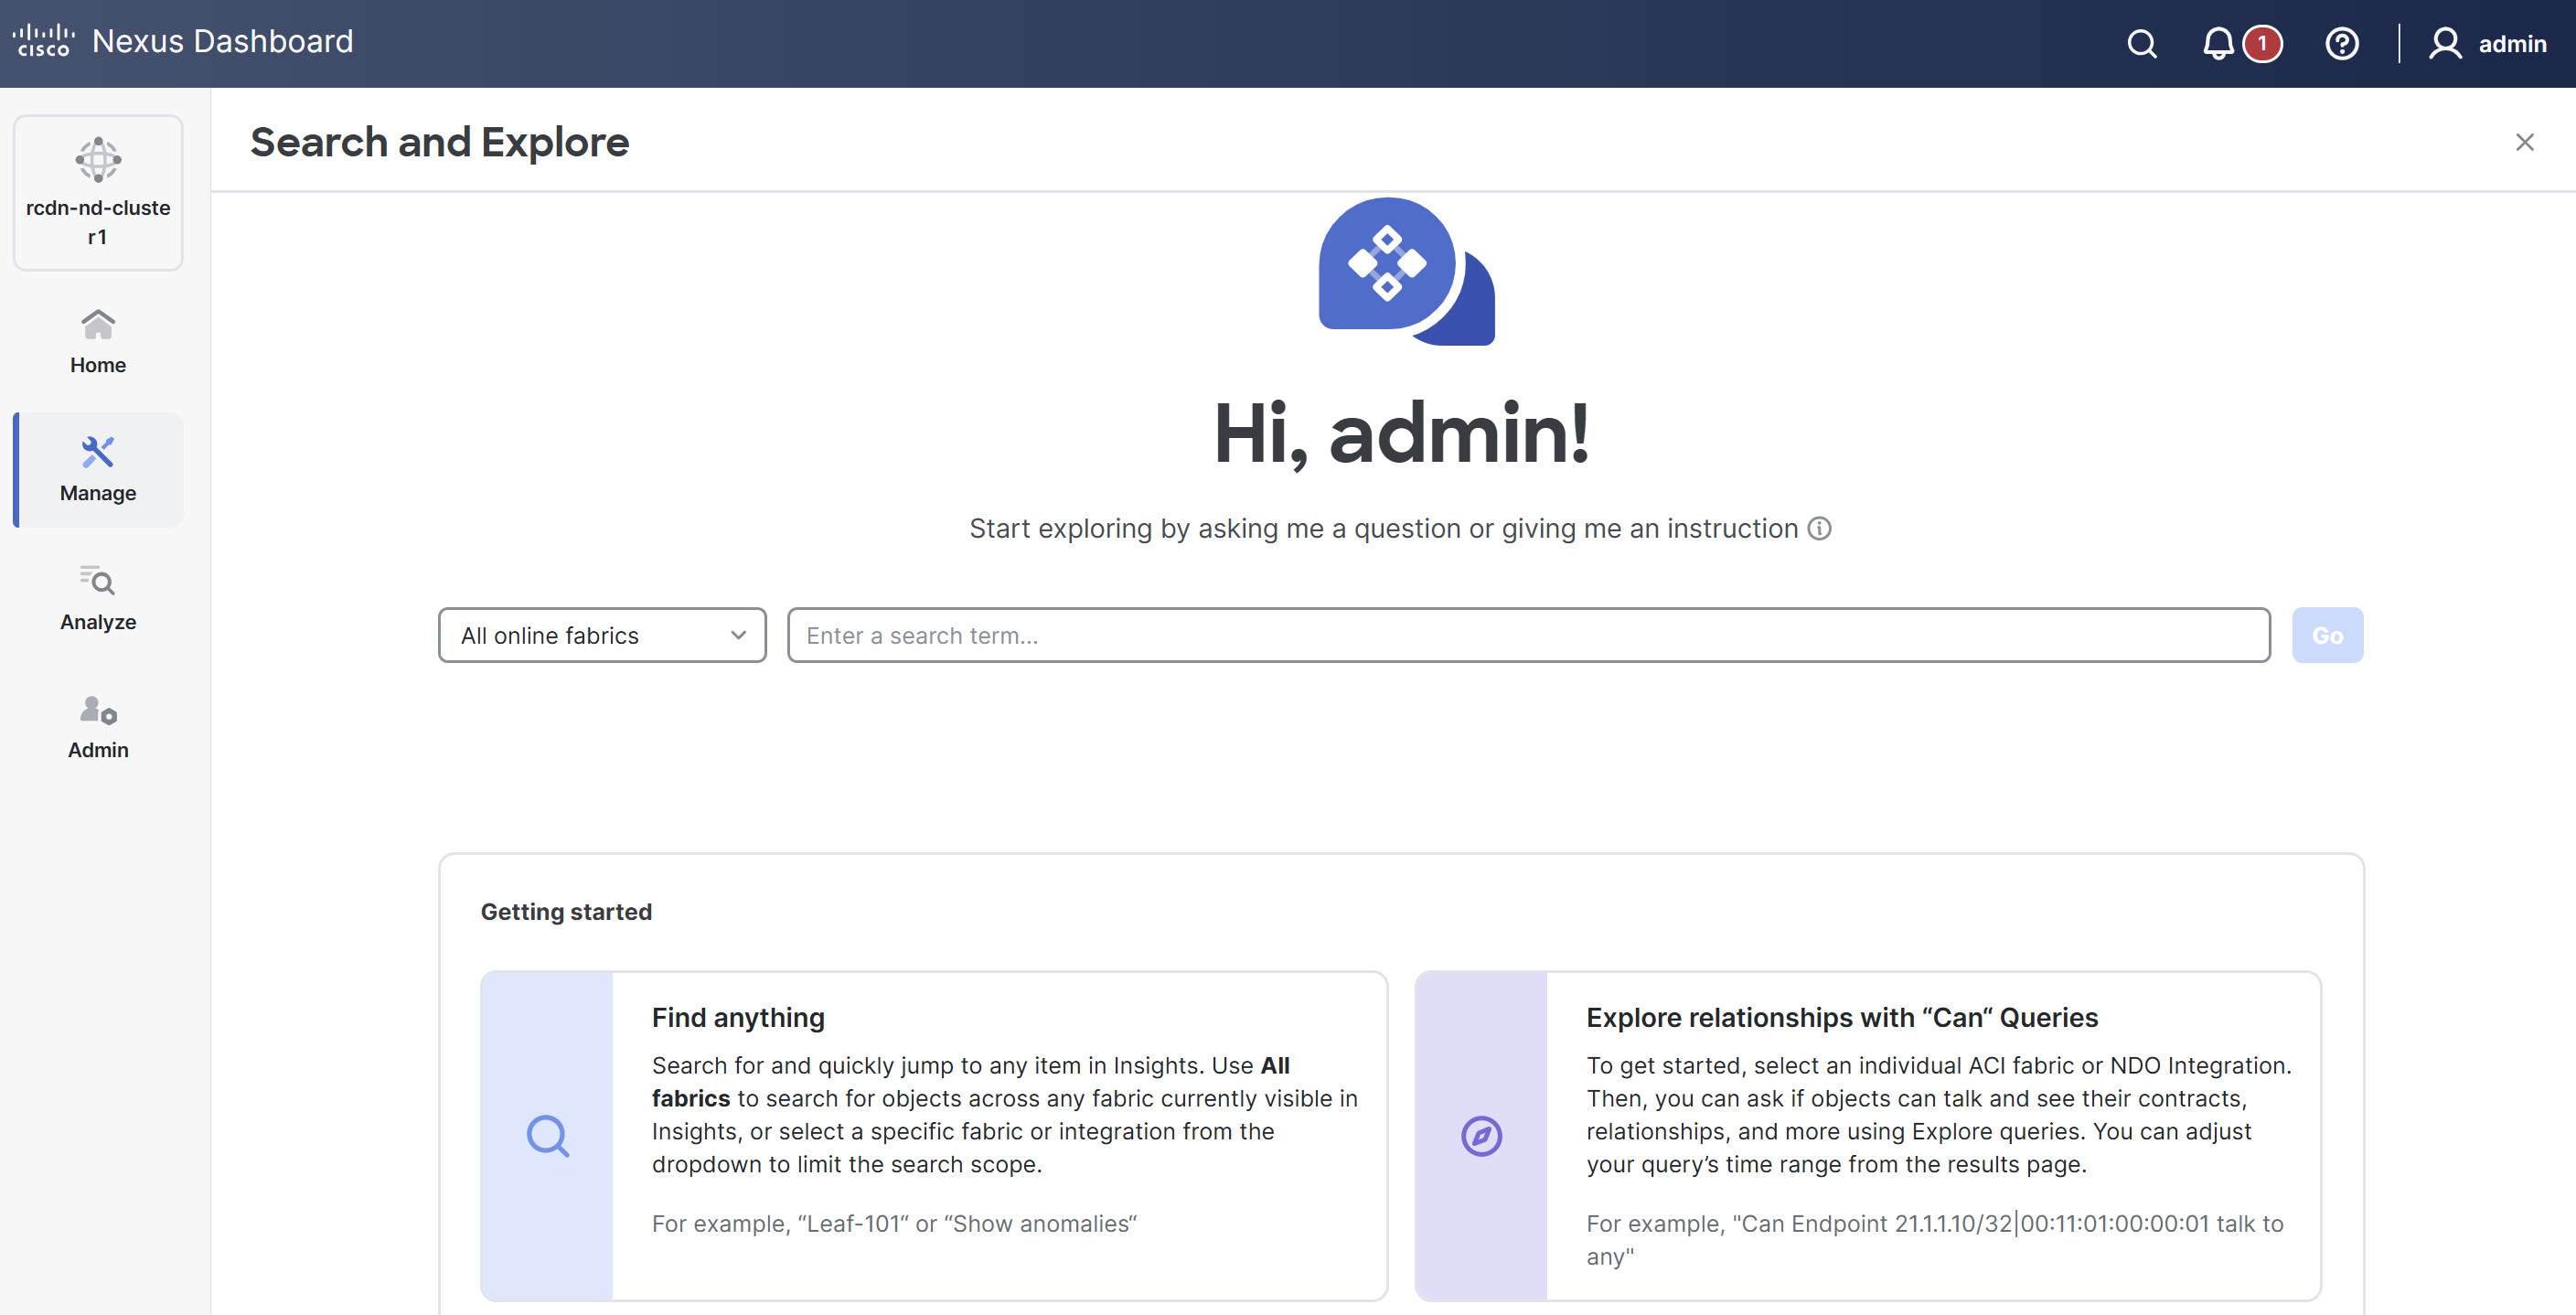
Click the Search and Explore icon at the top of the Nexus Dashboard GUI.
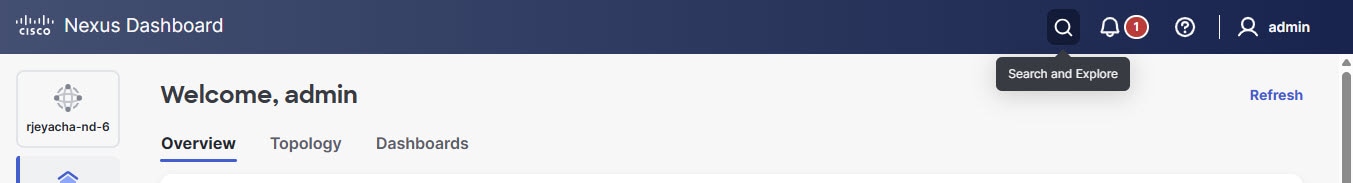
The Search and Explore page appears.
-
From the drop-down list, choose All online fabrics or a single fabric.
-
Keyword Search
-
Search and explore allows you to locate network items using keyword searches or auto-suggested results.
-
Keyword search: Type a string and press Enter to search across inventory, endpoints, and fabrics.
-
Auto-suggest: Type at least three characters to display suggested results, such as endpoints, switches, virtual routing and forwarding (VRF) interfaces, and VLANs. Select a suggestion to navigate to the item.
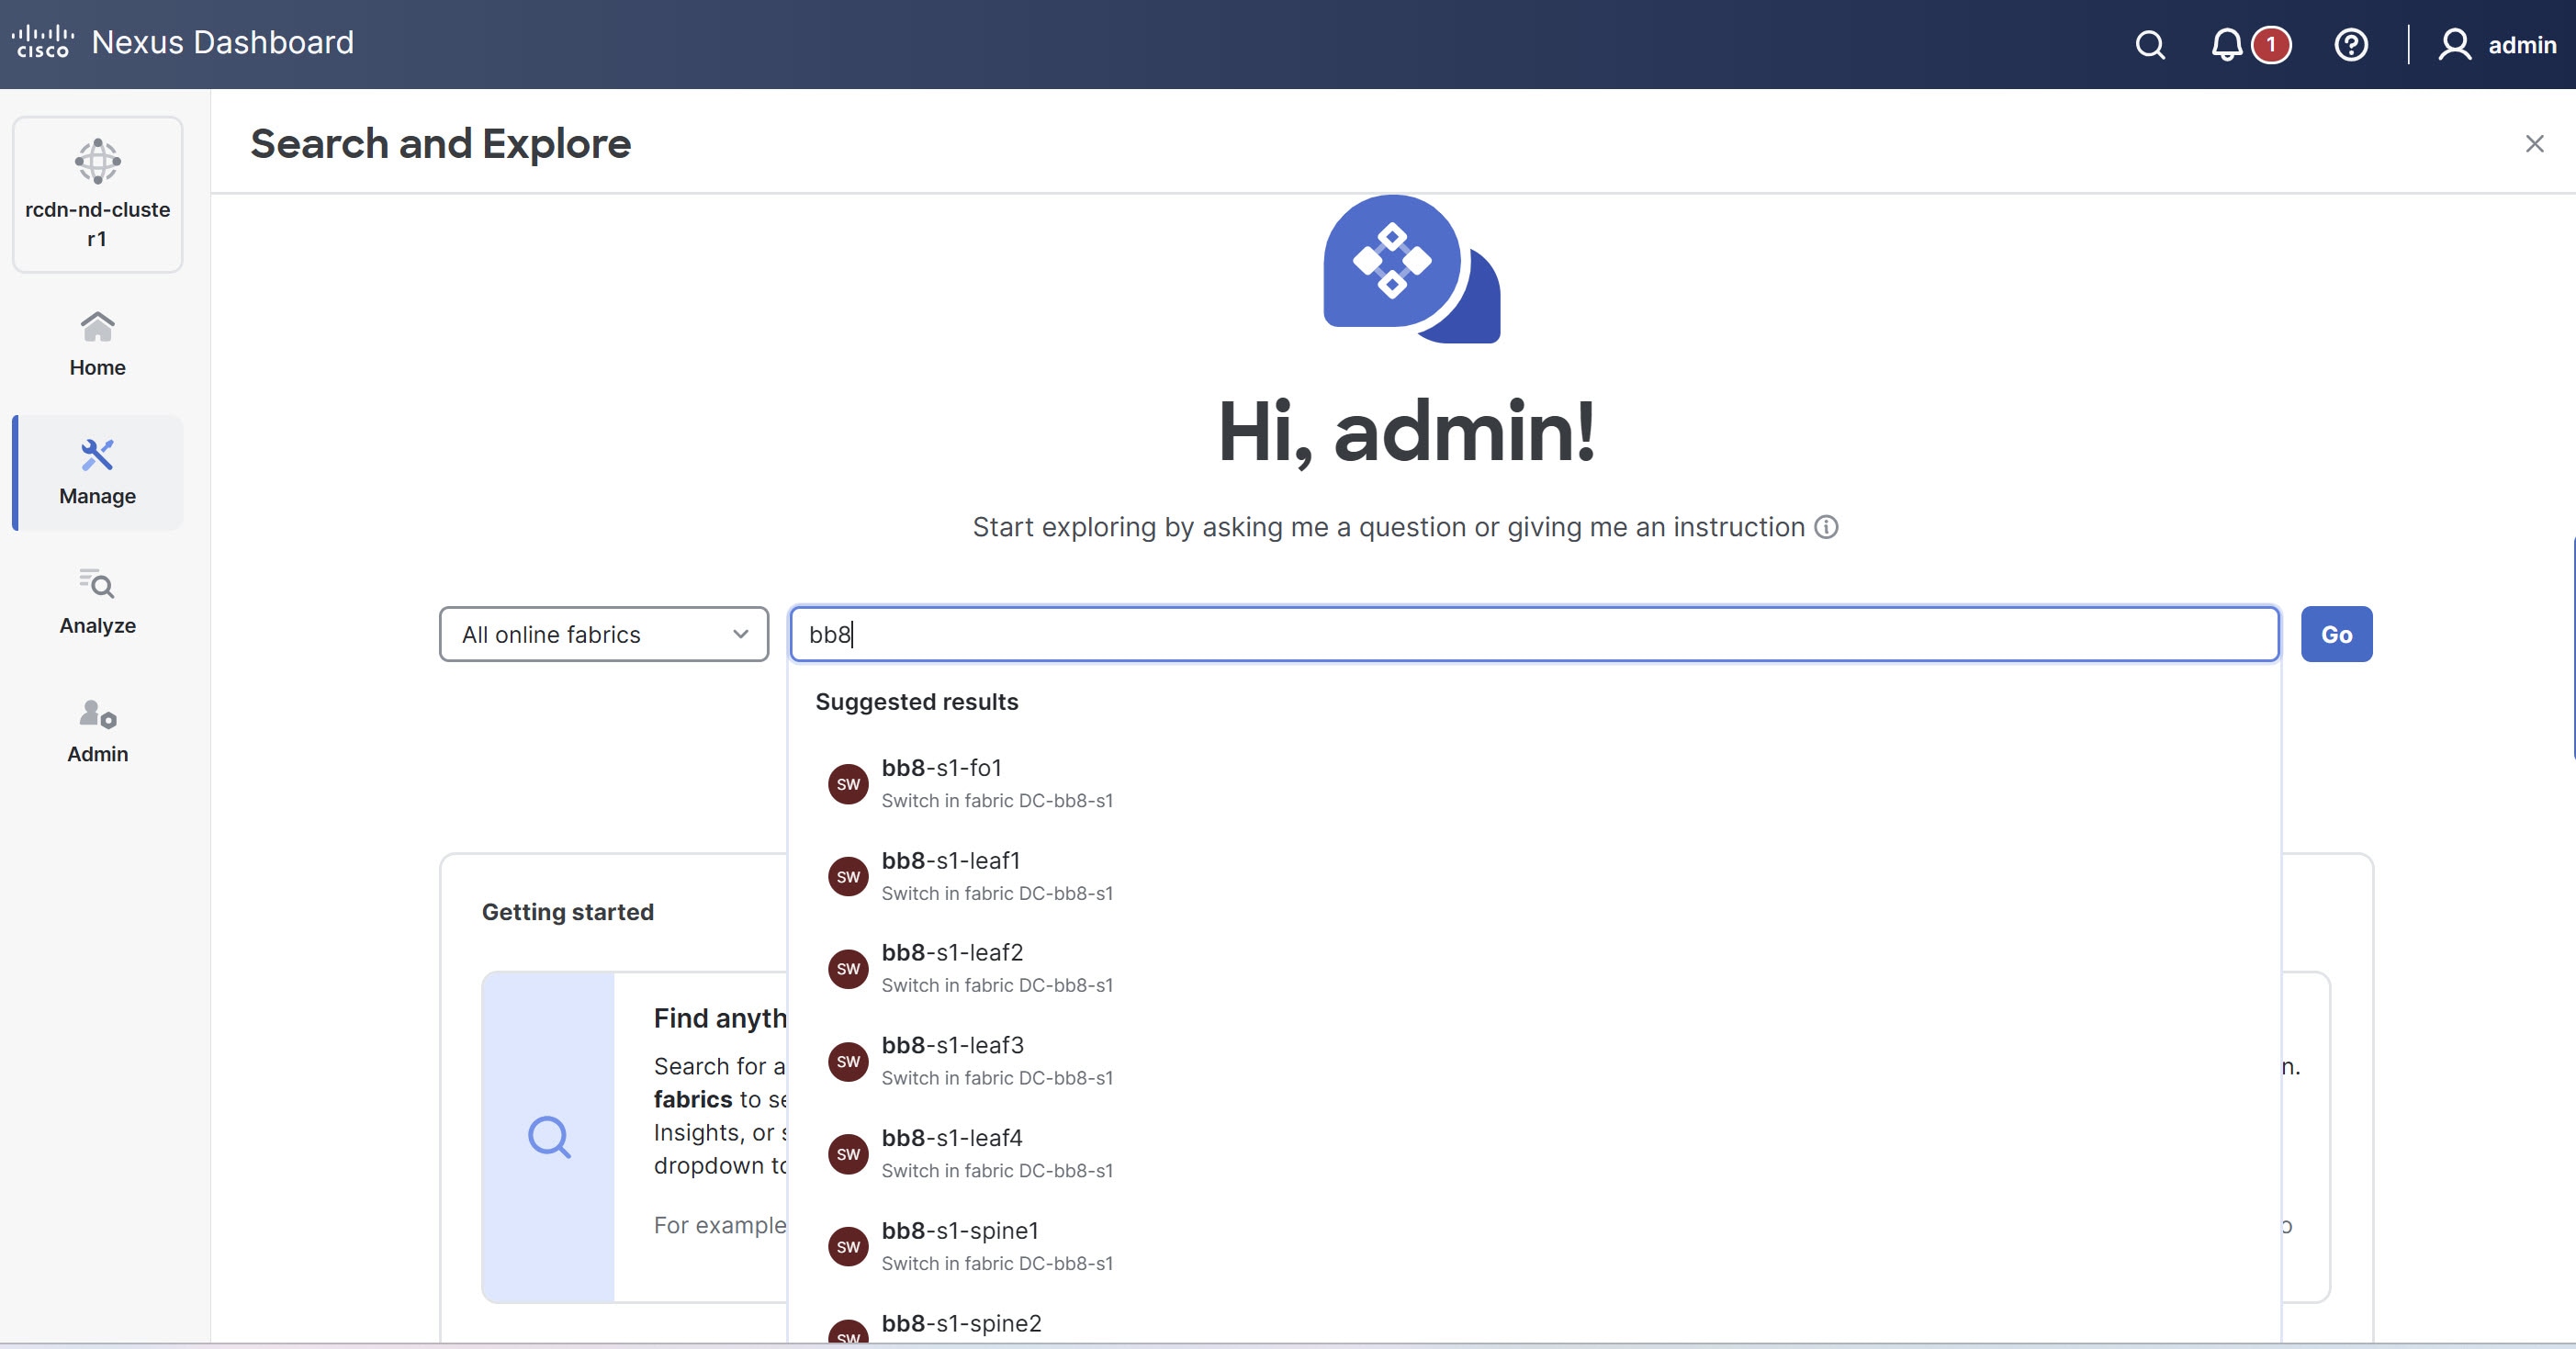

Keyword search is supported on online fabrics. Keyword search is case-sensitive.
-
-
Choose a result from the suggested results and click Go.
-
By default, search results for Active Now are displayed.
-
For MAC and IP address searches, the endpoint page is displayed. For switch and interface name searches, the respective page displays.
-
-
Show Queries
-
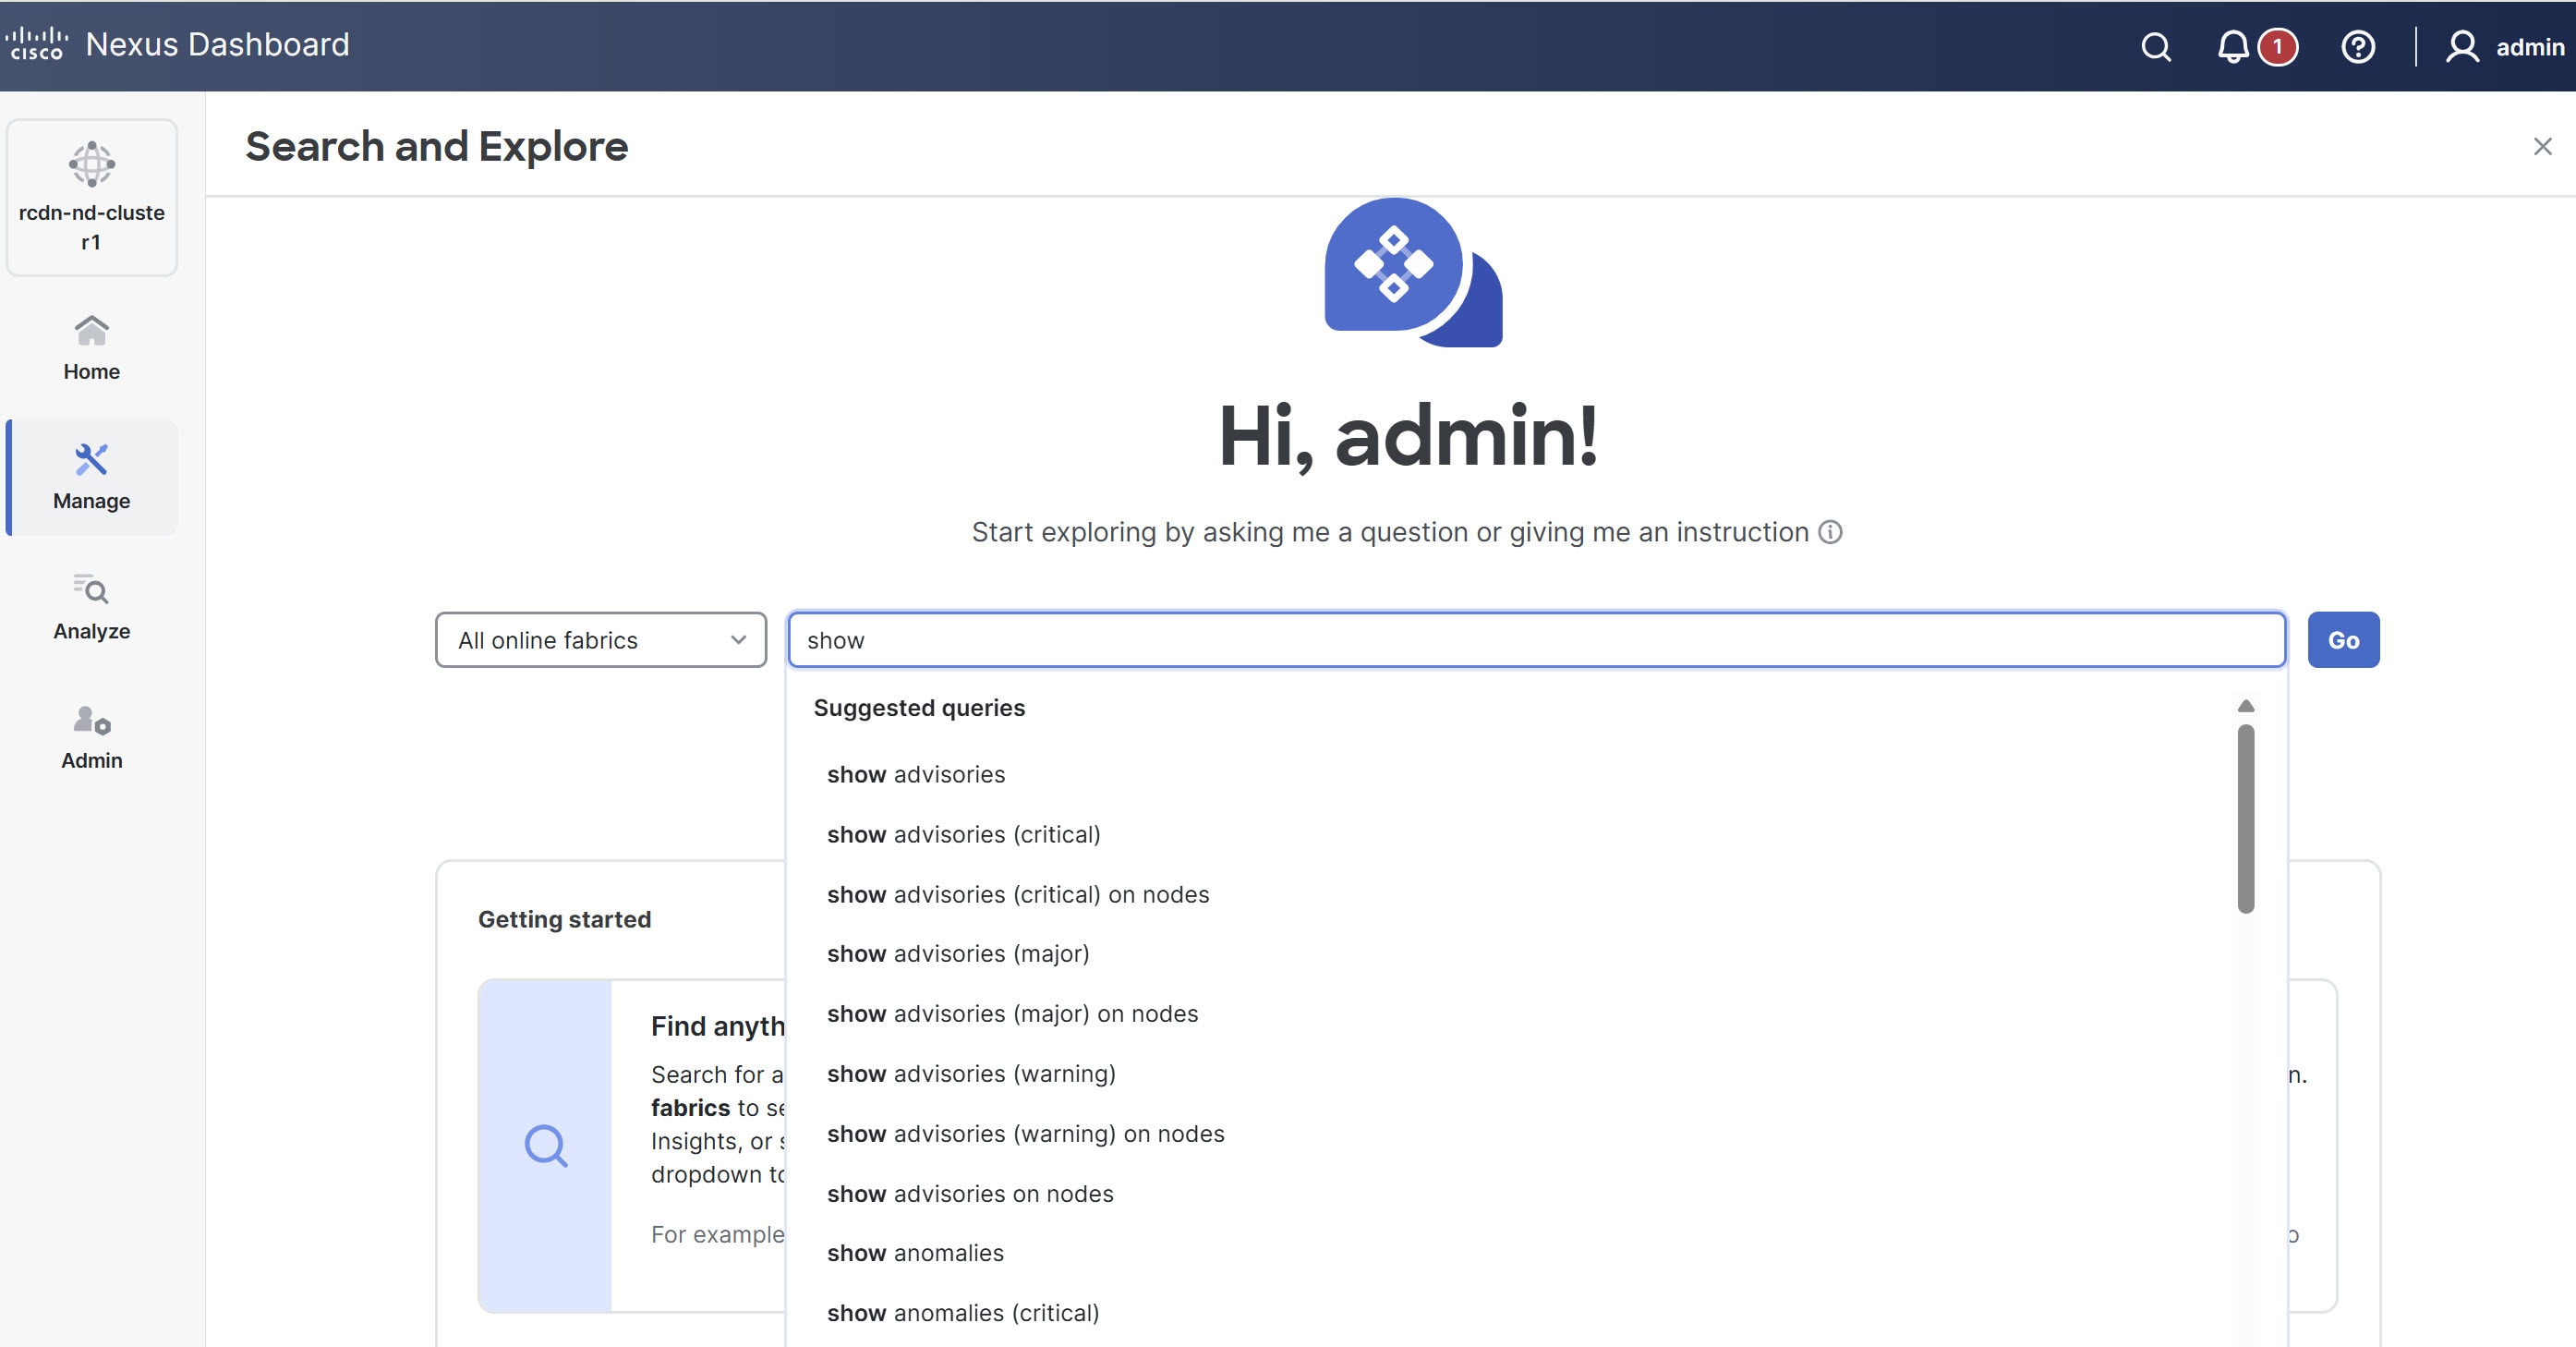
You can perform Show queries on anomalies, advisories, switches, controllers, endpoints, interfaces, flows and more.
-
To perform a Show query, start typing show. Once you start typing, auto-suggest displays the results.
-
Choose a query from the suggested results and click Go.
-
By default, search results for Active Now are displayed.
-
The Show query results are displayed in the existing Nexus Dashboard page with filters.
-
-
What Queries
-
You can perform a What query to answer the question, What entities are associated with each other? This option is unavailable for multi-fabric queries.
-
To perform a What query, choose a single fabric from the drop-down list and start typing what.
-
Once you start typing, auto-suggest results are displayed.
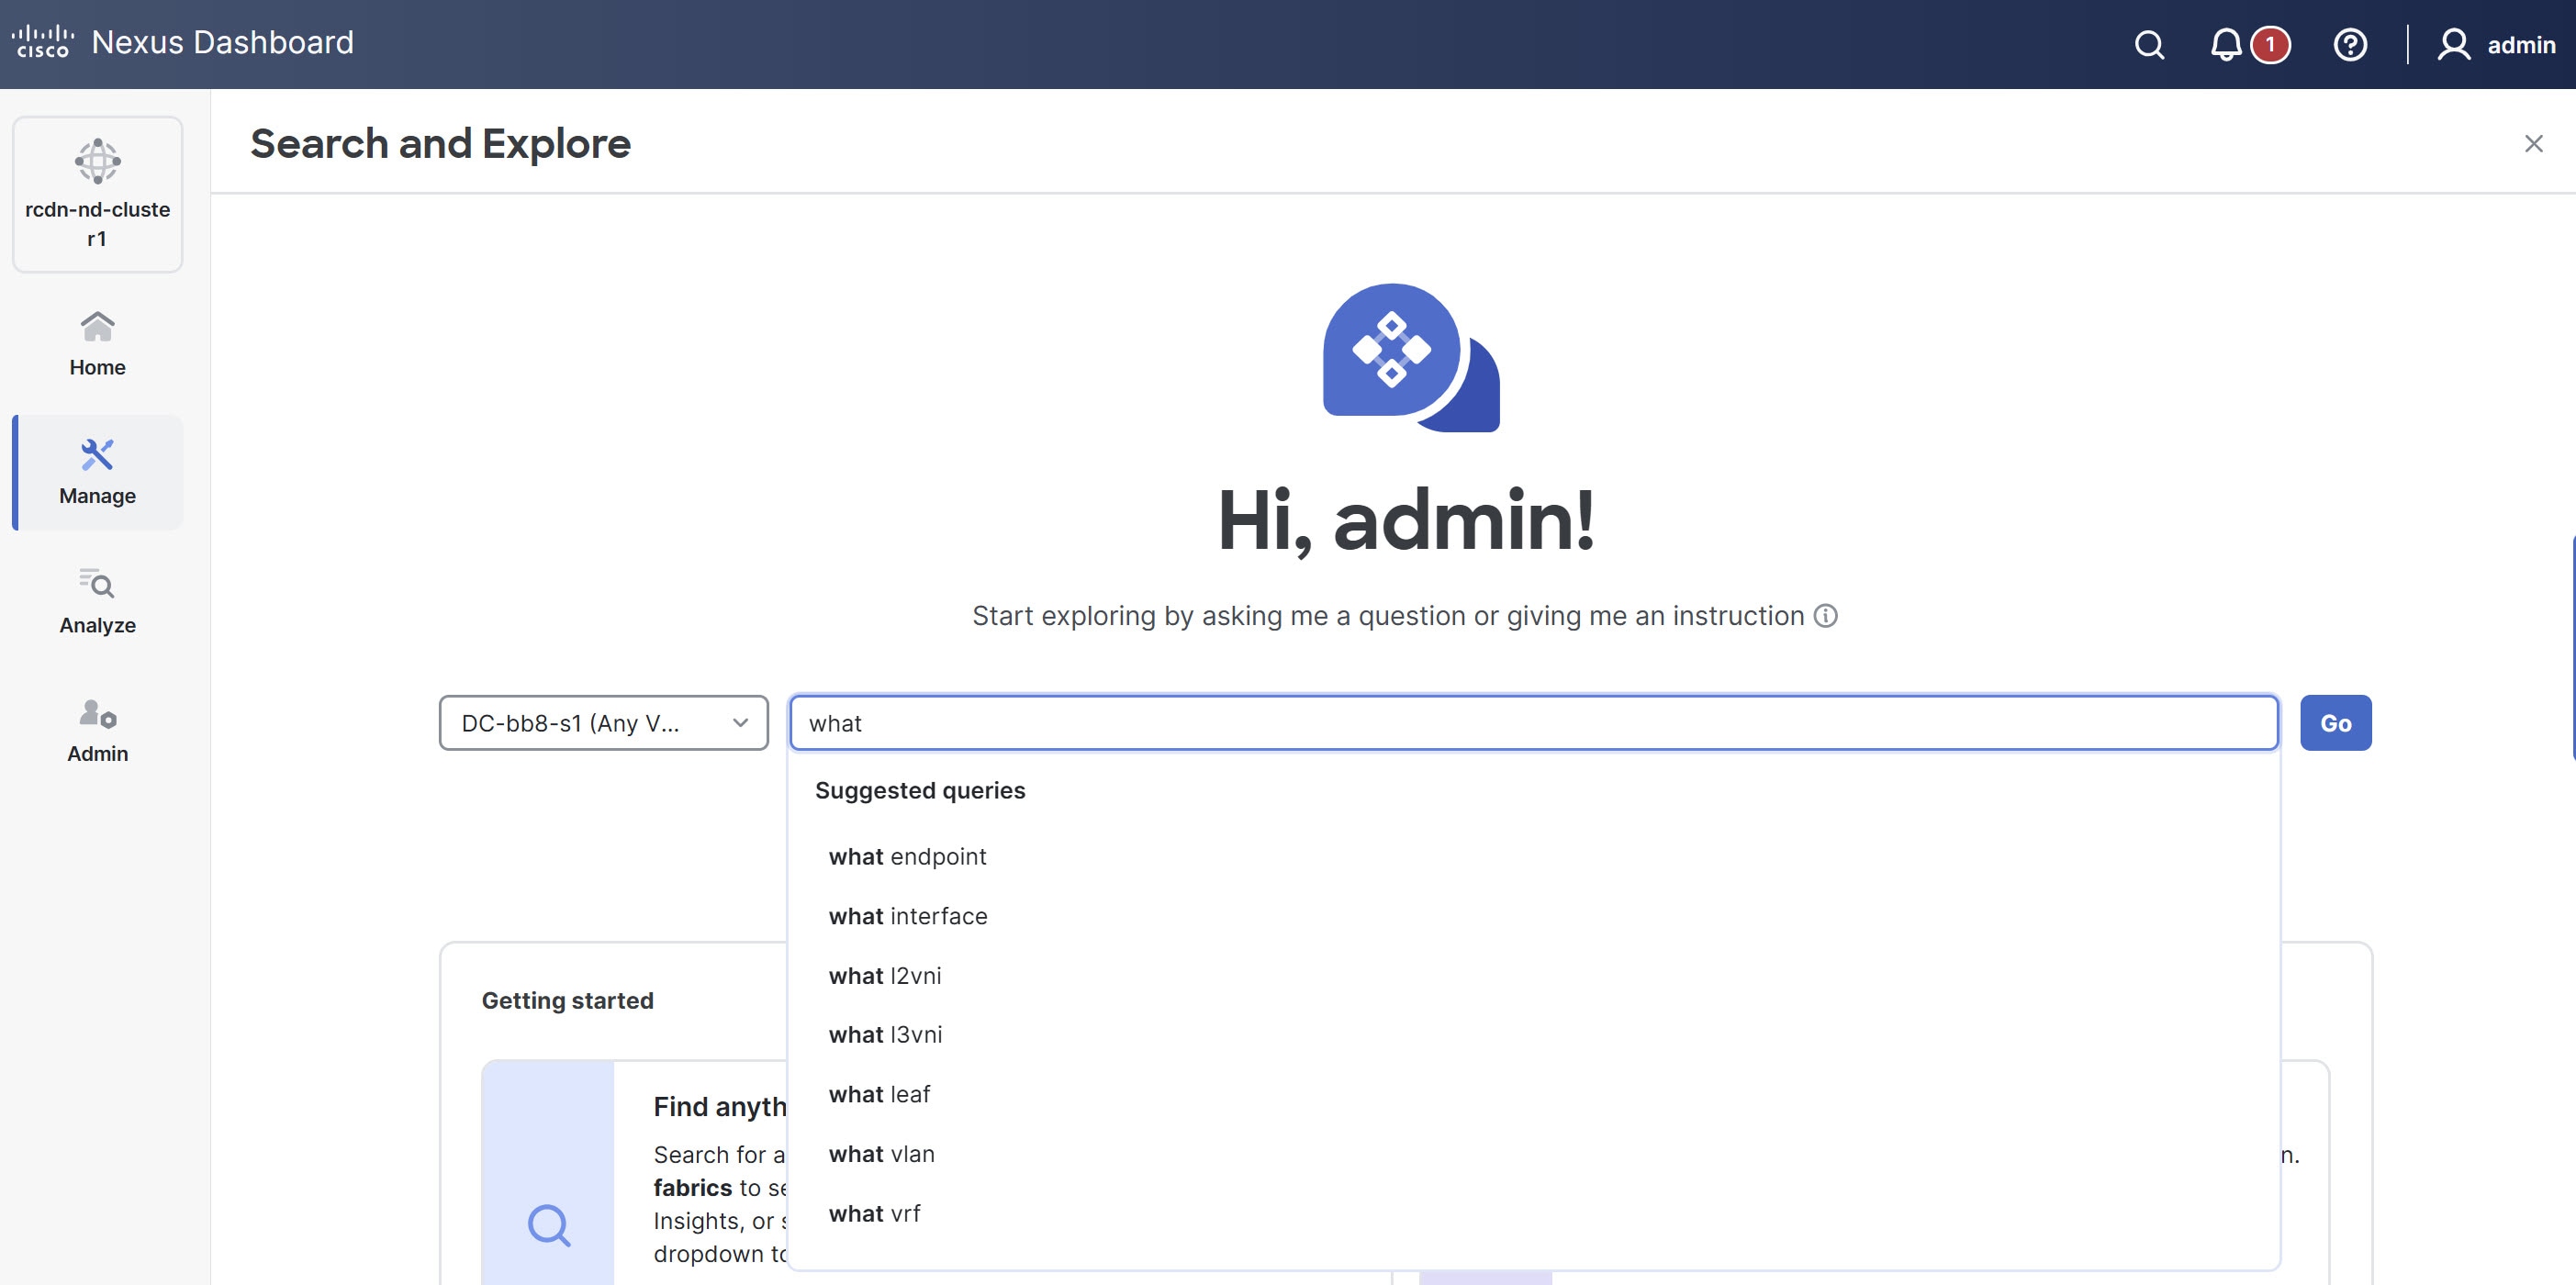
-
Choose a query from the suggested results and click Go.
-
By default, search results for Active Now are displayed. From the Date and Time selector, choose the time range to view results for a specific time.
-
The what query results are displayed in a tabular format.
-
-
Can Queries
-
You can perform a Can query to determine if the entities can communicate with each other and the health of the connectivity.
-
To perform a Can query, choose a single fabric or single ACI fabric from the drop-down list and start typing can.
-
Once you start typing, auto-suggest results are displayed. This includes suggestions for security groups (ESGs and GPOs).
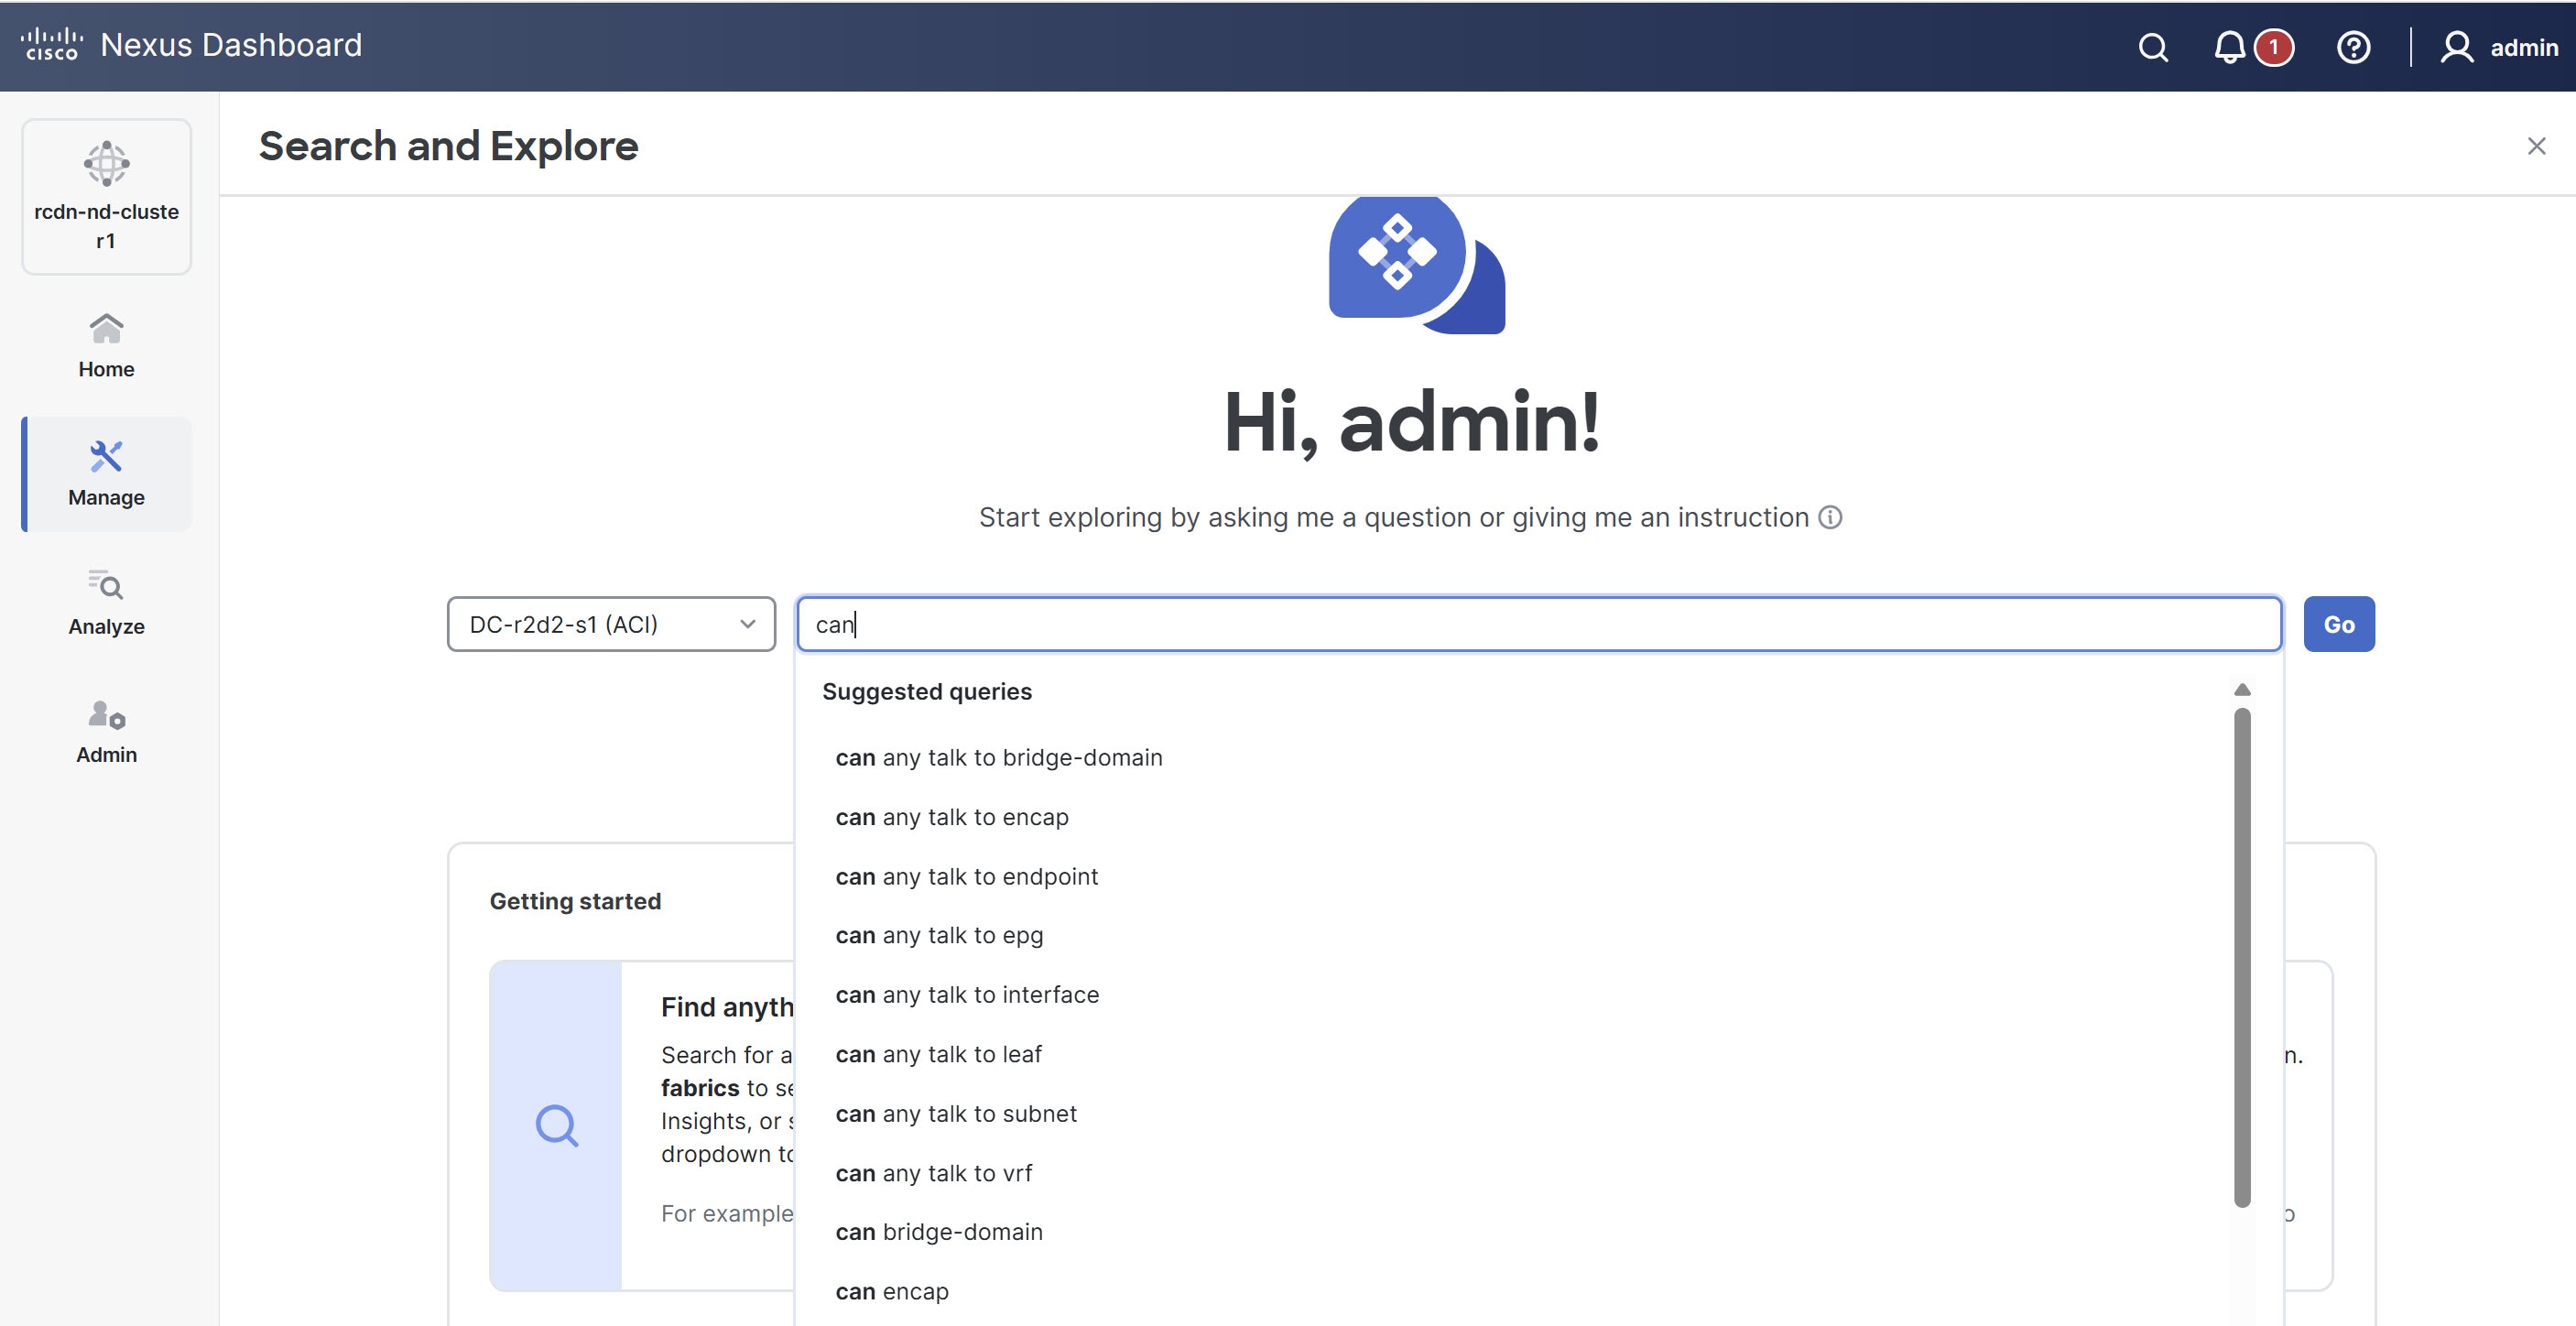
-
Choose a query from the suggested results and click Go.
-
By default, search results for Active Now are displayed. From the Date and Time selector, choose the time range to view results for a specific time.
-
The Can query results are displayed in a graphical format.
-
Click Reverse Query to reverse the source and destination entities for a query.
-
Can query results
The Can query determines if the entities can communicate with each other and the health of the connectivity. The Can query results displays information about if source objects (including security groups) can talk to destination objects (including security groups), which entities can talk to each other, and how do they talk to each other. Can security-group query results display the ESG Selector table. This table describes the matching criteria, such as IP and network selectors, that define the group.
Can source objects talk to destination objects
This displays the flow of the traffic and the connectivity between the entities.
Which entities can talk to each other
The radial view visualizes connectivity and health between security entities (EPGs, ESGs, and security groups) and prefixes. The default radial view displays if EPGs, ESGs, or security groups can communicate and their health. Nexus Dashboard highlights the source entity in light blue and the destination entity in dark blue.
The View filter allows you to display either EPGs or Prefixes. EPGs shows connectivity information between different EPGs as configured in the APIC policy. Prefixes displays connectivity information between prefixes as configured in the APIC policy or learned prefixes. For endpoint-to-endpoint queries that include endpoint security groups (ESGs), the system computes the prefix view using the IP subnet selectors of the ESGs.
You can choose different entities under Type to explore the associations between the different objects such EPGs, prefixes, tenants and VRFs. The associations will be displayed in the inner and outer radial bands.
-
If you choose EPGs, Tenants, and Both, the outer ring represents the tenants, the inner ring represents the application profiles, and arced lines in the middle show the health of the contracts.
-
If you choose EPGs, VRFs, and Both, the outer ring represents the VRFs, the inner ring represents the bridge domains, and arced lines in the middle show the health of the contracts.
-
If you choose Prefixes and VRFs, and Both, the outer ring represents the VRFs, the inner ring represents the bridge domains or L3Outs, and arced lines in the middle show the health of the contracts.
Health Status allows you to view the healthy and unhealthy connections between the entities.
How do they talk?
This is where you can view the configuration used for communication between the entities and the health of the connectivity. The possible causes for unhealthy connectivity include security violations, forwarding violations, and endpoint violations. In How do they talk?, the results display under Connectivity Table, Policy Table, Forwarding Table, Endpoints Table, and Anomalies table. These tables now include relevant security group (ESG/GPO) information.
-
Connectivity — Displays the source EPG, destination EPG, source prefix, destination prefix, source VRF and destination VRF between the entities.
-
Policy — Displays the security flows between the source and destination. It lists the source EPG, destination EPG, policy enforcement VRF, policy owner (contract), ether type, protocol, source port from, source port to, destination port from, destination port to, TCP rules and rule action. For a non PBR contract, it displays one rule while for a PBR enabled rule, it displays two.
-
Forwarding — Displays the prefix table between the source and destination. You can click Subnet/Route to see information regarding the prefixes.
When you create a PBR, you can configure a BD for the provider/consumer connector of the service node, which allows us to see the service BD and the service BD subnet in addition to the consumer and provider BD information.
-
Endpoints — Displays the endpoint details of the source and destination. For a PBR enabled rule, an additional EPG (service EPG) will be listed with the EPG column and BD column populated.
-
Anomalies — Lists all the anomalies generated from the query. You can click the anomaly to determine the objects in your fabric that are affected by the issue. Pass or fail checks are performed on the anomaly and the suggested steps to resolve the issue are displayed.
Understand security group query results
When viewing results for security group-related queries, consider the following:
-
Enrichment in different modes: In Flow Telemetry (FT) and Traffic Analytics (TA) full mode, ESG/GPO names stream directly from the switch and display. In TA compact and FT Netflow modes, ESG/GPO enrichment happens from endpoint data.
-
Ingress-only enrichment in Netflow: In Netflow mode, only ingress traffic information is enriched with security group details. Egress information for security groups is not available.
-
EPG and ESG name display: For known endpoints, both the EPG name and the security group names are displayed. For external endpoints, primarily the security group name is available.* Security group selectors allow you to define which endpoints or network elements belong to a specific security group. The available selectors depend on the fabric architecture.
-
Cisco ACI Endpoint Security Groups (ESGs) support the following selectors:
-
fvTagSelector
-
fvEPSelector
-
fvEPgSelector
-
-
The table describes the Cisco NX-OS security group selectors and switch managed objects (MOs).
Selector Switch managed objects connectedEndpoint
esgMatchConnectedEpV4, esgMatchConnectedEpV6
externalSubnet
esgMatchExternalSubnetV4, esgMatchExternalSubnetV6
network
esgMatchVlan
networkPort
esgMatchVlanInterface
-
Policy-based redirect support for Search and Explore
Beginning with Nexus Dashboard release 4.1.1, How do they talk? supports enhanced functionality for PBR-enabled contracts.
-
In the permit rule, there is only a direct contract, so there is no PBR. Since no PBR, the columns such as service graph, are hidden and not available in Table configuration options.
-
In the redirect rule, the policy table displays the columns such as service graph instance, redirect IP address, and redirect device information. Additionally, the graph has been enhanced to include the PBR node.
In addition, a Can EPG_A talk to EPG_B query is enhanced for a PBR-enabled contract.
On the Query Results page, you can view this information for a PBR-enabled contract.
-
The Policy table displays the redirect rule from
EPG_A to EPG_Band the permit rule from serviceEPG to EPG_B. -
The Forwarding table also displays subnets from a service EPG.
-
The Endpoint table displays endpoints from a service EPG.
In addition, you can query a service EPG as a regular EPG.
Examples:
-
Can serviceEPG_name talk to regularEPG_name
-
What endpoints are associated with serviceEPG_name
Search and Explore for Orchestration-enabled fabric
The Search and Explore feature in Nexus Dashboard allows network operators to discover assets and their object associations in an easy-to-consume natural language query format. Explore workflows currently support a Can EPG talk to EPG query where the query must include two distinct Orchestration-policy entities to view their connectivity. With Nexus Dashboard 4.2.1, this extends to include Can security-group to talk to security-group queries for ESGs and GPOs across fabrics.
For multi-fabric Can security-group to talk to security-group queries, additional filtering based on protocols and ports is currently not supported.
After you run assurance analyses against the fabrics in your deployment, you will be able to navigate associations between EPGs, explore EPG to EPG communication, and enable visibility and troubleshooting across fabrics.
Explore provides you with EPG details from your programmed templates or schemas. You can view which EPG entities can communicate. The entities stretch across the fabrics. If there are anomalies raised in these connections, Search and Explore displays those anomalies here.
Currently, only Can EPG to EPG queries are supported for Orchestration assurance. What queries are not supported. For Can EPG to EPG queries, additional filtering based on protocols and port is not supported.
Examples:
-
This is an example of a query that is supported.
Can EPG: uni/tn-secure/ap-AP0/epg-B talk to EPG: uni/tn-secure/ap-AP0/epg-A
-
This is an example of a query that is not supported.
Can EPG: uni/tn-secure/ap-AP0/epg-B talk to EPG: uni/tn-secure/ap-AP0/epg-A on tcp dport: 80
You can choose from the auto-suggested query list of all EPGs within Orchestration-enabled fabrics. You can access Can query results as an aggregated view across all fabrics within Orchestration-enabled fabrics and not per ACI fabric. All queries are across-fabric queries, and the maximum severity of assets and associations across all fabrics is shown in the results.
Guidelines and limitations for Orchestration-enabled fabric
-
After running your query, when you view the Connectivity Table and the Policy Table, in the Source EPG and Destination EPG columns, a shadow tag to an EPG displays if the EPG is a shadow in the corresponding fabric. For example, epgname(shadow). If an EPG is not a shadow, there will be no shadow tag after the EPG name. However, if you have a version of APIC/Orchestration that does not have the shadow annotation, the shadow tag does not display even for shadow EPGs.
-
In the Endpoints, Forwarding, and the Policy tables, you can click a fabric for specific anomaly details.
-
The Anomalies table displays individual, aggregated, or inter-fabric anomalies based on the queries that you have chosen.
-
Multi-fabric Can queries for ESG/GPO: While Can EPG to EPG queries are supported for Orchestration assurance across multiple ACI fabrics, additional filtering based on protocols and ports is currently not supported for these multi-fabric queries.
Create a Can query in an Orchestration-enabled fabric for inter-fabric connectivity
You must complete running assurance analyses against the fabrics in your Orchestration deployment.
Follow these steps to create a Can query in an Orchestration-enabled fabric for inter-fabric connectivity.
-
Click Search and Explore.
-
To perform a Can query, choose an Orchestration fabric from the drop-down list and start typing can.
-
Once you start typing, Search and Explore displays auto-suggest results. Choose a query from the suggested results and click Go. This includes queries involving security groups (ESGs and GPOs).
-
By default, search results for Active Now are displayed. From the Date and Time selector, choose the time range to view results for a specific time.
-
The can query results are displayed in a graphical format. In the Can source talk to destination area, you can confirm whether a source can talk to a destination.
-
Click Reverse Query to reverse the source and destination entities for a query.
-
In the Which entities Can Talk? area, under View Control, click EPGs to view the communication between the EPGs. The EPG view displays connectivity information between different EPGs.
-
Click the appropriate arrow inside the radial to view further details on the page.
-
In the How do they talk? area, view how the entities communicate with one another.
Can query results
For a Can query, the results are displayed in a radial format in the Which entities can talk area.
The results display if the queried EPGs can communicate with one another. The color of the arrow represents the maximum severity for the connection. If the query results are large, Nexus Dashboard displays the message 'The query returned too much data to display`.
Choose a single resource from the Would you like to check connectivity of a single resource drop-down list to create a specific query. When you click a specific connection in the radial view, you can view the details for the connection in the tables that follow.
You can see the policy that is programmed as part of the EPG. You can verify the prefixes that are part of the connection. You can also view which endpoints are affected because of this communication.
For Orchestration Inter-Fabric Assurance Explore, the Policy, Forwarding, and Endpoints tables display an additional Fabrics column. Nexus Dashboard displays the connectivity information for each fabric that is part of your query. For each of these fabrics, if there are any anomalies that are generated, you can view them here. For example, as a part of the endpoints, if there is a Major anomaly, you can click to choose the anomaly and click Analyze to view the details for the anomaly.
Nexus Dashboard displays the inter-fabric details in the Orchestration context. You can learn what is being programmed by Orchestration across multiple fabrics and you can verify the query and check the communication between different EPGs. The inter-fabric view displays any Orchestration-enabled fabric anomalies.
Configure multi-fabric traffic path tracing and flows correlation
Monitor flows from different fabrics in a single view
To monitor flows, you can stitch together flows from across two different fabrics into one single view. This enables you to have end-to-end views for the paths and end-to-end details for the particular flow with latency information for that flow.
When two sites use different tenants, VRFs, and EPGs, the destination switch processes and exports only the outer packet header for inter-site flows. In VXLAN environments, this means the inner packet header is unavailable for telemetry. Consequently, Nexus Dashboard may display incomplete details for inter-tenant or shadow VRF traffic as this is a limitation and the inner header information for these flows will not appear.
Use cases for multi-fabric traffic path tracing and flows correlation
-
You can correlate flows across fabrics and display flow details with stitched paths.
-
You can monitor flows across fabrics and generate inter-fabric anomalies that are trigger based.
-
You can monitor flows across fabrics and view the end-to-end latency for ACI fabrics.
Configure multi-fabric traffic path tracing and flows correlation
You must have enabled telemetry with the appropriate license tier before configuring the multi-fabric traffic path tracing and flows correlation feature. For more information on how to enable telemetry, see Creating Fabrics and Fabric Groups. For more information on configuring licensing, see Configuring Licensing.
Flow telemetry mode supports multi-fabric traffic path tracing and flow correlation. Traffic analytics mode does not support these features.
On the Search and Explore page, you can view the flow path between two ports, their IP addresses, and their VRFs.
Follow these steps to configure multi-fabric traffic path tracing and flows correlation.
-
Navigate to the Search and Explore page. For more information, see Perform a Search and Explore operation.
-
On the Search and Explore page for All online fabrics, enter a query starting with show flows from that includes the source IP address, port number, destination IP address, and destination port number to view the flow path.
Example:
show flows from ip ip-address and port port-number to ip ip-address and port port-number
-
Click Go.
-
In the Query Results > Current drop-down list for Time Selection, choose Date and Time Range and specify a date and time range.
Time Selection has a 15-minute maximum time limit for multi-fabric queries. By default, Nexus Dashboard uses 15 minutes as the time selection. You can view older flows in the past seven days, but the 15-minute restriction still applies.
-
Click Apply.
If Nexus Dashboard finds the queried flow in multiple fabrics, you can pick and choose the source and destination fabric to view the flow information and path.
The Query results area displays the chosen date and time stamp for your query.
Nexus Dashboard search and explore functionality finds and returns all the fabrics where this flow was discovered for the specified IP address in the All returned flows area.
-
In the All returned flows area, choose the appropriate source and destination fabrics to view their aggregated information, flow path summary, flow details, aggregated flow records for each fabric, and anomalies.
-
You must specify which fabric you want as your source and which fabric you want as your destination. Nexus Dashboard stitches the information based on your input. You can only choose one source and one destination at a time to stitch together this information. Based upon your selection of source and destination fabrics, Nexus Dashboard returns the names of the fabrics that it finds.
In the Flow Path Summary area, Nexus Dashboard displays details for the two fabrics as a graphical flow path that displays the end-to-end information, from source to destination. You can see the first fabric with the endpoint and a set of nodes and how it is connected to the second fabric with the second set of nodes followed by the endpoint. The graphical representation also identifies the firewall in the path if a firewall is present. The graph also captures the end-to-end flow path network latency.
When you select source and destination sites for multi-fabric flows, Nexus Dashboard Insights uses Endpoint (EP) and Time-to-Live (TTL) checks to determine the displayed path. However, for Layer 2 and Layer 3 Outside (L3Out) flows, these checks may not function as expected due to limitations. This can result in incorrect or misleading flow path visualizations.
Nexus Dashboard displays specific details for the source and the destination fabrics in each of the flows tables.
On the destination fabric, if egress traffic passes through a sub-interface on a Virtual Interface (VIF), the system exports only the parent interface ID, not the sub-interface ID. As a result, sub-interface level details do not appear in flow reporting within Nexus Dashboard Insights, leading to less granular information.
-
In the Anomalies table, choose Grouped to view the grouped anomalies for your selected flows.
Copyright
THE SPECIFICATIONS AND INFORMATION REGARDING THE PRODUCTS IN THIS MANUAL ARE SUBJECT TO CHANGE WITHOUT NOTICE. ALL STATEMENTS, INFORMATION, AND RECOMMENDATIONS IN THIS MANUAL ARE BELIEVED TO BE ACCURATE BUT ARE PRESENTED WITHOUT WARRANTY OF ANY KIND, EXPRESS OR IMPLIED. USERS MUST TAKE FULL RESPONSIBILITY FOR THEIR APPLICATION OF ANY PRODUCTS.
THE SOFTWARE LICENSE AND LIMITED WARRANTY FOR THE ACCOMPANYING PRODUCT ARE SET FORTH IN THE INFORMATION PACKET THAT SHIPPED WITH THE PRODUCT AND ARE INCORPORATED HEREIN BY THIS REFERENCE. IF YOU ARE UNABLE TO LOCATE THE SOFTWARE LICENSE OR LIMITED WARRANTY, CONTACT YOUR CISCO REPRESENTATIVE FOR A COPY.
The Cisco implementation of TCP header compression is an adaptation of a program developed by the University of California, Berkeley (UCB) as part of UCB’s public domain version of the UNIX operating system. All rights reserved. Copyright © 1981, Regents of the University of California.
NOTWITHSTANDING ANY OTHER WARRANTY HEREIN, ALL DOCUMENT FILES AND SOFTWARE OF THESE SUPPLIERS ARE PROVIDED “AS IS" WITH ALL FAULTS. CISCO AND THE ABOVE-NAMED SUPPLIERS DISCLAIM ALL WARRANTIES, EXPRESSED OR IMPLIED, INCLUDING, WITHOUT LIMITATION, THOSE OF MERCHANTABILITY, FITNESS FOR A PARTICULAR PURPOSE AND NONINFRINGEMENT OR ARISING FROM A COURSE OF DEALING, USAGE, OR TRADE PRACTICE.
IN NO EVENT SHALL CISCO OR ITS SUPPLIERS BE LIABLE FOR ANY INDIRECT, SPECIAL, CONSEQUENTIAL, OR INCIDENTAL DAMAGES, INCLUDING, WITHOUT LIMITATION, LOST PROFITS OR LOSS OR DAMAGE TO DATA ARISING OUT OF THE USE OR INABILITY TO USE THIS MANUAL, EVEN IF CISCO OR ITS SUPPLIERS HAVE BEEN ADVISED OF THE POSSIBILITY OF SUCH DAMAGES.
Any Internet Protocol (IP) addresses and phone numbers used in this document are not intended to be actual addresses and phone numbers. Any examples, command display output, network topology diagrams, and other figures included in the document are shown for illustrative purposes only. Any use of actual IP addresses or phone numbers in illustrative content is unintentional and coincidental.
The documentation set for this product strives to use bias-free language. For the purposes of this documentation set, bias-free is defined as language that does not imply discrimination based on age, disability, gender, racial identity, ethnic identity, sexual orientation, socioeconomic status, and intersectionality. Exceptions may be present in the documentation due to language that is hardcoded in the user interfaces of the product software, language used based on RFP documentation, or language that is used by a referenced third-party product.
Cisco and the Cisco logo are trademarks or registered trademarks of Cisco and/or its affiliates in the U.S. and other countries. To view a list of Cisco trademarks, go to this URL: https://www.cisco.com/go/trademarks. Third-party trademarks mentioned are the property of their respective owners. The use of the word partner does not imply a partnership relationship between Cisco and any other company. (1110R)
© 2017-2026 Cisco Systems, Inc. All rights reserved.
Americas Headquarters
Cisco Systems, Inc.
170 West Tasman Drive
San Jose, CA 95134-1706
USA
https://www.cisco.com
Tel: 408 526-4000
800 553-NETS (6387)
Fax: 408 527-0883