
Cisco Nexus Hyperfabric — Insights
Insights
The Insights tab in Cisco Nexus Hyperfabric provides
- the ability to view the time series for events such as failed assertions, resolved assertions, software management events, and configuration events for a device
- capacity planning and reporting capabilities for physical and logical devices in your fabrics
- the comparison of two fabric snapshots to identify changes in operational telemetry and assertion states, and
- a history of traffic statistics, data transmission errors, and baseline bandwidth usage.
You can use the capacity planning and reporting capabilities to
- access and review current capacity data of your fabrics, including details such as the numbers of devices and ports, number of Layer 2 and Layer 3 scale such as VRF instances, VLANs, routes, BGP peers, and environmental factors
- plan for scaling, upgrades, or modifications to the fabric design
- benefit from automated guidance on physical changes needed for capacity adjustments, including cabling and hardware modifications, and
- monitor capacity in real-time to maintain operational efficiency and avoid over-provisioning or under-utilization.
Access the event viewer
The event viewer displays the time series for events such as failed assertions, resolved assertions, software management events, and configuration events for a device.
Follow these steps to access the event viewer.
Step 1 | Select Fabrics, then select . |
Step 2 | The Event Viewer area displays the time series for failed assertions, resolved or cleared assertions, software management events, and configuration events. The total count of new and resolved assertions are displayed for each time period. Configuration events are displayed separately as a line graph. From the drop-down list, select the time period, which can be up to 90 days for a custom time period. By default, Last hour is selected. 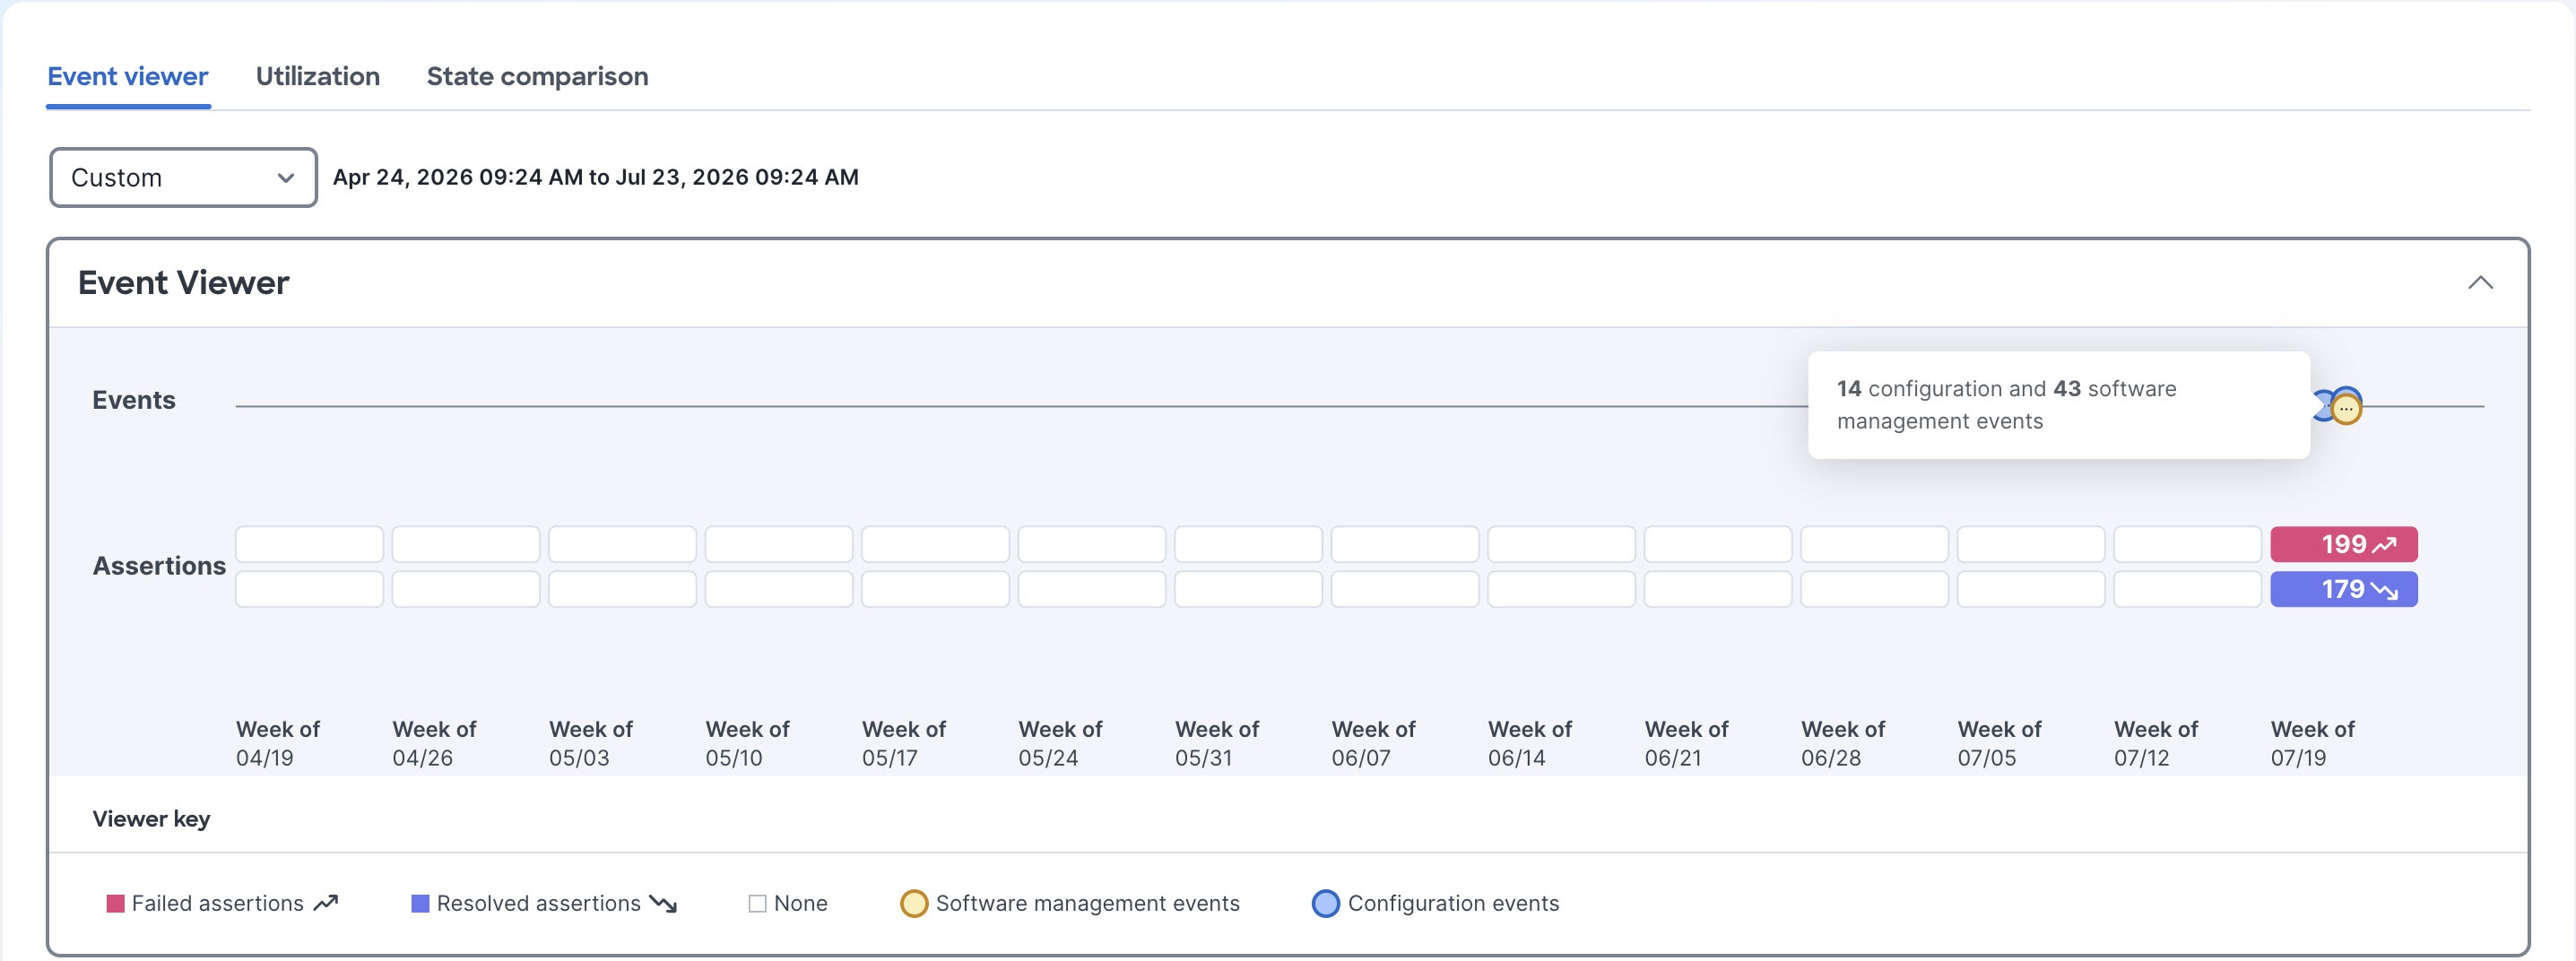
|
Step 3 | Filter the displayed events by selecting specific event or assertion types from the Event Types or Assert Types drop-down lists.  Note NoteA candidate includes comments you enter when you push a configuration and are only applicable for configuration events. |
Step 4 | In the Description column of the assertion table, select Configuration pushed to view additional details. 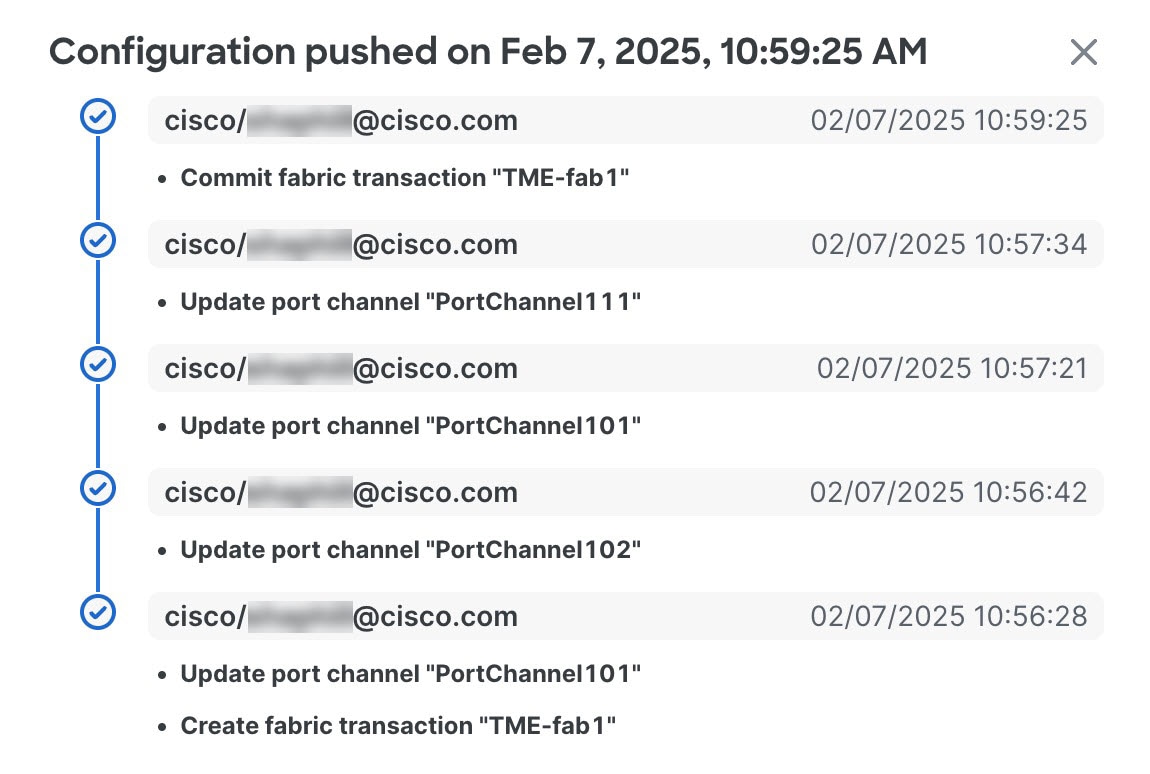
|
Review resource utilization
Follow these steps to review resource utilization.
Step 1 | Choose Fabrics, then select . |
Step 2 | Select Physical or Logical.
See the "i" tooltips for more information about statistics. |
State comparison
State comparison compares two fabric snapshots to identify changes in operational telemetry and assertion states. A snapshot is a capture of the fabric's operational state at a specific time.
Change metric types
When you compare a snapshot against a baseline, the system categorizes these types of changes.
- Added: Elements present in the current snapshot but not in the baseline.
- Removed: Elements present in the baseline but not in the current snapshot.
- Modified: Elements present in both snapshots that have different values or states.
Supported data types
The system compares these two categories of data.
- System states: Operational telemetry, such as device resource usage and management port configurations.
- Assertions: Health and configuration rules, such as port link status, device temperature, and port speed consistency.
Create and promote a baseline snapshot state
Establish a baseline state to monitor your fabric's operational health. Capturing a snapshot when the network is functioning as intended provides an anchor for comparing future states and identifying drift.
Step 1 | Navigate to the State comparison tool.
|
Step 2 | If a current snapshot exists, you can
|
Step 3 | Select Capture to record the current fabric operational state. The date and time of the snapshot appears in the Current area. |
Step 4 | Select Promote to set the snapshot as a baseline for future comparisons. The date and time of the snapshot disappears from the Current area and appears in the Baseline area. |
Compare snapshot states
Use this procedure to identify operational deviations in your fabric by comparing the saved baseline state against the current state. Comparing snapshot states helps you troubleshoot instability, verify states after configuration changes, and identify drift from your established baseline.
When network performance degrades or behavior changes, comparing your current operational state against a baseline helps you identify the cause.
Ensure a baseline exists.
Step 1 | Navigate to State comparison.
|
Step 2 | If a snapshot state exists in the Current area, you can
|
Step 3 | In the Current area, select Capture. |
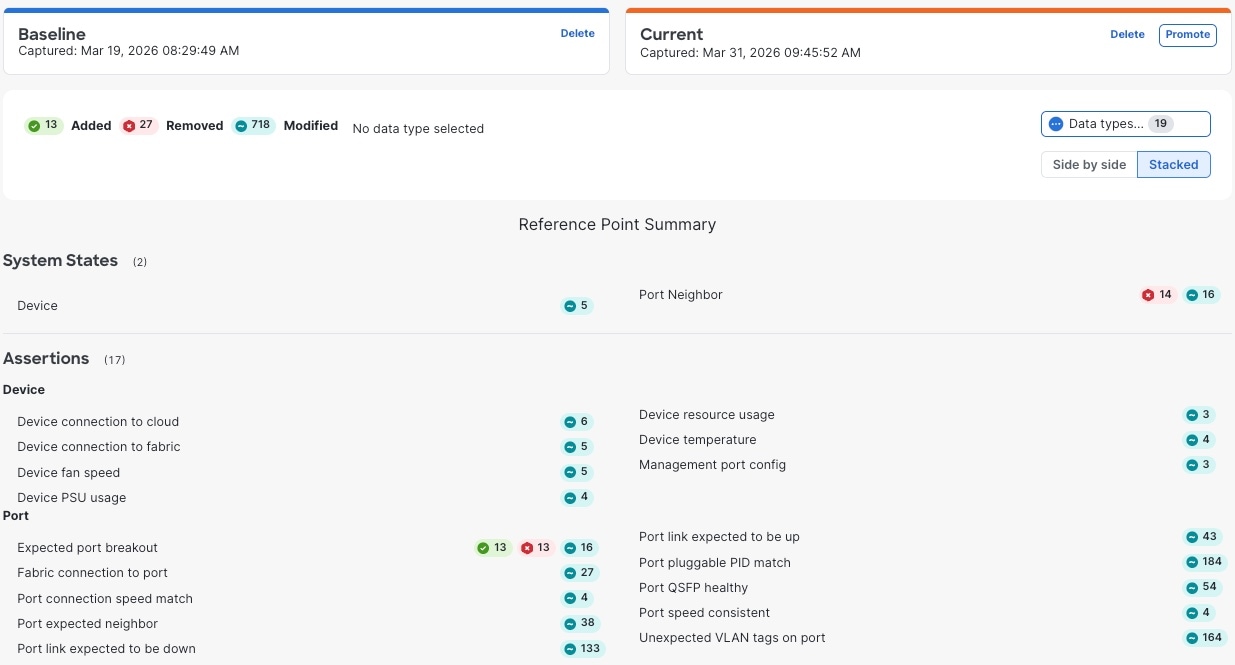
Step 4 | Review the change summary. The system displays a color-coded summary of differences, allowing you to pinpoint system state or assertion-based changes since the baseline was captured. Scroll through the State Comparison Summary to inspect specific changes.
|
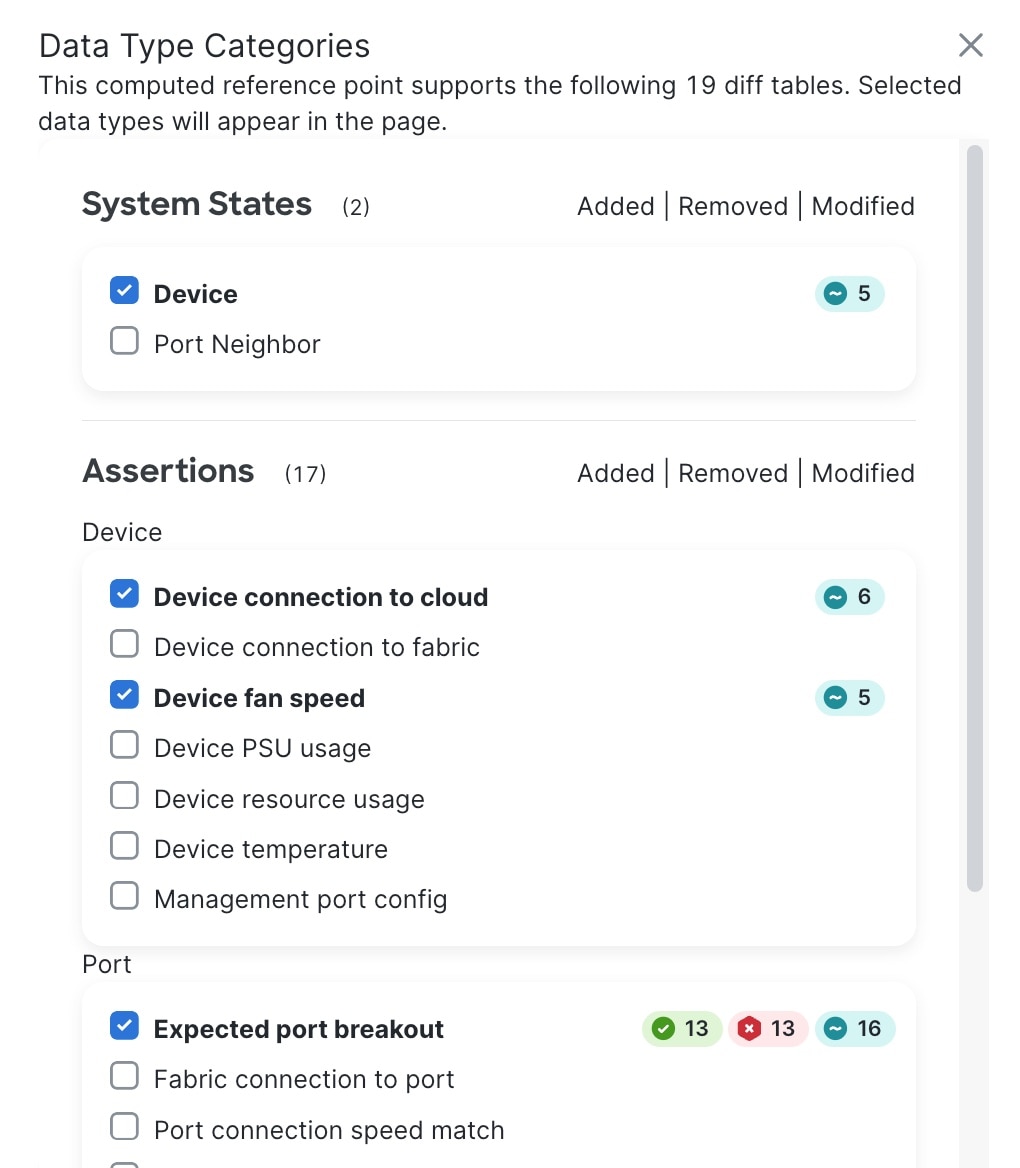
Step 5 | Analyze the detailed differences.
|


Historical dashboards
Nexus Hyperfabric maintains a history of traffic statistics, data transmission errors, and baseline bandwidth usage that you can view from one or more dashboards that you add and configure. This data helps you to monitor performance and baseline bandwidth usage, and troubleshoot connectivity issues.
Add a historical dashboard
To view the historical traffic statistics, data transmission errors, and bandwidth usage, you must add at least one dashboard and add one or more panels to the dashboard.
Follow these steps to add a historical dashboard.
Step 1 | Select Fabrics, then select . |
Step 2 | Select + Add new dashboard. You can add a maximum of 10 dashboards.
|
Step 3 | Select + Add panel. You can add a maximum of 10 panels per dashboard.
|
Access a historical dashboard
Before you begin, create at least one dashboard with at least one panel.
Follow these steps to access a historical dashboard.
Step 1 | Select Fabrics, then select . |
Step 2 | Select a dashboard. |
Step 3 | In the time range drop-down list in the upper right, select the time range that includes the data that you want to review in the panels. In addition to the preset ranges, you can select Custom to select an arbitrary start and end date and time that includes up to 90 days. You can also drag horizontally on a chart to select the custom time range. If you did not select Custom, you can also select the rate at which Nexus Hyperfabric refreshes the data, including disabling automatic refresh. |
Step 4 | (Optional) Hover over a data point to highlight that point's graph line and see more information about that point. |