
Toxic Factor Identification
What is Toxic Factor Identification?
Crosswork AI Toxic Factor Identification is an AI-powered capability designed to improve your network’s reliability and cost efficiency by detecting hidden patterns that may cause network problems. Modern networks combine hardware, operating systems, and configurations to work together smoothly. However, intermittent or soft failures can occur, which are difficult to diagnose because all individual components may appear to be functioning correctly.
The Toxic Factor Identification agent uses intelligent analysis to examine all aspects of your network—including devices, software versions, configurations, and operational data to find combinations that may be causing failures. For example, while your overall network might seem stable, a specific configuration on a particular router running a certain software version could be the root cause of recurring issues. Toxic Factor Identification analyzes large amounts of network events and inventory attributes collected from the Crosswork Network Controller to uncover these hard-to-spot patterns and correlations.
The analysis can be performed over a selected time period and can be focused on a subset of network devices, enabling targeted investigations. It uses advanced algorithms such as the Frequent Pattern Growth (FP-Growth) algorithm to group and identify toxic factor combinations that are statistically associated with network failures.
Toxic Factor Identification results are intended to guide investigation. They identify potential contributing factors based on available data, but do not automatically confirm root cause or prescribe remediation.
Toxic Factor Identification capabilities
-
Comprehensive analysis: Examines hardware, operating systems, configurations, inventory attributes, and operational data across your network after the required data sources are configured.
-
Failure pattern detection: Identifies recurring patterns linked to link down and BGP session down events by analyzing and correlating common factors found across multiple network events.
-
Proactive insights: Provides reports that highlight network events, contributing factors, and the strength of their correlation. These insights help you investigate potential causes and make informed operational decisions.
-
Explainable results: Provides supporting metrics and contextual information for identified factors. The UI includes information icons that help explain supported attributes and result metrics.
-
Periodic scheduling and on-demand analysis: Supports both scheduled and on-demand analysis to detect latent problems before they impact network performance, enabling proactive maintenance.
-
Data-driven decision support: Helps guide hardware and software rollouts by quantifying the impact of specific factors on network reliability, highlighting potential risks.
Supported event types and attributes
Event types
The Toxic Factor Identification agent supports analysis of these event types:
-
Link down: Events where physical or logical network links have failed or flapped, causing interface down conditions.
-
BGP session down: Events involving failures or flaps in Border Gateway Protocol (BGP) sessions between devices.

To include BGP session down events you must create and assign
crosswork-ai-tfddevice tag to each device in Crosswork Network Controller that you want BGP data collected from. Devices without this tag will not have their BGP events analyzed.
Attributes
Attributes are specific device or interface characteristics used to analyze and correlate network events. The supported attributes include:
-
device_name: The identifier of the device involved in the event.
-
device_uuid: The universally unique identifier assigned to the device.
-
device_type: The classification or category of the device.
-
software_type: The type of software running on the device.
-
software_version: The specific version number of the software installed on the device.
-
product_type: The product classification or model of the device.
-
interface_name: The identifier of the specific interface on the device.
-
product_family: The broader family grouping of the product line for the device.
-
zip: The postal code of the device’s physical location.
-
city: The city where the device is physically located.
-
state: The state of the device’s physical location.
-
country: The country where the device is installed.
-
region: The geographic region encompassing the device’s location.
-
neighbor_id: The identifier of the directly connected neighboring device.
-
router_id: The unique identifier assigned to the router within the network.
-
as_number: The Autonomous System (AS) number associated with the device’s network.
Perform Toxic Factor Identification
This section explains how to use the Toxic Factor Identification agent to analyze network events and identify the key factors that significantly influence network stability issues.
Prerequisites
The availability of historical events and device alarms for Toxic Factors analysis depends on the data retained in Crosswork Network Controller. By default, Crosswork Network Controller deletes events after 30 days and active and cleared device alarms after 60 days. When investigating an earlier time period, verify the Crosswork Network Controller cleanup settings and confirm that the required data is still available.
To analyze BGP session down events with Toxic Factor Identification, use the crosswork-ai-tfd tag in Crosswork Network Controller. This tag is automatically created when Crosswork Network Controller is integrated with Crosswork AI by creating a Data Retrieval Adapter (DRA) instance.
Assign the crosswork-ai-tfd tag to all devices for which you want to collect and analyze BGP data events. Devices without this tag will not have their BGP events analyzed.
If the crosswork-ai-tfd tag is not available, verify that the Crosswork Network Controller integration and DRA instance are configured correctly. For more information, see the Getting Started with Cisco Crosswork AI for Crosswork Network Controller guide.
Access Toxic Factor Identification agent
To launch Crosswork AI in Crosswork Network Controller, click the Launch AI Assistant icon  .
.
The Crosswork AI user interface opens.
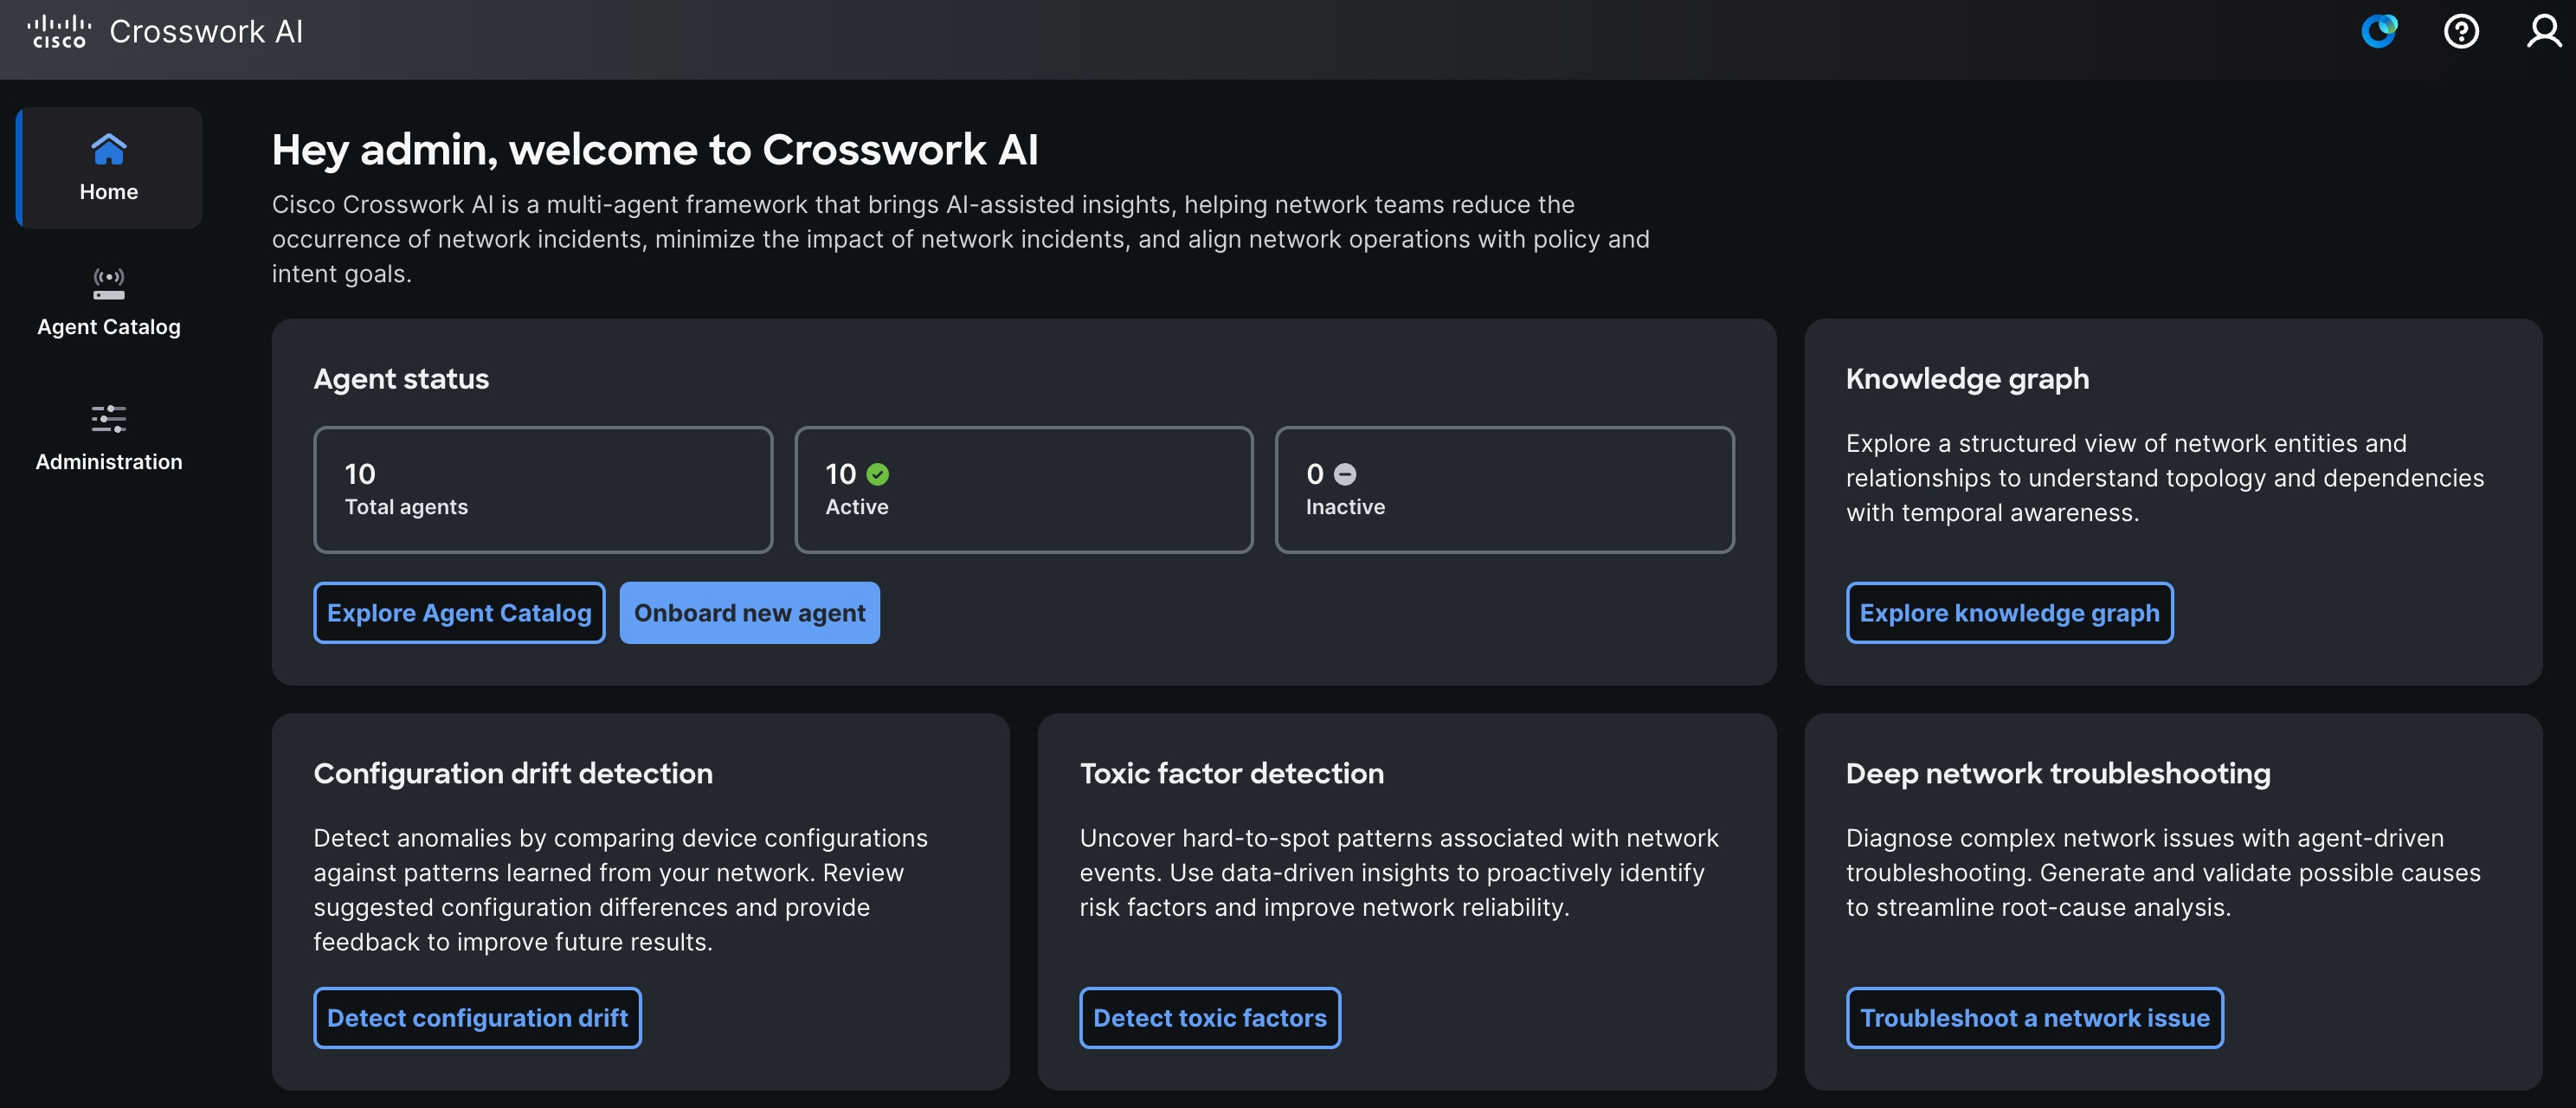
Crosswork AI provides pre-defined suggestion tiles for interacting with the agent. All actions performed through the AI assistant are specific to your user account.
You can access the Toxic Factor Identification agent in one of the following ways:
-
From the Crosswork AI home page, select Detect toxic factors.
-
Click
to open AI Assistant. Select I want to run toxic factor detection, and then click  to send the request.
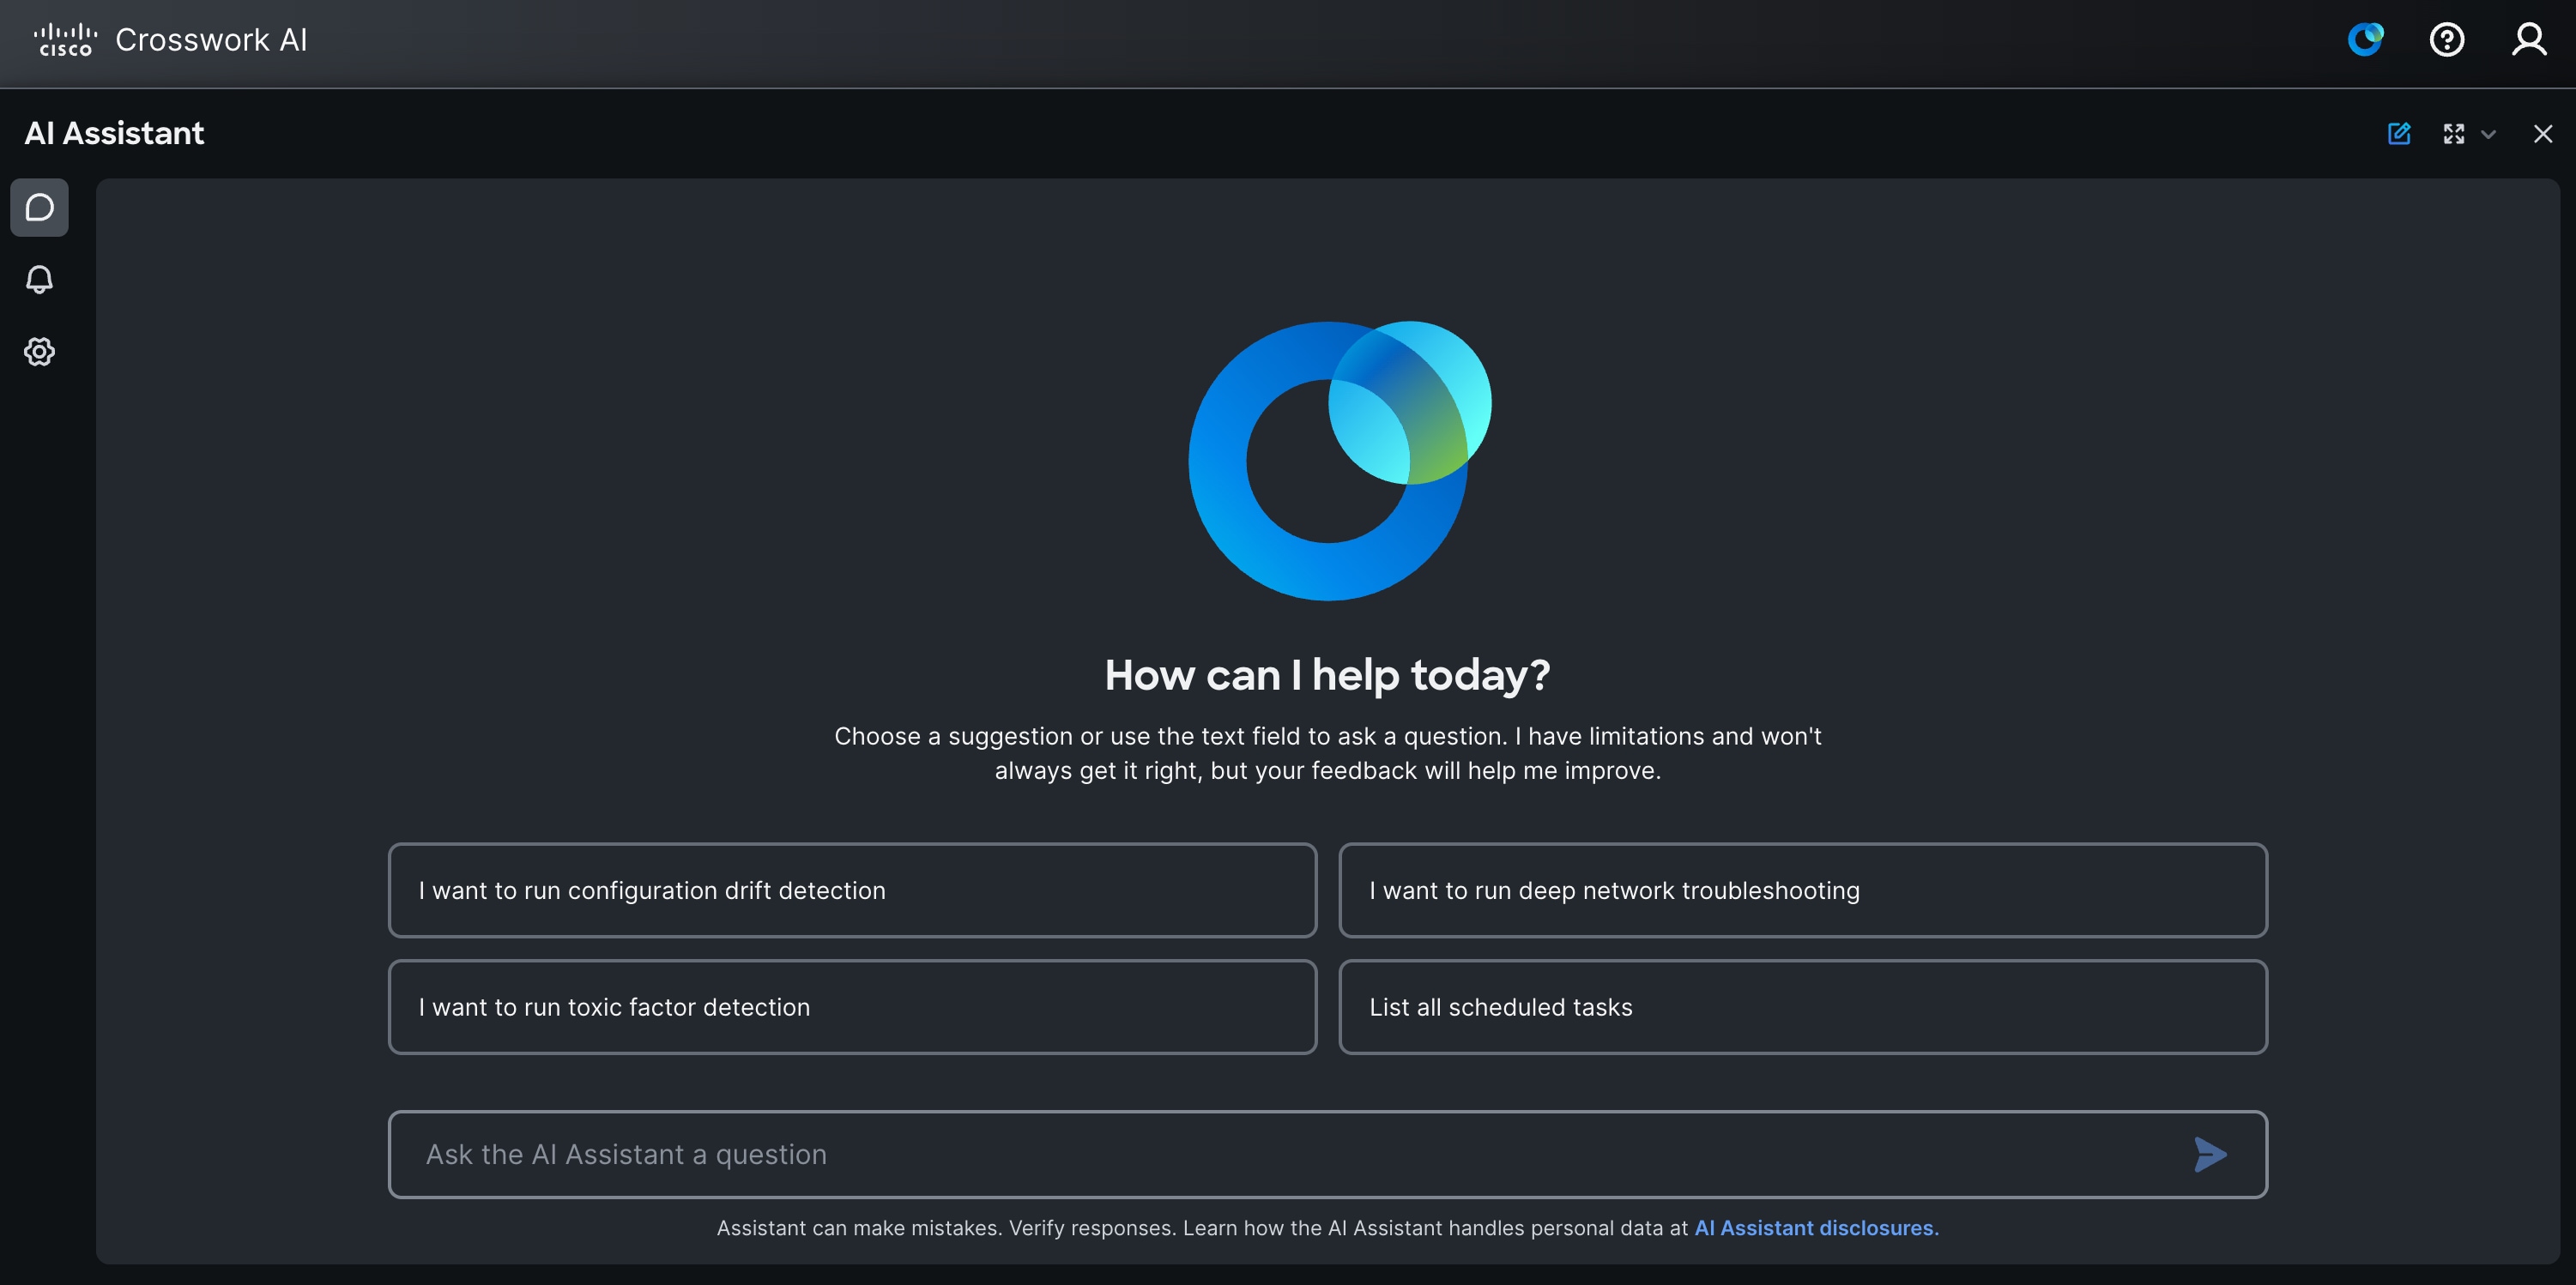 Figure 2. Crosswork AI AI Assistant page
The agent allows you to run analysis tasks either on-demand or by scheduling them to run automatically. When running the agent on-demand, you can choose to analyze the full network or upload a CSV file containing a list of device names. This list must correspond to the device_name attribute; device UUIDs must not be used. Alternatively, you can schedule analysis tasks to run at defined intervals according to your needs and preferences.
Choose the method that best fits your operational workflow.
Run toxic factor on-demand
To analyze network events on-demand, complete these steps:
-
In the Toxic Factor Identification agent, select On-demand.
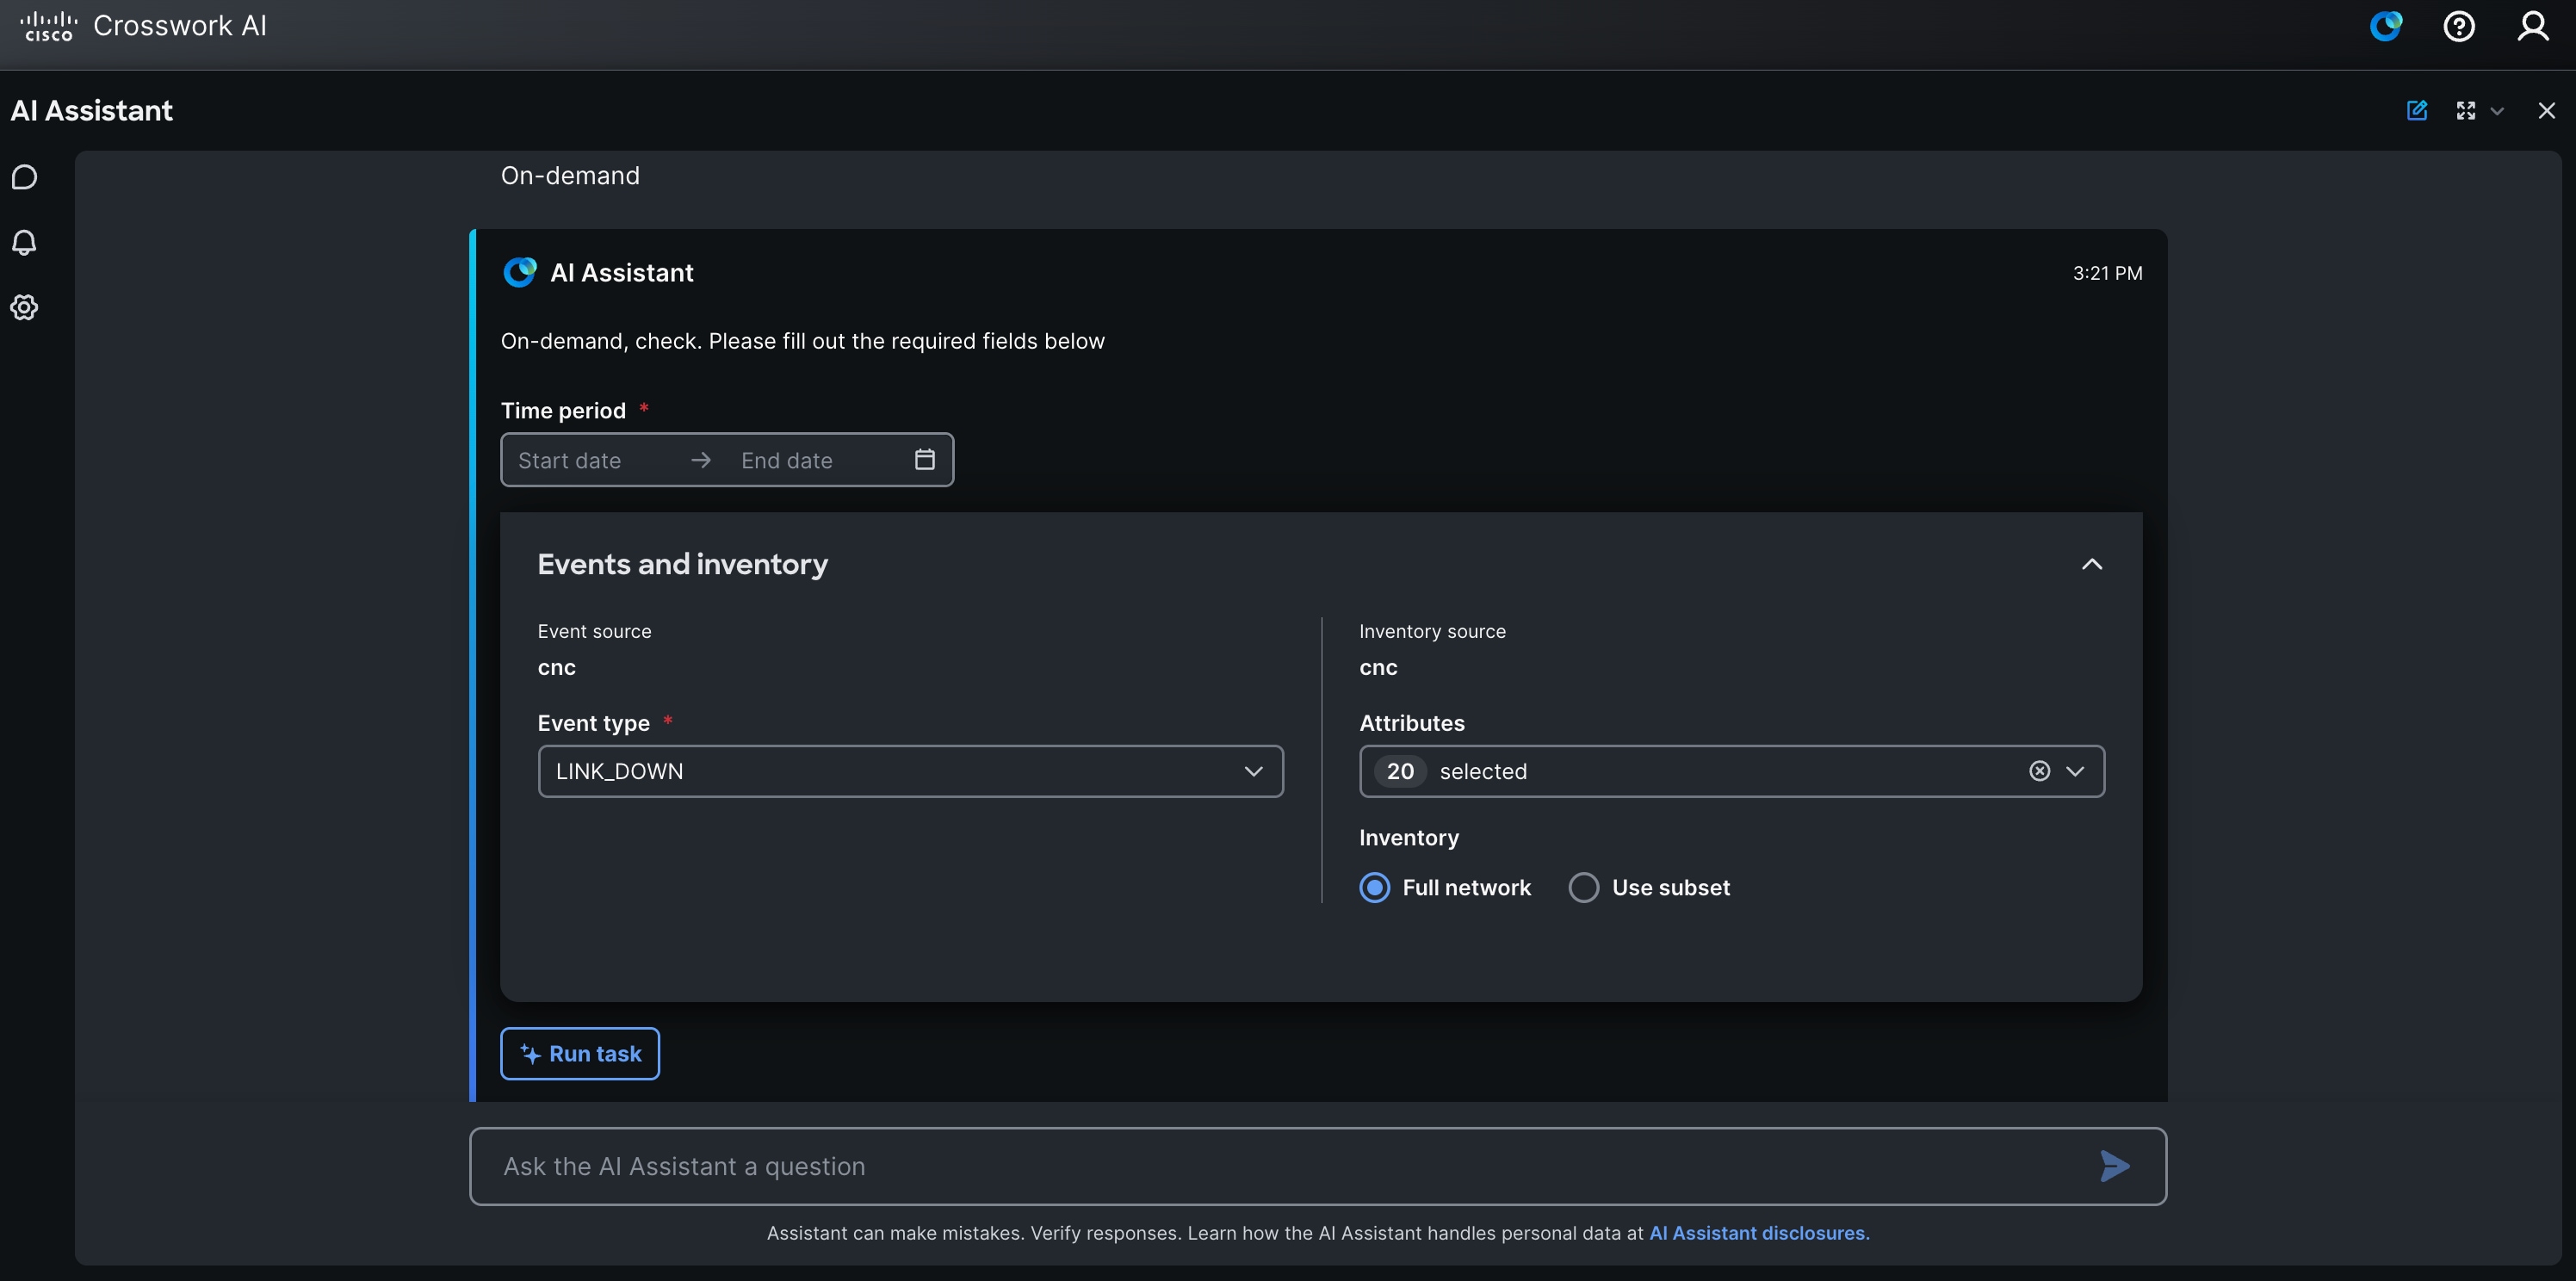 Figure 3. Run toxic factor on-demand
 -
Choose the Time period for the events you want to analyze.
-
From the Event type list, select the event to analyze.
-
From the Attributes list, select the attributes to include in the analysis.
-
Choose whether to analyze the Full network or a subset of devices.
If you choose Use subset, click Upload files to upload a CSV file containing device names, one device per row. This list must correspond to the
device_nameattribute; device UUIDs must not be used. -
Select Run task.
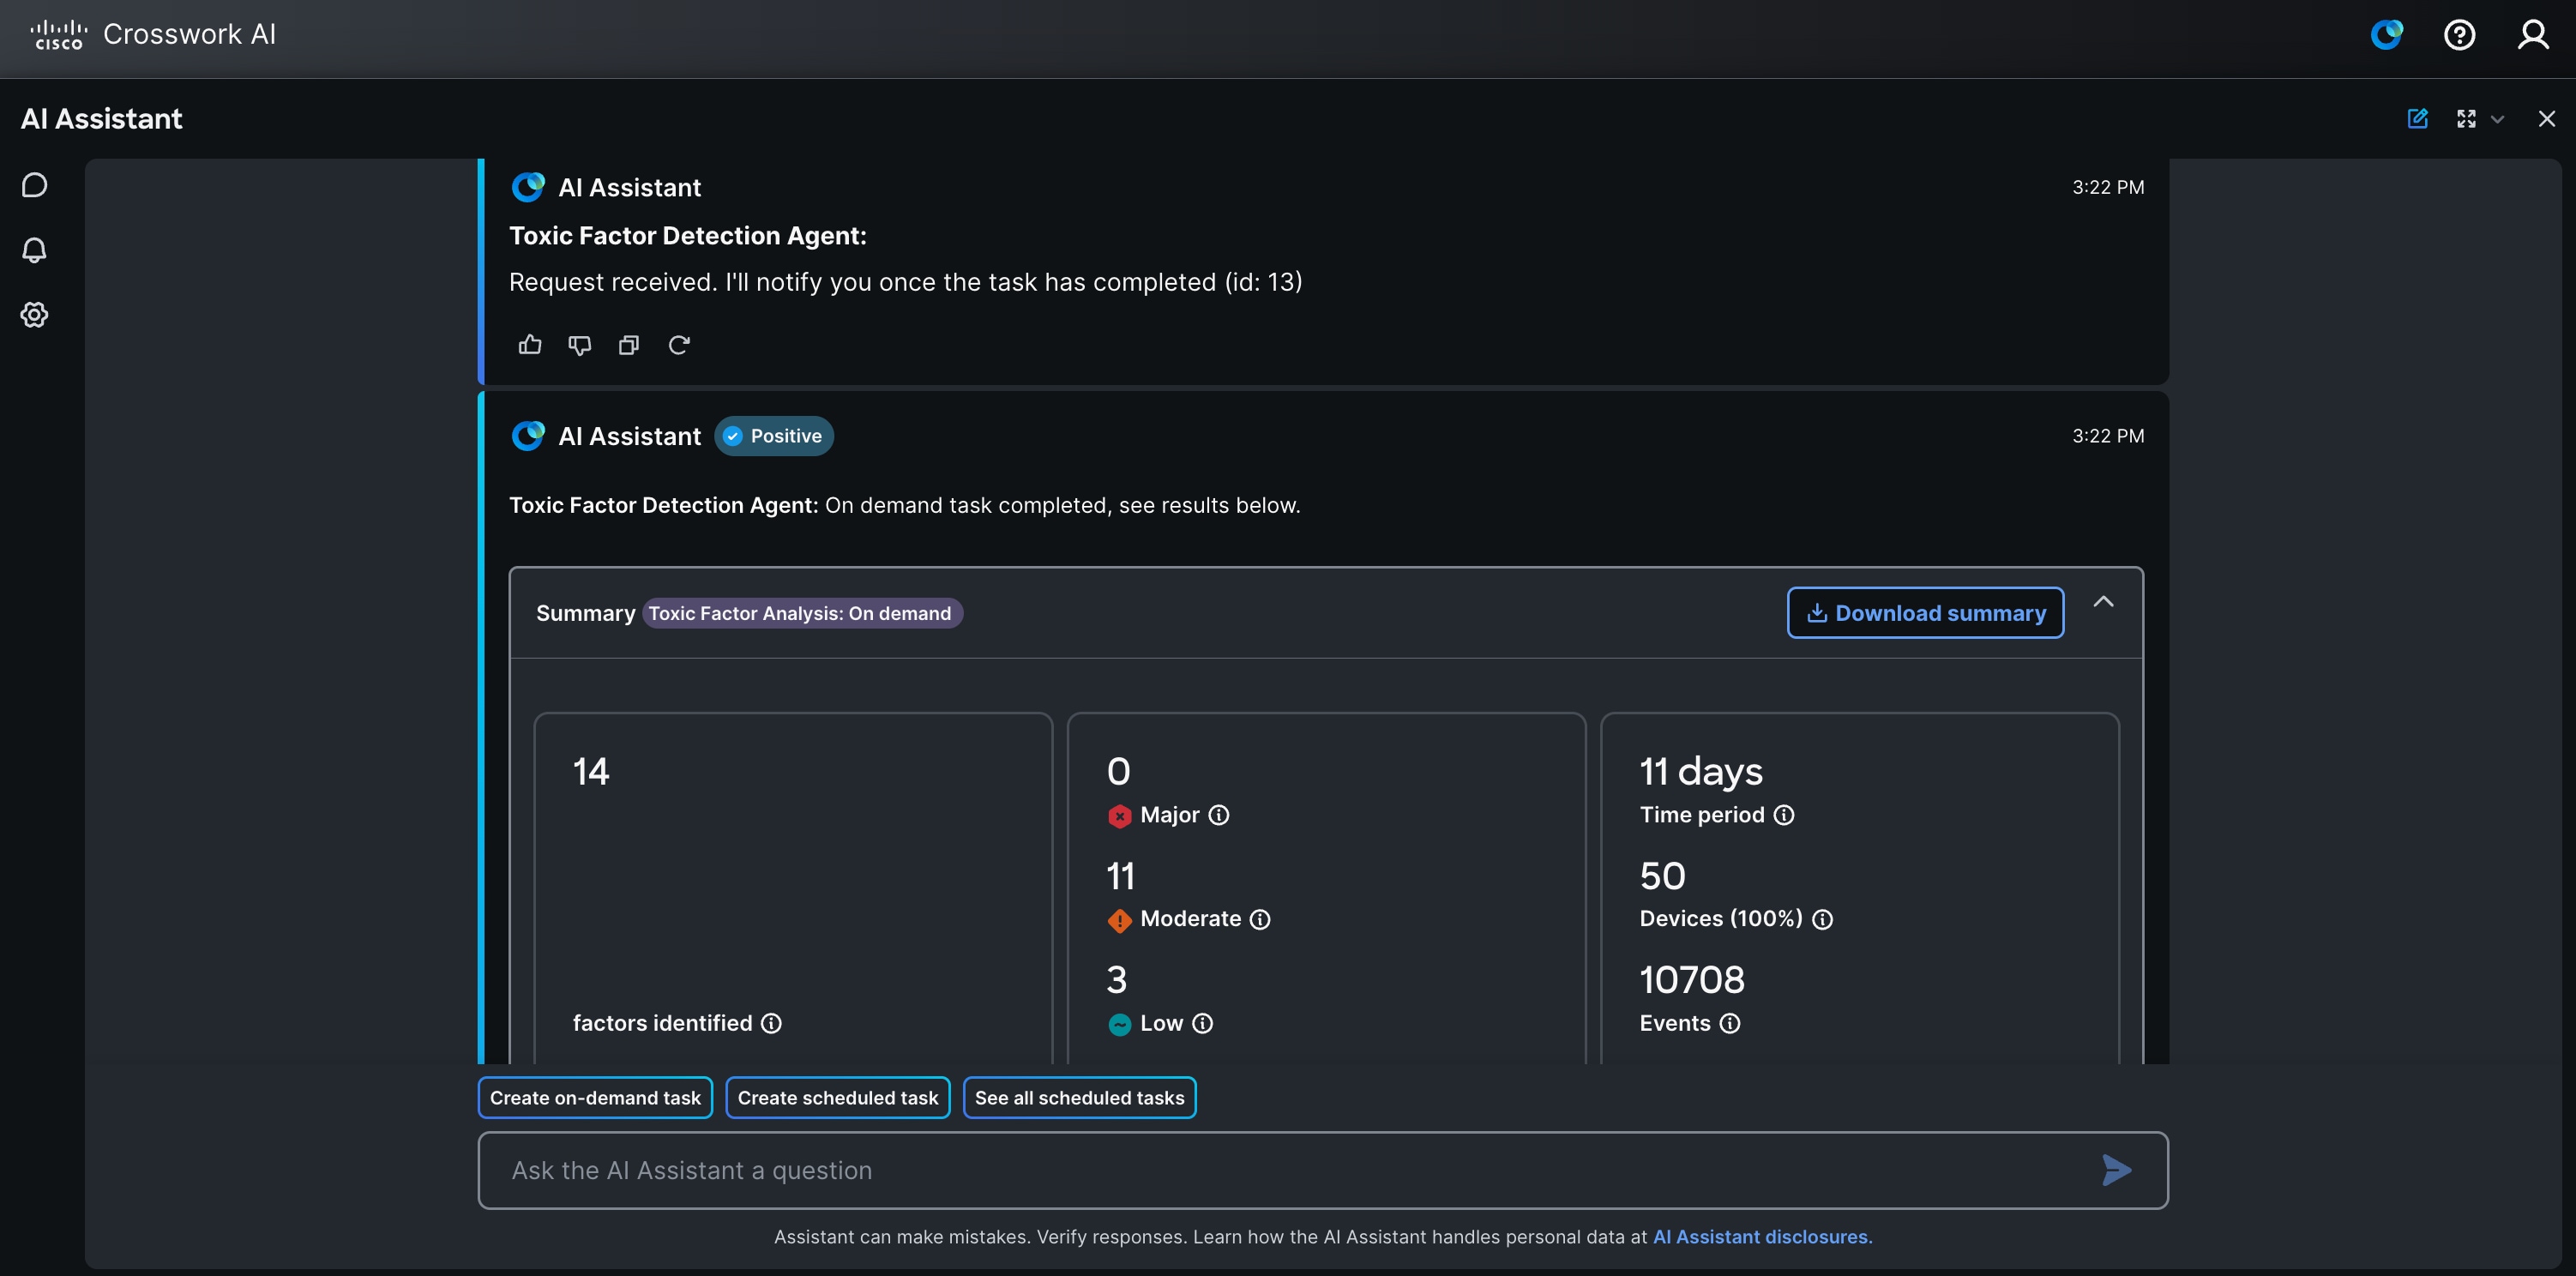 Figure 4. Toxic factor on-demand analysis
The agent displays an overview of findings, a list of identified toxic factors, and a summary of the analysis. The displayed factors help identify attributes or combinations of attributes that may be associated with the selected network event type.
Toxic Factor Identification results are intended to guide investigation. They do not automatically confirm root cause or prescribe remediation.
-
Click the Download summary link to save the analysis results in JSON format.
Additional options
-
Create on-demand task: To run another on-demand toxic factor analysis task.
-
Create scheduled task: To set up automated toxic factor analysis tasks that run at regular intervals.
-
See all scheduled tasks: Displays all existing scheduled tasks. For each scheduled task, you can also:
-
Suspend a task to temporarily stop it from running.
-
Delete a task to permanently remove it from the schedule.
-
Activate a suspended task to resume its execution according to the defined schedule.
-
Interpret the results
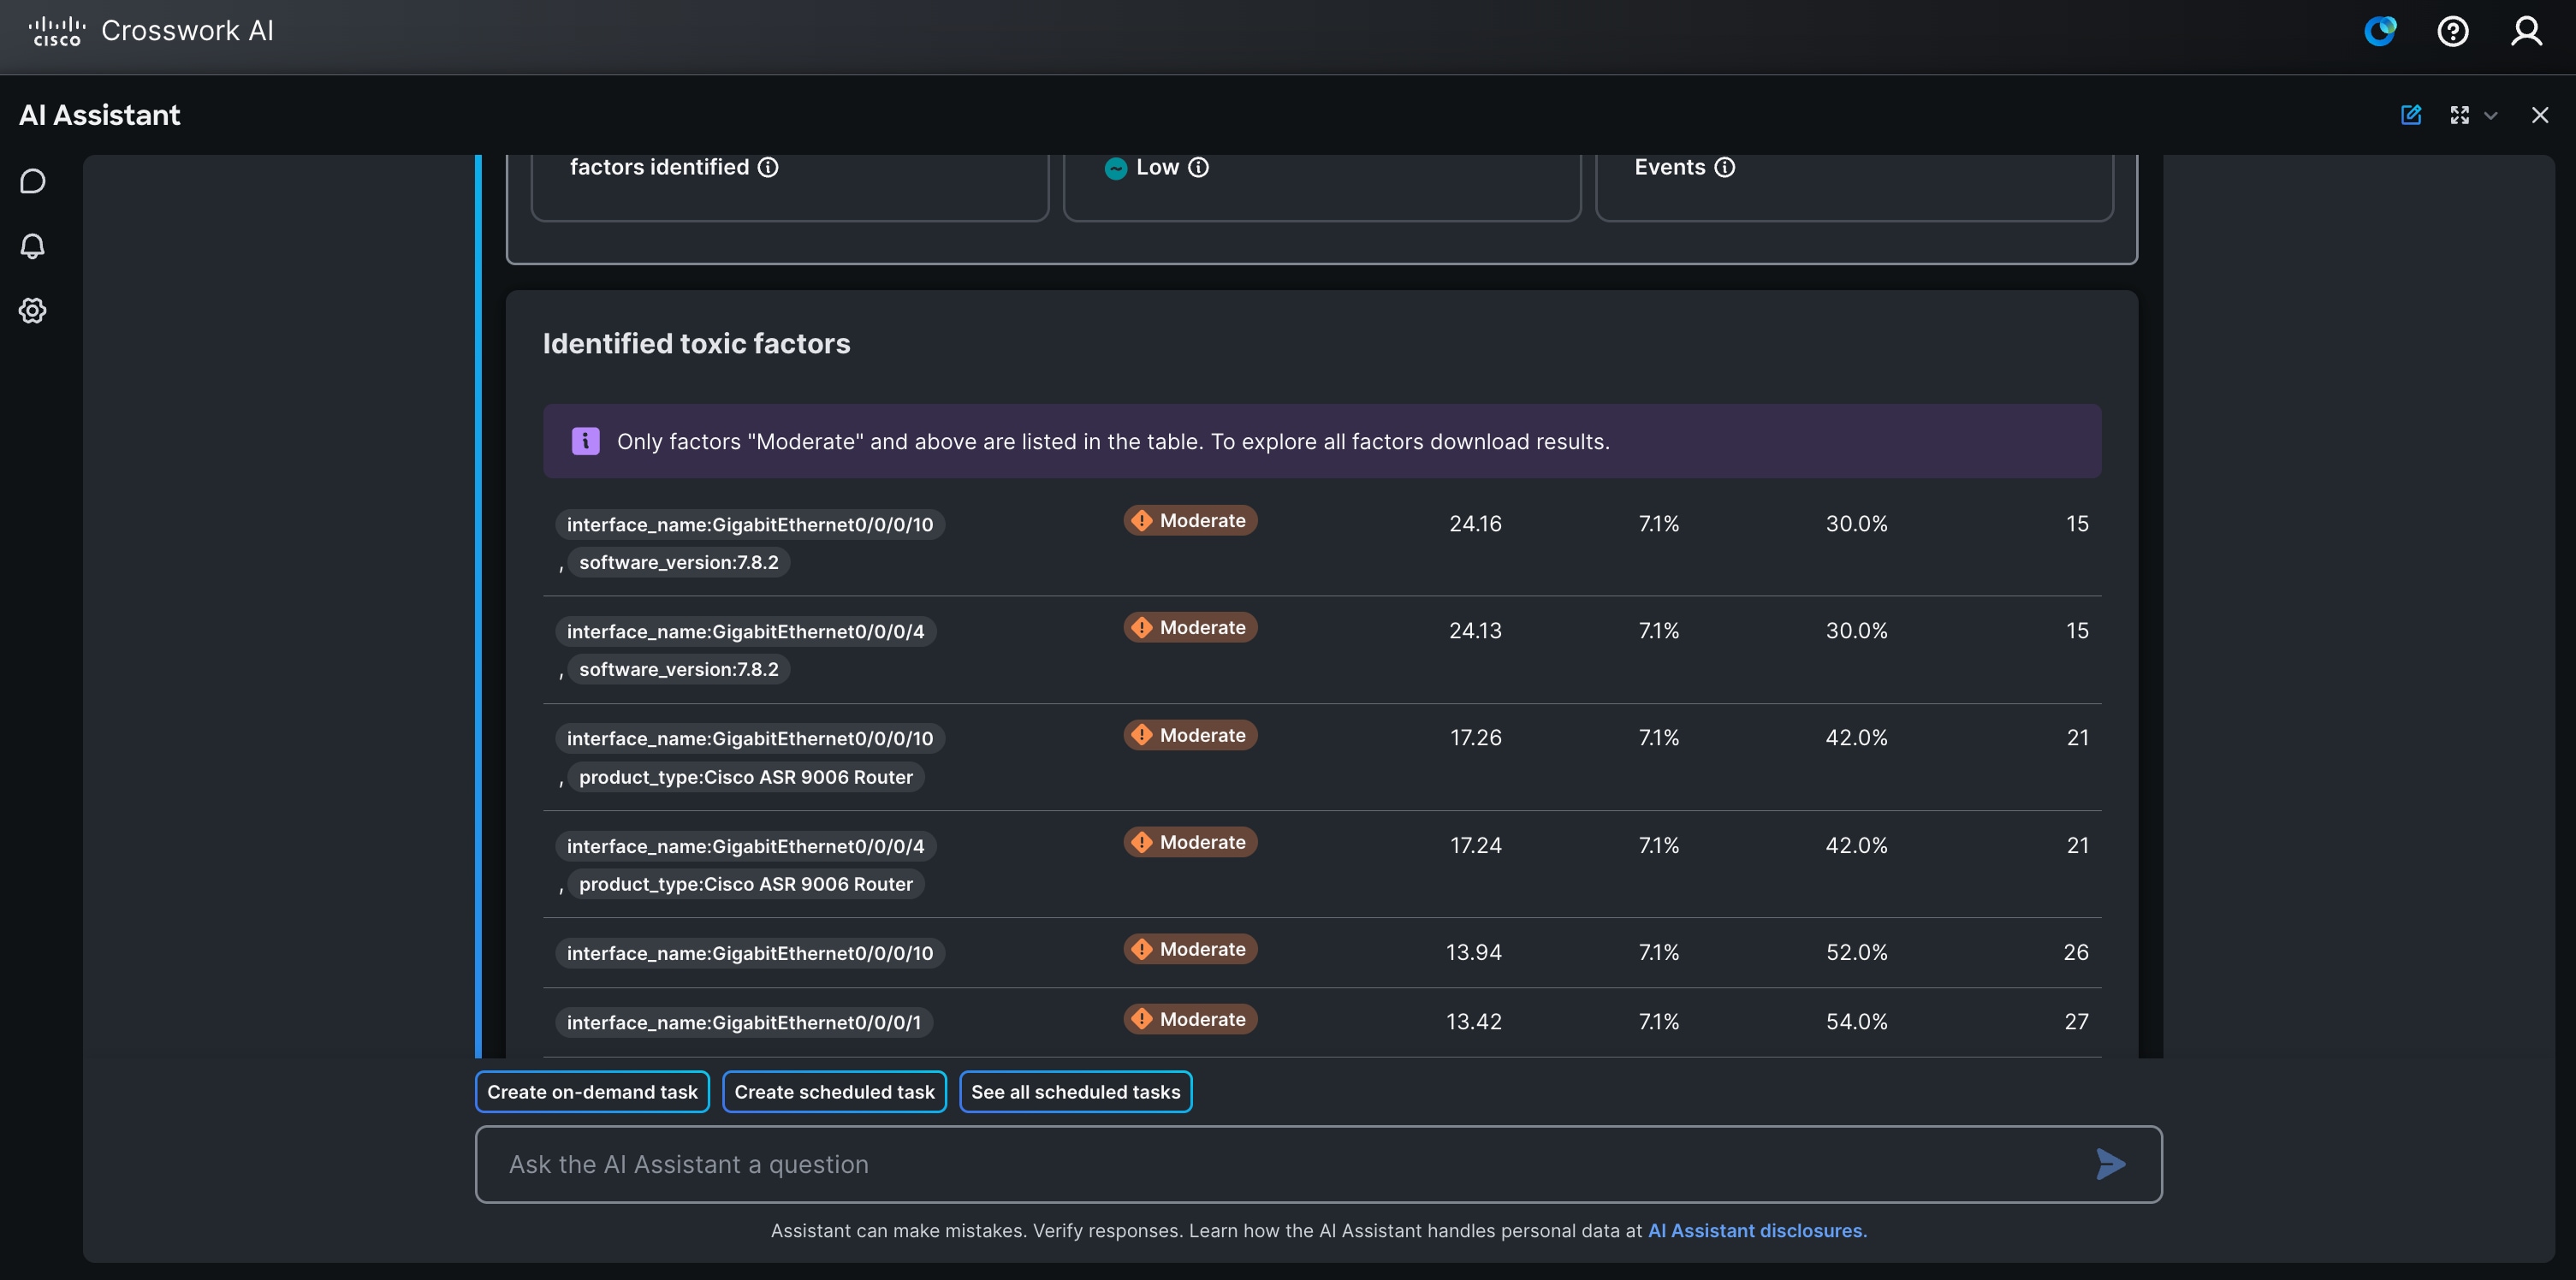
The table explains the key metrics used to analyze and interpret factors contributing to network events.
| Column name | Description |
|---|---|
|
Factor |
The specific attribute or combination of attributes that is being analyzed. |
|
Toxicity |
The severity level of the factor’s impact on network events. It can be Low, Moderate, or Major based on how frequently the factor appears in events and how much more it affects the network compared to its presence. |
|
Relative toxicity |
A measure of how much more (or less) the factor appears in problem events compared to its presence in the network inventory. A value greater than 1 means the factor is involved in events more often than expected. |
|
% of Events |
The percentage of total analyzed network events (for example, link down) that involve this factor. |
|
% of Inventory |
The percentage of devices in the network inventory that have this factor. |
|
Number of Devices |
The number of devices in the network inventory with this factor attribute. |
Each row in the report represents a factor and shows its impact relative to its presence in your network.
-
A high relative toxicity means the factor appears in problem events more often than you would expect based on how many devices have that factor.
-
Toxicity levels combine how frequently a factor occurs in events (% of events) with its relative toxicity to prioritize issues:
-
Low: The factor is uncommon and not involved in many problem events.
Factors with a Low toxicity level are not shown in the AI Assistant interface but are included in the downloadable JSON report for analysis.
-
Moderate: The factor is either common but not much more involved than expected, or uncommon but involved more than expected.
-
Major: The factor is both common and involved much more than expected in problem events.
-
Toxic Factor Identification identifies factors that are statistically associated with selected network events. Use these results to guide further investigation and validate possible causes using your operational knowledge and other network data. The results do not automatically confirm root cause or prescribe remediation.
Example explanation:
In this example, examine the result for the combined factor interface_name:GigabitEthernet0/0/0/10, software_version:7.8.2.

-
The factor combines the interface
GigabitEthernet0/0/0/10and software version7.8.2. -
The factor is present on 15 devices, representing 30.0% of the analyzed inventory.
-
These devices are associated with 7.1% of the analyzed events.
-
The calculated relative toxicity is 24.16, and the factor is classified as Moderate.
-
Investigate the devices sharing this factor combination to determine whether the interface, software version, or another shared condition is contributing to the events.
A toxic factor identifies a statistical association and does not, by itself, establish the root cause. Review the associated devices and events before taking corrective action.
Schedule analysis to run later
Scheduled analysis enables continuous monitoring by automatically running toxic factor identification at defined intervals. It allows you to maintain network stability by proactively detecting factors that negatively influence network events.
To automate the analysis of network events, complete these steps:
-
In the Toxic Factor Identification agent, select Scheduled.
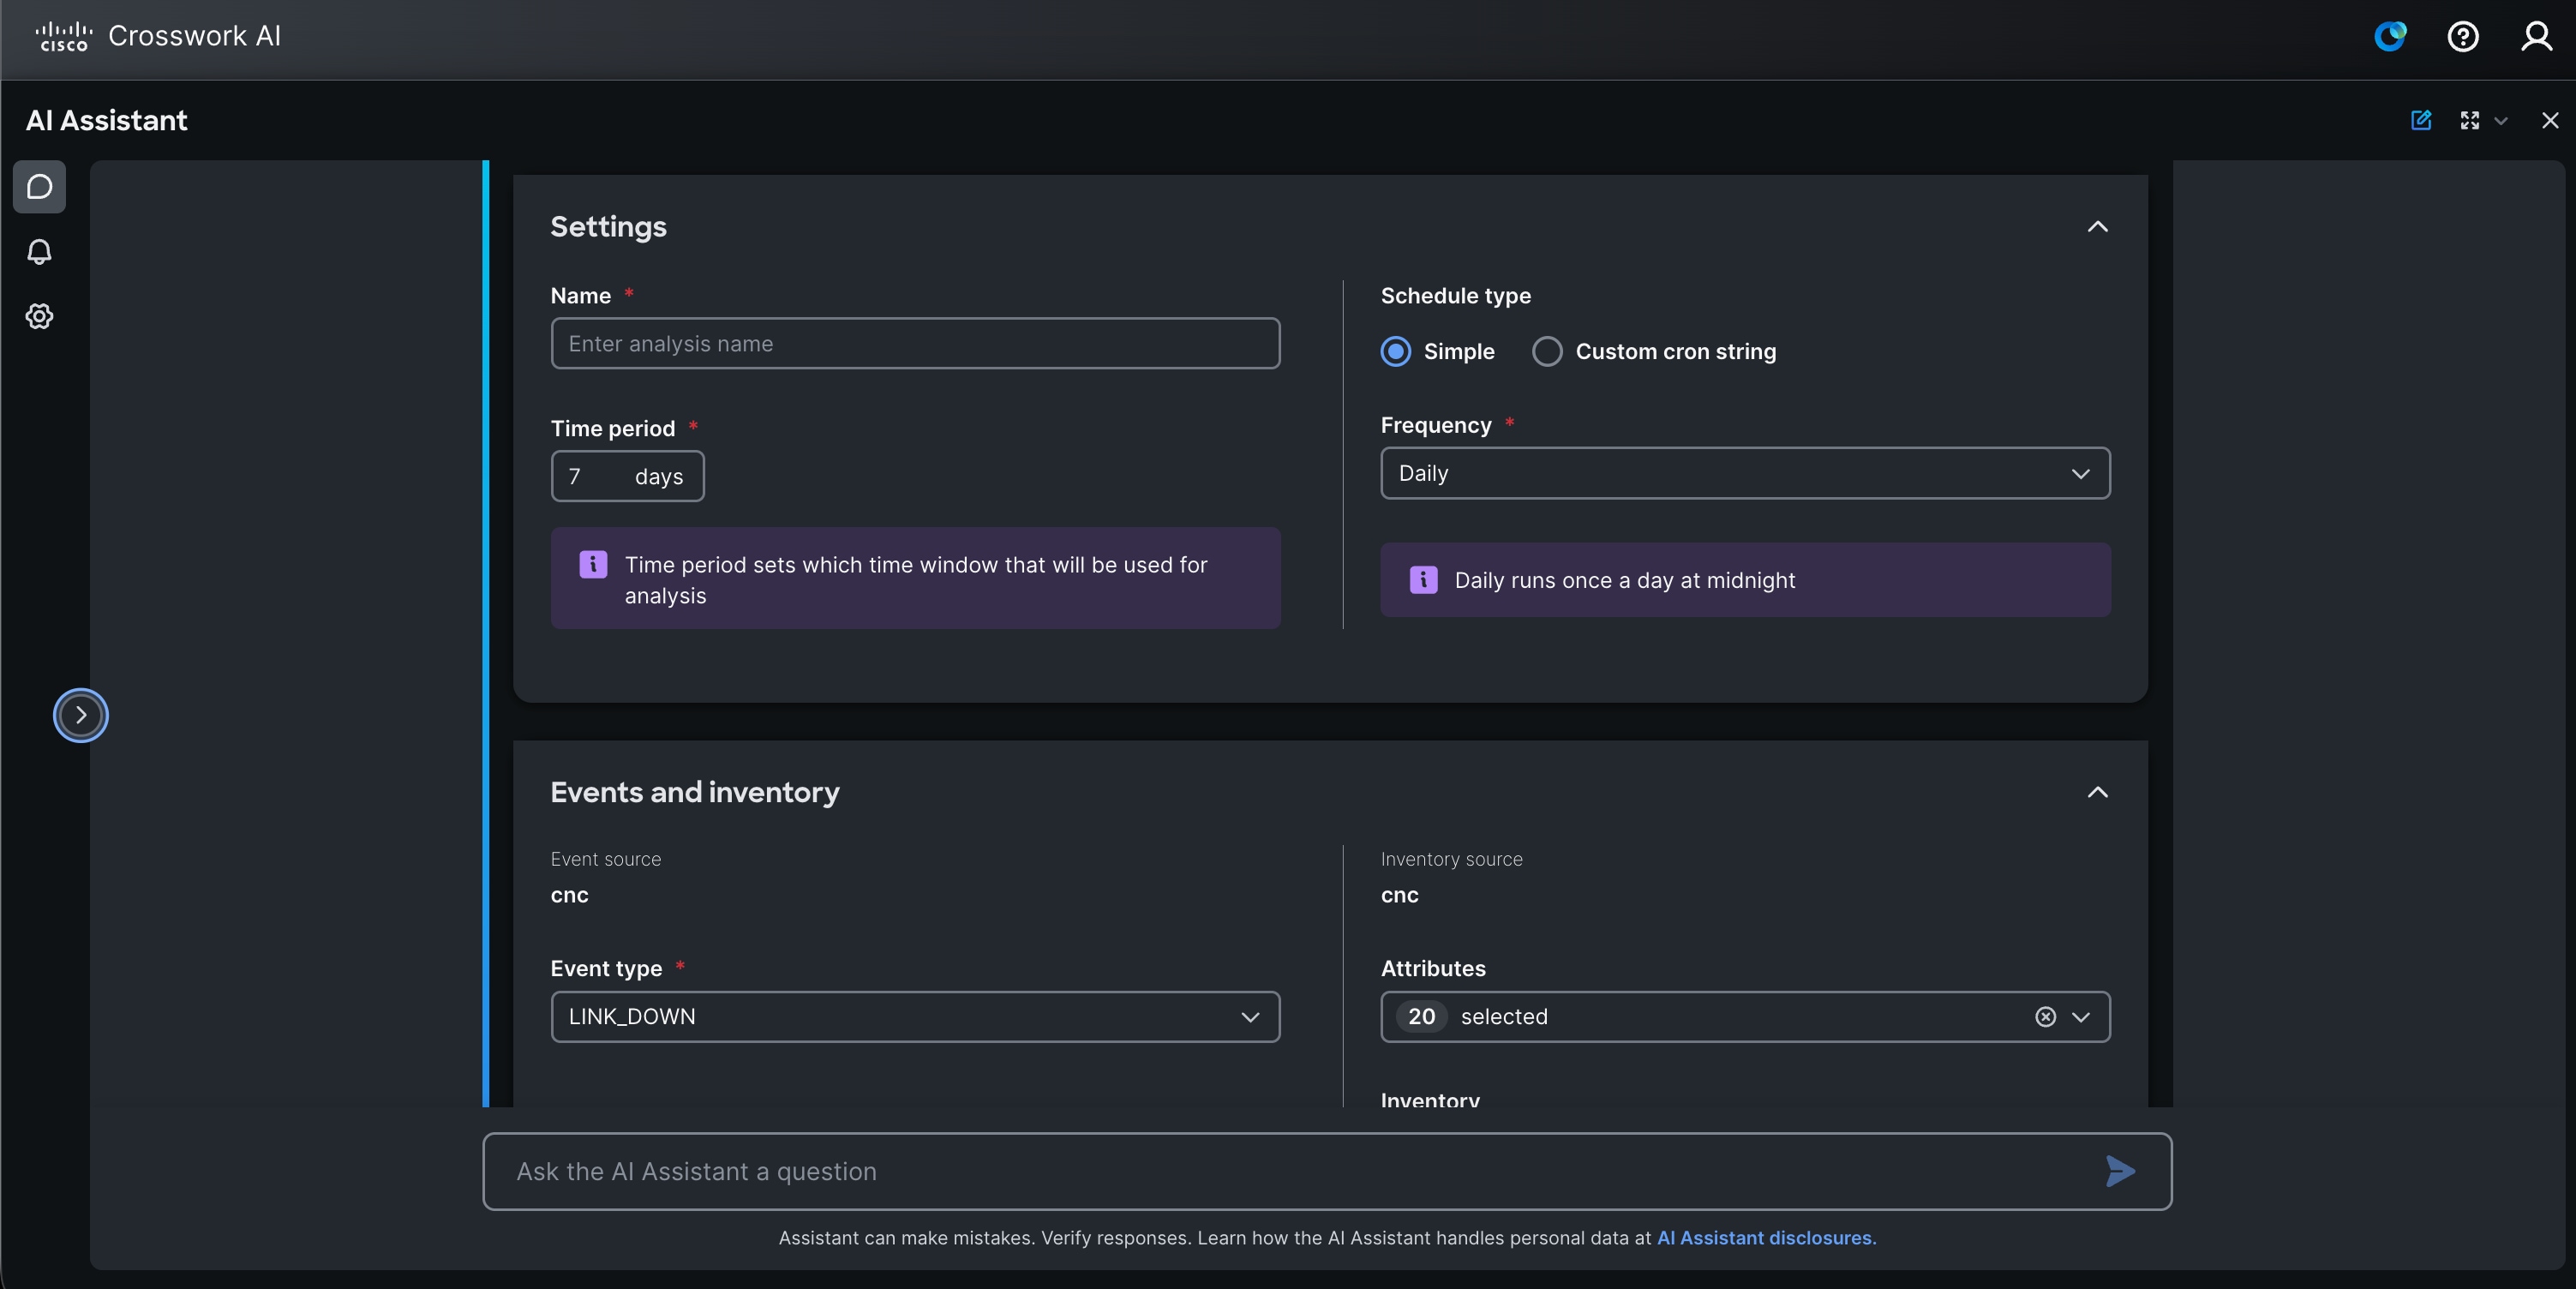 Figure 7. Schedule task settings
 -
Enter a name for the schedule.
-
From the Time period list, choose the range of past days to analyze. This setting specifies the window of historical data the analysis will cover.
-
For the Schedule type, choose how often you want the task to run.
-
Simple: Select this option to pick a standard schedule from the Frequency list, such as daily, weekly, or monthly.
-
Custom cron string: Select this option to enter a more advanced schedule using a cron expression. This allows you to specify exactly when the task should run. For example, entering 0 2 * * 1 would schedule the task to run every Monday at 2:00 AM. For help with generating cron expressions, you can use online tools such as Cronhub.
-
-
From the Event type list, select the event to analyze.
-
From the Attributes list, select the attributes to include in the analysis.
-
Choose whether to analyze the Full network or a subset of devices.
If you choose Use subset, click Upload files to upload a csv file containing device names, one device per row. This list must correspond to the device_name attribute; device UUIDs must not be used.
-
Select Schedule task. By default, AI Assistant notifications are enabled.
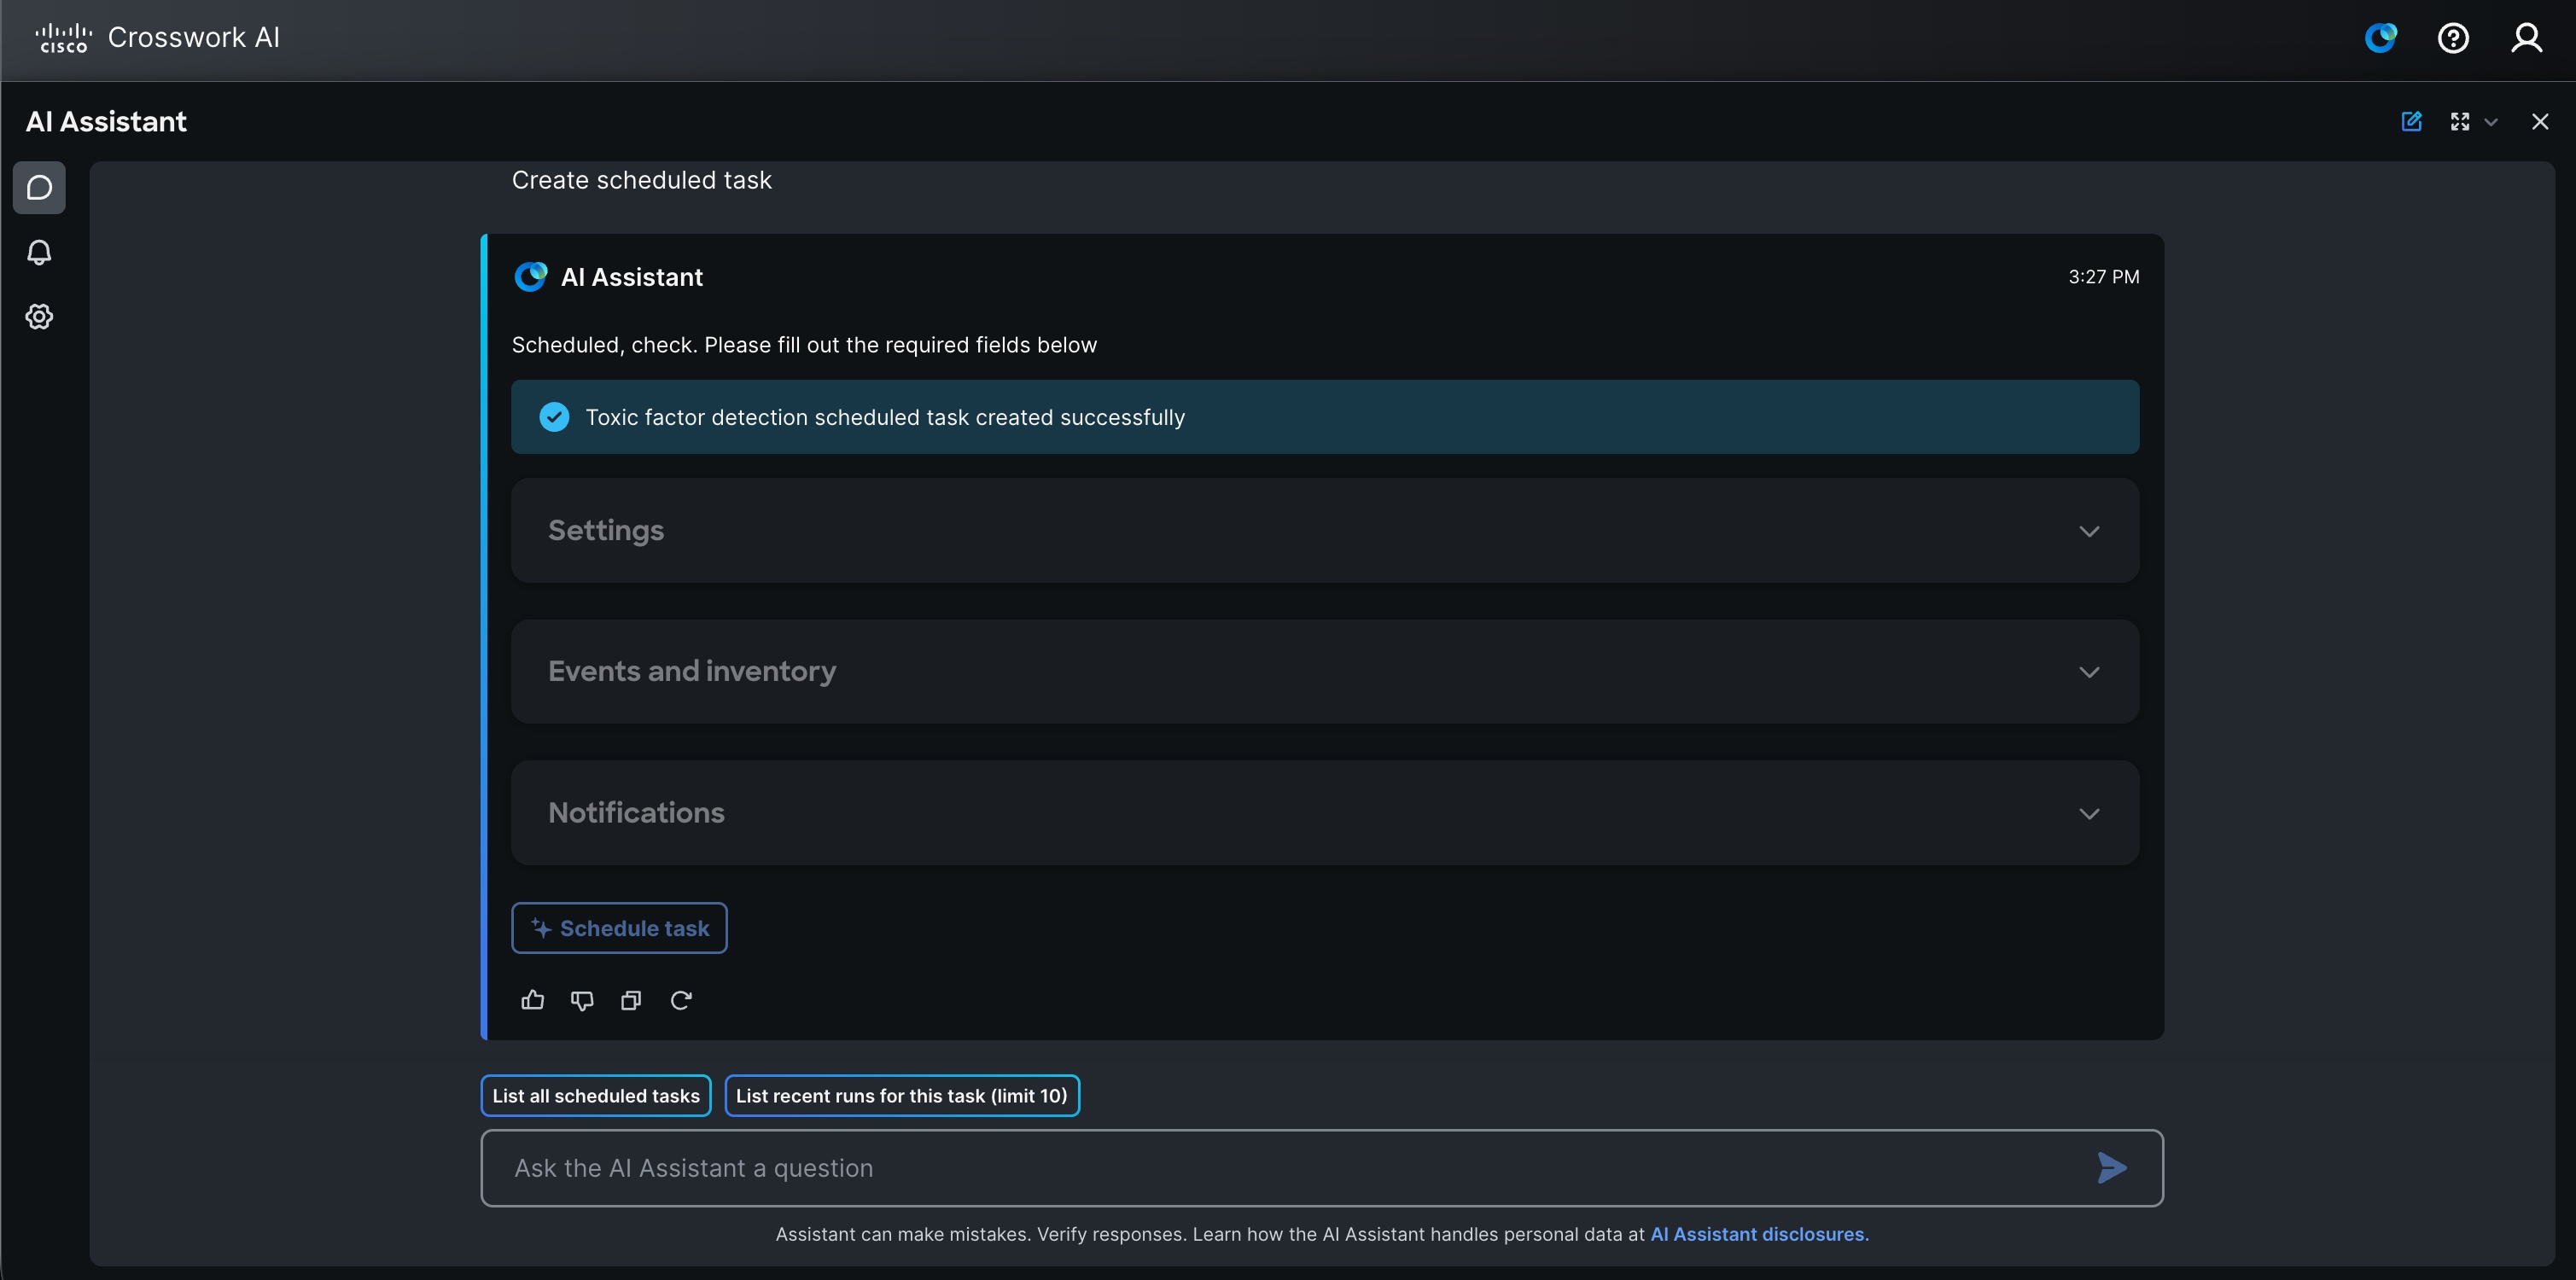 Figure 8. Scheduled task in Toxic Factor Identification agent
Based on the configured settings, the agent performs network event analysis at specified intervals. Once a scheduled task run is complete, you will receive a notification. To review the results, click the  icon in the left menu, then select the specific scheduled task.
Additional options
-
List all scheduled tasks: Displays all existing scheduled tasks. For each scheduled task, you can also:
-
Suspend a task to temporarily stop it from running.
-
Delete a task to permanently remove it from the schedule.
-
Activate a suspended task to resume its execution according to the defined schedule.
-
-
List recent runs for this task(limit 10): Displays a table of up to 10 of the most recent runs for a specific task. Click a run to view its results.