
What is Observability?
Observability in Crosswork AI helps administrators monitor the operational behavior of agents, services, agentic flows, and LLM-related activity.
An agentic flow can traverse multiple components, services, tools, and agents. Crosswork AI collects observability data from the components involved in these agent-related flows and makes the data available through the integrated Observability UI. The collected data includes logs, metrics, and traces.
Administrators can use this information to understand agent activity, review LLM usage, investigate agent execution behavior, trace activity across components, and analyze tool calls and service interactions that occur as part of agentic workflows.
Observability in Crosswork AI includes the following capabilities:
-
An integrated Observability UI that provides access to logs, metrics, traces, and default dashboards.
-
Default dashboards that show agent, user, request, token, and tool usage metrics.
-
Support for forwarding observability data to external destinations through OTEL Endpoints.

The Observability UI is integrated with Crosswork AI and is based on a third-party observability tool. This documentation describes the observability capabilities provided through Crosswork AI. It does not describe every feature of the third-party Observability UI.
Observability capabilities
Use Observability to perform the following tasks:
-
View observability data — View logs, metrics, and traces collected from agents, tools, and services involved in agent-related flows in Crosswork AI.
-
Monitor agent activity — Review agent execution behavior, agent tasks, tool calls, and service interactions that occur as part of agentic flows.
-
Monitor LLM usage — Review LLM request and token usage across agents, users, models, and agent-related workflows.
-
Review default dashboards — Use the dashboards provided out of the box to review specific LLM-related metrics, such as request counts, token usage, model usage, users, and tool calls.
-
Investigate agent runs — Use traces and logs to investigate calls made by agents, tools, and services during an agent-related flow.
-
Forward observability data — Configure external destinations through OTEL endpoints to forward logs, metrics, and traces for agent-related flows to supported external observability tools.
Observability is intended for monitoring agent-related flows. It does not provide system-wide infrastructure or platform monitoring dashboards.
Prerequisites
Review the following requirements and limitations before you use Observability:
-
You must have the AI Observability privilege to access Observability. This privilege can be assigned through a predefined role or a custom role.
-
Observability data is collected from agents, tools, and services involved in agent-related flows in Crosswork AI.
-
Logs, metrics, and traces for agent-related flows are available in the integrated Observability UI.
-
Default dashboards are available out of the box for specific LLM-related metrics, such as request counts, token usage, model usage, users, and tool calls.
-
External destinations can be configured through OTEL endpoints to forward logs, metrics, and traces to supported external observability tools.
There is no UI-based configuration for external destinations. To configure external destinations, use the Observability APIs.
For API details, see Observability API.
Access Observability
You can access Observability from the Crosswork AI:
-
Log in to Crosswork AI.
-
From the left navigation, select Administration.
-
Select Observability Service.
-
Select the launch option to open the Observability UI.
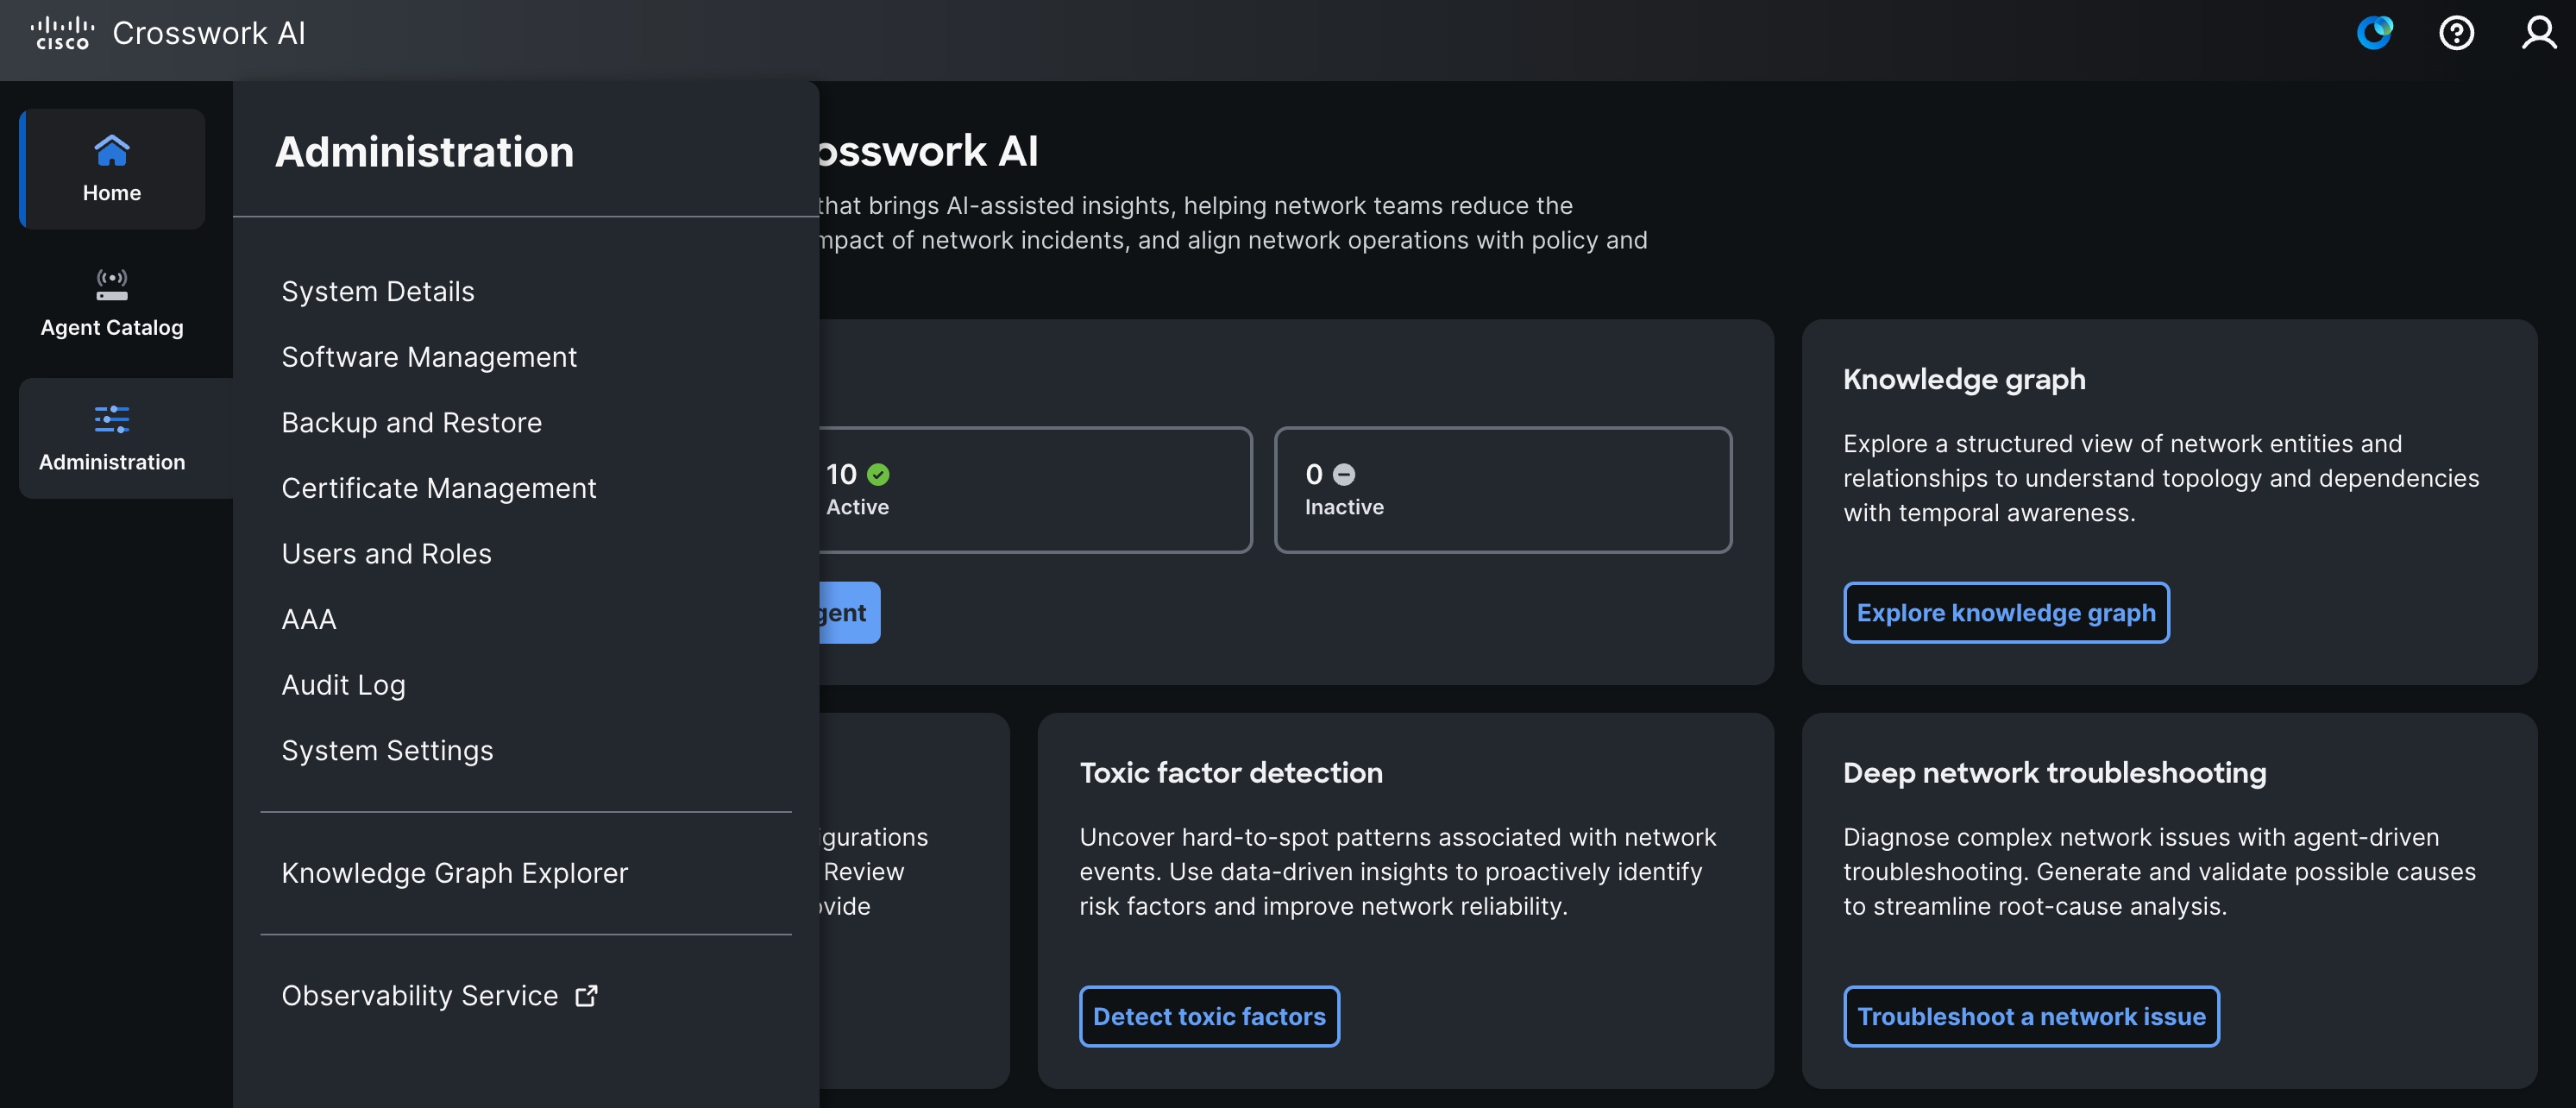
The Observability UI opens in a separate tab.
View default dashboards
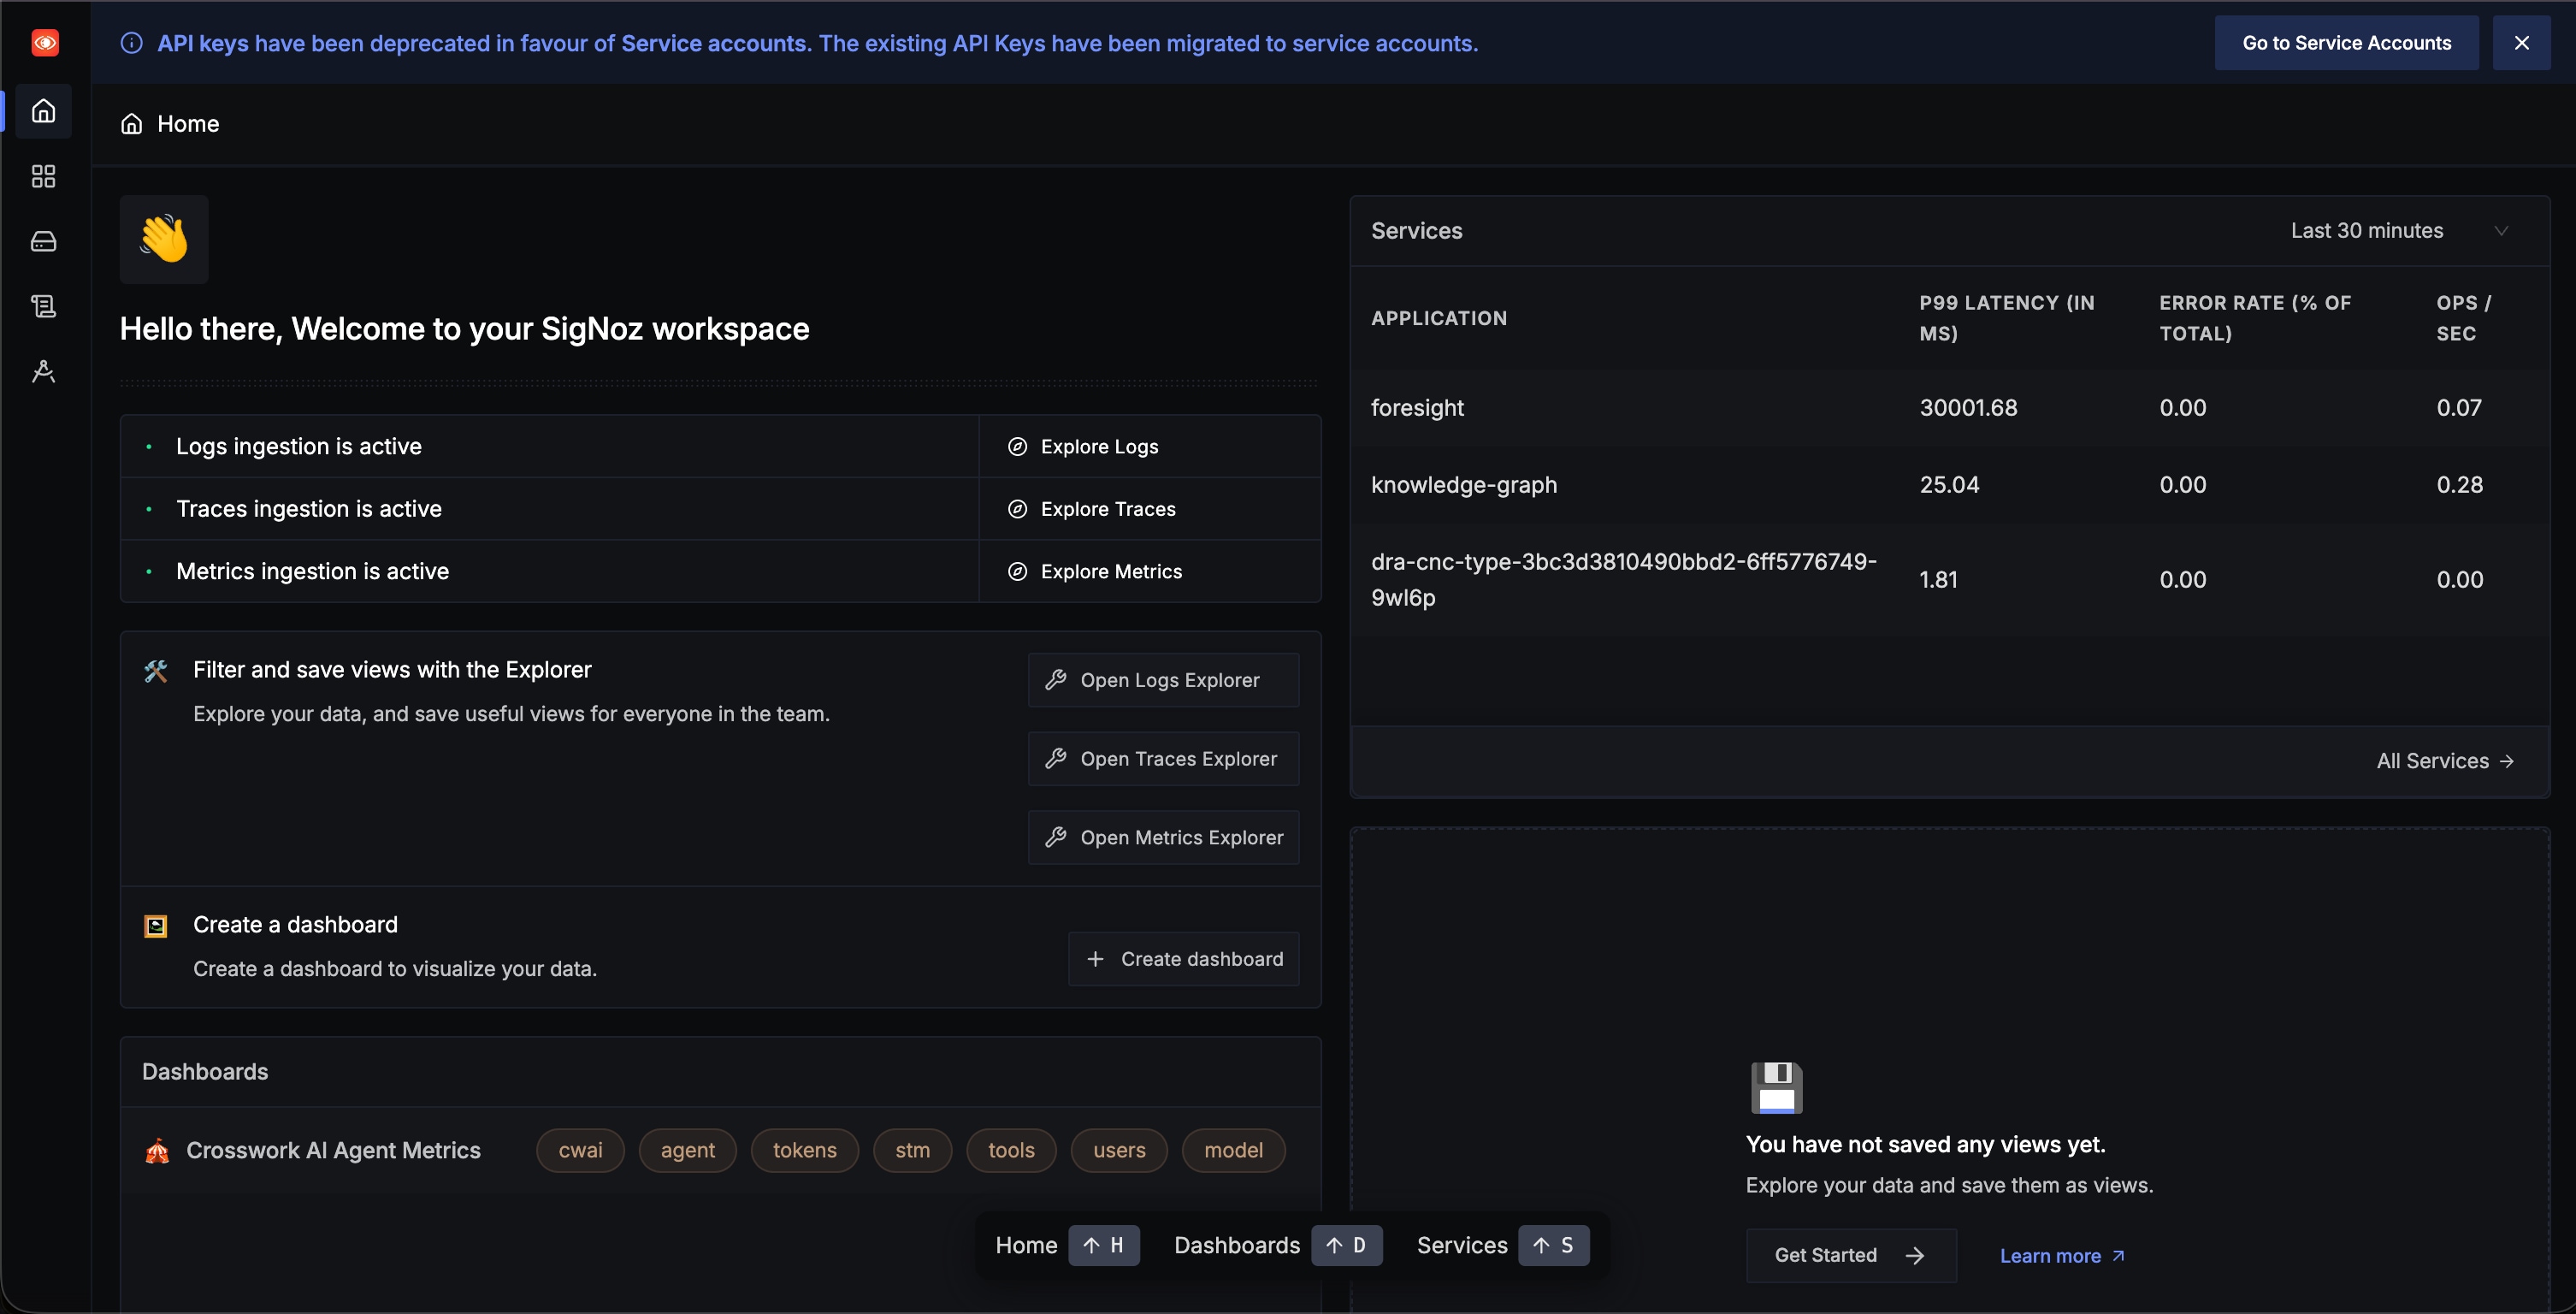
The Observability dashboard provides default dashboards that help monitor agent activity, LLM usage, token consumption, tool calls, users, and model-related metrics.
The default dashboards are available out of the box. For example, the Crosswork AI Agent Metrics dashboard provides usage and activity metrics for Crosswork AI agents and services.
Use the default dashboards to understand:
-
How agents and services are being used.
-
How many LLM requests are generated.
-
Which users or agent types are generating requests.
-
How many input and output tokens are consumed.
-
Which tools are called by agents.
-
How service-level metrics, such as latency and error rate are trending.
To view a default dashboard:
-
Open the Observability dashboard.
-
In the Dashboards area, select a default dashboard, such as Crosswork AI Agent Metrics.
-
Select the required time range.
-
Review the available charts, metrics, and tables.
The available dashboards and dashboard panels can vary depending on the data available in your deployment and the final dashboard configuration for the release.
Forward observability data to an external destination
You can configure Crosswork AI to forward logs, metrics, and traces to supported external observability tools through OpenTelemetry (OTel) endpoints.
You can configure up to 10 external destinations. Each destination can receive one or more of the following observability data types:
-
Logs
-
Metrics
-
Traces
External destinations are managed through APIs only. A user interface is not available for creating, updating, or deleting external destinations.
Before you begin
Collect the following information for the external destination:
-
Destination name
-
Exporter type, such as HTTP or gRPC
-
Observability data types to forward
-
Destination URL
-
Authentication type and credentials, if required
-
Whether forwarding to the destination should be enabled
The supported authentication options include:
-
No authentication
-
Basic authentication
-
Token-based authentication
If the external destination requires TLS, upload its certificate before configuring the destination:
-
Choose Administration > Certificate Management.
-
Click Add system certificate.
-
From the feature type list, choose Observability External TLS.
-
Provide the required certificate information and upload the certificate.
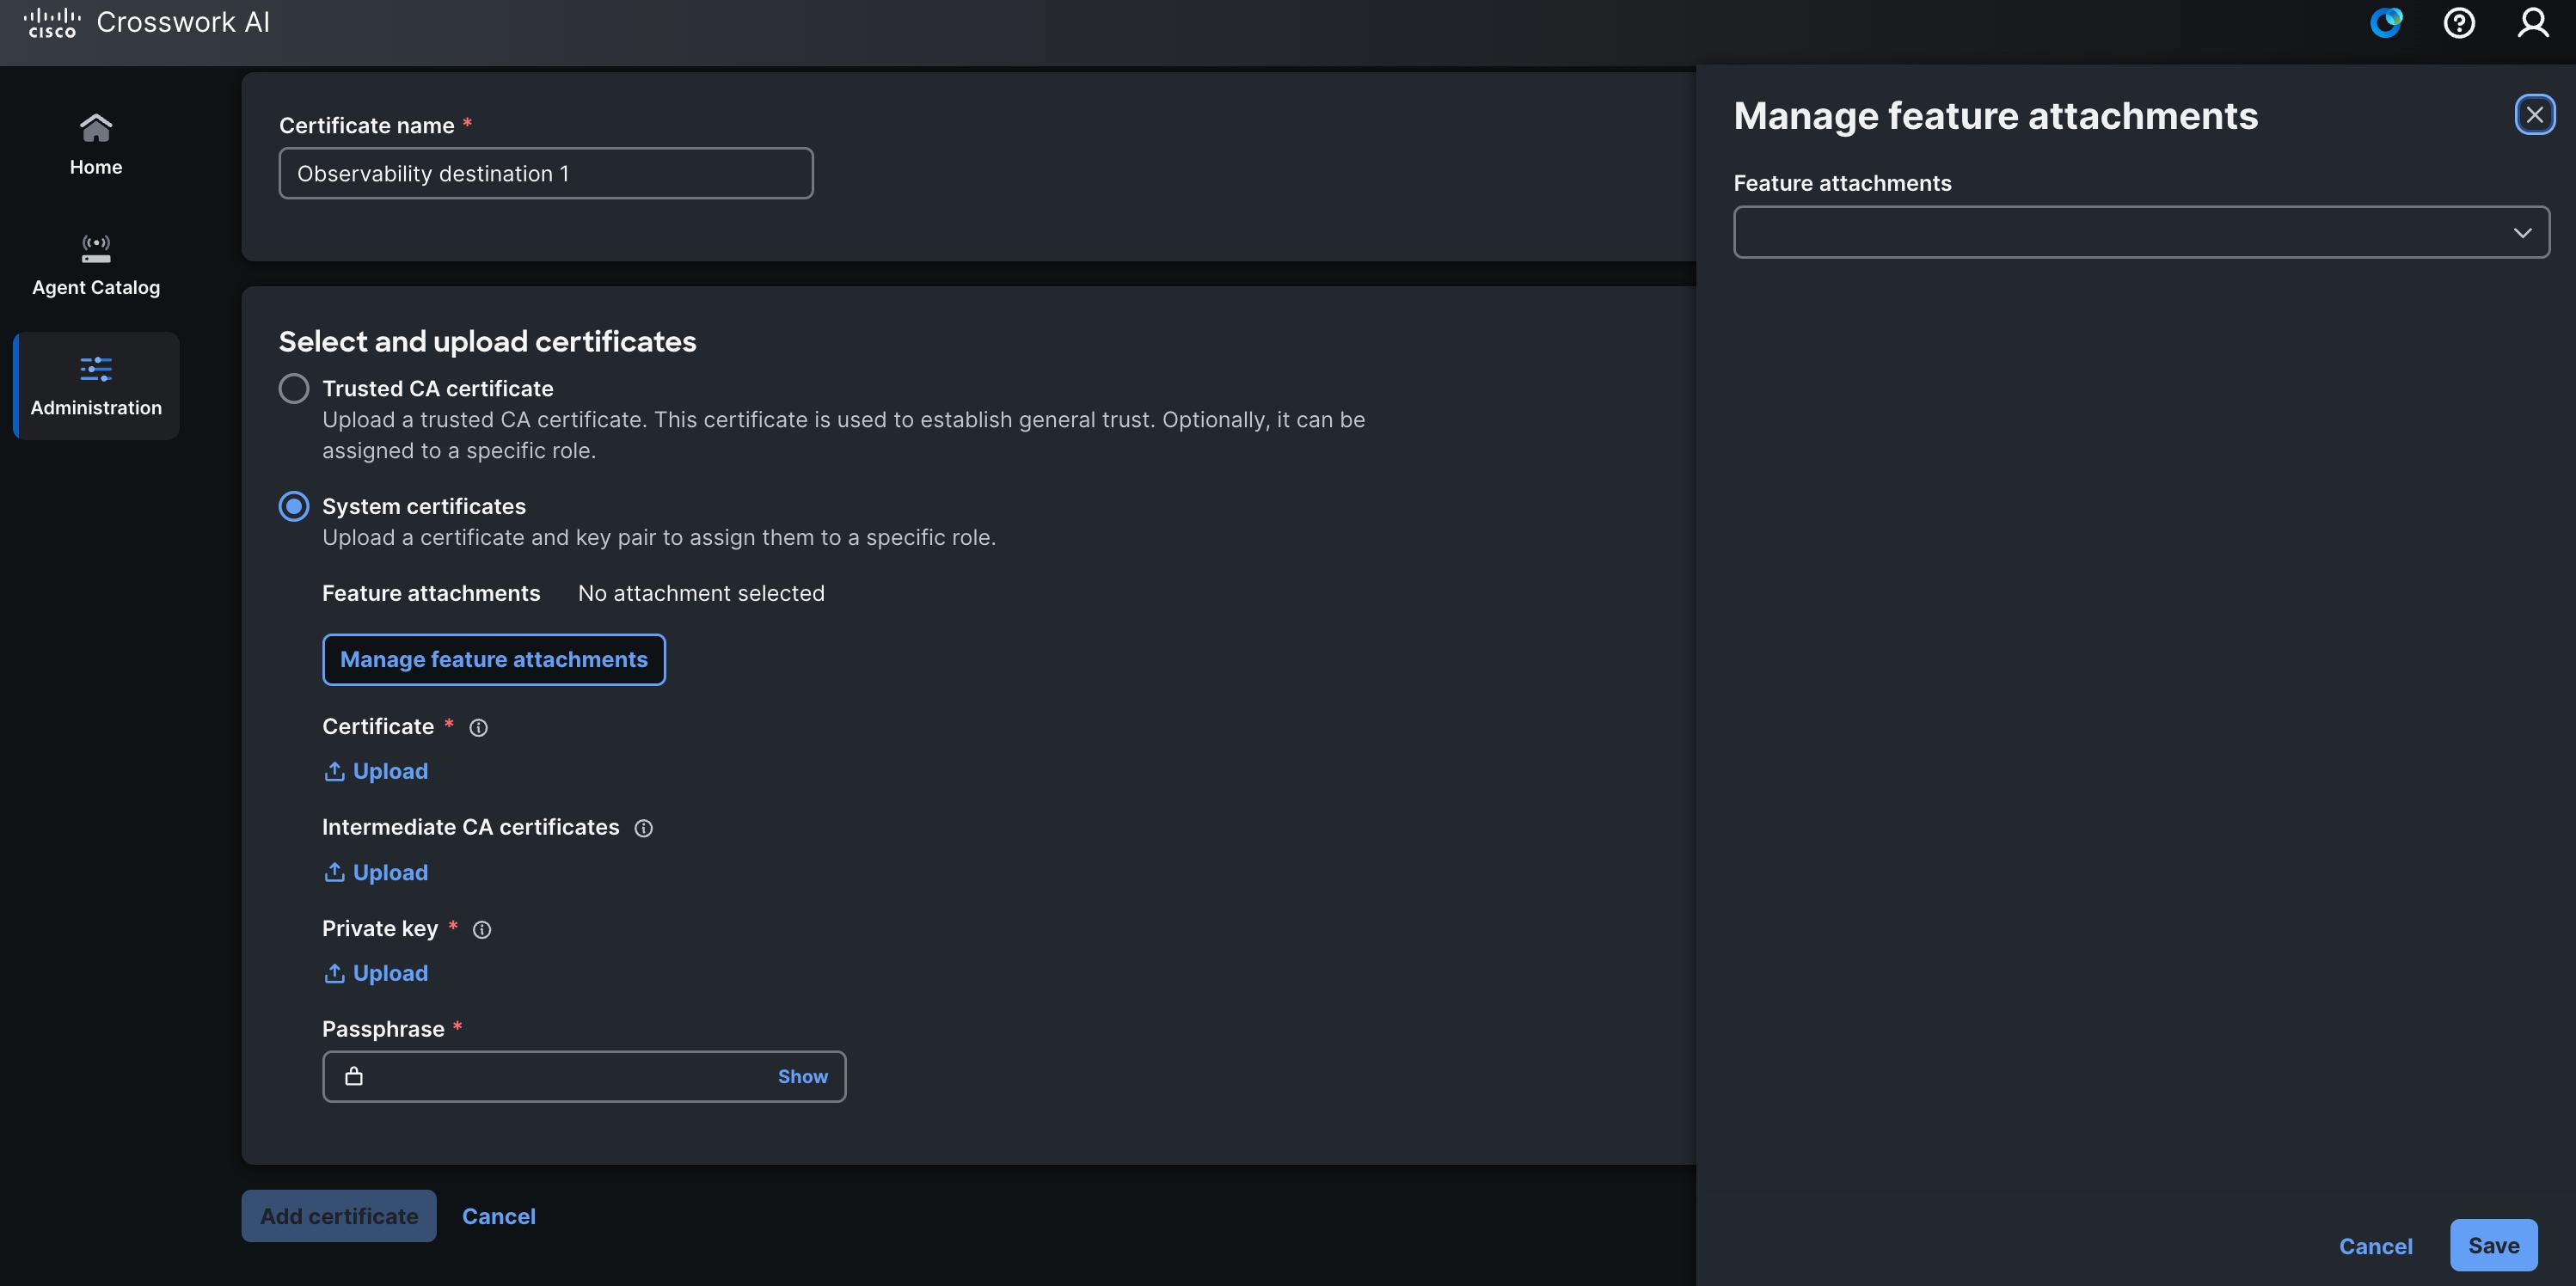
Certificate information is not included in the external destination configuration. Upload and manage the certificate separately through Certificate Management.
Configure an external destination
-
Use the external destination API to create a destination.
-
Enter a unique destination name.
-
Select the exporter type, such as HTTP or gRPC.
-
Enter the destination URL.
-
Select one or more observability data types to forward:
-
Logs
-
Metrics
-
Traces
-
-
Select the authentication type and provide the required authentication information.
-
Specify whether the destination is enabled.
-
Submit the API request.
-
Verify that the selected observability data is received by the external destination.
Crosswork AI applies a new or updated external destination configuration dynamically.
To stop forwarding observability data to a destination, disable or delete the destination by using the external destination API. When the destination is deleted, Crosswork AI stops forwarding data to it.
Observability data retention
Observability data is retained for a default retention period.
By default, observability data is retained for one month for each observability data type:
-
Logs
-
Metrics
-
Traces
Confirm the supported retention range and API details before documenting the retention configuration procedure.
However, when the observability data reaches the allocated storage limit of 20 GB or 30 GB storage, depending on the deployment profile, the default cleanup process starts automatically to reclaim storage capacity.
Troubleshooting
Use the following information to resolve common issues when you use the Observability dashboard.
Issue: For custom agents: Logs, metrics, or traces are not displayed.
Recommended action:
-
Verify that agents or services have generated activity.
-
Check the selected time range in the Observability dashboard.
-
Verify that logs, traces, and metrics ingestion is active.
-
Use relevant observability ADK/SDK APIs to send observability data.
-
Refresh the observability service and check again.
Issue: Default dashboards do not show data.
Recommended action:
-
Verify that agent activity occurred during the selected time range.
-
Verify that LLM requests, token usage, or tool calls are available for the selected period.
-
Select a broader time range and refresh the dashboard.
-
Verify that the required agents and services are running.
Issue: Data is not forwarded to an external destination.
Recommended action:
-
Verify that the external destination is configured.
-
Verify that the destination is enabled.
-
Verify that the endpoint URL is valid.
-
Verify that the selected data types include the expected data type, such as logs, metrics, or traces.
-
Verify that authentication is correct.
-
Verify certificate settings are correct.
-
Allow time for the updated configuration to take effect.
Issue: Observability data continues to appear in the Observability dashboard after an external destination is deleted.
Recommended action:
-
No action is required.
-
Deleting an external destination stops forwarding data only to that external destination.
-
The embedded internal observability destination continues to receive observability data.