
Topology
Cisco Cloud Control Topology provides a unified view of network infrastructure across multiple controller domains. It combines map-based navigation, scopes, health indicators, alert workflows, and drill-down navigation so teams can move from high-level awareness to detailed investigation with less context switching.
Understand topology
Topology includes information about cross-domain relationships, historical analysis, and access visibility.
Cross-domain relationships
Topology is designed to unify topology information across management domains. It can correlate discovered neighbor relationships across products so that links between domains are easier to understand in one place. This improves visibility when your environment includes multiple controller technologies or a mix of network domains.
Topology represents physical (Layer 1), switched (Layer 2), and routed (Layer 3) connectivity, including relationships learned from OSPF, ISIS, and BGP. It helps you understand routed connectivity between domains, not just physical connections between devices.
Examples include relationships discovered across campus, data center, compute, and SD-WAN environments.

Topology displays data center and compute relationships only at L1 & L2.
Layer 3 connectivity
Topology derives Layer 3 connectivity from the physical topology by matching subnets shared across device interfaces. Devices that share a subnet are shown as connected through that subnet, indicating which devices can route traffic to each other.
Historical analysis
Topology maintains records for historical analysis, including daily changes for 30 days and monthly change summaries for up to 1 year.
Access and visibility
Access is governed by role-based access control and tenant segmentation. Users can only see the portions of the environment configured for their role and tenant context.
Get started
Get started with Topology by completing any required integrations, opening the topology map, and creating a scope when needed.
Before you begin
Catalyst Center requires additional integration steps before its data is visible. Refer to the Integrate Catalyst Center section in the Cisco Cloud Control Getting Started article for details.
Navigate the topology map
Topology provides a map-based experience that helps you understand network distribution across locations.
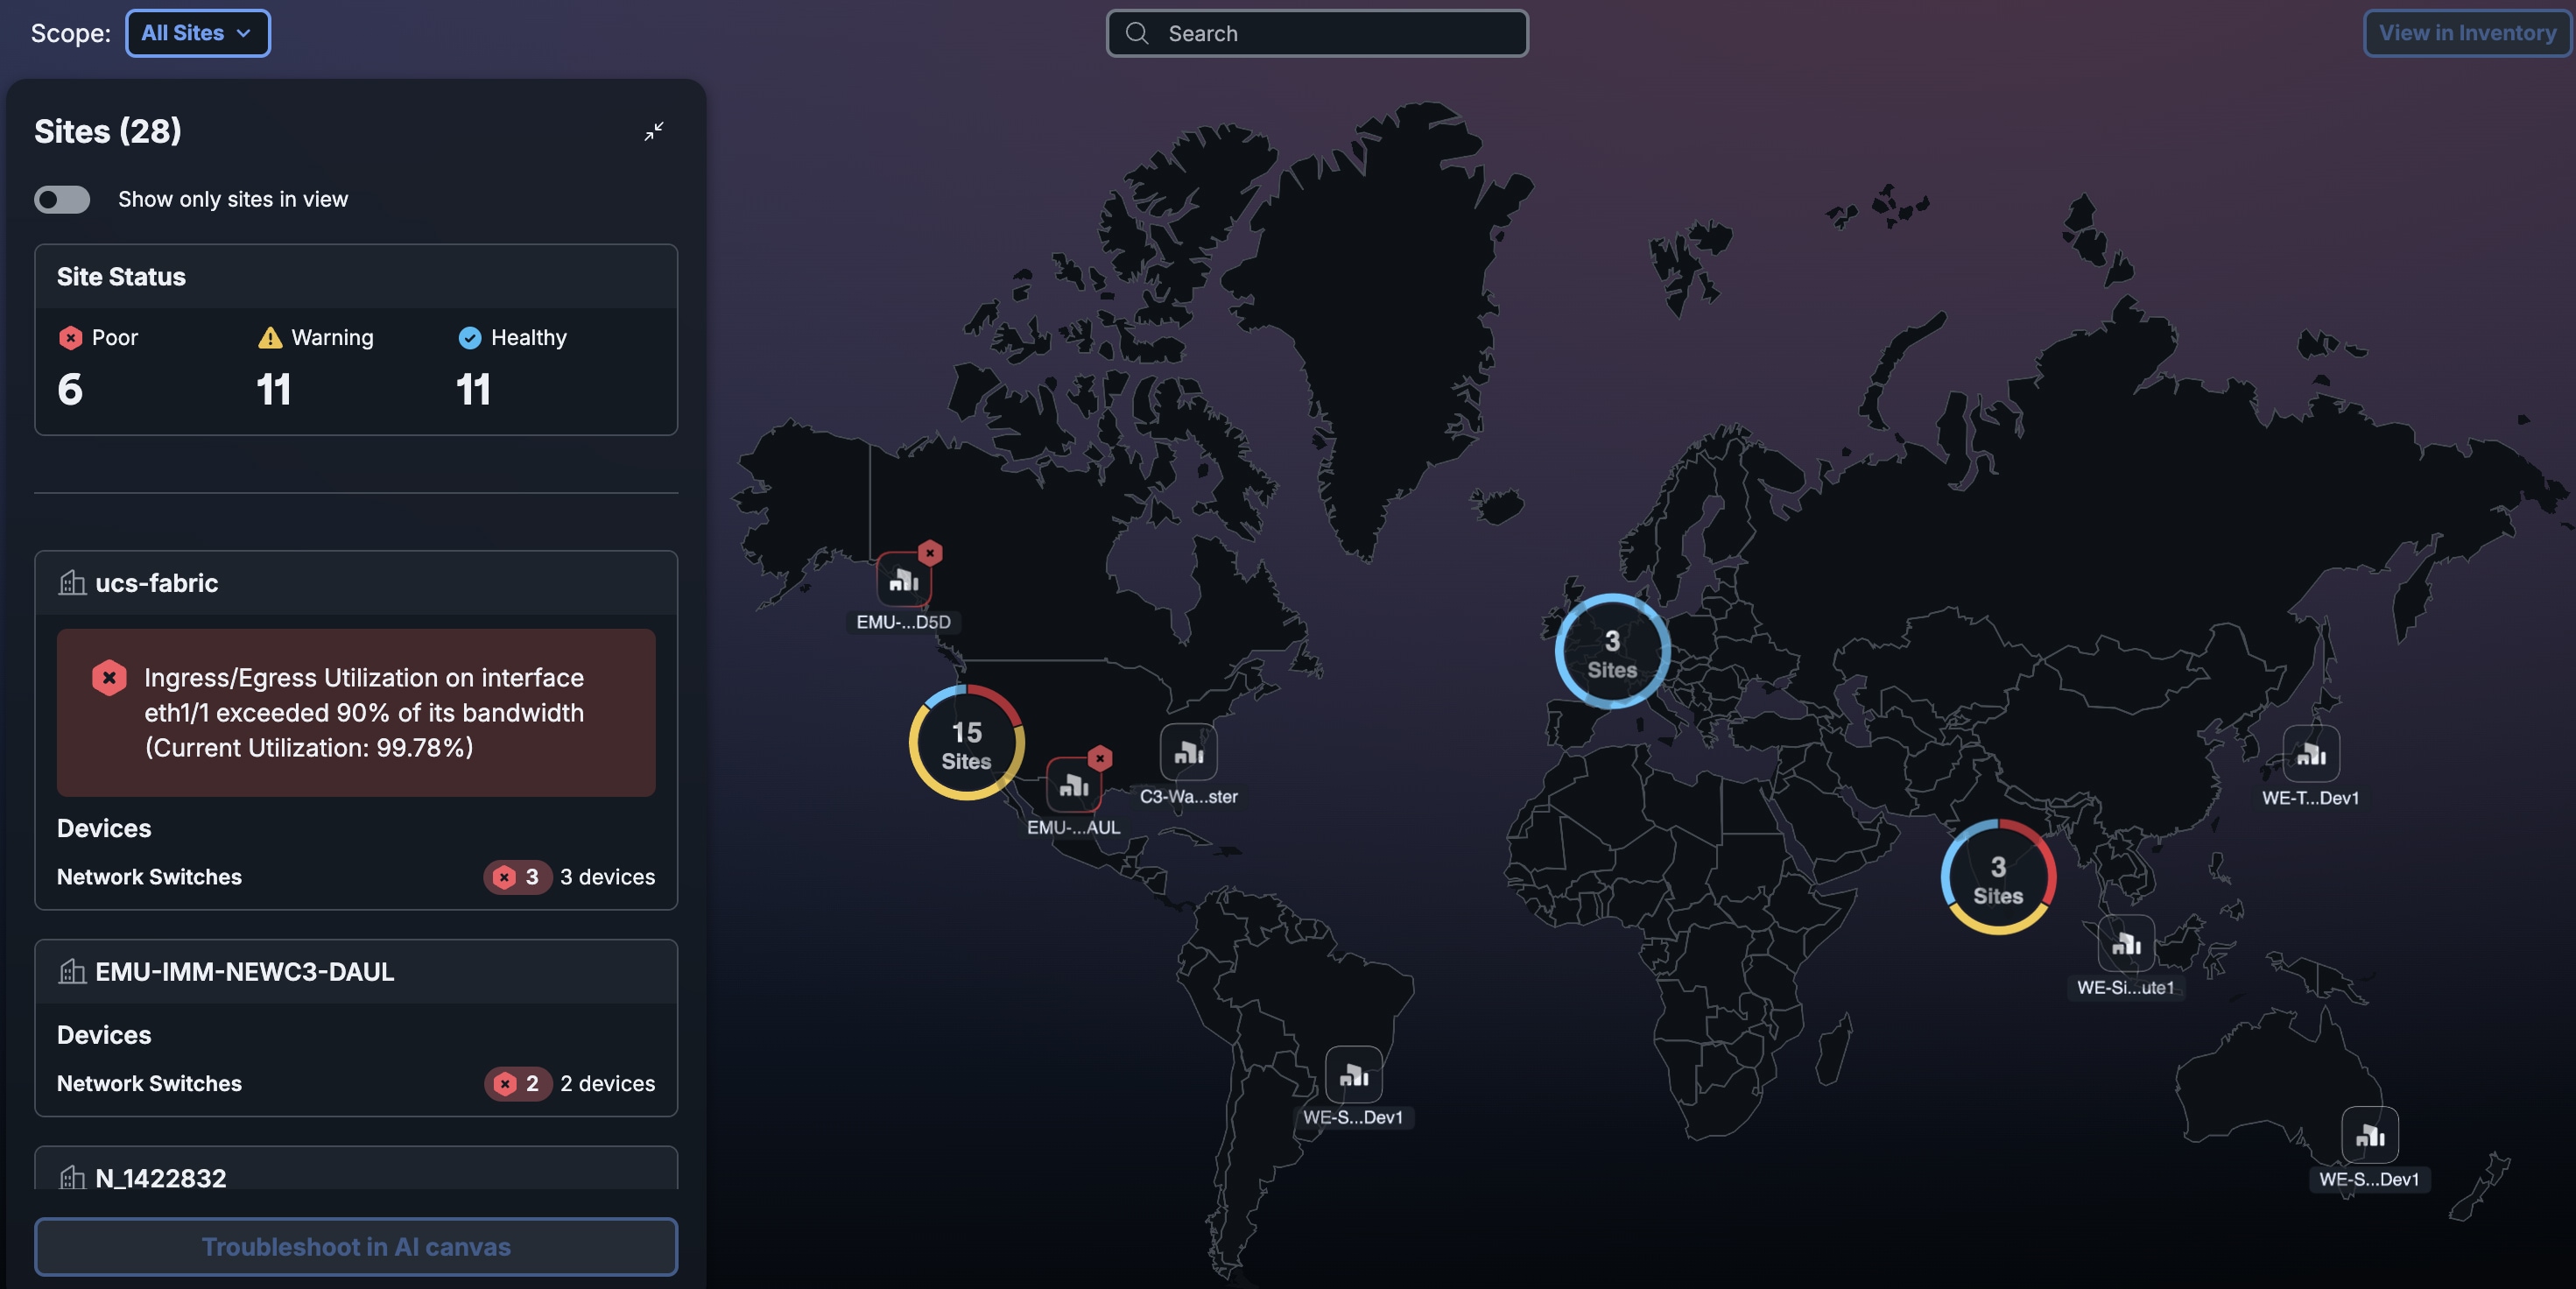
Follow these steps to open Topology and review the map.
-
Select the Main menu
 and choose Topology.
Sites lists the sites currently available in the active view. You can scroll through the list and select a site by name instead of looking for it on the map.
-
From the map, you can:
-
Zoom into sites to reveal individual nodes.
-
Select a site or device to open contextual details.
-
Review health indicators and warning states.
-
Focus on the sites that are currently visible on the map.
-
Search for a specific site or device.
-
Filter the map for nodes linked to one or more products.
-
Create a scope
Scopes help you limit the topology to the sites that matter for a specific workflow. This is useful when you want to isolate a region, customer environment, or operational area without losing the broader topology experience.
Follow these steps to create a scope.
-
Select the Main menu
and choose Topology. -
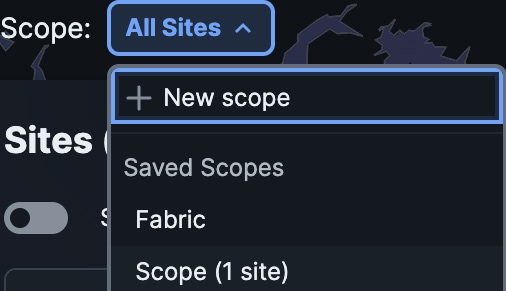
From All Sites, select New scope.
-
In Topology Scope, do these steps:
-
Enter a name for the scope.
-
Select the sites you want to add.
-
Select Create Scope.
You can access the scope from the Saved Scopes list in Scope.
-
Review topology
Review Topology for site and device details, layered connectivity, and health and alert information.
View site details
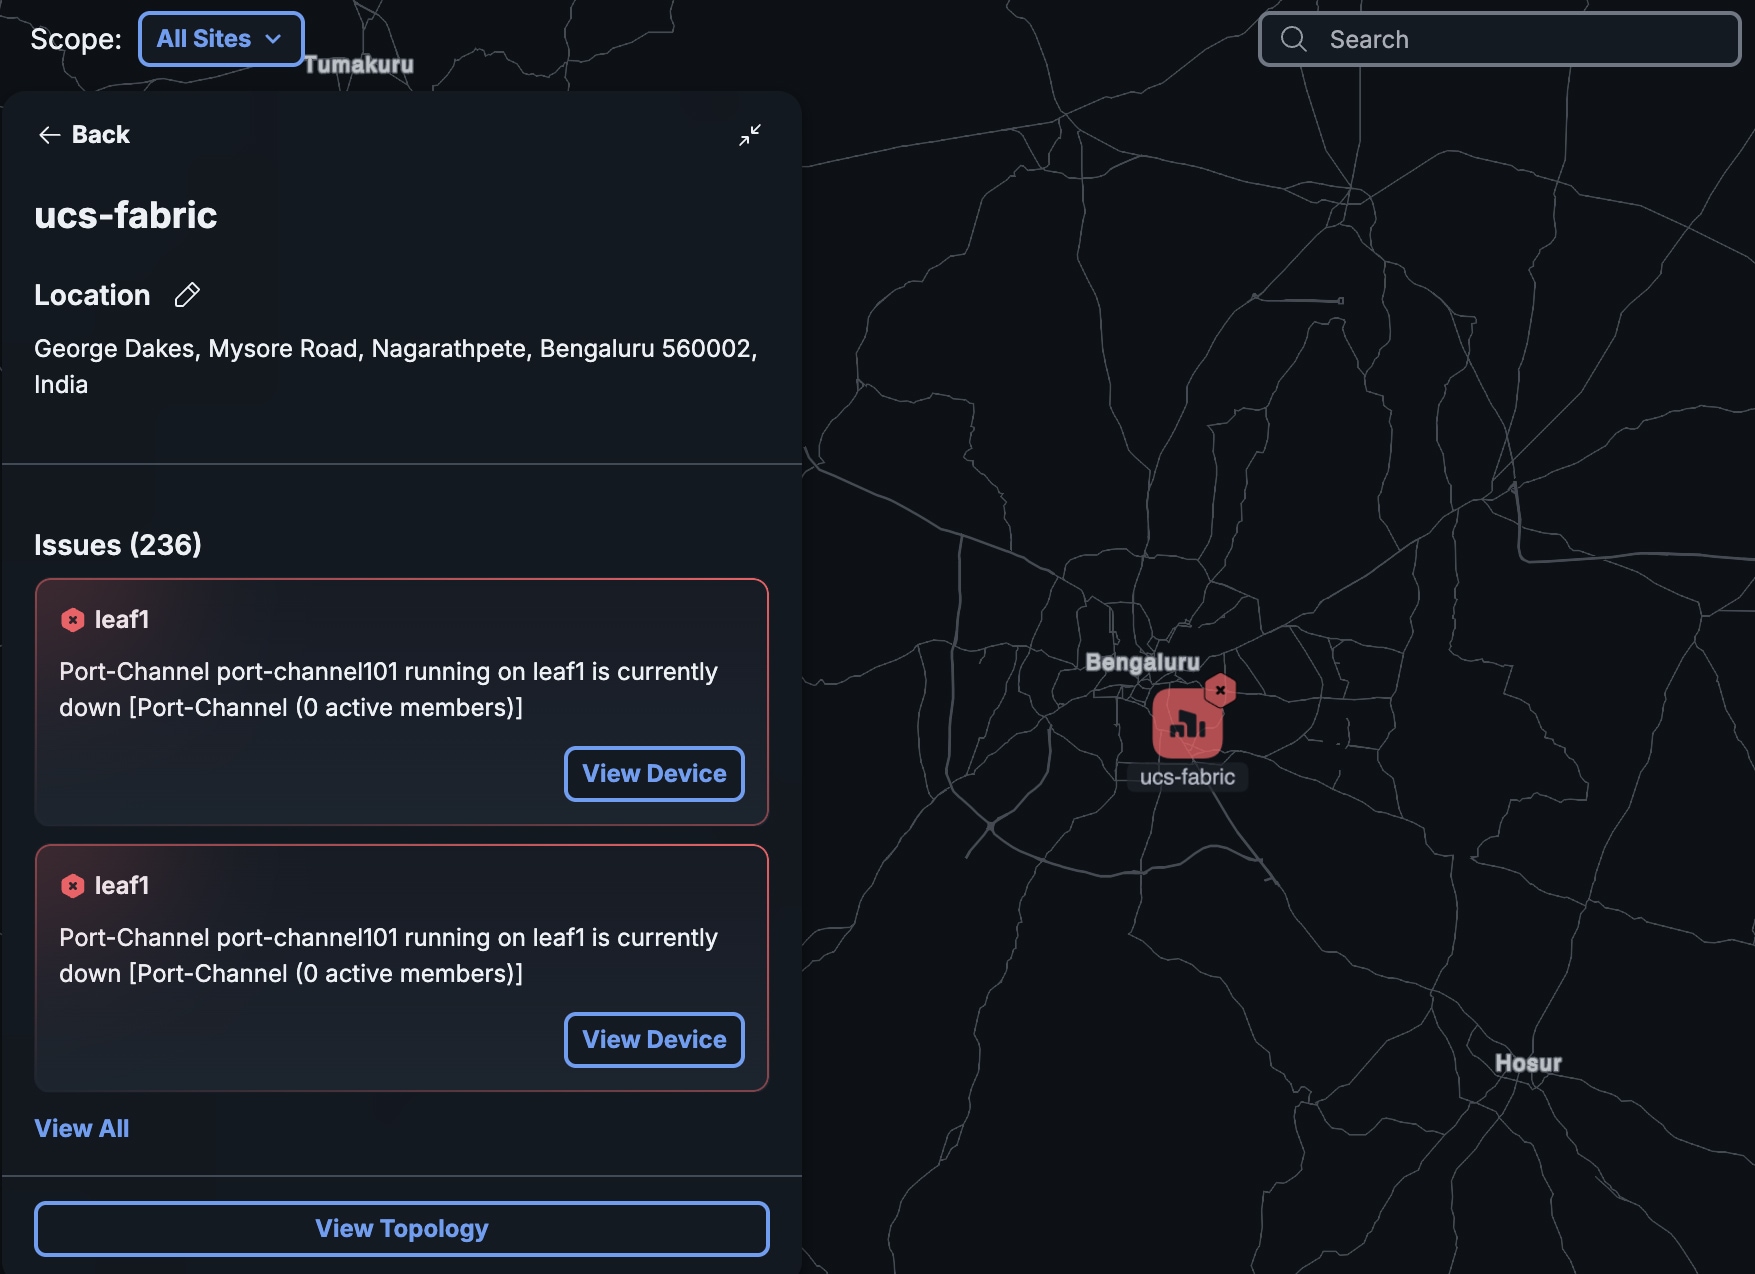
Follow these steps to view site details, including any active issues for that site.
-
Select the Main menu
and choose Topology. -
Select a site to view its details, including any active issues.
-
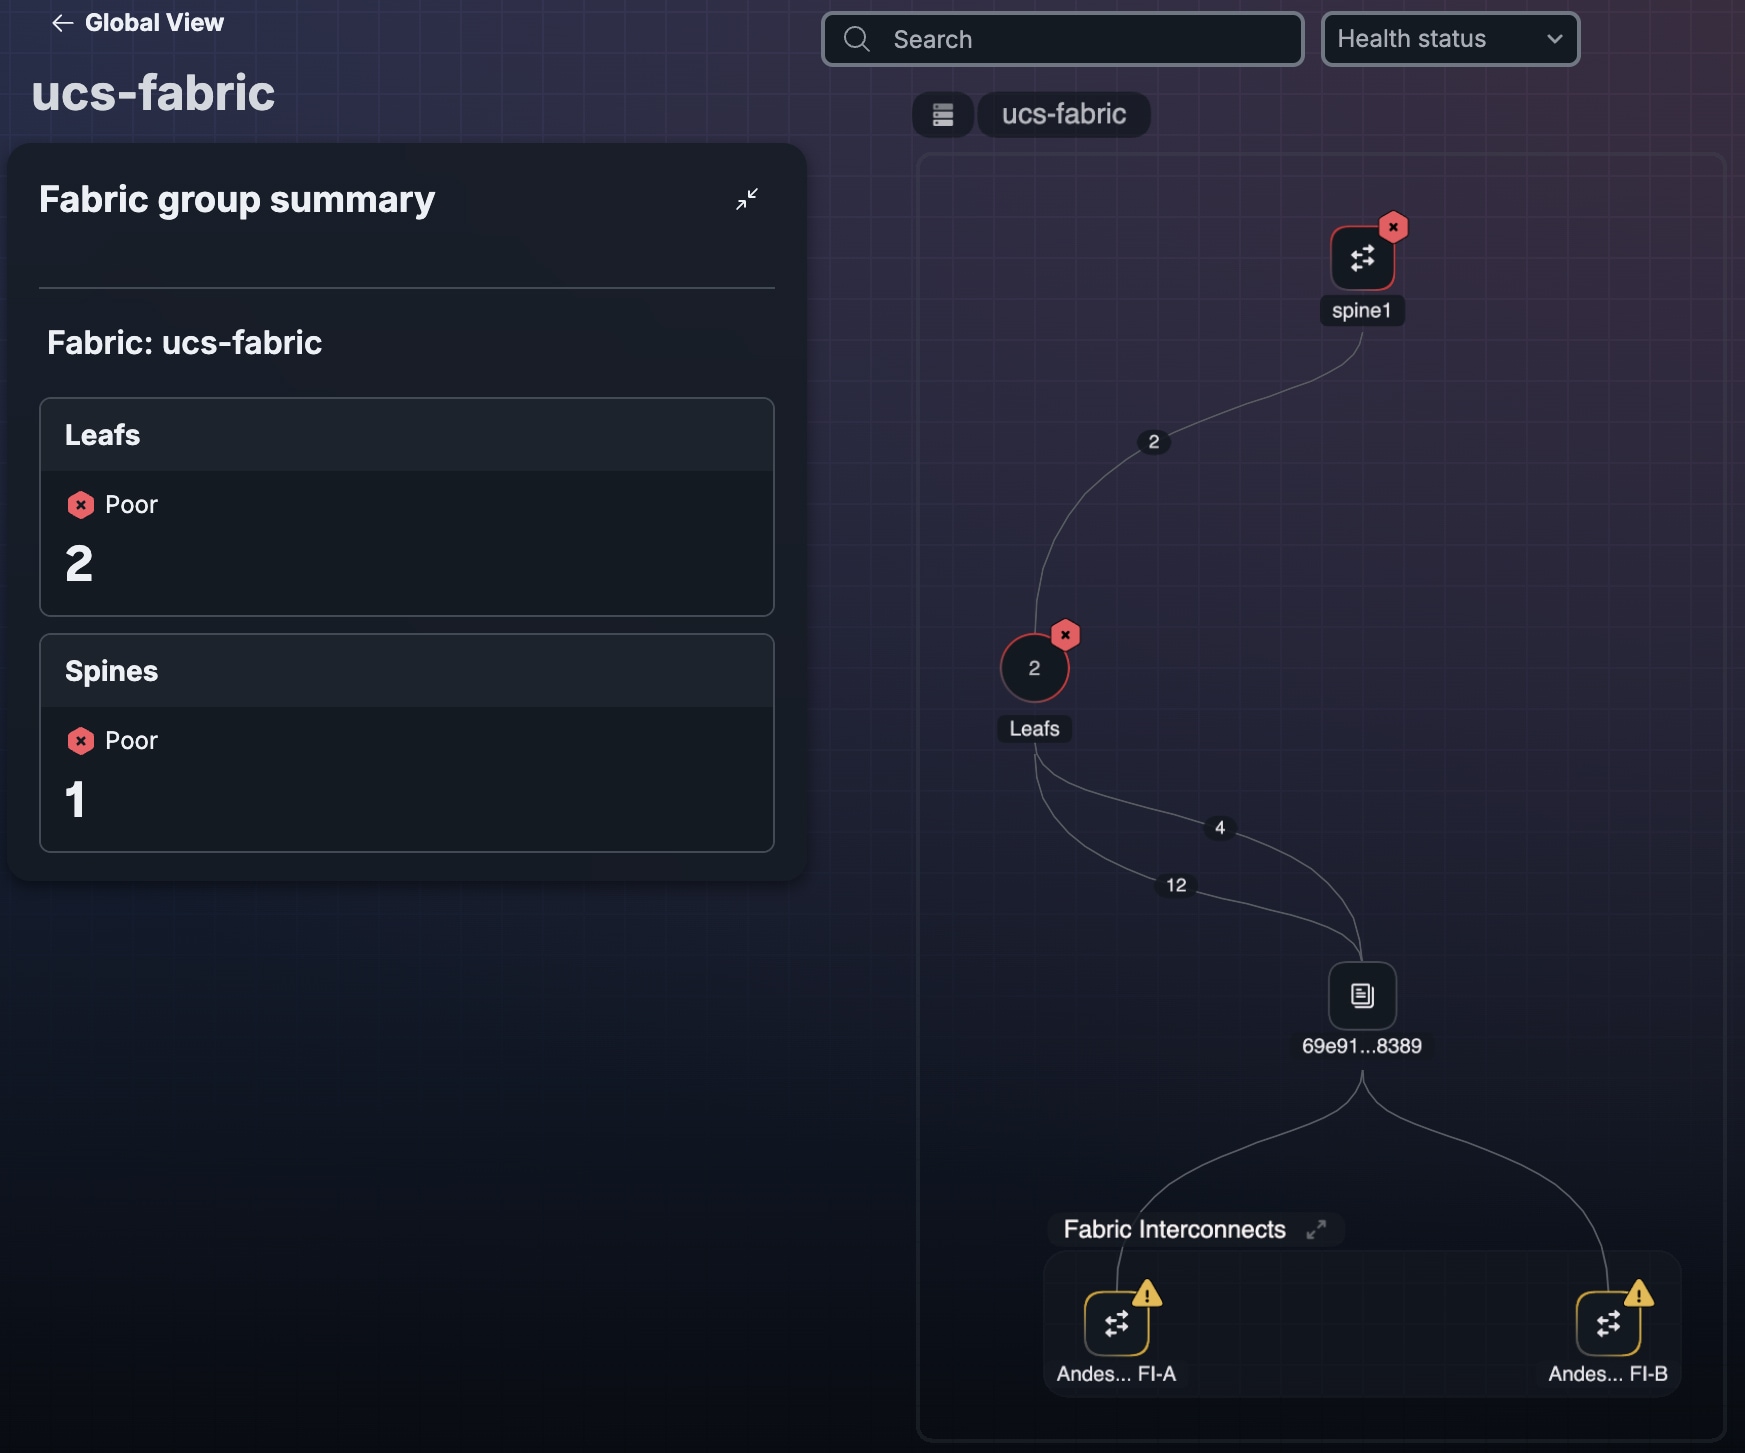
Select Open Device Topology.
The topology updates, displaying only the devices that belong to the site.
-
Select the layer you want to view:
-
L1 & L2: View physical connections and switched connectivity between devices in the site.
-
L3: View routed connectivity between devices in the site.
-
View Layer 3 connectivity
L1 & L2 topology shows how devices are physically cabled. Use L3 to see whether physically connected devices can route traffic to each other. This is helpful when troubleshooting, such as when you are isolating a reachability problem.
Follow these steps to view Layer 3 connectivity for a site.
-
Select the Main menu
and choose Topology. -
Select the site that you want to investigate.
-
Select Open Device Topology.
The L1 & L2 topology displays by default.
-
For Layer, select L3.
The map updates to show the routed connectivity, with each shared subnet displayed between the devices that use it.
-
Select a subnet to view more details, including the VRF and the attached interfaces.
-
Select a device to view its Layer 3 details.
View device details
Follow these steps to view metadata and related information for a device.
-
Select the Main menu
and choose Topology. -
Select the site with the device that you want to view.
-
Select Open Device Topology.
-
Select the layer you want to view.
-
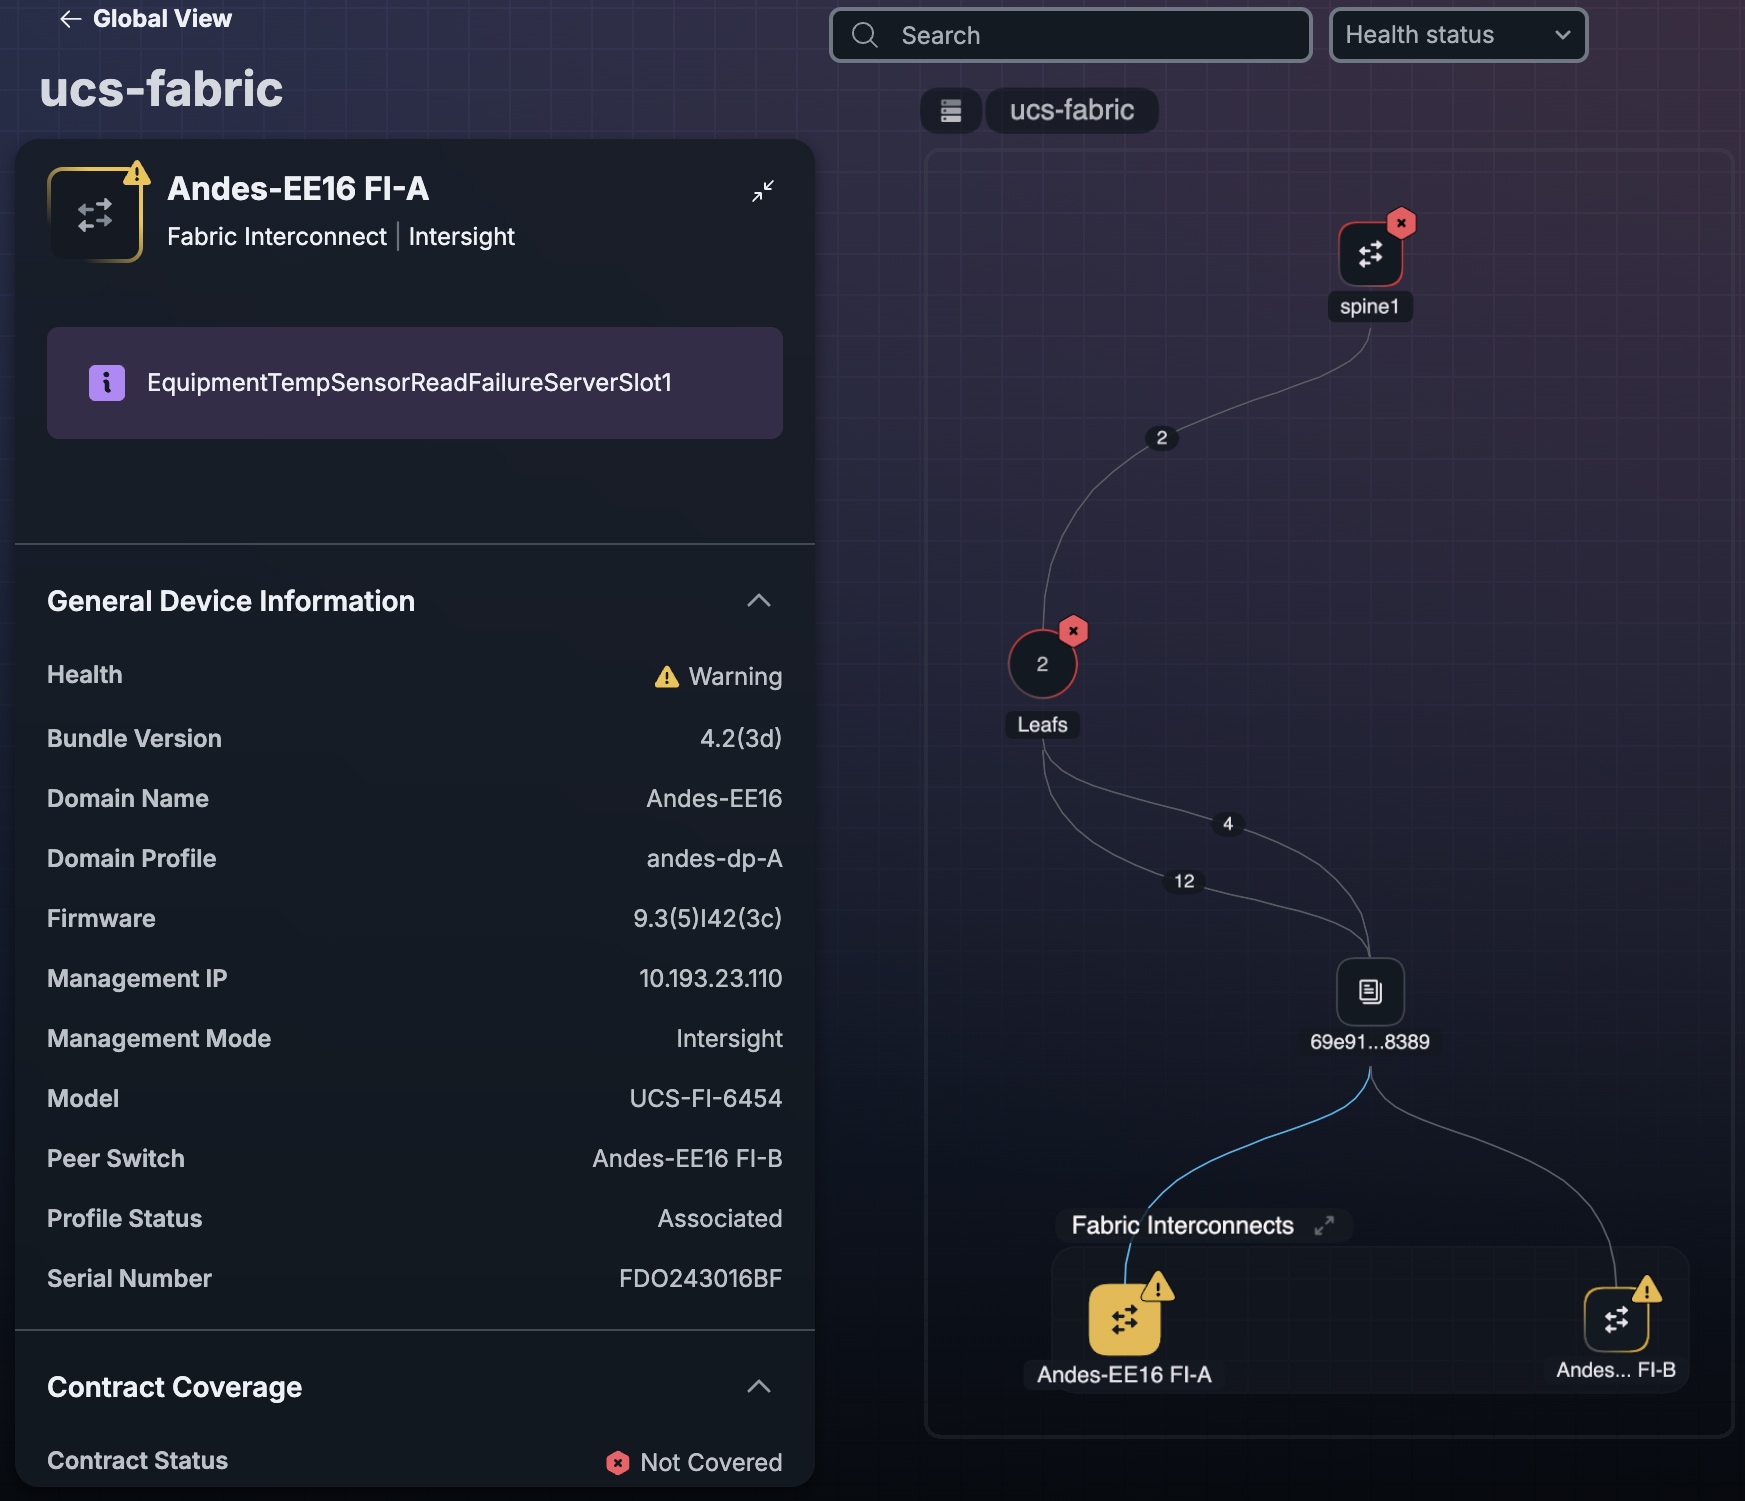
Select the device to view its details.
Metadata and related information for that device are displayed. Depending on the device type, selected layer, and topology context, general information, connected devices, and additional drill-down options are displayed.
Review topology health and alerts
Follow these steps to review topology health and alert details.
-
Select the Main menu
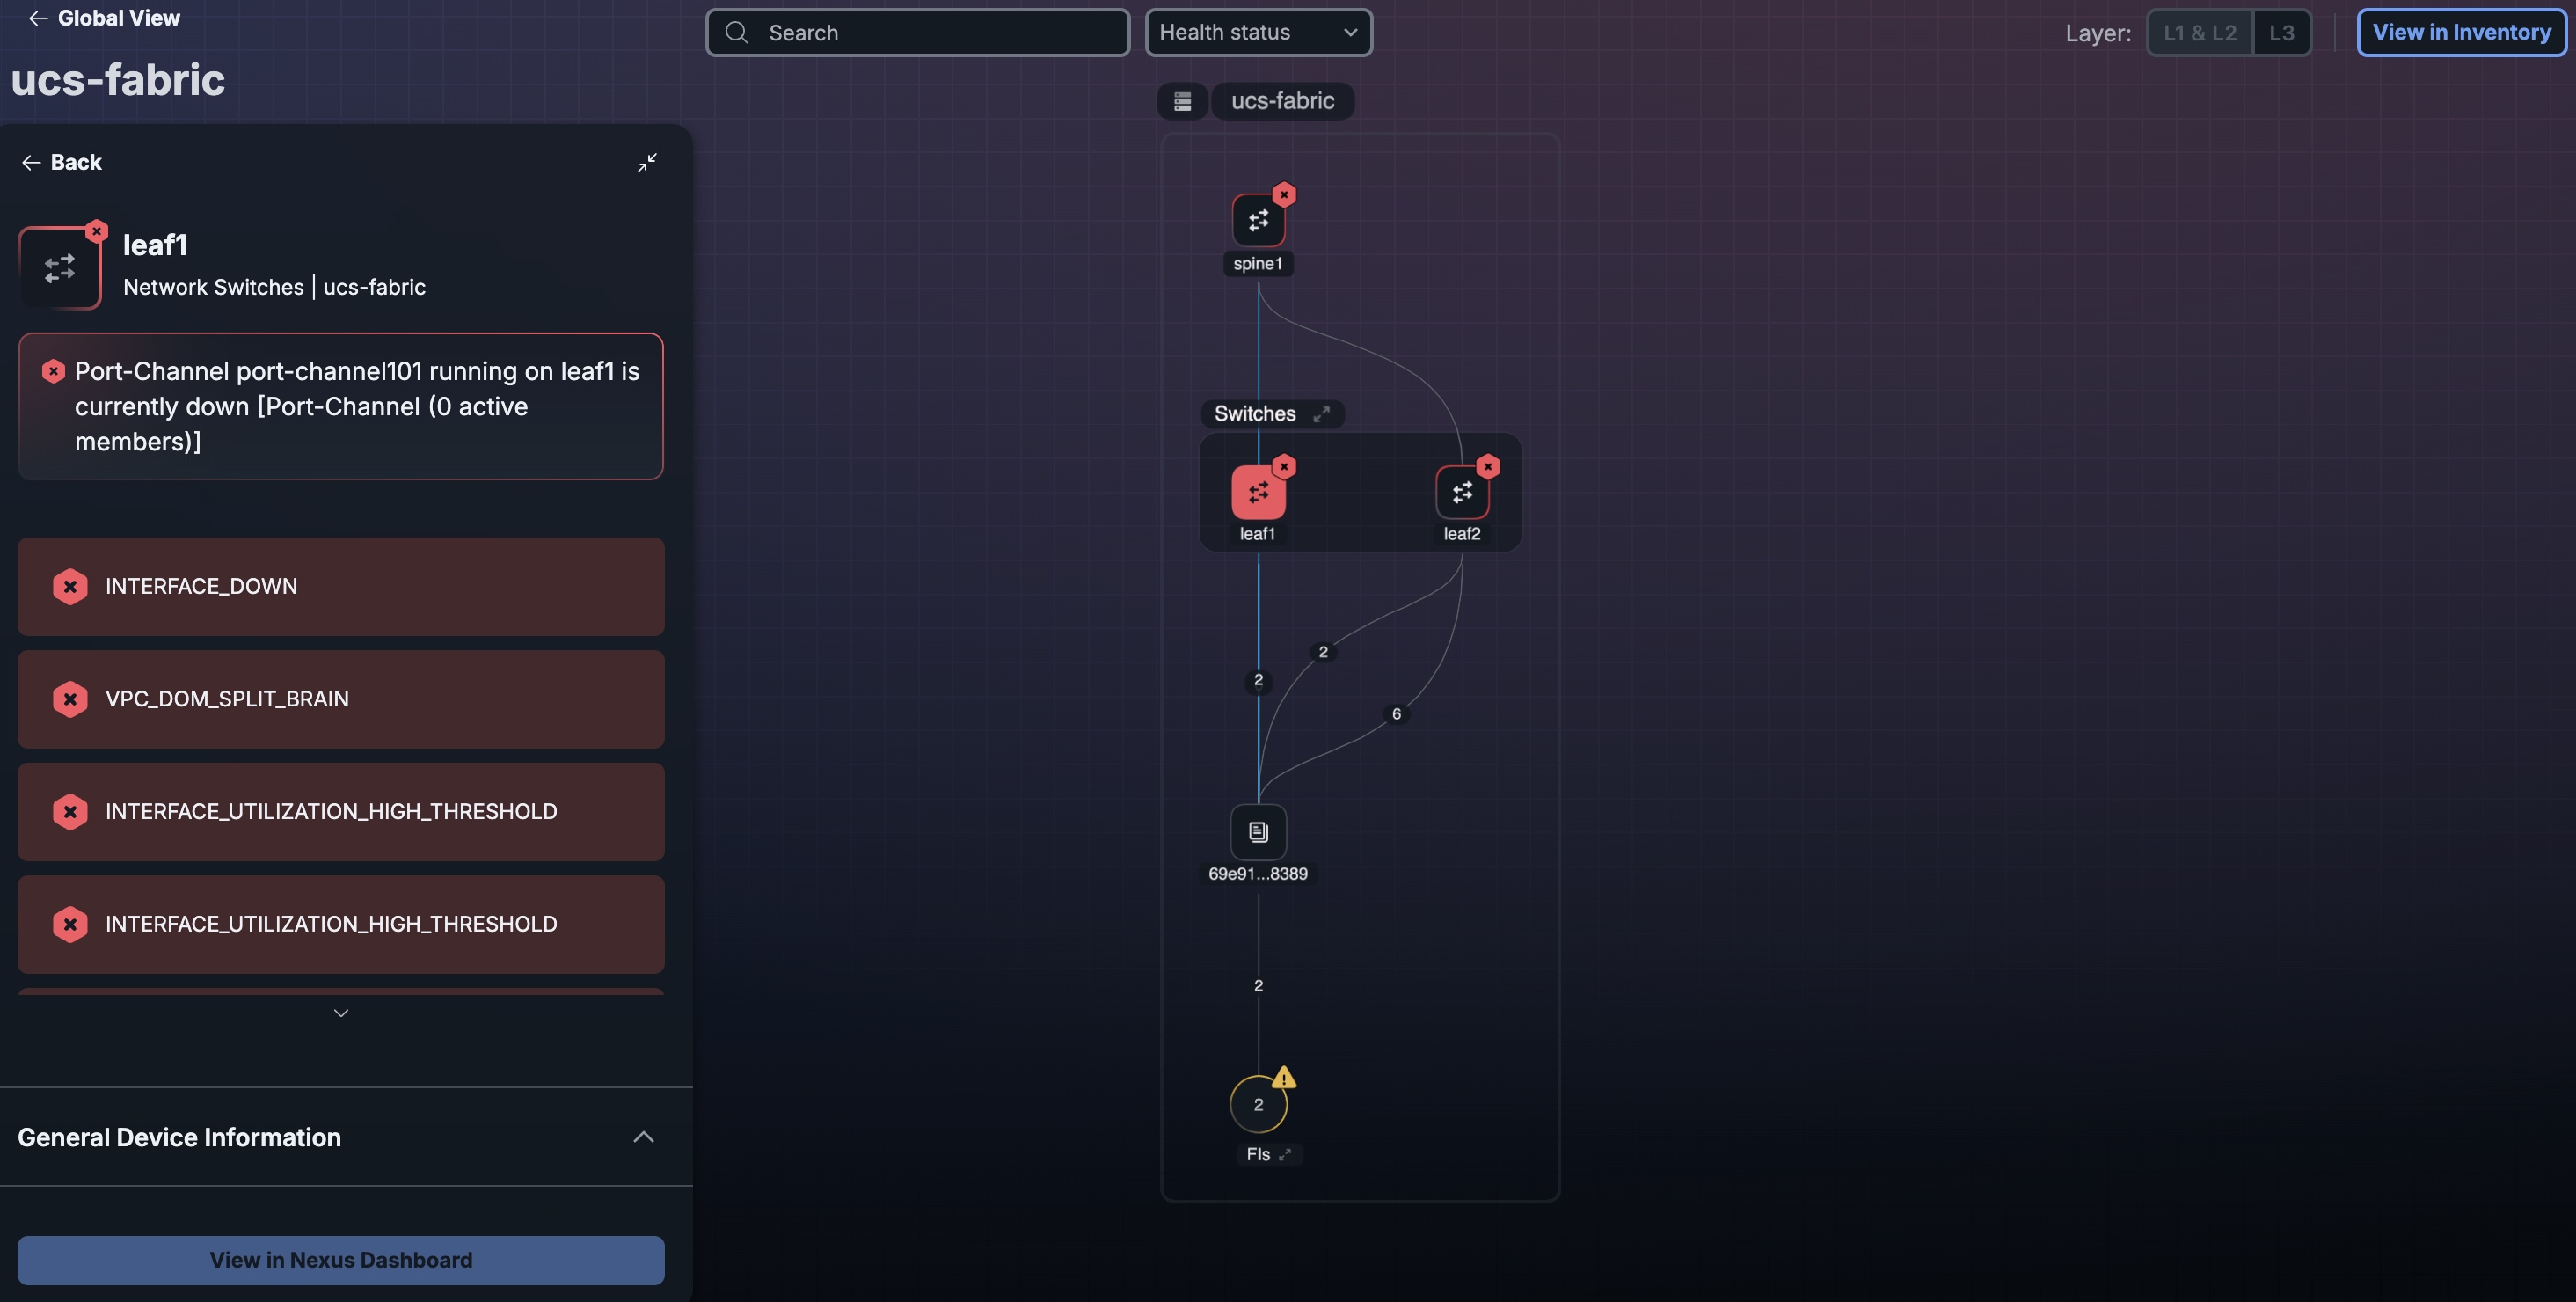
and choose Topology.Topology uses visual status indicators to highlight health conditions on devices. Site-level device breakdowns can also show which devices have issues. This information helps you identify areas that need attention before you drill further into device details.
-
Select a site to view site details, including device health conditions and alerts.
-
Select Open Device Topology.
-
View a device with issues using either method:
-
Select the device on the map.
-
Under Issues, select View Device for the impacted device.
-
Some alerts include resolution guidance and can direct you to a related troubleshooting page when the relevant workflow is available.
Manage topology
Manage Topology by adding devices that are missing from the topology data.
Add a missing device
Follow these steps to add a missing device.
-
Select the Main menu
and choose Topology. -
Select the site with the missing device.
-
Select Open Device Topology.
-
Select the device that the missing device should connect to, and select Add missing device.
-
If you want to add a device manually, do these steps:
-
Select Add manually.
-
In Name, enter the name of the missing device.
-
From Asset Type, select the asset type of the missing device.
-
Optionally, enter the device model in Device Model.
-
From Upstream device, select the upstream device that you want to connect to the missing device.
-
For Source port and Destination port, enter the physical port information.
-
For Link Speed, enter the link speed in Gbps.
-
-
If you want to add a device from Inventory, do these steps:
-
Select Add from inventory.
-
From Select a device, select the missing device.
-
From Upstream device, select the upstream device that you want to connect to the missing device.
-
For Source port and Destination port, enter the physical port information.
-
For Link Speed, enter the link speed in Gbps.
-
-
Select Add device.
The missing device now displays in the topology and is connected to the upstream device that you selected.
Use AI Insights
AI Insights identify sites and devices that need attention first and explain why each one was flagged.
Before you begin
Sites and devices must already be discovered in Topology. Insights are generated only for entities in Topology.
Review AI Insights across your network
Follow these steps to review the AI Insights across your network.
-
Select the Main menu
and choose Topology.By default, all sites are displayed.
-
Under Topology Recommendations, select View AI Insights.
-
Review the listed AI Insights.
Each insight is labeled with a severity of Critical, High, or Informational.
-
Select View details for an insight to learn more about the evaluation factors and the number of impacted devices and sites.
-
Under Impacted Sites, select an impacted site to view more details.
-
Under Impacted devices, select an impacted device to view the AI Insight reasoning and evidence.
Review AI Insights for a device
Follow these steps to review the AI Insights for a device.
-
Select the Main menu
and choose Topology. -
Select the site where the device is located.
-
Select Open Device Topology.
-
Select the device that you want to investigate.
-
Select View AI Insights.
-
Select View details for any insight to learn more about the reasoning and evidence.
Related workflows
Topology is connected to other Cisco Cloud Control experiences, so you can continue investigating the same object in the most relevant view. Supported navigation paths include:
-
Inventory > topology: From supported devices, you can open Topology with the selected device highlighted, making it easier to understand the device in context.
-
Topology > inventory: From an open site, you can continue investigating the same assets in Inventory:
-
With no device selected, Inventory displays the devices in that site.
-
With a device selected, Inventory displays the corresponding asset details.
-
-
Topology > product: For some objects, you can cross-launch the originating product (such as Meraki) when more detail is needed.