Understand Cisco CEE Observability and Splunk Integration
Available Languages
Contents
Introduction
This document describes Cisco Common Execution Environment (CEE) architecture, deployment, monitoring, Splunk integration, and OpenTelemetry.
Prerequisites
Requirements
Cisco recommends familiarity with these technologies:
- Cloud Native Deployment Platform (CNDP), Kubernetes namespaces, and pod placement.
- Cisco Subscriber Microservices Infrastructure (SMI) and the SMI Cluster Manager.
- CEE Ops Center, Prometheus, Grafana, Alertmanager, and log-forwarding components.
- Splunk HTTP Event Collector (HEC), syslog, and packet capture with tcpdump.
- OpenTelemetry Protocol (OTLP) and the OpenTelemetry Collector for the newer gateway integration.
Components Used
The examples show a Kubernetes-based Cisco SMI/CNDP environment with CEE and an associated Session Management Function (SMF) application. The software-definition example refers to CEE package 2026.01.1.08; the Ops Center example uses an SMF repository identifier smf-2026.04.m0.i50. These are example values, not deployment requirements.
Network endpoints, cluster names, and namespace values must be replaced with values approved for the target deployment.
The information in this document was created from the devices in a specific lab environment. All of the devices used in this document started with a cleared (default) configuration. If your network is live, ensure that you understand the potential impact of any command.
Background Information
Cisco Common Execution Environment (CEE) is part of Cisco Subscriber Microservices Infrastructure (SMI). In a Kubernetes-based CNDP deployment, Kubernetes namespaces separate platform services, CEE observability and Kubernetes management services, and SMF application workloads. The separation provides administrative and operational boundaries while Kubernetes networking and service discovery allow permitted component communication.
This document covers namespace architecture, CEE workloads, CEE installation and lifecycle management, CEE Ops Center, alerts and Simple Network Management Protocol (SNMP), Cisco Integrated Management Controller (CIMC) alerts, log forwarding, bulk statistics, and the OpenTelemetry system gateway.
Splunk HEC on Transmission Control Protocol (TCP) port 8088 and syslog over User Datagram Protocol (UDP) port 5140 are independent ingestion mechanisms. The two paths have different configuration, transport, and troubleshooting requirements and can coexist.
Architecture Overview
CEE and the associated application functions occupy separate Kubernetes namespaces. The architecture differentiates Kubernetes platform services from CEE observability and management functions and from the SMF application domain.
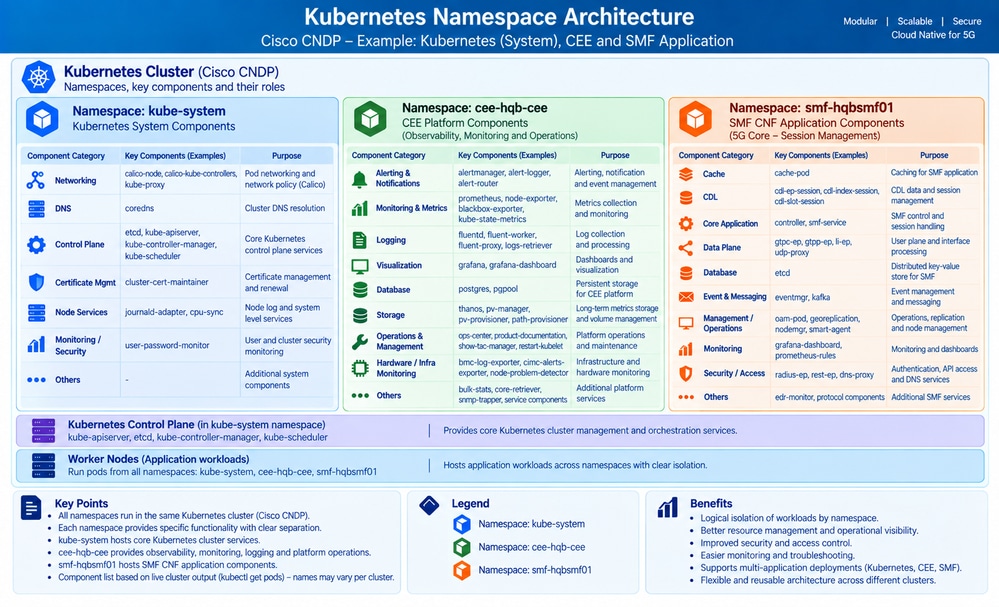 Cisco SMI namespace architecture showing CEE and application platform separation
The CEE namespace is the main focus of the service-level architecture. Other namespaces provide the Kubernetes platform, networking functions, and SMF workloads.
CEE Namespace Workloads
The CEE namespace hosts microservices for monitoring, alerting, logging, dashboards, statistics, and operational access.
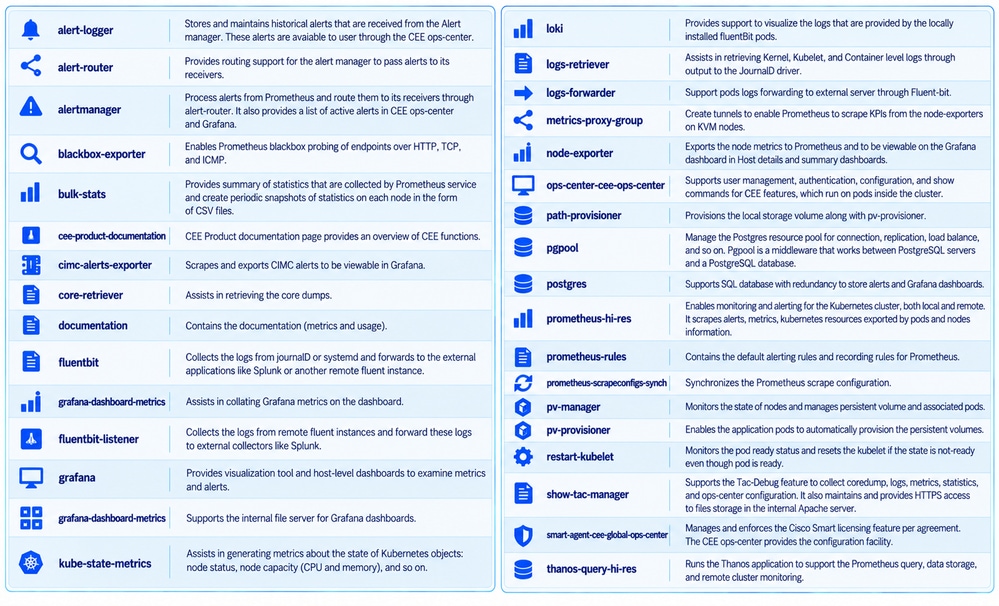 CEE namespace microservices and the functions of its operational workloads
These functions include Prometheus metrics collection, Grafana visualization, Alertmanager alert handling, log-forwarding services, and periodic bulk-statistics creation. Individual workloads vary by release and deployment configuration.
CEE Installation and Lifecycle Management
The SMI Cluster Manager separates the software artifact definition from the target cluster and its Ops Center configuration. This enables controlled software versioning and repeatable cluster synchronization.
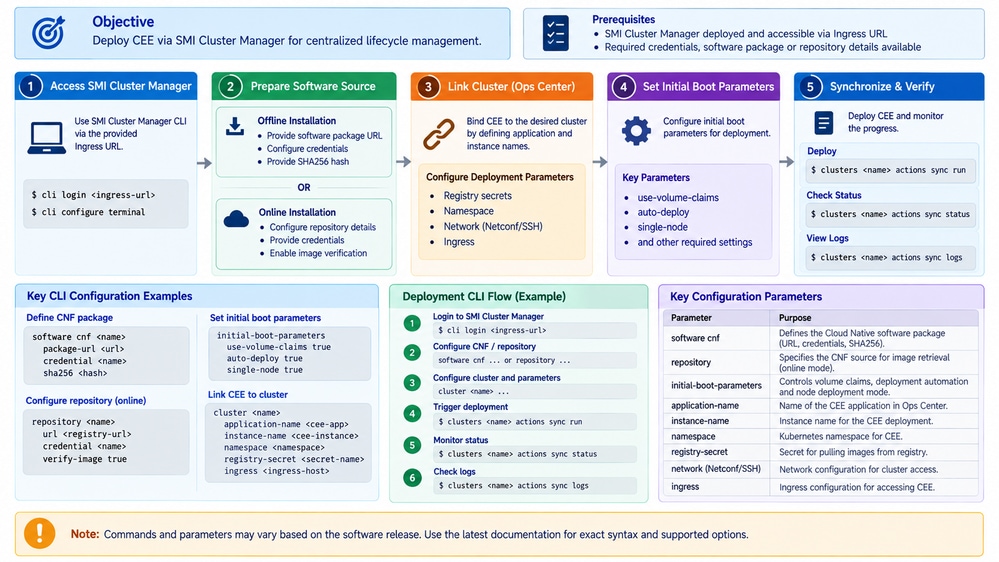 SMI Cluster Manager CEE installation and software synchronization architecture
Installation Modes
- Offline installation can refer to a local software package through a file URL and a Secure Hash Algorithm 256-bit (SHA-256) hash.
- Cluster configuration associates the CEE/SMF deployment with the intended cluster and Ops Center instance.
Define the CEE Software Artifact
In the SMI Cluster Manager configuration, identify the local CEE software package and its SHA-256 hash.
software cnf cee
  url file:///data/software/images/cee-2026.01.1.08.tar
  sha256 <CEE-SHA256-HASH>
exit
Use the exact SHA-256 value from the approved package. The placeholder in the command is intentional and does not represent an actual checksum.
Configure the Cluster and Ops Center
The source configuration associates a cluster with an SMF Ops Center, local repository, management endpoints, and deployment settings. Site-specific identifiers are replaced with placeholders.
clusters <cluster-name>
  ops-centers smf <smf-ops-center-name>
    app-name-override cn
    repository-local smf-2026.04.m0.i50
    sync-default-repository true
    netconf-ip <NETCONF-IP>
    netconf-port 2029
    ssh-ip <SSH-IP>
    ssh-port 2028
    initial-boot-parameters use-volume-claims true
    initial-boot-parameters auto-deploy false
    initial-boot-parameters single-node false
  exit
exit
| Parameter | Meaning in the example configuration |
|---|---|
| ops-centers smf <smf-ops-center-name> | Associates the cluster with the SMF Ops Center instance. |
| repository-local | Specifies the application repository and version for deployment. |
| sync-default-repository true | Uses the configured default repository during synchronization. |
| netconf-port 2029 | Specifies the NETCONF management connectivity port. |
| ssh-port 2028 | Specifies the Secure Shell (SSH) management connectivity port. |
| use-volume-claims true | Enables use of volume claims for persistent storage requirements. |
| auto-deploy false | Disables automatic deployment so synchronization and validation remain under explicit control. |
| single-node false | Specifies a deployment that is not in single-node mode. |

Note: The package and repository identifiers are examples from the source configuration. Confirm release compatibility and endpoint values before using them in a different cluster.
Synchronize and Verify the Deployment
Run the cluster synchronization action after the software and Ops Center configuration are ready.
clusters <cluster-name> actions sync run
Inspect the synchronization status and logs.
clusters <cluster-name> actions sync status
clusters <cluster-name> actions sync logs
Confirm that the synchronization completes successfully and that the expected CEE pods and services are deployed.

Caution: Cluster synchronization and software deployment can change the running environment. Apply changes according to the approved maintenance and deployment procedure.
CEE Ops Center and Operational Management
CEE Ops Center provides the operational interface for CEE services. The workload supports user management, authentication, configuration, and show commands for CEE functions within the cluster. The SMI Cluster Manager associates the Ops Center with the target deployment through the management configuration.
Ops Center belongs to the management plane. Prometheus, Alertmanager, Fluent Bit/fluent-proxy, HEC, syslog, and OpenTelemetry belong to the monitoring and telemetry paths. Keeping these responsibilities separate simplifies troubleshooting.
CEE Observability Architecture
CEE observability includes metrics, alerting, logs, CIMC alerts, and bulk statistics. These services are related, but the data paths and consumers are different.
| Function | Primary purpose | Typical destination or consumer |
|---|---|---|
| Metrics | Collect and query time-series measurements from nodes, Kubernetes, and services. | Prometheus, Grafana, and Thanos. |
| Alerts | Evaluate alert rules and route alert events. | Alertmanager, alert-router, Ops Center, and external receivers. |
| Logs | Forward log and event records to external collectors or backends. | Splunk and other log collectors. |
| CIMC alerts | Export Cisco Integrated Management Controller alerts for monitoring. | CEE metrics/alerting and Grafana. |
| Bulk statistics | Create periodic statistical snapshots. | CSV snapshots and downstream processing or analysis. |
Splunk Integration: Log-Transfer Architecture
The source describes two CEE-to-Splunk paths. Both can deliver events to Splunk, but they use distinct protocols and ingestion interfaces.
CEE
  |-- logging splunk --> HEC / TCP 8088 --> Splunk HEC input
  |
  +-- logging syslog --> RFC 5424 / UDP 5140 --> Splunk syslog input
The event types carried by each path depend on the CEE configuration and implemented forwarding pipeline. Two configured interfaces do not establish that each carries a mutually exclusive category of events.
Trace the paths separately. Successful HEC delivery does not confirm syslog delivery, and successful syslog delivery does not confirm HEC delivery.
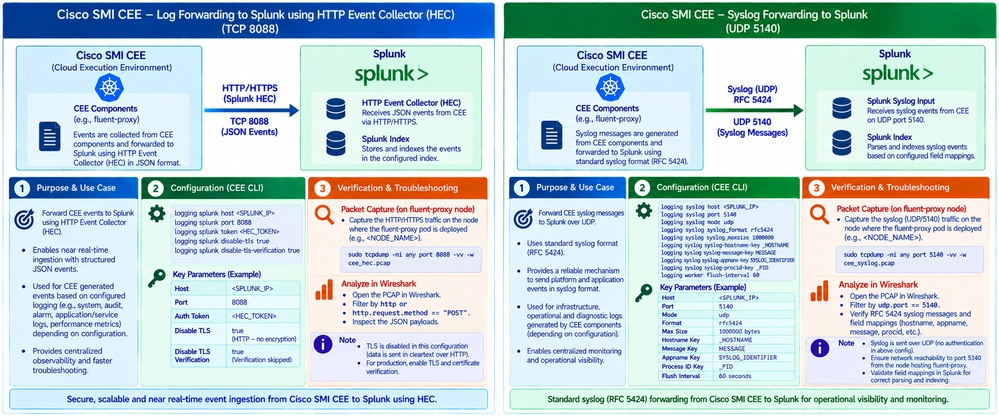 CEE Splunk integration with separate HEC and syslog forwarding paths
Splunk HTTP Event Collector Forwarding
Splunk HEC accepts HTTP event submissions and uses an HEC authentication token. CEE forwards events directly to the configured HEC service instead of requiring file-based ingestion for this path.
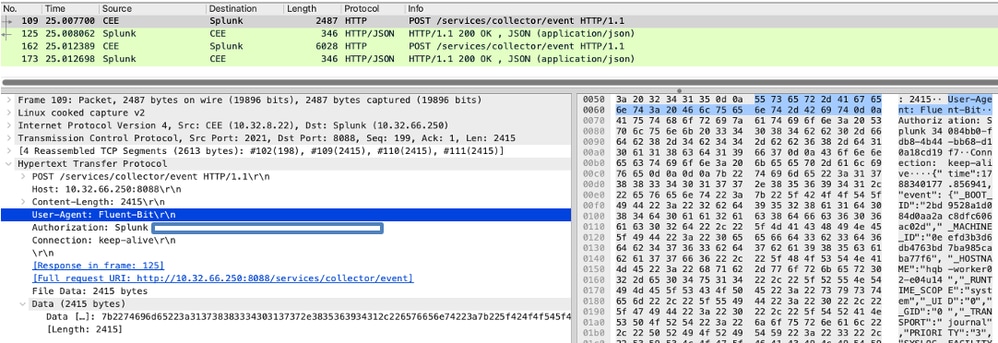 CEE to Splunk HTTP Event Collector forwarding architecture on TCP port 8088
HEC Configuration Model
The original lab example contains these settings for a CEE Splunk endpoint. The excerpt records the source behavior and is not a recommended production configuration.
Caution: The source example disables both TLS and certificate verification. This exposes telemetry and HEC credentials to interception on the network. For production, enable TLS and certificate verification and secure the HEC authentication token according to the supported CEE release configuration.
logging splunk
  <CEE-specific HEC endpoint and authentication parameters>
  disable-tls true
  disable-tls-verification true
In the source architecture, CEE log/event producers forward through the relevant Fluent forwarding component to the HEC destination.
CEE log or event source
  |
  v
CEE forwarding service / fluent-proxy
  |
  +-- HTTP(S) HEC over TCP 8088 --> Splunk HEC endpoint
                                      |
                                      v
                             Splunk ingestion tier
                                      |
                                      v
                             Splunk indexing tier
Capture and Troubleshoot HEC Traffic
Identify the fluent-proxy pod and its Kubernetes worker node in the CEE namespace when fluent-proxy carries the HEC traffic.
kubectl get pods -n <cee-namespace> -o wide | grep fluent-proxy
On the Kubernetes node that carries the HEC traffic, capture packets for the HEC port.
tcpdump -ni any port 8088 -vv -w splunk_hec.pcap
For a TLS-enabled connection, a packet capture reveals transport establishment and destination details but does not normally expose the HTTP payload. If TLS is disabled, event contents and authentication material can be visible in the capture.
Caution: Packet captures and logs can contain sensitive telemetry and credentials. Restrict collection and transfer to authorized support workflows and protect capture files.
Syslog Forwarding over UDP 5140
The second Splunk integration path forwards syslog records using RFC 5424 formatting and UDP port 5140. The source configuration also defines field mappings, maximum message size, and the worker flush interval.
logging syslog host <SPLUNK-IP>
logging syslog port 5140
logging syslog mode udp
logging syslog syslog_format rfc5424
logging syslog syslog_maxsize 1000000
logging syslog syslog-hostname-key _HOSTNAME
logging syslog syslog-message-key MESSAGE
logging syslog syslog-appname-key SYSLOG_IDENTIFIER
logging syslog syslog-procid-key _PID
logging worker flush-interval 60
RFC 5424 Field Mapping
| CEE source field | Syslog field or purpose |
|---|---|
| _HOSTNAME | Identifies the originating host in the generated syslog record. |
| MESSAGE | Carries the log-message body. |
| SYSLOG_IDENTIFIER | Provides the syslog application or program identifier. |
| _PID | Carries the originating process identifier. |
UDP Transport and Packet Capture
UDP is connectionless and provides neither transport delivery acknowledgment nor retransmission. Troubleshooting must account for packet loss, routing, maximum transmission unit (MTU), fragmentation, receiver availability, and queue/rate behavior.
On the interface or Kubernetes node that carries the syslog traffic, run:
tcpdump -ni any udp port 5140 -vv -w splunk_syslog.pcap
If fluent-proxy forwards the syslog traffic, the node hosting that component is an appropriate packet-capture point. Verify the forwarding path before collecting packets.
Note: RFC 5424 defines a syslog message format independently of the selected transport. The source scenario uses UDP 5140. TLS-based syslog transport is a different option that requires compatible sender and receiver configuration.
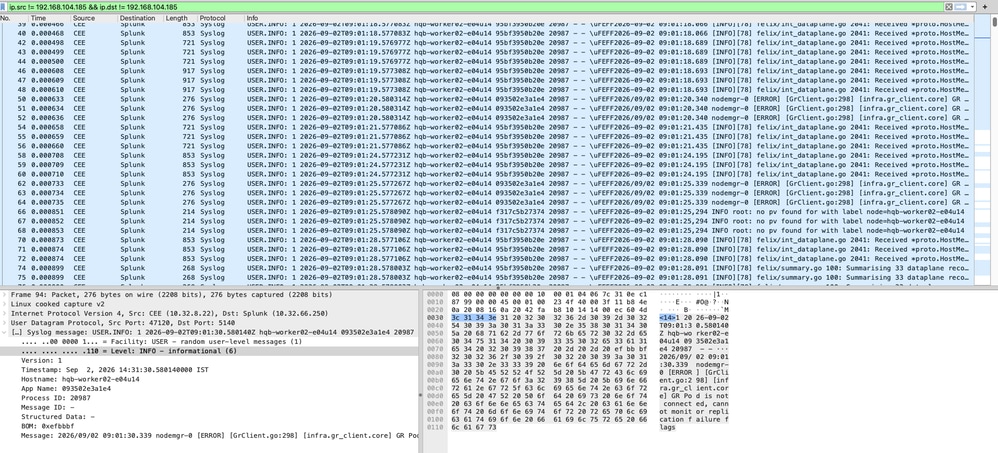 CEE syslog forwarding to Splunk using UDP port 5140 and RFC 5424 fields
Alerts, SNMP, and CIMC Observability
CEE alerting uses Prometheus and Alertmanager. Prometheus evaluates metrics and alert rules. Alertmanager routes alert events to receivers, with alert-router providing additional routing support. CEE alert-logger provides historical alert records for retrieval through CEE Ops Center.
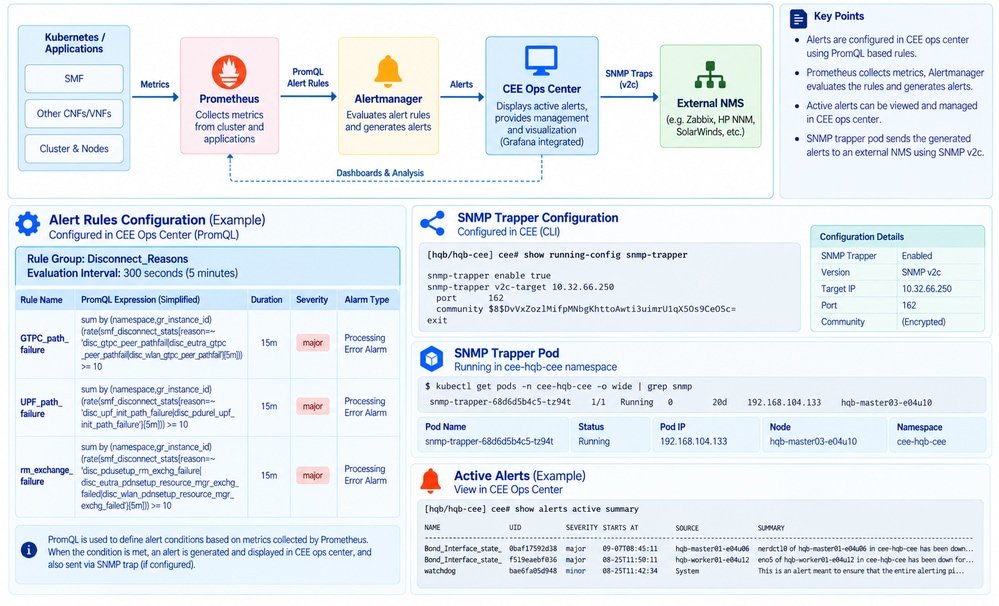 CEE Prometheus and Alertmanager alert forwarding and SNMP architecture
CIMC alert integration provides a related infrastructure monitoring path. The cimc-alerts-exporter collects CIMC alert information and exposes it for monitoring and visualization in Grafana.
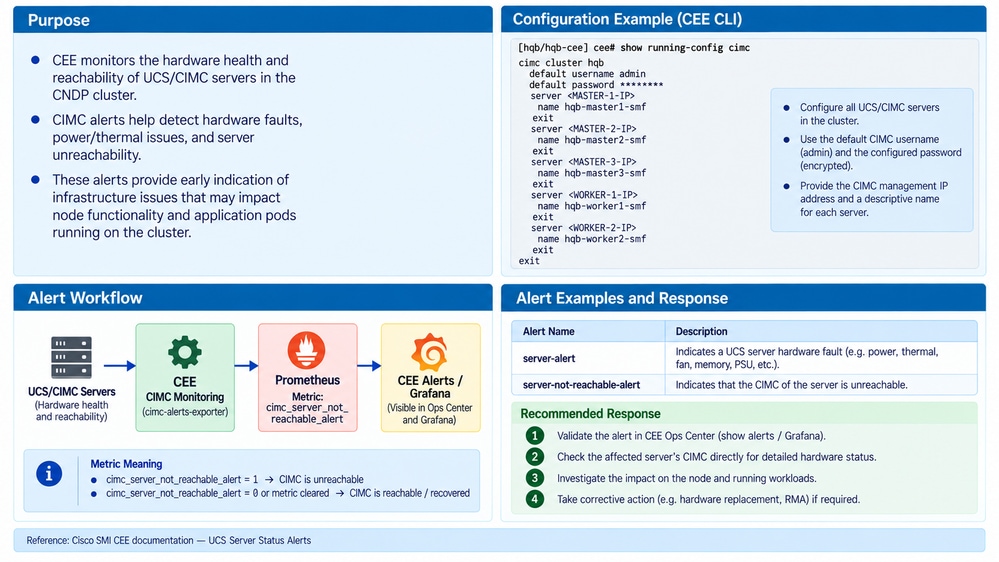 CEE CIMC alerts exporter integration with monitoring dashboards
SNMP integration is an alert and management interface; it is not interchangeable with either Splunk HEC or syslog forwarding. The protocol and event-delivery paths remain distinct.
Relevant Management Information Base (MIB) references include CISCO-CNEE-MIB.my and CISCO-SMI.my.
Bulk Statistics
The CEE bulk-stats service creates periodic Comma-Separated Values (CSV) snapshots of statistics collected through Prometheus. These are statistical snapshots rather than streams of application log records.
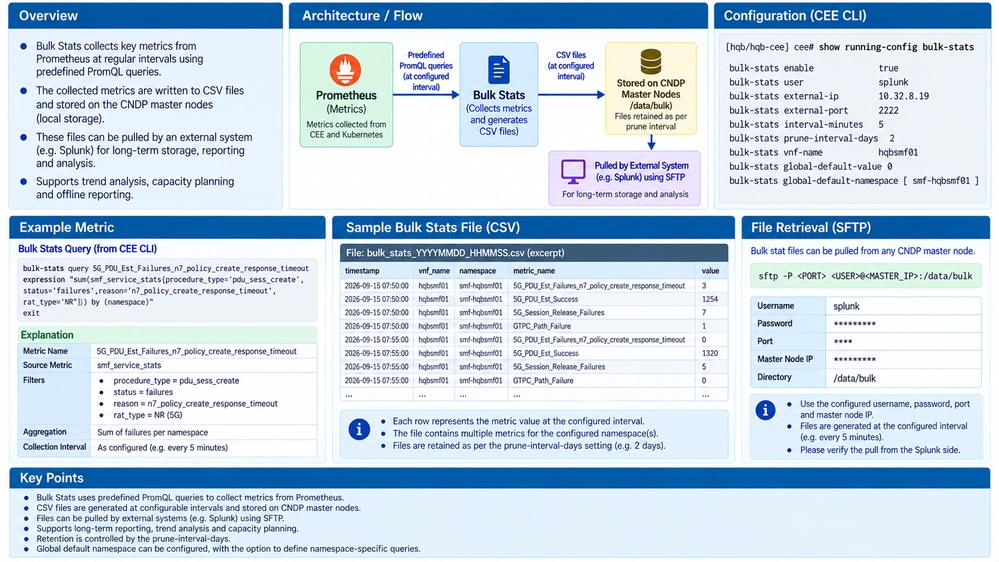 CEE bulk statistics service creating periodic CSV snapshots from Prometheus metrics
Bulk-statistics output supports periodic reporting, trend analysis, and downstream data processing. Include it in a Splunk integration path only when the deployment explicitly forwards or imports CSV/statistics data to Splunk.
OpenTelemetry System Gateway
Newer Cisco SMI releases support a platform-managed OpenTelemetry Collector gateway. The gateway receives telemetry from applications through the OpenTelemetry Protocol (OTLP) and forwards supported metrics and logs to local or remote backends.
Note: Cisco SMI Cluster Manager Operations documentation identifies OpenTelemetry gateway integration with release 2026.03.1. The gateway was not validated in the specific deployment described by the source example, so this section describes the published configuration model rather than verified operation in that environment.
System Gateway Model
OpenTelemetry-enabled applications
        |
        | OTLP
        v
CEE OpenTelemetry System Gateway
        |
        +--> Local metrics backend
        +--> Local logging backend
        +--> Remote exporters
                 |
                 +--> OTLP / OTLPHTTP
                 +--> Splunk HEC
                 +--> Other supported destinations
Gateway Configuration Concepts
Enable the OpenTelemetry Collector gateway and select the local metrics and logging backends.
otel-collector gateway enabled
otel-collector gateway system local-backends metrics-enabled true
otel-collector gateway system local-backends logs-enabled true
Where the deployment requires external service exposure, the configuration can include an external IP.
otel-collector gateway system external-ip <external-ip-address>
Optional proxy settings are configured for the gateway exporters.
otel-collector gateway system proxy http-proxy http://<proxy-host>:<proxy-port>
otel-collector gateway system proxy https-proxy http://<proxy-host>:<proxy-port>
otel-collector gateway system proxy no-proxy 127.0.0.1,.svc,.cluster.local
The local-backend options control how the platform-managed system gateway sends telemetry to built-in backends. External IP exposure and proxy settings depend on topology and security requirements.
Remote Exporters
| Exporter | Signals | Technical use |
|---|---|---|
| otlp | Logs, metrics | Send telemetry to a backend that accepts OTLP over gRPC. |
| otlphttp | Logs, metrics | Send telemetry to a backend that accepts OTLP over HTTP. |
| splunkhec | Logs | Send logs to a Splunk HEC endpoint. |
| journald | Logs | Write logs to the node journal where supported. |
| debug | Logs, metrics | Support controlled validation and troubleshooting. |
The OpenTelemetry pipeline follows the receive, process, and export model. Receivers ingest telemetry; processors filter or transform data; exporters deliver the selected signals to remote or local backends.
The source also distinguishes proxy behavior: otlp uses collector-instance proxy settings, whereas otlphttp and splunkhec support exporter-level proxy overrides where the deployed release exposes that configuration.
Compare with OpenShift OpenTelemetry
Cisco CEE and OpenShift have a shared architectural pattern: an OpenTelemetry Collector can sit between instrumented applications and observability backends. Their management and installation models are different.
| Concept | CEE OpenTelemetry system gateway | OpenShift OpenTelemetry pattern |
|---|---|---|
| Telemetry source | OpenTelemetry-enabled CEE and application workloads | OpenTelemetry-enabled OpenShift workloads |
| Protocol | OTLP | OTLP |
| Collector role | Platform-managed system gateway | OpenTelemetry Collector deployment or instance |
| Pipeline concept | Receive, process, export | Receive, process, export |
| Backend flexibility | Local backends and supported remote exporters | Exporter-driven backend integration |
| Splunk integration | splunkhec exporter in the documented CEE configuration | Splunk HEC exporter where configured |
This comparison is architectural. The two platforms are not claimed to implement OpenTelemetry identically. OpenShift commonly uses an OpenTelemetry Operator/Collector deployment model, while the Cisco SMI system gateway is platform-managed.
The OpenShift reference architecture discussed in the source shows collectors forwarding telemetry from Kubernetes workloads toward Splunk over HEC. It illustrates the collector-based model rather than a verified integration for the sample CEE installation.
Verify the Configuration
Verify CEE Synchronization
Review the SMI Cluster Manager synchronization status and logs and confirm that the expected CEE workloads are deployed.
clusters <cluster-name> actions sync status
clusters <cluster-name> actions sync logs
Verify HEC and Syslog Separately
Confirm that the HEC path sends events to the configured TCP 8088 endpoint and that Splunk receives them. Confirm separately that the syslog path sends UDP 5140 records to the configured listener.
Use the packet-capture methods in the corresponding sections and correlate packet timestamps with events received at the configured collector.
Verify Observability Services
Confirm that metrics, alert routing, CIMC alerts, and bulk-statistics snapshots operate as designed for the installed release. If OpenTelemetry is enabled, verify receiver, pipeline, and exporter health using the supported SMI Cluster Manager operations procedure.
Expected Behavior
| Component or path | Expected result |
|---|---|
| SMI Cluster Manager | Cluster synchronization completes and the required CEE services are deployed. |
| Ops Center | Authorized users can access operational functions and supported configuration/monitoring commands. |
| Splunk HEC | Event traffic reaches the configured HEC listener on TCP port 8088. |
| Syslog | RFC 5424-formatted events reach the configured UDP port 5140 listener. |
| Alerts and CIMC | Alertmanager and related exporters expose the configured alert information. |
| Bulk statistics | Periodic CSV snapshots are generated from collected statistics. |
| OpenTelemetry | In supported releases with the gateway configured, OTLP signals flow through the selected backend/exporter pipeline. |
Decision Flow
| Observation | Next check |
|---|---|
| CEE services are absent after synchronization. | Inspect Cluster Manager synchronization status, logs, software artifact, and Ops Center parameters. |
| HEC events are missing. | Identify the forwarding pod/node, verify TCP 8088 traffic, HEC destination, authentication, and TLS configuration. |
| Syslog events are missing. | Verify UDP 5140 destination, RFC 5424 formatting, packet flow, and receiver behavior. |
| Alerts or CIMC data are missing. | Check Prometheus/Alertmanager routing, alert-router, and cimc-alerts-exporter operation. |
| Bulk statistics are missing. | Confirm bulk-stats service operation, Prometheus data availability, and CSV snapshot generation. |
| OpenTelemetry export is missing. | Verify feature support for the installed release, gateway configuration, receiver and exporter state, and pipeline membership. |
Conclusion
CEE is a layered Kubernetes-based execution and observability environment around SMF applications. Kubernetes namespace separation divides platform operations, CEE services, and application workloads into different domains. Within CEE, monitoring, alerting, logging, and bulk statistics are specialized services with independent responsibilities.
The key Splunk distinction is between HEC over TCP 8088 and syslog over UDP 5140. These are separate forwarding paths with different protocols, configurations, and troubleshooting procedures. The newer OpenTelemetry system gateway adds an OTLP-based collector and exporter model. Its similarity to OpenShift OpenTelemetry is architectural, and gateway operation must be verified for the specific CEE release and deployment.
Related Content
- Cisco CEE Configuration and Administration Guide - Common Execution Environment
- Cisco CEE Configuration and Administration Guide - Logging Commands
- Cisco SMI Cluster Manager Operations - Synchronization and OpenTelemetry
- RFC 5424 - The Syslog Protocol
Revision History
| Revision | Publish Date | Comments |
|---|---|---|
1.0 |
23-Oct-2026
|
Initial Release |

 Feedback
Contact Cisco
- Open a Support Case

- (Requires a Cisco Service Contract)