Common Execution Environment

Overview

The Common Execution Environment (CEE) is a software solution developed for monitoring mobile and cable applications that are deployed on the Subscriber Microservices Infrastructure (SMI). The CEE captures information (key metrics) from the applications in a centralized way for engineers to debug and troubleshoot.

The CEE is the common set of tools that are installed for all the applications. It comes equipped with a dedicated Ops Center, which provides the user interface (Command Line Interface) and APIs for managing the monitoring tools. There is only one CEE available for each cluster.

The CEE includes the following components:

  • CEE Ops Center - The CEE Ops Center allows users to configure and install the CEE. The CEE Ops Center contains the following components:

    • Metrics Collection - It includes functions such as reporting from Prometheus, alerting and Bulk statistics and so on.

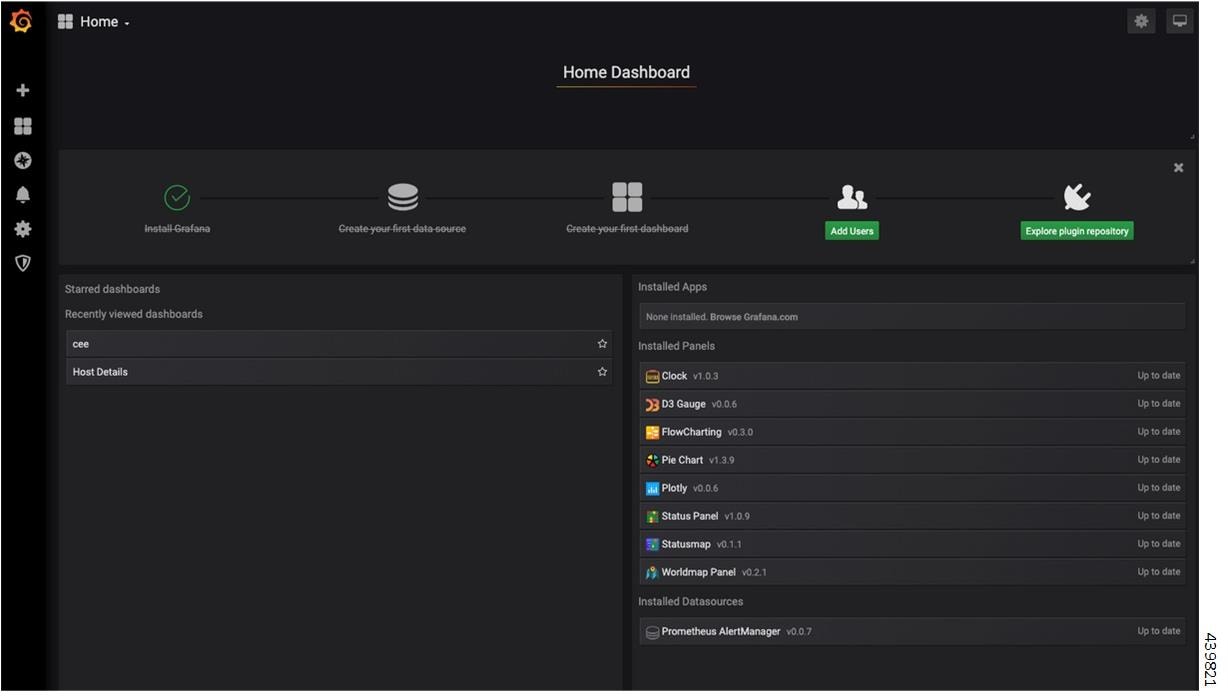
    • Metrics Visualization - The metrics are displayed to the end users through a Grafana dashboard. The dashboard displays the key metrics such as CPU usage, memory, and disk input and output (I/O) utilization of each application deployed on the SMI. Use cases include:

      • Import custom Grafana dashboard from a GIT repository.

      For more information, refer Grafana section.

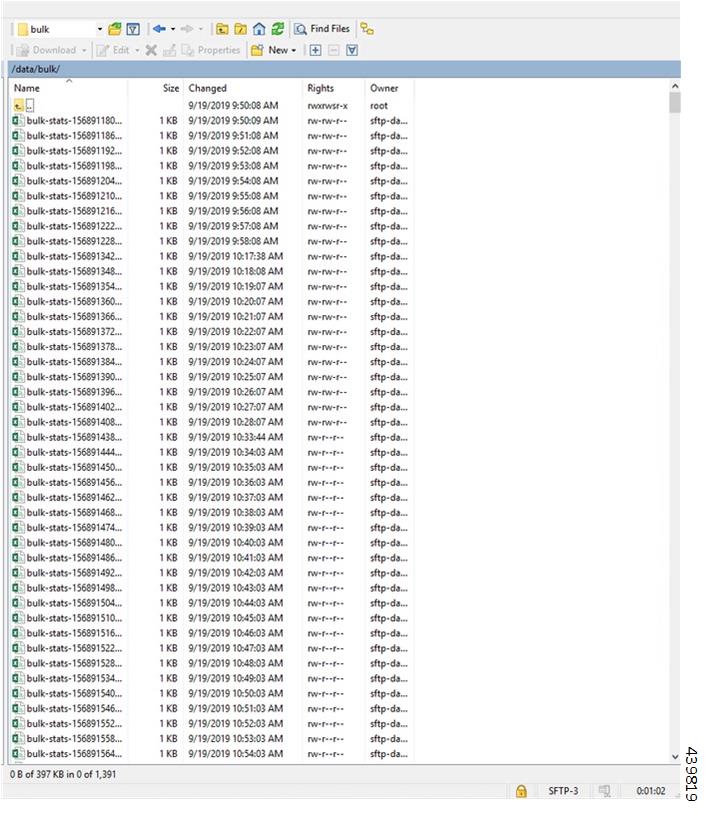
    • Bulk Statistics - Configures application specific statistics, which are collected through the Gather TAC feature. The Bulk Statistics are automatically generated based on the user requirements at repeated intervals. Use cases include:

      • Generate query for current PDU per 4G session.

      • Generate query for current PDU per 4G IPv6 session.

      • View bulk statistics.

      For more information, refer to the Configuring Bulk Statistics section.

    • Metrics Global Query - Thanos - a set of software components for metric system - provides the ability to perform global queries across multiple clusters. Use cases include:

      • In cable environment with multiple Kubernetes clusters, where instances of Prometheus collect metrics specific to cluster, a global Prometheus instance (set up as a part of an application Ops Center) is used as focal point to gather data and respond to queries for metrics from all Prometheus pods.

      For more information, refer Cluster Monitoring section.

    • Alerting - Enables you to monitor applications, containers or nodes by setting up alert rules. The CEE uses the Prometheus Alert Manager for generating alerts. Use cases include:

      • Monitor the success rate of SMF session creation by configuring Prometheus alert rule to report if session creation is less than threshold.

      • Configure Prometheus alert rule to report if pod has restarted.

      • Alerts addon: If snmp-trapper is configured, alert is also sent as SNMP Trap to the receiving agent.

      • View active alerts.

      • View alerts history.

      For more information, refer to the Configuring Alerts section.

    • Log Monitoring - The Kubetail utility in the CEE Ops Center allows end users to monitor the logs of an application in real time.

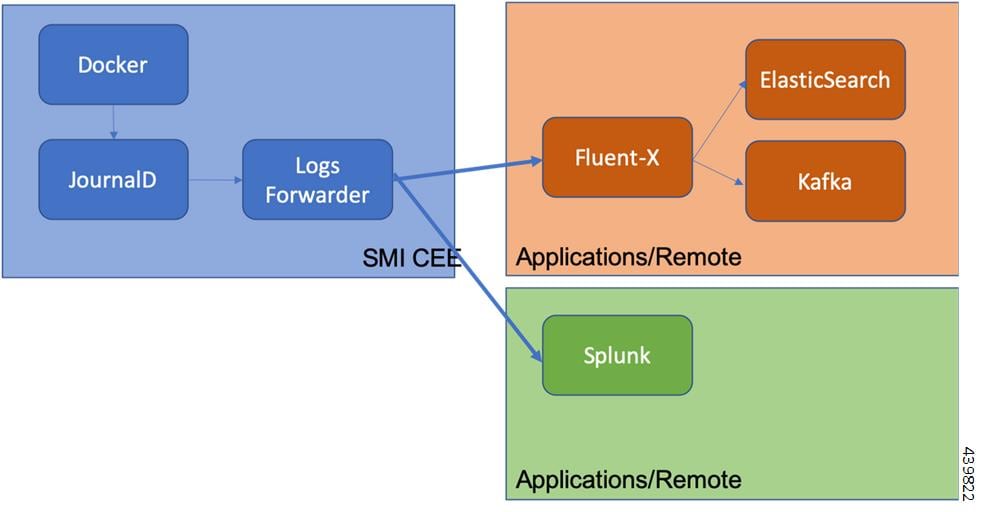
    • Log Forwarding - The Log Forwarding function collects and forwards all the logs to any of the third-party applications present in the customer infrastructure. Use cases include:

      • Configure log forwarding to an external Splunk server.

      • Configure log forwarding to an external Fluent-D or Fluent-Bit instance, where logs can be streamed to supporting application such as ElasticSearch.

      For more information, refer Log Forwarding section.

    • Gather TAC - The Gather TAC function is used for creating log files at specified intervals of time. The logs are collected based on the pods that are deployed on the Kubernetes cluster. Use cases include:

      • When a Network Function (NF) exhibits some issues, the log collection can be configured to include data and statistics for the system and pods in a specific namespace within the last few hours.

    For more information, refer Gather TAC section.

CEE Installation

This section describes the procedures involved in installing the CEE using the Ops Center.

Prerequisites

The prerequisites for installing the CEE are:

  1. Installing the SMI Cluster Manager.

  2. Storing the CEE and associated product tarballs in the local repository.

  3. Applying the necessary cluster configuration for bringing the Kubernetes Cluster on the target nodes.

Requirements

All the versions of CEE.

Components Used

The following components are used for installing the CEE:

  1. The SMI Cluster Manager.

  2. The SMI CEE.

Installing CEE

You can install the CEE using the SMI Cluster Manager CLI. To install CEE, use the following configurations:

  1. Login to the SMI Cluster Manager CLI (using the ingress URL) and enter the configuration mode.

    
    https://cli.smi-cluster-manager.<IP_address>.<customer_specific_domain_name> 
    
  2. Use the following configuration to install the CEE in offline mode.

    configure 
      software cnf software_name 
        url HTTP_HTTPS_File_URL 
        user username 
        password password 
        sha256 sha256_hash 
        exit 

    Note


    For offline installation, you must download the CNF software package from the repository.


    Use the following configuration to install the CEE in online mode.

    configure 
      repository repo_url 
      username username 
      password password 
      sha256 sha256_hash 
      exit 
  3. Link the CEE into the desired cluster in the ops-centers .

    configure 
      clusters cluster_name ops-center app_name instance_name 
      repository repo_url 
      username username 
      password password 
    
      secrets docker-registry <docker_secret_registry> 
      docker-server docker_server_name 
      docker-username docker_username 
      docker-password docker_password 
      docker-email <email_id@domain.com> 
      namespace <namespace> 
      exit 
      sync-default-repository true 
      netconf-ip <ipv4address> 
      netconf-port <portnumber> 
      ssh-ip <ipv4address> 
      ssh-port <portnumber> 
      ingress-hostname <ipv4address>.nip.io 
      initial-boot-parameters use-volume-claims true 
      initial-boot-parameters first-boot-password password 
      initial-boot-parameters auto-deploy true 
      initial-boot-parameters single-node true 
      initial-boot-parameters image-pull-secrets <secret_name> 
      exit 
    exit 
  4. Run the cluster synchronization to deploy the CEE Ops Center and wait for the synchronization to complete.
    clusters cluster_name actions sync run 
  5. Verify the cluster synchronization through cluster sync status or log commands.

    clusters cluster_name actions sync status 
    clusters cluster_name actions sync logs 

    NOTES:

    • customer_specific_domain_name - Specifies the customer's domain name.

    • software cnf software_name - Specifies the Cisco's Cloud Native software. software_name is the name of the Cloud Native software.

      • url HTTP_HTTPS_File_URL - Specifies the repository URL.

      • user username - Specifies the username for HTTP/HTTPS authentication.

      • password password - Specifies the password used for downloading the software package.

      • sha256 sha256_hash - Specifies the SHA256 hash of the software download.

    • repository repo_url - Specifies the CNF repository.

    • clusters cluster_name actions sync run - Synchronizes the committed changes to the cluster.

    • clusters cluster_name actions sync status - Displays the status of the cluster synchronization.

    • clusters cluster_name actions sync logs - Displays the logs generated during the cluster synchronization process.

CEE Pods

A pod is a process that runs on your Kubernetes cluster. Pod encapsulates a granular unit that is known as a container. A pod contains one or multiple containers.

Kubernetes deploys one or multiple pods on a single node which can be a physical or virtual machine. Each pod has a discrete identity with an internal IP address and Port space. However, the containers within a pod can share the storage and network resources.

The following table lists the Common Execution Environment (CEE) pod names and their descriptions.

Table 1. CEE Pods
Pod Name Description
alert-logger Stores and maintains historical alerts that are received from the Alert manager. These alerts are available to user through the CEE ops-center.
alert-router Provides routing support for the alert manager to pass alerts to its receivers.
alertmanager Process alerts from Prometheus and route them to its receivers through alert-router. It also provides a list of active alerts available to the user in CEE ops-center and Grafana.
blackbox-exporter Enables Promethus blackbox probing of endpoints over HTTP, TCP, and ICMP.
bulk-stats Provides summary of statistics that are collected by Prometheus service and create periodic snapshots of statistics on each node in the form of CSV files.
cee-product-documentation CEE Product documentation page provides an overview of CEE functions.
cimc-alerts-exporter Scrapes and exports CIMC alerts to be viewable in Grafana.
core-retriever Assists in retrieving the core dumps.
documentation Contains the documentation (metrics and usage).
fluentbit Collects the logs from journalD or systemd and forwards to the external applications like splunk or another remote fluent instance.
grafana-dashboard-metrics Assists in collating Grafana metrics on the dashboard.
fluentbit-listener Collects the logs from remote fluent instances and forward these logs to external collectors like Splunk.
grafana Provides visualization tool and host-level dashboards to examine metrics and alerts.
grafana-dashboard-metrics Supports the internal file server for Grafana dashboards.
kube-state-metrics Assists in generating metrics about the state of Kubernetes objects: node status, node capacity (CPU and memory), and so on.
loki Provides support to visualize the logs that are provided by the locally installed fluentBit pods.
logs-retriever Assists in retrieving Kernel, Kubelet, and Container level logs through output to the JournalD driver.
logs-forwarder Support pods logs forwarding to external server through Fluent-bit.
metrics-proxy-group Create tunnels to enable Prometheus to scrape KPIs from the node-exporters on KVM nodes.
node-exporter Exports the node metrics to Prometheus and to be viewable on the Grafana dashboard in Host details and summary dashboards.
ops-center-cee-ops-center Supports user management, authentication, configuration, and show commands for CEE features, which run on pods inside the cluster.
path-provisioner Provisions the local storage volume along with pv-provisioner.
pgpool Manage the Postgres resource pool for connection, replication, load balance, and so on. Pgpool is a middleware that works between PostgreSQL servers and a PostgreSQL database.
postgres Supports SQL database with redundancy to store alerts and Grafana dashboards.
prometheus-hi-res Enables monitoring and alerting for the Kubernetes cluster, both local and remote. It scrapes alerts, metrics, kubernetes resources exported by pods and nodes information.
prometheus-rules Contains the default alerting rules and recording rules for Prometheus.
prometheus-scrapeconfigs-synch Synchronizes the Prometheus scrape configuration.
pv-manager Monitors the state of nodes and manages persistent volume and associated pods.
pv-provisioner Enables the application pods to automatically provision the persistent volumes.
restart-kubelet Monitors the pod ready status and resets the kubelet if the state is in not-ready even though pod is ready.
show-tac-manager Supports the Tac-Debug feature to collect coredump, logs, metrics, statistics, and ops-center configuration. It also maintains and provides HTTPS access to files storage in the internal Apache server.
smart-agent-cee-global-ops-center Manages and enforces the Cisco Smart licensing feature per agreement. The the CEE ops-center provides the configuration facility.
thanos-query-hi-res Runs the Thanos application to support the Prometheus query, data storage, and remote cluster monitoring.

Smart Software Licensing

Smart Licensing is a cloud-based approach to licensing that simplifies the purchase, deployment, and management of Cisco software assets. Entitlements are purchased through your Cisco account via Cisco Commerce Workspace (CCW) and immediately deposited into your Virtual Account for usage. This eliminates the need to install license files on every device. Products that are smart enabled communicate directly to Cisco to report consumption. A single location is available to customers to manage Cisco software licenses — the Cisco Software Central (CSC). License ownership and consumption are readily available to help make better purchase decision based on consumption or business need. See https://www.cisco.com/c/en/us/buy/smart-accounts/software-licensing.html for more information about Cisco Smart Licensing.

Comparison Between Legacy Licensing and Smart Licensing

Cisco employs two types of license models - Legacy Licensing and Smart Software Licensing. Legacy Licensing consists of software activation by installing Product Activation Keys (PAK) on to the Cisco product. A Product Activation Key is a purchasable item, ordered in the same manner as other Cisco equipment and used to obtain license files for feature set on Cisco Products. Smart Software Licensing is a cloud based licensing of the end-to-end platform through the use of a few tools that authorize and deliver license reporting. Smart Software Licensing functionality incorporated into CEE complete the product registration and authorization.

Cisco Software Central

Cisco Software Central (CSC) enables the management of software licenses and Smart Account from a single portal. The interface allows you to activate your product, manage entitlements, and renew and upgrade software. A functioning Smart Account is required to complete the registration process. To access the Cisco Software Central, see https://software.cisco.com.

Smart Accounts/Virtual Accounts

A Smart Account provides a single location for all Smart-enabled products and entitlements. It helps speed procurement, deployment, and maintenance of Cisco Software. When creating a Smart Account, you must have the authority to represent the requesting organization. After submitting, the request goes through a brief approval process.

A Virtual Account exists as a sub-account withing the Smart Account. Virtual Accounts are a customer-defined structure based on organizational layout, business function, geography or any defined hierarchy. They are created and maintained by the Smart Account administrator.

See https://software.cisco.com to learn about, set up, or manage Smart Accounts.

Request a Cisco Smart Account

A Cisco Smart Account is an account where all products enabled for Smart Licensing are deposited. A Cisco Smart Account allows you to manage and activate your licenses to devices, monitor license use, and track Cisco license purchases. Through transparent access, you have a real-time view into your Smart Licensing products. IT administrators can manage licenses and account users within your organization's Smart Account through the Software Central.

Procedure


Step 1

In a browser window, enter the following URL:

https://software.cisco.com

Step 2

Log in using your credentials, and then click Request a Smart Account in the Administration area.

The Smart Account Request window is displayed.

Step 3

Under Create Account, select one of the following options:

  • Yes, I have authority to represent my company and want to create the Smart Account – If you select this option, you agree to authorization to create and manage product and service entitlements, users, and roles on behalf of your organization.

  • No, the person specified below will create the account – If you select this option, you must enter the email address of the person who will create the Smart Account.

Step 4

Under Account Information:

  1. Click Edit beside Account Domain Identifier.

  2. In the Edit Account Identifier dialog box, enter the domain, and click OK. By default, the domain is based on the email address of the person creating the account and must belong to the company that will own this account.

  3. Enter the Account Name (typically, the company name).

Step 5

Click Continue.

The Smart Account request will be in pending status until it has been approved by the Account Domain Identifier. After approval, you will receive an email confirmation with instructions for completing the setup process.

CEE Smart Licensing

At present, the Smart Licensing feature supports application entitlement for online and offline licensing for CEE. The application usage is unrestricted during all stages of licensing including Out of Compliance (OOC) and expired stages.


Note


A 90 day evaluation period is granted for all licenses in use. Currently, the functionality and operation of the CEE is unrestricted even after the end of the evaluation period.


Software Tags and Entitlement Tags

Tags for the following software and entitlements have been created to identify, report, and enforce licenses.

Software Tags

Software tags uniquely identify each licenseable software product or product suite on a device. The following software tags exist for the CEE.

Product Type / Description Software Tag

Ultra Cloud Core - Subscriber Microservices Infrastructure (SMI), Basic

regid.2020-04.com.cisco.SMI,1.0_d679f8dd-6cf2-4fe1-9dfc-450650c50301

Ultra Cloud Core - Subscriber Microservices Infrastructure (SMI), Plus

regid.2020-04.com.cisco.SMI,1.0_d679f8dd-6cf2-4fe1-9dfc-450650c50301

Entitlement Tags

The following entitlement tags identify licenses in use:

Product Type / Description Entitlement Tag

Ultra Cloud Core - Subscriber Microservices Infrastructure (SMI), Basic

regid.2020-04.com.cisco.SMI_BASE,1.0_d1771c37-9daf-4b4a-b809-e0c77de37545

Ultra Cloud Core - Subscriber Microservices Infrastructure (SMI), Plus

regid.2020-04.com.cisco.SMI_PLUS,1.0_77b9f9cf-1349-4f75-a106-04efb6bba944


Note


The license information are retained during software upgrades and rollback.


Configuring Smart Licensing

You can configure Smart Licensing after a new CEE deployment.

Users with Access to CSC

This section describes the procedure involved in configuring Smart Licensing for users with access to CSC portal from their internal environment.

Setting Up the Product and Entitlement in CSC

Before you begin, you need to setup your product and entitlement in the CSC. To setup your product and entitlement:

  1. Log in to your CSC account.

  2. Click Add Product and enter the following details.

    • Product name – Specify the name of the deployed product. For example, CEE.

    • Primary PM CEC ID – Specify the primary Project Manager's CEC ID for the deployed product.

    • Dev Manager CEC ID – Specify the Development Manager's CEC ID for the deployed product.

    • Description (Optional) – Specify a brief description of the deployed product.

    • Product Type – Specify the product type.

    • Software ID Tag – Specify the software ID Tag provided by the Cisco Account's team.

  3. Click Create.

  4. Select your product from the Product/Entitlement Setup grid.

  5. Click Entitlement drop-down and select Create New Entitlement.

  6. Select New Entitlement in Add Entitlement and enter the following details.

    • Entitlement Name – Specify the license entitlement name. For example, SMI_BASE.

    • Description (Optional) – Specify a breif description about the license entitlement.

    • Entitlement Tag – Specify the entitlement tag provided by the Cisco Account's team.

    • Entitlement Type – Specify the type of license entitlement.

    • Vendor String – Specify the vendor name.

  7. Click Entitlement Allocation.

  8. Click Add Entitlement Allocation.

  9. In New License Allocation, provide the following details:

    • Product – Select your product from the drop-down list.

    • Entitlement – Select your entitlement from the drop-down list.

  10. Click Continue.

  11. In New License Allocation window, provide the following details:

    • Quantity – Specify the number of licenses.

    • License Type – Specify the type of license.

    • Expiring Date – Specify the date of expiry for the license purchased.

  12. Click Create.

  13. Verify the status of Smart Licensing using the following command.

    show license all 

    Example:

    CEE# show license all
    
    Smart Licensing Status
    =======================
    Smart Licensing is ENABLED
    
    Registration:
      Status: UNREGISTERED
      Export-Controlled Functionality: Not Allowed
    
    License Authorization:
      Status: EVAL MODE
      Evaluation Period Remaining: 83 days, 0 hr, 15 min, 8 sec
      Last Communication Attempt: NONE
    
    License Conversion: 
     Automatic Conversion Enabled: true
     Status: NOT STARTED
    
    Utility:
      Status: DISABLED
    
    Transport:
      Type: CALLHOME
    
    Evaluation Period:
      Evaluation Mode: In Use
      Evaluation Period Remaining: 83 days, 0 hr, 15 min, 8 sec
    
    License Usage
    =============
    License Authorization Status: EVALUATION MODE
      Evaluation Period Remaining: 83 days, 0 hr, 15 min, 8 sec
    
    UCC SMI BASE (SMI_BASE)
      Description: Ultra Cloud Core - Subscriber Microservices Infrastructure (SMI), Base Minimum
      Count: 1
      Version: 1.0
      Status: EVAL MODE
      Export status: RESTRICTED_NOTALLOWED
      Feature Name: <empty>
      Feature Description: <empty>
    
    Product Information
    ===================
    UDI: PID:SMI,SN:6GKJ2OA-NMUWA7Y
    
    Agent Version
    =============
    Smart Agent for Licensing: 3.1.4
    
Registering Smart Licensing

You need to register the product entitled to the license with CSC. To register, you need to generate a ID token from CSC.

  1. Log in to your CSC account.

  2. Click General > New Token and enter the following details:

    • Description – Specify a brief description about the ID token.

    • Expires After – Specify the number of days for the token to expire.

    • Max. Number Users – Specify the maximum number users.

  3. Click Create Token.

  4. Select new ID token in Product Instance Registration Token.

  5. Click Actions > Copy.

  6. Log in to CEE Ops Center CLI and paste the ID token using the following configuration:

    license smart register idtoken 

    Example:

    CEE# license smart register
    Value for 'idtoken' (<string>): MTI2Y2FlNTAtOThkMi00YTAxLWE4M2QtOTNhNzNjNjY4ZmFiLTE2MTc4N
    Tky%0AMTA5MDh8ck1jUHNwc3k1ZC9nWFFCSnVEcUp4QU1jTFoxOGxDTU5kQ3lpa25E%0Ab04wST0%3D%0A
    CEE# 
    
  7. Verify the status of Smart Licensing using the following command.

    show license all 

    Example:

    CEE# show license all 
    
    Smart Licensing Status
    =======================
    Smart Licensing is ENABLED
    
    Registration:
      Status: REGISTERED
      Smart Account: Cisco Systems, Inc.
      Virtual Account: CEE-SMF
      Export-Controlled Functionality: Allowed
      Initial Registration: SUCCEEDED on Apr 15 05:45:07 2020 GMT
      Last Renewal Attempt: SUCCEEDED on Apr 15 05:45:07 2020 GMT
      Next Renewal Attempt: Oct 12 05:45:07 2020 GMT
      Registration Expires: Apr 15 05:40:31 2021 GMT
    
    License Authorization:
      Status: AUTHORIZED on Apr 15 05:45:12 2020 GMT
      Last Communication Attempt: SUCCEEDED on Apr 15 05:45:12 2020 GMT
      Next Communication Attempt: May 15 05:45:12 2020 GMT
      Communication Deadline: Jul 14 05:40:40 2020 GMT
    
    License Conversion: 
     Automatic Conversion Enabled: true
     Status: NOT STARTED
    
    Utility:
      Status: DISABLED
    
    Transport:
      Type: CALLHOME
    
    Evaluation Period:
      Evaluation Mode: Not In Use
      Evaluation Period Remaining: 83 days, 0 hr, 10 min, 43 sec
    
    License Usage
    =============
    License Authorization Status: AUTHORIZED as of Apr 15 05:45:12 2020 GMT
    
    UCC SMI BASE (SMI_BASE)
      Description: Ultra Cloud Core - Subscriber Microservices Infrastructure (SMI), Base Minimum
      Count: 1
      Version: 1.0
      Status: AUTHORIZED
      Export status: RESTRICTED_ALLOWED
      Feature Name: <empty>
      Feature Description: <empty>
    
    Product Information
    ===================
    UDI: PID:SMI,SN:6GKJ2OA-NMUWA7Y
    
    Agent Version
    =============
    Smart Agent for Licensing: 3.1.4

    NOTES:

    • license smart register – Registers Smart Licensing with CSC.

    • idtoken – Specifies the ID token generated from CSC.

Deregistering Smart Licensing

You can deregister the registered product from Smart Licensing if required.

  1. Log in to CEE Ops Center CLI and use the following configuration:

    license smart deregister 

    Example:

    CEE# license smart deregister
    CEE# 
    
  2. Verify the status of Smart Licensing using the following command.

    show license all 

    Example:

    CEE# show license all
    
    Smart Licensing Status
    =======================
    Smart Licensing is ENABLED
    
    Registration:
      Status: UNREGISTERED
      Export-Controlled Functionality: Not Allowed
    
    License Authorization:
      Status: EVAL MODE
      Evaluation Period Remaining: 83 days, 0 hr, 10 min, 43 sec
      Last Communication Attempt: NONE
    
    License Conversion: 
     Automatic Conversion Enabled: true
     Status: NOT STARTED
    
    Utility:
      Status: DISABLED
    
    Transport:
      Type: CALLHOME
    
    Evaluation Period:
      Evaluation Mode: In Use
      Evaluation Period Remaining: 83 days, 0 hr, 10 min, 43 sec
    
    License Usage
    =============
    License Authorization Status: EVALUATION MODE
      Evaluation Period Remaining: 83 days, 0 hr, 10 min, 43 sec
    
    UCC SMI BASE (SMI_BASE)
      Description: Ultra Cloud Core - Subscriber Microservices Infrastructure (SMI), Base Minimum
      Count: 1
      Version: 1.0
      Status: EVAL MODE
      Export status: RESTRICTED_NOTALLOWED
      Feature Name: <empty>
      Feature Description: <empty>
    
    Product Information
    ===================
    UDI: PID:SMI,SN:6GKJ2OA-NMUWA7Y
    
    Agent Version
    =============
    Smart Agent for Licensing: 3.1.4
    
    CEE#
    

    NOTES:

    • license smart deregister – Deregisters Smart Licensing from CSC.

Users without Access to CSC

The Smart License Reservation feature – Perpetual Reservation – is reserved for customers without access to CSC from their internal environments. With this feature, Cisco allows customers to reserve licenses from their virtual account and tie them to their devices Unique Device Identifier (UDI). This enables customers to use their devices with reserved licenses in a disconnected mode.

The subsequent sections describe the procedure involved in reserving Smart License for users without access to CSC from their internal environment.

Enabling Smart License Reservation

You can enable Smart License reservation through CEE Ops Center CLI.

  1. Log in to CEE Ops Center CLI and use the following configuration:

    configure terminal 
      license smart reservation 
      commit 
      exit 

    Notes:

    • license smart reservation – Enables license reservation.

Generating Smart License Reservation Request Code

You can generate the Smart License reservation request code through CEE Ops Center CLI.

  1. Log in to CEE Ops Center CLI and using the following configuration to enable the reservation:

    configure terminal 
      license smart reservation  
      commit 
      exit 
  2. Use the following configuration to request a reservation code:

    license smart reservation request 

    Example:

    CEE# license smart reservation request
    reservation-request-code CJ-ZCEE:6GKJ2OA-NMUWA7Y-Ai75GxtBs-3B
    CEE# 
    Message from confd-api-manager at 2020-04-15 05:51:37...
    Global license change NotifyReservationInProgress reason code Success - Successful.
    CEE# 
    

    NOTES:

    • license smart reservation – Enables license reservation request code.

    • license smart reservation request – Generates the license reservation request code.


      Important


      You need to copy the generated license request code from the CEE Ops Center CLI.


Generating an Authorization Code from CSC

You can generate an authorization code from CSC using the license reservation request code.

  1. Log in to your CSC account.

  2. Click License Reservation.

  3. Enter the Request Code: Paste the license reservation request code copied from the CEE Ops Center CLI in the Reservation Request Code text-box.

  4. Select the Licenses: Click Reserve a Specific License radio-button and select UCC SMI BASE.


    Note


    In the Reserve text-box enter the value 1.


  5. Review your selection.

  6. Click Generate Authorization Code.

  7. Download the response file: The authorization code is generated and displayed on-screen. Click Download as File to download the authorization code.

  8. Click Close.

Reserving Smart Licensing

You can reserve Smart License for the deployed product using the authorization code generated in CSC.

  1. Log in to CEE Ops Center CLI and use the following configuration:

    license smart reservation install 
    authorization_code 

    Example:

    CEE# license smart reservation install
    Value for 'key' (<string>): <specificPLR><authorizationCode><flag>A</flag><version>C</version>
    <piid>35757dc6-2bdf-4fa1-ba7e-4190f5b6ea22</piid><timestamp>1586929992297</timestamp>
    <entitlements><entitlement><tag>regid.2020-04.com.cisco.SMI_BASE,1.0_60b1da6f-3832-4687-90c9-8879dc815a27</tag>
    <count>1</count><startDate>2020-Apr-08 UTC</startDate><endDate>2020-Oct-05 UTC</endDate>
    <licenseType>TERM</licenseType><displayName>UCC SMI BASE</displayName>
    <tagDescription>Ultra Cloud Core - Subscriber Microservices Infrastructure (SMI), Base Minimum</tagDescription>
    <subscriptionID></subscriptionID></entitlement></entitlements></authorizationCode>
    <signature>MEYCIQC/9v5LpgFoEk2l4omIgjjk83g5WXjzs09kQnsO8D0jRgIhAMh+D6DRuYmqh1TlfJoZxNte0fPKw6fHEY5CEF3+kPQj</signature>
    <udi>P:SMI,S:6GKJ2OA-NMUWA7Y</udi></specificPLR>
    CEE# 
    
  2. Verify the status of smart licensing using the following command.

    show license all 

    Example:

    CEE# show license all
    
    Smart Licensing Status
    =======================
    Smart Licensing is ENABLED
    License Reservation is ENABLED
    
    Registration:
      Status: REGISTERED - SPECIFIC LICENSE RESERVATION 
      Export-Controlled Functionality: Allowed
      Initial Registration: SUCCEEDED on Wed Apr 15 05:53:31 GMT 2020
      Last Renewal Attempt: None
    
    License Authorization:
      Status: AUTHORIZED - RESERVED on Wed Apr 15 05:53:31 GMT 2020 
    
    Utility:
      Status: DISABLED
    
    Transport:
      Type: CALLHOME
    
    Evaluation Period:
      Evaluation Mode: Not In Use
      Evaluation Period Remaining: 83 days, 0 hr, 5 min, 15 sec
    
    License Usage
    =============
    License Authorization Status: 
      Status: AUTHORIZED - RESERVED  on Wed Apr 15 05:53:31 GMT 2020
      Last Communication Attempt: SUCCEEDED on Apr 15 05:53:31 2020 GMT
      Next Communication Attempt: NONE
      Communication Deadline: NONE
    
    UCC SMI BASE (SMI_BASE)
      Description: Ultra Cloud Core - Subscriber Microservices Infrastructure (SMI), Base Minimum
      Count: 1
      Version: 1.0
      Status: AUTHORIZED 
      Export status: NOT RESTRICTED
      Feature Name: <empty>
      Feature Description: <empty>
      Reservation:
        Reservation Status: SPECIFIC INSTALLED
        Total Reserved Count: 1
        Term expiration: 2020-Oct-05 GMT
    
    Product Information
    ===================
    UDI: PID:SMI,SN:6GKJ2OA-NMUWA7Y
    
    Agent Version
    =============
    Smart Agent for Licensing: 3.1.4
    

    NOTES:

    • license smart reservation install authorization_code – Installs a Smart License Authorization code.

Returning the Reserved License

You can return the reserved license to CSC if required. Use the following procedures to return the reserved license:

  1. When the license reservation authorization code is installed in the CEE Ops Center.

    1. Log in to the CEE Ops Center CLI and use the following configuration:

      license smart reservation return 

      Example:

      CEE# license smart reservation return 
      reservation-return-code CJ6m3k-RAvu6b-hMNmwf-mrdcko-NoSwKL-tF7orz-9aNtEu-yVjGAm-D6j
      CEE# 
      
    2. Copy the license reservation return code generated in CEE Ops Center CLI.

    3. Log in to your CSC account.

    4. Select your product instance from the list.

    5. Click Actions > Remove.

    6. Paste the license reservation return code in Return Code text-box.

    NOTES:

    • license smart reservation return – Returns a reserved Smart License.

  2. When the license reservation authorization code is not installed in the CEE Ops Center.

    1. Log in to the CEE Ops Center CLI and use the following configuration to generate the return code.

      license smart reservation return 
      authorization_code 

      Important


      Paste the license reservation authorization code generated in CSC to generate the return code.


    2. Log in to your CSC account.

    3. Select your product instance from the list.

    4. Click Actions > Remove.

    5. Paste the license reservation return code in Return Code text-box.

  3. Verify the status of smart licensing using the following command.

    show license all 
    Example:
    CEE# show license all
    
    Smart Licensing Status
    =======================
    Smart Licensing is ENABLED
    License Reservation is ENABLED
    
    Registration:
      Status: UNREGISTERED
      Export-Controlled Functionality: Not Allowed
    
    License Authorization:
      Status: EVAL MODE
      Evaluation Period Remaining: 83 days, 0 hr, 5 min, 15 sec
      Last Communication Attempt: SUCCEEDED on Apr 15 05:53:31 2020 GMT
      Next Communication Attempt: NONE
      Communication Deadline: NONE
    
    License Conversion: 
     Automatic Conversion Enabled: true
     Status: NOT STARTED
    
    Utility:
      Status: DISABLED
    
    Transport:
      Type: CALLHOME
    
    Evaluation Period:
      Evaluation Mode: In Use
      Evaluation Period Remaining: 83 days, 0 hr, 5 min, 15 sec
    
    License Usage
    =============
    License Authorization Status: EVALUATION MODE
      Evaluation Period Remaining: 83 days, 0 hr, 5 min, 15 sec
    
    UCC 5G SMI BASE (SMI_BASE)
      Description: Ultra Cloud Core - Subscriber Microservices Infrastructure (SMI), Base Minimum
      Count: 1
      Version: 1.0
      Status: EVAL MODE
      Export status: RESTRICTED_NOTALLOWED
      Feature Name: <empty>
      Feature Description: <empty>
    
    Product Information
    ===================
    UDI: PID:CEE,SN:6GKJ2OA-NMUWA7Y
    
    Agent Version
    =============
    Smart Agent for Licensing: 3.1.4
    
    CEE#
    

Monitoring and Troubleshooting Smart Licensing

You can use the following show commands to display information about Smart Licensing in the CEE Ops Center.

show licesne [all | UDI | displaylevel | reservation | smart | status | summary | tech-support | usage] 

NOTES:

  • all – Displays an overview of Smart Licensing information that includes license status and, usage, product information and Smart Agent version.

  • UDI – Displays Unique Device Identifiers (UDI) details.

  • displaylevel – Depth to display information.

  • reservation – Displays Smart Licensing reservation information.

  • smart – Displays Smart Licensing information.

  • status – Displays the overall status of Smart Licensing.

  • summary – Displays a summary of Smart Licensing.

  • tech-support – Displays Smart Licensing debugging information.

  • usage – Displays the license usage information for all the entitlements that are currently in use.

Accessing CEE Ops Center

You can access the CEE Ops Center CLI through the ingress URL. For example:


https://cli.cee-global-ops-center.<ip_address>.<customer_specific_domain_name> 

Upgrading CEE

This section describes the procedure involved in upgrading the CEE Ops Center and CEE products.

Upgrading CEE Ops Center

To upgrade the CEE Ops Center, use the following configurations:

  1. Use the following configuration to modify the CEE Ops Center to point it to the new tarball.

    
    configure 
         cluster cluster_name 
             ops-centers app_name instance_name 
             repository repo_url 
             username username 
             password password 
             initial-boot-parameters auto-deploy true 
             exit 
         commit 
    
  2. Run the cluster synchronization to upgrade the CEE Ops Center.


    Note


    Ensure that you enable auto deploy for the CEE products that are being updated.
    clusters cluster_name actions sync run 
    
  3. Verify whether the helm charts have been updated through the CEE Ops Center.

    show helm charts 
    

    A sample output is shown below:

    CHART         INSTANCE                          STATUS    VERSION     REVISION RELEASE                                   NAMESPACE 
    ------------------------------------------------------------------------------------------------------------------------------------------- 
    cee-ops-center         cee-global-ops-center             deployed  2023.02.1.d249  1   0.7.0-2023-02-1-0513-230331051211-dec612f  cee-global 
    cnat-monitoring        cee-global-cnat-monitoring        deployed  2023.02.1.d249  1   0.7.0-2023-02-1-0031-230331183330-58ec41c  cee-global 
    product-documentation  cee-global-product-documentation  deployed  2023.02.1.d249  1   0.8.0-2023-02-1-0131-230321085503-2699cb5  cee-global 
    pv-manager             cee-global-pv-manager             deployed  2023.02.1.d249  1   0.3.0-2023-02-1-0029-230320155437-e484272  cee-global 
    smi-autoheal           cee-global-smi-autoheal           deployed  2023.02.1.d249  1   0.2.0-2023-02-1-0030-230330084451-99684bf  cee-global 
    smi-show-tac           cee-global-smi-show-tac           deployed  2023.02.1.d249  1   0.4.0-2023-02-1-0189-230331050005-81130f1  cee-global 
    storage-provisioner    cee-global-storage-provisioner    deployed  2023.02.1.d249  1   0.3.0-2023-02-1-0120-230320160505-1597fdb  cee-global 
    telegraf-monitoring    cee-global-telegraf-monitoring    deployed  2023.02.1.d249  1   0.1.0-2023-02-1-0048-230330084426-9b02da0  cee-global 
  4. Verify the status of the system.

    show system status 
    

    A sample output is shown below:

    system status deployed true 
    system status percent-ready 91.3 

    NOTES:

    • cluster cluster_name - Specifies the name of the cluster. For example, aio.

    • ops-centers app_name instance_name - Specifies the installation of the Ops Center. app_name is the name of the application. For example, cee.The instance_name is the name of the instance. For example, global.

    • username username - Specifies the username used for logging in to the repository.

    • password password - Specifies the password used for logging into the repository.

    • repository repo_url - Specifies the product chart repository URL.

    • initial-boot-parameters auto-deploy true – Deploys the product chart automatically.

    • commit - Commits the configuration changes.

    • show helm status - Displays the status of the system.

    • clusters cluster_name actions sync run - Synchronizes the committed changes to the cluster.

Upgrading CEE Products

To upgrade the CEE products, use the following configurations:

  1. Access the CEE Ops Center through the ingress URL.

    
    https://cli.cee-global-ops-center.<ipv4_address>.<customer_specific_domain_name> 
    

    NOTES:

    • customer_specific_domain_name - Specifies the name of the domain specific to the customer.

  2. Use the following configuration to update the CEE products chart URL.

    configure 
                helm default-repository repo_name 
                helm repository repo_name 
                url cee_product_chart_url 
                username username 
                password password 
                exit 
             commit 
    

    NOTES:

    • customer_specific_domain_name - Specifies the name of the domain specific to the customer.

    • helm default-repository repo_name - Specifies the default helm repository name.

    • helm repository repo_name - Specifies the name of the helm repository to update.

    • url cee_product_chart_url - Specifies the product chart URL. For example, http://charts.<ipv4address>.<domain_name>/cee-2019-09-13/

    • username username - Specifies the user name.

    • password password - Specifies the password.

    • commit - Commits the configuration changes.

Configuring CEE

The subsequent sections provide more information about the CEE configuration procedures.

Configuring Alerts

When an anomaly is detected, the system generates a notification called an alert. Based on the statistics pegged by the system, alerts are fired. You can configure an expression to fire an alert when the expression becomes true.

The CEE uses the Prometheus Alert Manager for alerting operations. The CEE YANG model - either through CLI or API - allows users to view the active alerts, silenced alerts and alert history. A predefined set of alerting rules are added whenever the application is installed or updated. Also, the applications can call the alert API directly to add or clear alerts. The Prometheus Alert Manager API (v2) is the standard API used.

The Prometheus Alerts Manager includes the following options:

  • Defining Alert Rules – This option defines the Alert Manager on what to alert. You can define the alerts using the Prometheus Query Language (PromQL).

  • Defining Alert Routing – This option defines the Prometheus Alert Manager on what to do with the received alerts. At present, the SNMP Trapper is supported as the outbound alerting. Also, the CEE provides an Alert Logger for storing the generated alerts.

Requirements

For configuring alerts:

  1. The CEE product must be installed and running.

  2. The CEE Ops Center must be accessible.

Configuring Alert Rules

Use the following configuration to configure the alert rules.


configure 
   alerts rules group alert_group_name 
   interval-seconds seconds 
   rule rule_name 
      expression promql_expression 
      duration duration 
      severity severity_level 
      type alert_type 
      annotation annotation_name 
      value annotation_value 
      exit 
exit 

NOTES:

  • alerts rules – Specifies the Prometheus alerting rules.

  • interval-seconds seconds – Specifies the evaluation interval of the rule group in seconds.

  • group alert_group_name – Specifies the Prometheus alerting rule group. One alert group can have multiple list of rules. alert_group_name is the name of the alert group. The alert-group-name must be a string in the range of 0 through 64 characters.

  • rule rule_name – Specifies the alerting rule definition. rule_name is the name of the rule.

  • expression promql_expression – Specifies the PromQL alerting rule expression. promql_expression is the alert rule query expressed in PromQL syntax. The promql_expression must be a string.

  • duration duration – Specifies the duration of a true condition before it is considered true. duration is the time interval before the alert is fired.

  • severity severity_level – Specifies the relative level of urgency for the operator's attention. severity_level is the severity level of the alert. The severity levels are: critical, major, minor and warning.

  • type alert_type – Specifies the type of the alert. alert_type is the user-defined alert types. For example, Communications Alarm, Environmental Alarm, Equipment Alarm, Indeterminate Integrity Violation, Operational Violation, Physical Violation, Processing Error Alarm, Quality of Service Alarm, Security Service, Mechanism Violation, or Time Domain Violation.

  • annotation annotation_name – Specifies the annotation to attach to the alerts. annotation_name is the name of the annotation.

  • value annotation_value – Specifies the annotation value. annotation_value is the value of the annotation.

The following example monitors the success rate of SMF session creation by configuring Prometheus alert rule to report if session creation is less than threshold.

Example:
cee# configure terminal
  alerts rules group SMFProcStatus
  interval-seconds 300
  rule PDNSessCreate
  expression "sum(increase(smf_service_stats{app_name=\"SMF\",procedure_type=\"pdn_sess_create\",status=\"success\"}[5m]))  / sum(increase(smf_service_stats{app_name=\"SMF\",procedure_type=\"pdn_sess_create\",status=\"attempted\"}[5m])) < 0.95"
  severity   major
  type       "Communications Alarm"
  annotation summary
  value "This alert is fired when the success percentage of pdn_sess_create procedure is lesser threshold”
  exit

In the following example, a alert is sent as SNMP Trap to receiving agent when a snmp-trapper is configured.

Example:
cee# configure terminal
  snmp-trapper enable true v2c-target 172.16.181.41 community public port 161
  exit

The following example configures an alert, which is fired when the percentage of UDM responses is less than the specified threshold limit.

Example:

cee# configure terminal
		alerts rules group SMFUDMchk_incr
		interval-seconds 300
		rule SMFUDMchk_incr
		expression "sum(increase(smf_restep_http_msg_total{nf_type=\"udm\", message_direction=\"outbound\", response_status=~\"2..\"}[3m])) /  sum(increase(smf_restep_http_msg_total{nf_type=\"udm\", message_direction=\"outbound\"}[3m])) < 0.95"
		severity major
		type "Communications Alarm"
		annotation summary
		value "This alert is fired when the percentage of UDM responses is less than threshold“
		exit
	exit
exit

You can view the configured alert using the show running-config alerts command.

Example:

The following example displays the alerts configured in the running configuration:

cee# show running-config alerts
               interval-seconds 300
               rule SMFUDMchk_incr
               expression "sum(increase(smf_restep_http_msg_total{nf_type=\"udm\", message_direction=\"outbound\", response_status=~\"2..\"}[3m])) /  sum(increase(smf_restep_http_msg_total{nf_type=\"udm\", message_direction=\"outbound\"}[3m])) < 0.95"
               severity major
               type "Communications Alarm"
               annotation summary
               value "This alert is fired when the percentage of UDM responses is less than threshold“              
	   exit
      exit
exit

Configuring Alerts for ETCD Nodes

The ETCD runs on separate nodes in a multi-node environment as opposed to a container within Kubernetes environment. A Node-Exporter runs on each of the ETCD nodes to obtain host level metrics. Also, the CEE Prometheus starts scrapping the metrics automatically after deployment.

You can create alerting rules based on the ETCD Node-Exporter metrics. To configure alerting rules based on ETCD Node-Exporter metrics, use the ETCD Node IP as the instance label instead of the Pod name in the expression.


Important


The Node-Exporter on ETCD is not running as a Kuberenets Pod.


The following examples configure alerting rules based on ETCD Node-Exporter metrics.

Example:

The following expression configures alerts based on the availability of host memory (less than 30%):

((node_memory_MemAvailable_bytes{{{instance="<ETCD-Node-IP>:9100"}}} / node_memory_MemTotal_bytes{{{instance="<ETCD-Node-IP>:9100"}}}) < 30

The following expression configures alerts based on the average CPU usage for five minutes. (greater than 70%):

sum(avg without (cpu)(irate(node_cpu_seconds_total{instance="<ETCD-Node-IP>:9100",mode!="idle"}[5m]))) * 100 > 70

Helm Deployment Alert Rule

The CEE Ops Center comes equipped with a built-in alert rule - helm_deploy_failure - to indicate the failure status of helm chart deployment. This alert rule comes by default as a Prometheus alerting rule during CEE deployment.

The following is an alert rule definition for helm_deploy_failure alert in Prometheus:

- alert: helm-deploy-failure
    annotations:
      type: Processing Error Alarm
      description: 'Helm chart {{$labels.chart}}/{{$labels.namespace}} deployment failed'
      summary: 'Helm chart failed to deploy for 5 minutes'
    expr: |
      helm_chart_deploy_success < 1
    labels:
      severity: critical
    for: 5m

The following example shows an alert generated when helm chart deployment fails.

alerts active helm-deploy-failure 3edde79a3f86
state active
severity critical
type "Processing Error Alarm"
startsAt 2020-04-17T17:55:57.084Z
source tfchan-dev
labels [ "chart: smi-show-tac" "chartVersion: 0.1.0-helmfail-0108-200310183805-6888120" "component: ops-center" "exported_release: cee-smi-show-tac" "instance: 192.168.190.28:8082" "job: kubernetes-pods" "namespace: cee" "pod: ops-center-cee-ops-center-5ccddd5d9f-6rffw" "pod_template_hash: 5ccddd5d9f" "release: cee-ops-center" ]
annotations [ "description: Helm chart smi-show-tac/cee deployment failed" "summary: Helm chart failed to deploy for 5 minutes" ]

Note


If SNMP Trapper is configured, this alert goes to the external SNMP receiver as an SNMP trap. For instance, when there is already a conflict of resources, the Helm deployment fails.


Viewing Alert Logger

The Alert Logger stores all the generated alerts by default. You can view the stored alerts using the following show commands.

show alert history { detail | summary }

show alert active { detail | summary }

You can narrow down the result using the following filtering options:

  • annotations – Specifies the annotations of the alert.

  • endsAt – Specifies the end time of the alert.

  • labels – Specifies the additional labels of the alert.

  • severity – Specifies the severity of the alert.

  • source – Specifies the source of the alert.

  • startsAt – Specifies the start time of the alert.

  • type – Specifies the type of the alert.

You can view the history of configured alerts using show alerts history command.

The following examples displays the history of the alerts configured in the system:

Example:
cee# show alerts history summary
NAME UID SEVERITY STARTS AT DURATION SOURCE SUMMARY
-----------------------------------------------------------------------------------------------------------------------------------------------------------------------------------------------
k8s-pod-crashing-loop 13218bfedfb7 critical 11-02T19:42:40 3m50s upf-cm-tb16-2-cm1 Pod cee-global/alert-logger-56f85f54df-wdpbp (alert-logger) is restarting 1.01 times / 5 minutes.
k8s-pod-crashing-loop bf8f6b0e167c critical 11-02T19:42:40 3m50s upf-cm-tb16-2-cm1 Pod cee-global/pgpool-5cc9d4b44f-4kklz (pgpool) is restarting 1.01 times / 5 minutes.
k8s-pod-crashing-loop 840f362e970e critical 11-02T19:42:40 3m50s upf-cm-tb16-2-cm1 Pod cee-global/grafana-5b9779c7d6-hmptk (grafana) is restarting 1.01 times / 5 minutes.
k8s-pod-crashing-loop 40f4de09d667 critical 11-02T19:42:30 3m50s upf-cm-tb16-2-cm1 Pod cee-global/pgpool-5cc9d4b44f-gwdpp (pgpool) is restarting 1.01 times / 5 minutes.
k8s-pod-not-ready 3ade1624bfa8 critical 11-02T19:40:40 40s postgres-0 Pod cee-global/postgres-0 has been in a non-ready state for longer than 1 minute.

The following examples displays a detailed history of the alerts configured in the system:

cee# show alerts history detail
alerts history detail k8s-pod-crashing-loop 13218bfedfb7
severity critical
type "Processing Error Alarm"
startsAt 2020-11-02T19:42:40.400Z
endsAt 2020-11-02T19:46:30.400Z
source upf-cm-tb16-2-cm1
summary "Pod cee-global/alert-logger-56f85f54df-wdpbp (alert-logger) is restarting 1.01 times / 5 minutes."
labels [ "alertname: k8s-pod-crashing-loop" "cluster: upf-cm_cee-global" "component: kube-state-metrics" "container: alert-logger"
 "hostname: upf-cm-tb16-2-cm1" "instance: 192.168.211.203:8080" "job: kubernetes-pods" "monitor: prometheus" 
"namespace: cee-global" "pod: alert-logger-56f85f54df-wdpbp" "pod_template_hash: db7bf9f7" 
"release: cee-global-cnat-monitoring" "replica: upf-cm_cee-global" "severity: critical" ]
annotations [ "summary: Pod cee-global/alert-logger-56f85f54df-wdpbp (alert-logger) is restarting 1.01 times / 5 minutes."
 "type: Processing Error Alarm" ]

You can view the active using the show alerts active command.

Example:
show alerts active summary
NAME UID SEVERITY STARTS AT SOURCE SUMMARY
----------------------------------------------------------------------------------------------------------------------------------------------------------------------------------------------------------------------
server-alert 02232d49cccd minor 10-29T06:09:04 upf-4 PS_RDNDNT_MODE: Power Supply redundancy is lost or non-redundant: Check Redundancy Policy or reseat/replace Power Supply
server-alert f97ec27bc318 minor 10-29T06:09:04 cm-2 PS_RDNDNT_MODE: Power Supply redundancy is lost or non-redundant: Check Redundancy Policy or reseat/replace Power Supply
watchdog 0dbfe73527ad minor 10-29T06:07:58 System This is an alert meant to ensure that the entire alerting pipeline is functional. This alert is always firing, therefore it should always be firing...
Example:
show alerts active detail
alerts active detail server-alert 359fe8fd1dd8
severity warning
type "Equipment Alarm"
startsAt 2020-10-29T06:09:04.243Z
source cm-2
summary "Storage Virtual Drive 0 Degraded: please check the storage controller, or reseat the storage drive"
labels [ "alertname: server-alert" "cluster: tb16-2" "description: Storage Virtual Drive 0 Degraded: 
please check the storage controller, or reseat the storage drive" "fault_id: sys/rack-unit-1/board/
storage-SAS-MRAID/vd-0/fault-F1008" "id: 3523411968" "monitor: prometheus" "replica: tb16-2" 
"server: cm-2" "severity: warning" ]
annotations [ "dn: tb16-2/cm-2/sys/rack-unit-1/board/storage-SAS-MRAID/vd-0/fault-F1008/3523411968" 
"summary: Storage Virtual Drive 0 Degraded: please check the storage controller, or reseat the 
storage drive" "type: Equipment Alarm" ]

Enabling SNMP Traps

Use the following configuration to enable the SNMP Traps.


configure 
   snmp-trapper enable true 
   snmp-trapper { v2c-target target | v3-target target | v3-engine-id source_engine_id }  
      community [ community_string ] 
      port [ port ] 
      exit 
   snmp-trapper source-ip-routes [ vip_options ] 
   exit 

NOTES:

  • snmp-trapper enable true – Enables the snmp-trapper parameters

  • v2c-target|v3-target [ target ] – Specifies the list of SNMP v2c and v3 trap receivers.

  • community [ community_string ] – Specifies the SNMP Trap receiver community.

  • v3-engine-id source_engine_id – Specifies the source engine ID for the v3 traps. source_engine_id must be an hexagonal string. For instance, 80004f.

  • port [ port ] – Specifies the SNMP Trap receiver port. port must be an integer in the range of 0 through 65535. The default value is 162.

  • source-ip-routes [ vip_options ] – Enables binding to source IP for SNMP routing. vip specifies the virtual IP (VIP) address. The different options for virtual IP addresses include:

    • default-external-vip – Specifies the default external VIP for source IP routing.

    • internal-vip – Specifies the internal VIP for source IP routing.

    • source-external-vips -Specifies the external VIP per namespace.

Disabling SNMP Traps

Use the following configuration to disable SNMP Traps.


configure 
   no snmp-trapper enable 
   exit 

NOTES:

  • no snmp-trapper enable - Disables SNMP Traps.

Configuring Bulk Statistics

Bulk statistics provide a mechanism to view the summary of the CEE metrics. You can configure bulk statistics to pull the CEE metrics periodically. Also, you can download the metrics in Comma-Separated Value (CSV) format through Secure File Transfer Protocol (SFTP).

Use the following configuration to configure bulk statistics in CEE Ops Center.


configure 
   bulk-stats enable [ true ] 
   bulk-stats external-ip [ ipv4_address ] 
   bulk-stats external-port [ port ] 
   bulk-stats interval-minutes [ interval ] 
   bulk-stats pod-query [ pod_query ] default-value value  
   bulk-stats prune-interval-days [ prune_interval ] 
   bulk-stats query [ query  
   bulk-stats user [ user ] 
   bulk-stats vnf-name [ vnf ] 
   bulk-stats global-default-value [ default_value ] 
   bulk-stats vnf-alias [ vnf_alias ] 
   exit 

NOTES:

  • bulk-stats enable [ true ] – Enables the bulk statistics.

  • global-default-value [ default_value ] – Specifies the default value used in bulk-stats, if pod-query or query fails to return any value.

  • external-ip [ ipv4_address ] – Specifies the external IP for downloading the bulk statistics over SFTP.

  • external-port [ port ] – Specifies the external port for downloading the bulk statistics over SFTP.

  • interval-minutes [ interval ] – Specifies the time interval (in minutes) to create the bulk statistics.

  • pod-query [ pod_query ] default-value value – Specifies the query to execute for retrieving the bulk statistics data. ] default-value value is the default value used in bulk-stats, if the configured pod-query fails to return any value. value will override the global-default-value

  • prune-interval-days [ prune_interval ] – Prunes the interval (in days) to remove the bulk statistics.

  • query [ query ] – Specifies the query to execute for retrieving the bulk statistics.

  • user [ user ] – Specifies the user authorized to download the bulk statistics files.

  • vnf-name [ vnf ] – Specifies the VNF name (namespace) to add in the bulk statistics CSV file.

  • vnf-alias [ vnf_alias ] – Specifies the VNF alias for a specified namespace.

The following example generates query for current PDU per 4G session.

Example:

cee# configure terminal
  bulk-stats enable true
  bulk-stats user admin
  bulk-stats external-ip 172.16.181.41
  bulk-stats external-port 2222
  bulk-stats vnf-name lbucs009
  bulk-stats query 4G_current_pdu_sessions
  expression "sum(smf_up_session_counters{app_name=\"SMF\",rat_type=\"EUTRA\"})"
  label      4G_current_pdu_sessions
  exit

The following example generates query for current PDU per 4G IPv6 session.

Example:

cee# configure terminal
  bulk-stats enable true
  bulk-stats user admin
  bulk-stats external-ip 172.16.181.41
  bulk-stats external-port 2222
  bulk-stats vnf-name lbucs009
  bulk-stats query 4G_current_pdu_sessions_IPv6
  expression "sum(smf_up_session_counters{app_name=\"SMF\",rat_type=\"EUTRA\",pdu_type=\"ipv6\"})"
 label      4G_current_pdu_sessions_IPv6
 exit

Retrieving Bulk Statistics

The CEE stores the Bulk statistics in the CSV format. You can download the stored files from the external host. You must configure the external IP and port to download the bulk statistics.

Use the following command from the external host, which is accessible to the CEE cluster, to download or retrieve the bulk statistics in CSV format.


scp -P [external-port] [user]@[external-ip]:/data/[bulk | rate]/[filename].csv [local-folder] 

Also, you can use any of the Graphical User Interface (GUI) SFTP tool to browse and download the CSV files. A SFTP tool displaying the directory where bulk statistics are stored in CSV format is shown below:

Figure 1. Bulk Statistics - GUI

The following example displays the various parameters in bulk statistics.

Example:
UID           NAMESPACE          METRIC                       LABELS                                                     ALIAS  VALUE
------------------------------------------------------------------------------------------------------------------------------------------------
439bd4f3d7c8  *                  active-alerts                [ alertname=watchdog ]                                            1.0             
50113c94b989  cee-global         configuration-change-total   [ source=System ]                                                 3.0             
5ada6437a102  cee-global         cpu-core-count               [ hostname=ott-bm2-cm-cm-1 ]                                      48.0            
9a918f9f153a  *                  cpu-idle                     [ hostname=ott-bm2-cm-cm-1 ]                                      95.793          
3cac0a6ad9ee  *                  cpu-iowait                   [ hostname=ott-bm2-cm-cm-1 ]                                      0.003           
52b70483c10e  *                  cpu-softirq                  [ hostname=ott-bm2-cm-cm-1 ]                                      0.229           
88f3c5d2cc32  *                  cpu-steal                    [ hostname=ott-bm2-cm-cm-1 ]                                      0.0             
2c2354f17788  *                  cpu-system                   [ hostname=ott-bm2-cm-cm-1 ]                                      1.485           
137b898a8afe  *                  cpu-user                     [ hostname=ott-bm2-cm-cm-1 ]                                      2.205           
76d3a2158b50  cee-global         daemonset-ready-percent      [ daemonset=blackbox-exporter ]                                   100.0           
44d0bfe7d92d  kube-system        daemonset-ready-percent      [ daemonset=calico-node ]                                         100.0           
d2e91d076768  cee-global         daemonset-ready-percent      [ daemonset=core-retriever ]                                      100.0           
ec70bdc6dbaf  kube-system        daemonset-ready-percent      [ daemonset=journald-adapter ]                                    100.0           
e13a31621bbc  smi-vips           daemonset-ready-percent      [ daemonset=keepalived ]                                          100.0           
3583e73ab8c8  kube-system        daemonset-ready-percent      [ daemonset=kube-proxy ]                                          100.0           
a78d2ca5a7c4  cee-global         daemonset-ready-percent      [ daemonset=logs-retriever ]                                      100.0           
04d9a0c4691d  kube-system        daemonset-ready-percent      [ daemonset=maintainer ]                                          100.0           
376fbe4611bd  cee-global         daemonset-ready-percent      [ daemonset=node-exporter ]                                       100.0           
d109bf9be31d  cee-global         daemonset-ready-percent      [ daemonset=path-provisioner ]                                    100.0           
11090fd5e91f  cee-global         daemonset-ready-percent      [ daemonset=restart-kubelet ]                                     100.0           
d770ae176453  smi-secure-access  daemonset-ready-percent      [ daemonset=secure-access-controller ]                            100.0           
b0344050b3d5  kube-system        daemonset-ready-percent      [ daemonset=user-password-monitor ]                               100.0           
48ce4437eb7b  cee-global         deployment-ready-percent     [ deployment=alert-logger ]                                       100.0           
8f59873fff50  cee-global         deployment-ready-percent     [ deployment=alert-router ]                                       100.0           
6119200c32be  cee-global         deployment-ready-percent     [ deployment=alertmanager-config-sync ]                           100.0           
28fb43ce4d90  kube-system        deployment-ready-percent     [ deployment=calico-kube-controllers ]                            100.0           
2e57b5973770  cee-global         deployment-ready-percent     [ deployment=cee-global-product-documentation ]                   100.0           
69bcca641b4b  kube-system        deployment-ready-percent     [ deployment=cluster-cert-maintainer ]                            100.0           
2803753e1298  smi-cm             deployment-ready-percent     [ deployment=cluster-files-offline-smi-cluster-deployer ]         100.0           
948a96222d29  kube-system        deployment-ready-percent     [ deployment=coredns ]                                            100.0           
c5006862911f  cee-global         deployment-ready-percent     [ deployment=grafana ]                                            100.0           
346b7b8c0b54  cee-global         deployment-ready-percent     [ deployment=grafana-dashboard-metrics ]                          100.0           
e2bece200bd8  cee-global         deployment-ready-percent     [ deployment=kube-state-metrics ]                                 100.0           
2b99fde0f918  nginx-ingress      deployment-ready-percent     [ deployment=nginx-ingress-ingress-nginx-controller ]             100.0           
a01523e2af8d  nginx-ingress      deployment-ready-percent     [ deployment=nginx-ingress-ingress-nginx-defaultbackend ]         100.0           
cc8a64825b3e  cee-global         deployment-ready-percent     [ deployment=ops-center-cee-global-ops-center ]                   100.0           
5e74886b3429  smi-cm             deployment-ready-percent     [ deployment=ops-center-smi-cluster-deployer ]                    100.0           
72f4818bff4f  smi-ops-control    deployment-ready-percent     [ deployment=opscenter-controller ]                               100.0           
23a868c32ce9  cee-global         deployment-ready-percent     [ deployment=pgpool ]                                             100.0           
2c2d372c36d5  cee-global         deployment-ready-percent     [ deployment=prometheus-rules ]                                   100.0           
3950d7cbde90  cee-global         deployment-ready-percent     [ deployment=prometheus-scrapeconfigs-synch ]                     100.0           
a7bdb748677a  cee-global         deployment-ready-percent     [ deployment=pv-manager ]                                         100.0           
161b4d128721  cee-global         deployment-ready-percent     [ deployment=pv-provisioner ]                                     100.0           
2c4aa52f6c98  cee-global         deployment-ready-percent     [ deployment=show-tac-manager ]                                   100.0           
70b960ace2f0  cee-global         deployment-ready-percent     [ deployment=smart-agent-cee-global-ops-center ]                  100.0           
0a3fb053bbec  smi-certs          deployment-ready-percent     [ deployment=ss-cert-provisioner ]                                100.0           
7fd1e489a7e5  cee-global         deployment-ready-percent     [ deployment=thanos-query-frontend-hi-res ]                       100.0           
72587dc5987f  cee-global         deployment-ready-percent     [ deployment=thanos-query-hi-res ]                                100.0           
b8140482f112  *                  entitlement-status           [ tag=System ]                                                    0.0             
a3e2bc7a1b71  *                  filesystem-data-avail-bytes  [ hostname=ott-bm2-cm-cm-1 ]                                      626088103936.0  
29dced1e7b92  *                  filesystem-root-avail-bytes  [ hostname=ott-bm2-cm-cm-1 ]                                      6002253824.0    
1eb34dc3b330  *                  k8s-pods-status              [ phase=Failed ]                                                  0.0             
8d23272d645a  *                  k8s-pods-status              [ phase=Pending ]                                                 0.0             
65d9342f3c90  *                  k8s-pods-status              [ phase=Running ]                                                 56.0            
74c9de9ac37e  *                  k8s-pods-status              [ phase=Succeeded ]                                               0.0             
8a12153befc2  *                  k8s-pods-status              [ phase=Unknown ]                                                 0.0             
4ba6cc59b00c  *                  kubelet-node-status          [ condition=DiskPressure ]                                        0.0             
e343dc31dfcf  *                  kubelet-node-status          [ condition=MemoryPressure ]                                      0.0             

Grafana

Grafana is an open source data visualization tool used for displaying application metrics in interactive dashboards.

Accessing Grafana

In the Cisco Common Execution Environment (CEE), you can define and deploy Grafana dashboards using:

  • Git server pods, and

  • ConfigMap

managed through a combination of Kubernetes Custom Resource Definitions (CRDs) and Git repositories. Here's a summary of the process

You can access Grafana login page through Ingress using any of the standard web browsers. For instance, using Google Chrome navigate to the Grafana login page with the following Ingress URL:

https://grafana.<ipv4_address>.<customer_specific_domain_name>

NOTES:

  • customer_specific_domain_name - Specifies the customer's domain name.

Figure 2. Grafana – Login Page

Important


Authentication to Grafana happens through the CEE Ops Center since Grafana is associated with it. If the CEE Ops Center is configured with Lightweight Directory Access Protocol (LDAP), Grafana authenticates through LDAP.

Important


Third-Party Software Vulnerability - The Content Security Policy support in Grafana uses the unsafe-eval version of script-src because AngularJS is not fully migrated in Grafana.


Using Dashboards

The Grafana home page lists the dashboards bundled with CEE. The dashboards provide an overall status of the system.

To view the dashboards, perform the following steps:

  1. Navigate to the Grafana Login page using any standard web browser.

  2. Login to Grafana to view the home page.

    Figure 3. Grafana – Home Page
  3. Click icon on the left pane.

  4. Click Dashboards.

    1. By default, you can view the following dashboards.

      1. Host Summary – This dashboard provides an overview of CPU, Memory, Disk I/O Utilization, Filesystem Fullness and Filesystem Fill UP time. You can choose the machine from Machine drop-down list to view the host summary of individual machines available in the clusters.

      2. Host Details – This dashboard provides a detailed view on each of the following categories:

        - Basic CPU/ Mem / Disk Gauge

        - Basic CPU/ Mem / Disk Info

        - Basic CPU / Mem Graph

        - Basic Net / Disk Info

        - CPU Memory Net Disk

        - Memory Detail Meminfo

        - Memory Detail Vmstat

        - Memory Detail Vmstat Counters

        - System Detail

        - Disk Detail

        - Filesystem Detail

        - Network Traffic Detail

        - Network Sockstat

        - Network Netstat

        - Network Netstat TCP

        - Network Netstat TCP Linux MIPs

        - Network Netstat UDP

        - Network Netstat ICMP

        - Node Exporter

You can create new Dashboards or Data Sources in Grafana through settings tab.

Figure 4. Settings Tab

Important


The bundled dashboards are provisioned statically and cannot be modified. However, you can copy or clone the dashboards before saving the changes.

The following example imports custom Grafana dashboard from a Git repository.

Example:
cee# configure terminal
  grafana dashboards sample
  git-url https://wwwin-github.cisco.com/mobile-cnat-sample/sample-dashboards.git
  exit

Persistent Grafana Dashboards

The custom Grafana dashboards are made persistent so that the dashboards are not lost during pod restart, node shutdown or any upgrade. The Grafana dashboards are stored in the /mnt/stateful_partition/data/cee-global/data-postgres-x directory.

The Grafana pod has built-in APIs to manipulate the dashboard resources. These APIs will allow the user to perform the following functions:

  • Export or backup all Grafana dashboards as files

  • Restore Grafana dashboards from backup

  • Create a new Grafana dashboard

  • Modify the existing Grafana dashboard

  • Authenticate API using basic authentication

The valid users of the dashboards are either local users or TACACS users who have access to CEE Ops Center. You can configure the grafana enable-basic-auth { true | false } CLI in CEE Ops Center to enable or disable basic authentication. When enabled, you can perform all CRUD operations on the dashboards with the existing Grafana HTTP API.

User Management in Grafana

You can create and manage the local users and user groups through the CEE Ops Center as described in the Provisioning Local Users section.

Configuring Ingress for Prometheus

SMI allows a Kubernetes ingress resource with basic authentication to be added to Prometheus using Grafana. This allows SMI metrics to be used as a data source by an external Grafana instance.

  1. Login to Grafana User Interface.

  2. Select Configuration Data Sources.

  3. Click Add data source.

  4. Enter a name for the data source in the Name field.

  5. Select Type Prometheus.

  6. Enter the new ingress URL (e.g. prometheus-xxx) in the URL.

  7. Enable and configure Basic Auth

  8. Provide the same credentials as configured via the SMI Ops Center in the User and Password fields under Basic Auth Details.

  9. Enable Skip TLS Verify and keep the remaining options as it is.

  10. Click Save &Test. The result should be successful and the data source is ready to use.

Provisioning Local Users

A new YANG model is introduced in SMI to support user management in compliance with Cisco Secure Development Life-cycle (CSDL) requirements.

Note


This new YANG model is applicable to SMI Cluster Manager and all other product Ops Centers.


User Management

This chapter describes how to create and manage local users using the Ops Center CLI (for both the products and SMI Cluster Manager Ops Center).


Important


Users with administrator privileges can add, modify, and delete other users and groups. All the other users only have privileges to change their own password.


Adding a User

To add a new user, use the following configurations:

configure
  smiuser add-user username username password password
  exit 

NOTES:

  • smiuser add-user : Adds a new local user.

  • username username : Specifies the name of the user.

    username must be alphanumeric string.
  • password password : Specifies the password. The password must meet the following criteria:

    • Minimum 8 characters in length.

    • Contain at least one lowercase character.

    • Contain at least one uppercase character.

    • Contain at least one numeric character.

    • Contain at least one special character, which includes the following:

      • [ '~', '@', '#', '%', '^', '&', '*', '(', ')', '_', '+', '`', '-', '=', '[', ']', ':', '"', ';', '\'', '|', '<', '>', '?', ',', '.', '/', '$']


        Important


        Your password must not contain the '{' and '}' special characters.


      • Password must not start with '$'.

    • Password must not be simple or based on dictionary word.

    • Do not reuse passwords.

      Use the following command to configure the number of passwords to keep in history:

      password requisite pam_pwhistory.so debug enforce_for_root remember=12
    • Minimum number of days that are allowed between password changes is seven.

The following example adds a new user called 'user1' and assigns the password for the new user.

cee# configure terminal
  smiuser add-user username user1 password Cisco@123
message User added

The following example adds a new user called 'user2' and assigns the password for the new user.

cee# configure terminal
  smiuser add-user username user2 password Cisco@12345
message User added

In the following example, when an existing user name (user2) is added as a new user, the Ops Center displays an error message.

cee# configure terminal
  smiuser add-user username user2 password Cisco@12345
message User already exists

Creating Unprivileged Users with SSH Key

The SMI Cluster Manager allows creating unprivileged users on cluster nodes with SSH key access. These users will remain even after the SMI Cluster Manager is upgraded. Also, the SMI Cluster Manager considers the users created with the comment smi.user to be managed by the Cluster Manager. If an existing user, who is not an smi.user, is added to the configuration, the SMI Cluster Manager throws an error during cluster synchronization to prevent damaging or blocking communication to the system.

To add a SSH key and password to an user on all the nodes, use the following configuration:

configure 
  node-defaults os users username 
    password password 
    authorized-keys key_name 
    algorithm ssh_algorithm 
    key-data  key_data 
    exit 
  authorized-keys key_name 
   algorithm ssh_algorithm 
   key-data key_data 
   exit 
 exit 

To add a SSH key and password to an user on a specific node, use the following configuration:

configure 
  node node_name os users username 
    password password 
    authorized-keys key_name 
    algorithm ssh_algorithm 
    key-data  key_data 
    exit 
   authorized-keys key_name 
    algorithm ssh_algorithm 
    key-data key_data 
    exit 
  exit 

NOTES:

  • node-defaults os users username - Specifies the default value applicable to all the nodes for the selected user. username is the name of the user to be created.

  • node node_name os users username - Specifies the default value applicable to the specific node for the selected user. node_name is the name of the specific node. username is the name of the user to be created.

  • password password - Specifies the password used for authentication.

  • authorized-keys key_name - Specifies the name of the SSH key.

  • algorithm ssh_algorithm - Specifies the SSH algorithm used for generating the SSH key. For example, SSH-RSA or SSH-Ed25519 algorithm.

  • key-data key_data - Specifies the generated SSH key.

Deleting a User

To delete a user, use the following configuration:

configure
  smiuser delete-user username username
  exit 

Note


  • smiuser delete-user - Deletes a local user.

  • username username - Specifies the name of the user.

    username must be alphanumeric string.

The following example deletes a user called 'user2'.

cee# configure terminal
  smiuser delete-user username user2
message User deleted

In the following example, when a non-existing user is deleted, the Ops Center displays an error message.

cee# configure terminal
  smiuser delete-user username user2
message User does not exist

Modifying the Password

To modify the password (for self), use the following configuration:
configure
  smiuser change-self-password current_password current password new_password new_password 
  confirm_password new_password password_expire_days number_of_days
  exit
 

Note


  • smiuser change-password - Modifies the password for an user.

  • current_password current_password - Specifies the current password for an user.

  • new_password new_password - Assign a new password for the user. For information on password policy, see Adding a User section.

  • confirm_password new_password - Enter the newly assigned password one more time.

  • password_expire_days number_of_days - (Optional) Specifies the expiry date of the password. The default value is 180 days.


The following example updates the password for the current user.

cee# configure terminal
  smiuser change-self-password current_password Cisco@123 new_password Cisco@345 
  confirm_password Cisco@345 password_expire_days 180
message Password updated successfully

The following example updates the password for the user called 'user1' without assigning the password expiry date.

cee# configure terminal
  smiuser change-self-password current_password Cisco@123 new_password Cisco@345 confirm_password Cisco@345
message Password updated successfully
Reset the Administrator Password

You can reset the administrator password if you have access to the K8s Cluster through kubectl command-line utility.

To reset the administrator password:

  1. Enter the Ops Center Pod's EXEC mode.

  2. Use the following command to reset the administrator password.

    kubectl exec -it <pod_name> -n <pod_namespace> /usr/local/bin/reset-admin 
  3. Enter the new password when prompted.

NOTES:

  • kubectl exec -it - Executes a command inside a container. -it passes the standard input stream to the container or TTY.

  • <pod_name> -n - Specifies the name of the Pod. -n specifies the namespace scope for this CLI request.

  • <pod_namespace> - Specifies the namespace of the Pod.

  • /usr/local/bin/reset-admin - Resets the administrator password.

Modifying the Password for Other Users

You can modify the password for other users using the following configuration:

configure
  smiuser change-password username username current_password current_password new_password new_password 
  confirm_password new_password password_expire_days number_of_days
  exit
 

Note


  • smiuser change-password - Modifies the password for an user.

  • username username - Specifies the name of the user.

    username must be alphanumeric string.
  • current_password current_password - Specifies the current password for an user.

  • new_password new_password - Assign a new password for the user. For information on password policy, see Adding a User section.

  • confirm_password new_password - Enter the newly assigned password one more time.

  • password_expire_days number_of_days - (Optional) Specifies the expiry date of the password. The default value is 180 days.


The following example updates the password for the user called 'user1'.

cee# configure terminal
  smiuser change-password username user1 current_password Cisco@123 new_password Cisco@345 confirm_password Cisco@345 password_expire_days 180
message Password updated successfully

The following example updates the password for the user called 'user1' without assigning the optional password expiry date.

cee# configure terminal
  smiuser change-password username user1 current_password Cisco@123 new_password Cisco@345 confirm_password Cisco@345
message Password updated successfully

The following example updates the password for the user called 'user1' without assigning the password expiry date.

cee# configure terminal
  smiuser change-password username user1 current_password Cisco@123 new_password Cisco@345 confirm_password Cisco@345
message Password updated successfully

The following example updates the password for the user called 'user1' with an existing password.

cee# configure terminal
  smiuser change-password username user1 current_password Cisco@345 new_password Cisco@345 confirm_password Cisco@345
message Password has been already used

The following example updates the password for the user called 'user1' with different values for new password and confirm password parameters.

cee# configure terminal
  smiuser change-password username user1 current_password Cisco@345 new_password Cisco@345 confirm_password Cisco@567
message Passwords do not match

Updating the Password Length

To update the length of the password, use the following configuration:

configure
smiuser update-password-length length number_of_characters 
 exit 

Note


  • smiuser update-password-length - Updates the length of the password.

  • length number_of_characters - Specifies the length of the password. number_of_characters must be a numeric value.


The following example updates the minimum length of the password to 10 characters.

cee# configure terminal
  smiuser update-password-length length 10
message Password updated successfully

Group Management

This chapter describes how to create and manage user groups using the Ops Center CLI (of both the products and SMI Cluster Manager).

Adding a User Group

To add a user group, use the following configuration:

configure
smiuser add-group groupname group_name 
 exit 

Note


  • smiuser add-group - Adds a new user group.

  • groupname group_name - Specifies the name of the user group. group_name must be a alphanumeric value.


The following example adds a new user group called 'group1'.

cee# configure terminal
  smiuser add-group groupname group1
message Group added

In the following example, when a user group that already exists is added, the Ops Center displays an error message.

cee# configure terminal
  smiuser add-group groupname group1
message Group already exists

Deleting a User Group

To delete a user group, use the following configuration:
configure
smiuser delete-group groupname group_name 
 exit 

Note


  • smiuser delete-group - Deletes a user group.

  • groupname group_name - Specifies the name of the user group. group_name must be a alphanumeric value.


The following example deletes a new user group called 'group2'.

cee# configure terminal
  smiuser delete-group groupname group2
message Group deleted

In the following example, when a user group that does not exist is deleted, the Ops Center displays an error message.

cee# configure terminal
  smiuser delete-group groupname group2
message Group does not exist

Assigning an User to an User Group

To assign an user to an user group, use the following configuration:

configure
  smiuser assign-user-group username username group group_name 
   exit 

Note


  • smiuser assign-user-group - Assigns an user to a user group.

  • username username - Specifies the name of the user. username must be alphanumeric value.

  • groupname group_name - Specifies the name of the user group. group_name must be a alphanumeric value.


The following example assigns an user called 'user1' to a group called 'group1'.

cee# configure terminal
  smiuser assign-user-group username user1 group group1
message User assigned to group successfully

The following example assigns a non-existing user to an existing group.

cee# configure terminal
  smiuser assign-user-group username user20 group group1
message User does not exist

The following example assigns a non-existing group to an existing user.

cee# configure terminal
  smiuser assign-user-group username user1 group group10
message Group does not exist

Unassigning a User from a User Group

To unassign a user from a user group, use the following configuration:

configure
  smiuser unassign-user-group username username group group_name 
   exit 

Note


  • smiuser unassign-user-group - Removes an user from a user group.

  • username username - Specifies the name of the user. username must be alphanumeric value.

  • groupname group_name - Specifies the name of the user group. group_name must be a alphanumeric value.


The following example removes an user from a group.

cee# configure terminal
  smiuser unassign-user-group username user1 group group1
message User un-assigned from group successfully

The following example removes a non-existing user from a group.

cee# configure terminal
  smiuser unassign-user-group username user10 group group1
message User is not a member of this group

The following example removes an user from an non-existing group.

cee# configure terminal
  smiuser unassign-user-group username user1 group group10
message Group does not exist

Log Forwarding

Log Forwarding allows you to forward the log entries (including the host and container-level log entries) stored in JournalD to the external collectors. SMI supports target hosts such as Fluent-x, Splunk, Loki and Grafana Cloud for log forwarding.

To stream data, Fluent-x uses the Forward protocol and Splunk uses HTTPS. Fluent Bit sends logs to Grafana Cloud by providing the appropriate URL and ensuring that TLS is enabled.


Note


SMI enables only one target host of Grafana Cloud type for logs forwarding. However, Splunk, Fluent-bit, and Loki can be enabled in parallel.


The CEE utilizes FluentD for buffering and persistent connection support. FluentD is an open-source data collection and consumption software. Using FluentD, you can collect logging events from various sources and unify it for better usage and understanding. For more information of FluentD, see https://docs.fluentd.org/.

By default, FluentD is configured with the following parameters to support buffering and keepalive:

total_limit_size 1GB 
chunk_limit_size 8MB 
compress text 
flush_mode interval 
flush_interval 5s 
overflow_action drop_oldest_chunk 
retry_timeout 1h 

The following figure depicts the high-level Log Forwarding architecture:

Figure 5. Log Forwarding Architecture

Prerequisites

You can enable Log Forwarding in CEE to forward log entries to the external collectors. You must ensure that the K8s cluster is installed in the CEE before enabling Log Forwarding.

Requirements

The following are the requirements for enabling Log Forwarding:

Fluent-x

  1. The target endpoint must be a Fluentbit or FluentD instance or cluster with the Forward protocol input plugin enabled.

  2. The endpoint must be hosted within the Kubernetes clusters or a remote system with network reachability.

Enabling Log Forwarding

Enabling Log Forwarding on Fluent-x

This section describes the procedure involved in enabling Log Forwarding on Fluent-x and Splunk.

This section describes the procedure involved in enabling Log Forwarding on Fluent-x.

Use the following configuration to enable Log Forwarding on Fluent-x.

configure 
logging fluent host fluentbit/fluentd_endpoint_fqdn/ipv4_address port endpoint_port 

NOTES:

  • logging fluent – Specifies the Fluent forwarding parameters.

  • host fluentbit/fluentd_endpoint_fqdn/ipv4_address – Specifies the Fluentbit or Fluentd instance host information.

  • port endpoint_port – Specifies the Fluentbit or Fluentd instance port information.

The log forwarding to an external Fluent-D or Fluent-Bit instance, where logs can be streamed to supporting application such as ElasticSearch.

Example:
cee# configure terminal
  logging fluent host 172.16.181.41 port 8001
  exit

Enabling Log Forwarding on Splunk

Use the following configuration to enable Log Forwarding on Splunk.

configure 
	   logging splunk host splunk_endpoint_fqdn/ipv4_address port hec_port auth-token splunk_configured_token 

NOTES:

  • logging splunk – Specifies the Splunk endpoint.

  • host splunk_endpoint_fqdn/ipv4_address – Specifies the Splunk host information.

  • port hec_port – Specifies the Splunk port information.

  • auth-token splunk_configured_token – Specifies the Splunk Authentication Token for the HTTP Event Collector interface.

The following example configures log forwarding to an external Splunk server.

Example:
cee# configure terminal
  logging splunk host 172.16.181.41 port 8001
  exit

Enabling Log Forwarding on StarOS

Use the following configuration to enable Log Forwarding from StarOS.

configure  
  logging 
    syslog cee_ops_center_listener_ip_address 
    facility local5  
    msg-format rfc5424  
    commit 
    

NOTES:

  • syslog - Specifies the syslog messages.

  • cee_ops_center_listener_ip_address - Specifies the CEE Ops Center Listener IP address.

  • facility local5 - Specifies the syslog facility values.

  • msg-format rfc5424 - Specifies the syslog message format.

Configuring CEE Ops Center as a Listener

You can configure the CEE Ops Center to listen to the logs from StarOS.

Use the following configuration to configure CEE Ops Center as listener:

configure  
  logging 
    listener enable 
    external-ip cee_ops_center_listener_ip_address 
    commit 
  

NOTES:

  • listener enable - Enables the CEE Ops Center to listen to the logs from StarOS.

  • external-ipcee_ops_center_listener_ip_address - Specifies the CEE Ops Center Listener IP address.

Configuring Fluent-D to Support Splunk

You can configure Fluent-Bit to send logs to Fluent-D. When the Fluent-D receives the logs, it forwards the receibed logs to Splunk.

To configure Fluent-D to support Splunk, use the following configuration:

configure 
   logging splunk host splunk_host 
   logging splunk port splunk_port 
   logging splunk auth-token auth_token 

NOTES:

  • logging splunk host splunk_host —Specify the Splunk host information.

  • logging splunk port splunk_port—Specify the Splunk port information.

  • logging splunk auth-token auth_token—Specify Splunk Authentication Token for the HTTP Event Collector interface.

Configuring Fluent-Bit to Support Splunk

You can configure Fluent-Bit to send logs to Splunk. This configuration is applicable only when you configure the local cluster as the as the Listener and the remote cluster in remote forwarding mode.

When you configure Fluent-Bit to support Splunk, the local logs are sent to Splunk using Fluent-Bit and the remote logs are sent to the fluent listener (Fluent-Bit). The Fluent-Bit in turn forwards the remote logs to Splunk.

To configure Fluent-Bit to support Splunk, use the following configuration:

configure 
   logging splunk listener enable 
   logging splunk listener external-ip external_vip_ip 
   logging splunk host splunk_host 
   logging splunk port splunk_port 
   logging splunk auth-token auth_token 

NOTES:

  • logging splunk listener enable —Enable Fluent-Bit to send logs to Splunk.

  • logging splunk listener external-ip external_vip_ip —Specify the external virtual IP address of the local cluster.

  • logging splunk host splunk_host —Specify the Splunk host information.

  • logging splunk port splunk_port—Specify the Splunk port information.

  • logging splunk auth-token auth_token—Specify the Splunk Authentication Token for the HTTP Event Collector interface.

Configuring Fluent-Bit to Support Remote Forwarding

You can configure Fluent-Bit to send logs to the remote cluster.

To configure Fluent-Bit to support remote forwarding, use the following configuration:

configure 
  logging fluent host remote_cluster_ip 
  logging fluent port remote_cluster_port 
  logging fluent protocol forward 

NOTES:

  • logging fluent host remote-cluster-ip —Specify the Fluent-Bit host information.

  • logging fluent port remote-cluster-port —Specify the Fluent-Bit port information.

  • logging fluent protocol outbound_protocol —Specify the outbound protocol.

Configuring Fluent-Bit to Support Remote Listener

You can configure Fluent-Bit to receive logs from the remote cluster.

To configure Fluent-Bit to support remote listening, use the following configuration:

configure 
  logging splunk listner enable 
  logging splunk listner external-ip external_vip_ip 

NOTES:

  • logging splunk listner enable —Enable Fluent-Bit to support remote listening.

  • logging splunk listner external-ip external_vip_ip —Specify the external virtual IP address of the remote cluster

Configuring Fluent-Bit to Support Grafana Cloud

You can configure Fluent-Bit to send logs to Grafana Cloud.

To configure Fluent-Bit to to enable Grafana Cloud log forwarding, use the following configuration:
configure 
   logging grafana-cloud host grafana_cloud_host 
   logging grafana-cloud port grafana_cloud_port 
   logging grafana-cloud http-user http_user 
   logging grafana-cloud http-password http_password 

To configure Fluent HTTP proxy, use the following configuration:

configure 
   logging proxy http-proxy proxy_url 
   logging proxy https-proxy proxy_url 
   logging proxy no-proxy comma_seperated_url 

NOTES:

  • logging grafana-cloud host grafana_cloud_host —Specify the host logs.

  • logging grafana-cloud port grafana_cloud_port —Specify the host port. The default port is set to 443.

  • logging grafana-cloud http-user http_user —Specify the HTTP user information.

  • logging grafana-cloud http-password http_password —Specify the HTTP user password.

  • logging proxy http-proxy proxy_url —Specify the HTTP proxy URL.

  • logging proxy https-proxy proxy_url —Specify the HTTPS proxy URL.

  • logging proxy no-proxy comma_seperated_url —Specify the comma-separated domain name.

Labels and Label Keys

To configure the label, use the following configuration:

configure 
   logging grafana-cloud labels key value 
   exit 

To configure the label keys, use the following configuration:

configure 
   logging grafana-cloud labels-keys [ $KEY1,$KEY2 ] 

NOTES:

  • By default, the labels for the stream are set to job=fluent-bit, log_source=cndp, hostname={nodeName}.

  • You can configure K8s label keys for the log stream such as container name ($k8s_container_name) and namespace ($k8s_namespace_name). The label keys must start with $.

Configuring Fluent-Bit to Support Syslog

You can configure Fluent-Bit to send logs to the Syslog server. The Syslog messages are sent over UDP, TCP, or TLS in RFC3164 or RFC5424 format.

To configure log forwarding to the Syslog server, use the following configuration:

config 
   logging syslog host server_host  
   logging syslog mode server_mode 
   logging syslog port server_port 
   logging syslog syslog_format syslog_format 
   logging syslog_maxsize syslog_maxsize 
   end 

NOTES:

  • logging syslog host server_host —Specify the domain or IP address of the remote Syslog server.

  • logging syslog mode server_mode —Specify the TCP, TLS or UDP transport type.

  • logging syslog port server_mode —Specify the TCP, TLS or UDP port of the remote Syslog server.

  • logging syslog syslog_format syslog_format —Specify the rfc3164 or rfc5424 Syslog protocol format to use.

  • logging syslog_maxsize syslog_maxsize —Specify the maximum size allowed per message. The value must be an integer representing the number of bytes allowed.

Configuring Fluent Worker to Drop and Retain Logs

To enable CEE log forwarding for Fluent worker pods, use the following configuration.

The filters on Fluent worker pods that intake the logs from each node reduce the volume of logs being forwarded.

configure 
   logging worker drop-namespace-logs namespace_names 
   logging worker drop-pod-logs pod_names 
   logging worker exclude-logs-with-annotation true 
   logging worker keep-pod-logs pod_names 
   logging worker keep-namespace-logs namespace_names 
   logging worker drop-os-service-logs service_names 
   logging worker remove-keys [ keys ] 

NOTES:

  • logging worker drop-namespace-logs namespace_names —Specify to drop logs by namespaces. namespace_names must be a regex string with selected namespace names inside double quotes.

  • logging worker drop-pod-logs pod_names —Specify to drop logs by pods. pod_names must be a regex string with selected pod names inside double quotes.

  • logging worker exclude-logs-with-annotation true —Specify to exclude logs from selected pods using annotation.


    Note


    After adding or removing annotation from any pod, it is required to restart the fluent-worker pod for the changes to take effect.


  • logging worker keep-pod-logs pod_names —Specify to retain logs by pods. pod_names must be a regex string with selected pod names inside double quotes.

  • logging worker keep-namespace-logs namespace_names —Specify to retain logs by namespaces. namespace_names must be a regex string with selected namespace names inside double quotes.

  • logging worker drop-os-service-logs service_names —Specify to drop logs from selected OS services. The currently supported values for services_names are audit, kernel, or kubelet.

  • logging worker remove-keys [ keys ] —Specify to remove keys from log entries. The log entry keys to be dropped are case sensitive.

Viewing the Logs in Loki

You must enable the Loki (Grafana) to view all the logs the CEE Ops Center was listening.

Use the following configuration to enable the Loki:

configure  
  logging 
    loki enable 
    retention-period retention_period_in_hours 
    commit 
  

NOTES:

  • loki enable - Enables Loki to view to the logs.

  • retention-periodretention_period_in_hours - Specifies the retention period of the logs in hours.

Verifying Log Forwarding

You can verify the external collectors for the log entries received. The logs are specific to the external collector. For example, you can use Kibana to verify the entries in ELK stack.

Troubleshooting

This section provides information on the common issues encountered while enabling log forwarding.

To resolve the issues related to Log Forwarding, verify if:

  • The configured endpoint IP/FQDN and port number are correct.

  • The external endpoint is reachable from the all Kubernetes nodes (both control plane and worker).

  • The Forward protocol plugin is enabled at the endpoint.

  • The logs are generated from any of the nodes.

  • The external endpoint is configured to dump the logs into a file for verifying the incoming entries.

Log Rate Limiting

This section describes the basic principle used in rate limiting log messages in SMI Logging functionality.

Rate Limiting Log Messages

The SMI uses the systemd-journald service—a Linux system service for collecting and storing log data—for storing Kubernetes system and pods level log messages to files on the disk. You can configure Rate Limiting to reduce the number of messages logged. Also, Rate Limiting discards some log messages while limiting others. You can apply Rate Limiting to all the messages in the system based on the service so that logs from the services do not interfere with each others limit.

You can configure Rate Limit by defining the RateLimitIntervalSec and RateLimitBurst parameter in /etc/systemd/journald.conf file. If the messages exceed the specified value defined in the RateLimitBurst parameter within the specified interval defined in the RateLimitIntervalSec parameter, the log messages are dropped until the interval period is over.

In the following example, the log messages are dropped, if it exceeds 10000 messages within an interval of one second.
RateLimitIntervalSec=1s 
RateLimitBurst=10000 

The disk usage reserved for journal log affects the RateLimitBurst parameter. The value defined in the RateLimitBurst parameter is multiplied by a factor based on the disk usage reserved for the journal logs. More messages are dropped within interval when less disk space is available.

You can run the following command to find out if the log messages are dropped:

sudo systemctl status systemd-journald 

Note


Using this command, you can verify the number of suppressed messages as well.


The following example shows the number of suppressed messages from the docker.service:

Sep 02 21:09:58 tb15-ultram-cnat-cnat-core-protocol-data1 systemd-journald[3791]: 
Suppressed 12229 messages from docker.service

Gather TAC

Gather TAC is the primary mechanism through which the application debug files are extracted from a cluster. Whenever a debug package is required, a user can trigger the Gather TAC through the CLI or API. The user can specify a start and end time to download the index files (for that specific time period) of all the artifacts from the system. The user can extract the following data using Gather TAC:

  • A tar ball of system and K8s pod logs.

  • A tar ball of all bulk statistics produced within the specified time period.

  • A tar ball of the current configuration, last 100 commits, and all audit information.

  • A tar ball of the Prometheus data covering the time period.

  • A list of all core files covering the time period

Debugging Data in CEE

Using the Gather TAC function, you can collect logs from the coredump, Kubernetes, Kernel, Kubelet, and container logs. The collected files are compressed and stored in an internal Apache server.

Debugging Data

  • The following commands are used for requesting the TAC debug information.

    tac debug pkg create and delete

    New command
    tac-debug-pkg create last<time_to_now> 
    tac-debug-pkg delete last<time_to_now> 
    Old command
    tac-debug-pkg create {from start_time | to end_time} {logs-filter namespace namespace | pod_name pod_name} 
    {cores-filter { process process_name }} {{ cfg | cores  | logs | metrics | stats } {false | true}} 
    tac-debug-pkg delete tac-id tac_id 

    Previously, the command syntax required a user to specify a time period by entering from and to criteria.

    The new syntax for tac-debug-pkg create and tac-debug-pkg delete commands now allows users to specify the duration relative to the current time using the last keyword:

    tac-debug-pkg create last<time_to_now> 
    tac-debug-pkg delete last<time_to_now> 

    <time_to_now> specifies the time to now in terms of the number of:

    Days - Expressed as "D", “d”, or “day”; for example “5D”

    Hours - Expressed as “H”, “h”, or “hour”; for example “3h”

    Minutes - Expressed as “M”, “m”, “min”, or “minute”; for example “18minute”

    Seconds - Expressed as “S”, “s”, “sec”, or “second”; for example “3600sec”

    Additionally, omitting the to keyword from the from parameter instructs the system to collect the TAC package from the specified time until now:

    tac-debug-pkg create from <time_to_now> 

    The from keyword no longer requires the use of the to keyword if you are creating the TAC package from a specific time until now.

    Table 2. tac-debug-pkg usage examples

    User Intention

    Command

    collect tac-debug-package for last 50 seconds

    tac-debug-pkg create last 50S 

    collect tac-debug-package for last 10 minutes

    tac-debug-pkg create last 10min 

    collect tac-debug-package for last 3 hours

    tac-debug-pkg create last 3H 

    collect tac-debug-package for last 7 days

    tac-debug-pkg create last 7day 

    delete all collected tac-debug-package for the past 2 days

    tac-debug-pkg delete last 2D 

    collect tac-debug-package from 2019-08-09_01:00:00 to now

    tac-debug-pkg create from 2019-08-09_01:00:00 

    Other tac debug pkg commands

    
    tac-debug-pkg merge tac-id tac_id 
    tac-debug-pkg status 
    tac-debug-pkg list 
  • Access the Apache server through the Ops Center.

    
    URL: https://show-tac-manager.smi-show-tac.{IP address}.<domain_name> 
    
  • A directory is created based on the tac-id: /tac/[tac-id]/

  • A manifest file is created for each of the tac-debug-pkg to the store metadata. A sample manifest.json file is shown below:

    
    { 
           tac-id:"1554868784", 
           from:"2019-04-08_00:00:00", 
           to:"2019-04-10_00:00:00", 
           cores:[{node:"node-01", 
                   file:"/cores/node-01/core.test.0.2f4afbe0dc494e879d3f42429fed1c38.20130.1554770483000000.xz"}, 
                  {node:"node-01", 
                   file:"/cores/node-01/core.test.0.2f4afbe0dc494e879d3f42429fed1c38.18448.1554770577000000.xz"}], 
           config:[{node:"node-01", 
                    file:"/tac/1554868784/config/<ipv4address>_configuration.tar.gz.base64"}], 
           stats:[{node:"node-01", 
                   file:"/tac/1554868784/stats/Stats_2019-04-08_00-00-00_2019-04-10_00-00-00.tar.gz"}], 
           logs:[{node:"node-01", 
                  file:"/tac/1554868784/logs/Logs_2019-04-10_04-00-17.tar.gz"}], 
           metrics:[{node:"node-01", 
                  file:"/tac/1554868784/metrics/Metrics_2019-04-08_00-00-00_2019-04-10_00-00-00.tar.gz"}]} 
        } 
    

Important


Authentication to the Apache server is enabled by default.
  • The following services collect and retrieve logs, data chunks, and bulk statistics.

    • Core retrieving service - This service retrieves the list of coredump based on the time duration. The systemd coredump service compresses the core files. The configuration parameters in the core files determines the name of the core file. Due to the core file large size, they are not copied on the disk. You can access it through the proxy from its original location.

      
      file location: 
         ./cores/{node name}/core.xxx... 
         Sample file location on server: 
         cores/node-1/core.test.0.99775297099c489ea08052d533206b66.10213.1554504010000000.xz 
      
    • Logs retrieving service - This service collects Kernel, System, Containers level logs using JournalD service. In return, the sender receives a tar file which contains logs files based on the time duration. The files are created with following naming convention:

      
      ./tmp/logs/{random string}/{namespace}/{pod}/{container.log} 
      

A sample file (Tar) format with the timestamp embedded in the file name is shown below:


./tmp/logs/{random string/Logs_{yyyy-mm-dd_hh-mm-ss}.tar.gz 
  • Prometheus data retrieving service - This service retrieves snapshot of data chunks saved by the Prometheus service. You can specify the time duration for saving a snapshot. A sample file and directory structure for the data snapshot is shown below:

    
    directory: data/snapshots/20190405T175611Z-7ee562389bd9ab66/01D7N0QVNBRXF5MRVFQB5MQQCW 
       files: 
       ./chunk/0001 
       ./index 
       ./meta.json 
       ./tombstones 
    
  • Bulk statistics retrieving service - This service retrieves statistics saved by the Prometheus service. You can specify the time duration for saving the statistics. A tar file is stored onto the Apache server for review. A sample file location on the server is shown below:

    
       tac/0123456789/stats/Stats_2019-4-04_00-00-00_2019-04-04_18-00-00.tar.gz 
    

The following example collect logs for pods in cdl-global namespace for CDL application.

Example:
cee# tac-debug-pkg create from 2019-12-18_00:00:00 to 2019-12-18_20:00:00 logs-filter { namespace cdl-global }
response : Tue Dec 18 18:40:55 UTC 2019 tac-debug pkg ID : 157660805

Log Monitoring

For real time monitoring of application logs, the CEE Ops Center uses the Kubetail utility. The Kubetail utility allows:

  • Tailing multiple pods in a single stream.

  • Tailing all containers within the Pods.

  • Using regular expression to match or find Pod names.

  • Color coding the output of each pod.

To monitor applications logs using the Kubetail utility in the CEE Ops Center, use the following command:

cluster logs kubetail_options 
Example:
my-pod-v1
my-pod-v1 -c my-container
my-pod-v1 -t int1-context -c my-container
'(service|consumer|thing)' -e regex
-l service=my-service
--selector service=my-service --since 10m
--tail 1

NOTES:

  • cluster logs - Tails a set of pods.

  • kubetail_options - Specifies the following options to tail Kubernetes pods:

    • [-h], --help - Displays the help text.

    • [-c], --container - Specifies the name of the container to tail in the pod. You can use this option multiple times. By default, this option specifies all the containers in the pod.

    • [-n], --namespace - Specifies the Kubernetes namespace where the pods are located.

    • [-t], --context - Specifies the Kubernetes context. For example, int1-contex. It relies on the ~/.kube/config file for the context.

    • [-l], --selector - Specifies the Label selector. You can ignore the pod name if this option is used.

    • [-d], --dry-run - Prints the names of the matched pods and containers.

    • [-p], --previous - Returns the logs for the previous instances of the pods, if the pods are available. Returns either true or false. Default value is false.

    • [-f], --follow - Specifies whether the logs must be streamed. Returns either true or false. Default value is true.

    • [-s], --since - Displays the logs that are newer than a relative duration. For example, 5 seconds, 2 minutes, or 3 hours. Default value is 10 seconds.

    • [-b], --line-buffered - Specify this flag to use a line-buffered. Default value is false.

    • [-e], --regex - Specifies a matching name to use (regex or substring).

    • [-j], --jq - Parse a json output using this option. For example, --jq ".logger + \" \" + .message".

    • [-k], --colored-ouput - Displays a colored output. The options include:

      • pod - Display the name of the pod in color.

      • line - Display a entire line in color.

      • false - Displays the output without color.

      The default value is false.

    • [-z], --skip-colors - Specifies the comma-separated list of colors which is not used in the output. If you have green foreground on black, this option will skips dark grey and green colors. For example, -z 2,8,10. Default value is 7,8.

      • --timestamps - Displays the timestamps for each log line.

      • --tail - Displays the lines of the recent log files. Default value is -1.

    • [-v], --version - Prints the Kubetail utility version.

    • [-r], --cluster - Specifies the name of the Kubeconfig cluster to use.

    • [-i], --show-color-index - Displays the color index before the pod name prefix shown before each log line. Normally only the pod name is added as a prefix before each line, for example [app-5b7ff6cbcd-bjv8n]. If this option is selected, then the color index is added as well: [1:app-5b7ff6cbcd-bjv8n]. This is useful if you have color blindness or if you want to know which colors to exclude (see "--skip-colors"). Default value is false.

Init Logs

The cluster deployer supports debug logging in kubeadm init for errors such as cluster synchronization failure due to misconfiguration.

A debug message captures the error logs in /var/tmp/kubeadm_out.log to access the setup and retrieve the kubeadm init logs. You can view the error messages during cluster sync.

Cluster Monitoring

The monitoring module in CEE monitors the local and remote clusters. The monitoring module is based on Prometheus, Thanos and Node Exporter open source projects. It provides an overall centralized metrics view for the entire cluster. Prometheus is configured to scrape the local Kubernetes resources and the Node Exporter. The Node Exporter provides all the system level information, while Thanos collects these metrics and export them to Grafana. You can visualize the monitored metrics using Grafana.


Note


The SMI Cluster Manager acts as a Central Monitoring System.


Also, you can configure the Thanos to collect the metrics from the remote cluster. It is possible to configure any number of remote clusters using the CLI. The connections to the remote cluster is secured through Transport Layer Security (TLS) protocol. For montoring the clusters, the local Thanos acts as client and the remote cluster act as server. Therefore, you must configure the local system with client certificates, and remote clusters with server certificates.

Configuring the Remote Cluster

You can configure the Cluster Manager to monitor the remote clusters for alerts. The remote clusters act as a server.

To configure the Cluster Manager for monitoring the remote clusters, use the following configuration:

configure 
  prometheus query-mode server 
    prometheus server-settings external-ip external_vip_ip 
      server-settings ssl-key ssl_eky 
      server-settings ssl-crt ssl_crt 
      server-settings ssl-ca  ssl_ca 

NOTES:

  • prometheus query-mode server —Configure the Cluster Manager to monitor the remote clusters for alerts.

  • prometheus server-settings external-ip external_vip_ip —Configure the server settings for the specified remote cluster.

  • server-settings ssl-key ssl_eky —Specify the SSL key.

  • server-settings ssl-crt ssl_crt —Specify the SSL certificate.

  • server-settings ssl-ca ssl_ca —Specify the SSL certificate authority.

Configuring the Cluster Manager to Collect the Metrics from Remote Clusters

You can configure the Cluster Manager to monitor the remote clusters. The Cluster Manager acts as a client in this scenario.

To configure the Cluster Manager to collect the alerts from remote clusters:

  1. Configure the remote cluster.

    configure 
      prometheus query-mode client 
        federation remote-cluster-certs remote_cluster_IP 

    Example:

    cee# config terminal
    cee(config)# prometheus query-mode client federation remote-cluster-certs 10.84.114.218
    
    name          bxbpod
    
    # SSL multiline raw certificates
    ssl-key       "ssl-key"
    ssl-crt       "ssl-crt"
    ssl-ca        "ssl-ca"
  2. Add all the remote clusters to the federation.

    configure
      prometheus federation subordinates remote_cluster_IPs 

NOTES:

  • prometheus query-mode client - Configures the Cluster Manager to monitor the remote clusters.

  • federation remote-cluster-certs remote_cluster_IP - Configures the specifies remote cluster with SSL certificates.

  • prometheus federation subordinatesremote_cluster_IPs - Add all the remote clusters to the federation.

Cluster Alerting

In CEE, the Alerting module is responsible for gathering the alerts from local and remote clusters. The Alerting module is based on the Prometheus and Alert Manager Open Source projects. It provides a centralized alerts view of the entire cluster. You can visualize the alerts using Grafana. The Prometheus scrapes the local cluster metrics.

You can configure the Prometheus with the alert rules to generate the alerts when the specified alert criteria is met. Also, you can configure Prometheus and Alert Manager to process the alerts by other modules like Alert logger, Alert router, and SNMP Trapper etc. The Alert Manager is configured with multiple webhooks to hand over to the alerts to these modules.

CIMC Alerts Exporter

It is possible to configure a cluster with a cluster of CIMC devices. This enables the CIMC devices to receive alerts from the configured CIMC cluster. The CIMC exporter periodically polls the configured CIMC clusters and exports the received alerts through Prometheus.

Configuring the Remote Cluster

You can configure the Cluster Manager to monitor the remote clusters for alerts. The remote clusters act as a server.

To configure the Cluster Manager for monitoring the remote clusters, use the following configuration:

configure 
   prometheus query-mode server 
      prometheus server-settings external-ip external_vip_ip 
         server-settings ssl-key ssl_eky 
         server-settings ssl-crt ssl_crt 
         server-settings ssl-ca ssl_ca 

NOTES:

  • prometheus query-mode server —Configure the Cluster Manager to monitor the remote clusters for alerts.

  • prometheus server-settings external-ip external_vip_ip —Configure the server settings for the specified remote cluster.

  • server-settings ssl-key ssl_key —Specify the SSL key.

  • server-settings ssl-crt ssl_crt —Specify the SSL certificate.

  • server-settings ssl-ca ssl_ca —Specify the SSL certificate authority.

Configuring the Cluster Manager to Collect the Alerts from Remote Clusters

You can configure the Cluster Manager to monitor the remote clusters. The Cluster Manager acts as a client in this scenario.

To configure the Cluster Manager to collect the alerts from remote clusters:

  1. Configure the remote cluster.

    configure 
      prometheus query-mode client 
        federation remote-cluster-certs remote_cluster_ip 

    Example:

    cee# config terminal
    cee(config)# prometheus query-mode client federation remote-cluster-certs 10.84.114.218
    
    name          bxbpod
    
    # SSL multiline raw certificates
    ssl-key       "ssl-key"
    ssl-crt       "ssl-crt"
    ssl-ca        "ssl-ca"
  2. Configure the alert port to receive the alerts:

    configure 
      prometheus federation remote-cluster-certs alert-rx-port port_number 

    Example:

    cee# config terminal
    cee(config)# prometheus federation remote-cluster-certs alert-rx-port 8701
  3. Add all the remote clusters to the federation.

    configure
      prometheus federation subordinates remote_cluster_ip 

NOTES:

  • prometheus query-mode client —Configure the Cluster Manager to monitor the remote clusters.

  • federation remote-cluster-certs remote_cluster_ip —Configure the specifies remote cluster with SSL certificates.

  • prometheus federation remote-cluster-certs alert-rx-port port_number —Configure the alert port to receive the alerts.

  • prometheus federation subordinates remote_cluster_ip —Add all the remote clusters to the federation.

Configuring CIMC

Use the following configuration to configure the CIMC cluster:

configure 
  cimc enabled 
    cluster cluster_name 
    default username username 
    default password password 
   server IPv4address 
    name cimc_server_name 
   server IPv4address 
    name alert_name 
    username username 
    password password 

NOTES:

  • cimc enabled - Enables the CIMC cluster.

  • cluster cluster_name - Specifies the CIMC cluster name.

  • default username username - Specifies the default user name of the CIMC cluster.

  • default password password - Specifies the default password of the CIMC cluster.

  • server IPv4address - Specifies the CIMC server's IPv4 address.

  • name cimc_server_name - Specifies the CIMC server name.

  • name alert_name - Specifies the alert name.

  • username username - Specifies the user name for authentication.

  • password password - Specifies the password for authentication.

To view the active alerts use the following command:

cee# show alerts active summary 
NAME                   UID           SEVERITY  STARTS AT       SOURCE               SUMMARY                                                                                                          
-------------------------------------------------------------------------------------------------------------------------------------------------------------------------------------------
k8s-pod-not-ready      0239ce185c88  critical  07-10T18:58:59  makoruko-aio-control-plane  Pod / has been in a non-ready state for longer than 1 minute.                                                    
k8s-deployment-replic  d048b003fce0  critical  07-10T17:23:29  makoruko-aio-control-plane  Deployment cdl/documentation has not matched the expected number of replicas for longer than 2 minutes.          
k8s-pod-not-ready      93b83787d3b9  critical  07-10T17:22:29  makoruko-aio-control-plane  Pod / has been in a non-ready state for longer than 1 minute.                                                    
k8s-pod-not-ready      1c9e6f3a4abd  critical  07-10T17:22:29  makoruko-aio-control-plane  Pod / has been in a non-ready state for longer than 1 minute.                                                    
k8s-deployment-replic  3a170f244c17  critical  07-10T17:23:29  makoruko-aio-control-plane  Deployment cdl/api-cdl-ops-center has not matched the expected number of replicas for longer than 2 minutes.     
k8s-pod-not-ready      9859a350e6bc  critical  07-10T17:22:29  makoruko-aio-control-plane  Pod / has been in a non-ready state for longer than 1 minute.                                                    
k8s-deployment-replic  113f35cc5f71  critical  07-10T17:23:29  makoruko-aio-control-plane  Deployment smi/deployer-ui-smi-cluster-deployer-deployer-console has not matched the expected number of repl...  
k8s-pod-not-ready      9e623b582dc4  critical  07-10T17:22:29  System                      Pod / has been in a non-ready state for longer than 1 minute.

Configuring Email Notification for Alerts

You can configure the Ops Center to send the email notifications to a maximum of 10 recipients for the generated alerts. To configure email notifications for the alerts, use the following configuration:

configure 
  smtp enabled 
  smtp recipients recipient_name 
    email email_id 
  exit 

NOTES:

  • smtp enabled - Enables sending email notification for the generated alerts.

  • smtp recipients recipient_name - Specifies the name of the recipient.

  • email email_id - Specifies the email address of the recipient.

UCS Server Status Alerts

Feature Description

If the UCS server is powered down or non-accessible, an alert will be set up to report and notify the UCS server availability status.

The SMI metrics track and report faults on the UCS server. The cimc_server_not_reachable_alert metric tracks the availability status of the UCS server. To establish an HTTP connection during login, this metric is set to 1 or 0 based on success (response) or failure.

Monitoring CIMC Reachability

To monitor CIMC reachability, log on to the CEE CLI Ops Center. You can enable CIMC, define a cluster, and add configuration for server IP and credentials using the commands in the Configuring CIMC section.

When CIMC is not reachable, the value for the cimc_server_not_reachable_alert metric will be set to 1 and exposed for Prometheus. These values can be tracked in the Grafana dashboard.

After sometime, the server-not-reachable-alert alert will be created in CEE. If the CIMC becomes reachable, the exposed metric will be deleted from the Prometheus client to prevent it from firing any longer, and the alert will be moved to history.

Node Problem Detector

Table 3. Feature History

Feature Name

Release

Feature Description

Support for Node Problem Detector

2025.02.1

This feature supports onboarding of Node Problem Detector (NPD) through CEE Ops center.

The NPD enhances hardware resiliency by detecting and addressing issues at the OS, hardware, and platform levels. It prevents the impact of node problems on Kubernetes pods, thereby maintaining application performance and reliability.

Note that the NPD complements existing metrics, alerting, and log forwarding solutions.

Command introduced:

node-problem-detector agent enabled

The Node Problem Detector (NPD) is a CNDP monitoring add-on designed to enhance cluster resilience by identifying and addressing node-level issues across operating system (OS), hardware, and platform layers. Its primary objective is to detect potential problems early, preventing them from affecting Kubernetes pods and ensuring optimal application performance and reliability.

Core capabilities of NPD

The key capabilities of NPD are:

  • Detection of node issues: With proper configuration, it is possible to identify and report problems that may impact node performance, including:

    • Kernel issues: Such as kernel deadlocks and corrupted file systems.

    • Container runtime issues: For example, unresponsive runtime daemons.

    • Infrastructure daemon issues: Such as failures in critical services like NTP.

    • Hardware issues: Detects faulty CPUs, memory, or disks.

  • Monitoring types:

    • Log-based monitoring: Continuously scans system logs for predefined patterns of known issues.

    • Custom-script-based monitoring: Enables users to define and execute custom monitoring rules for unique use cases.

  • Exporter types:

    • Prometheus exporter: Used for prometheus-formatted metrics

    • K8s exporter: Used for reporting k8s events/conditions to K8s api-server.

Benefits of NPD

  • Proactive Issue Detection: Quickly identifies issues at the node level, reducing the risk of application disruptions.

  • Enhanced Reliability: Prevents node-level problems from affecting Kubernetes pods, ensuring consistent application performance.

  • Resource Efficiency: Operates with minimal system overhead, enabling smooth cluster operations.

  • Extensibility: Supports custom rules and scripts, allowing users to tailor monitoring to their specific needs.

How NPD works

The Node Problem Detector follows a systematic process to monitor and manage node health:

  1. Log Parsing: Monitors system logs to detect errors and patterns associated with node issues.

  2. Custom Rules: Executes predefined scripts and rules for tailored issue detection.

  3. Issue Reporting: Detects problems and reports them to the Kubernetes API server.

  4. Metrics Generation: Exports metrics to monitoring tools such as Prometheus and Grafana.

Enable the Node Problem Detector

To enable the Node Problem Detector in your Kubernetes environment, perform the following steps:

Procedure


Step 1

Execute the following CLI command from CEE to enable the NPD.

Example:

node-problem-detector agent enabled 

This command enables NPD with default configurations and built-in monitoring rules for detecting well-known issues.

The following is an example configuration with the default rules that are loaded automatically when the NPD feature is enabled.

day0-kernel-monitor.json: |-
  {
    "plugin": "kmsg",
    "logPath": "/dev/kmsg",
    "lookback": "5m",
    "bufferSize": 10,
    "source": "day0-kernel-monitor",
    "metricsReporting": true,
    "conditions": [],
    "rules": [
      {
        "type": "temporary",
        "reason": "OOMKilling",
        "pattern": "Killed process \\d+ (.+) total-vm:\\d+kB, anon-rss:\\d+kB, file-rss:\\d+kB.*"
      },
      {
        "type": "temporary",
        "reason": "TaskHung",
        "pattern": "task [\\S ]+:\\w+ blocked for more than \\w+ seconds\\."
      },
      {
        "type": "temporary",
        "reason": "UnregisterNetDevice",
        "pattern": "unregister_netdevice: waiting for \\w+ to become free. Usage count = \\d+"
      },
      {
        "type": "temporary",
        "reason": "KernelOops",
        "pattern": "BUG: unable to handle kernel NULL pointer dereference at .*"
      },
      {
        "type": "temporary",
        "reason": "KernelOops",
        "pattern": "divide error: 0000 \\[#\\d+\\] SMP"
      },
      {
        "type": "temporary",
        "reason": "Ext4Error",
        "pattern": "EXT4-fs error .*"
      },
      {
        "type": "temporary",
        "reason": "Ext4Warning",
        "pattern": "EXT4-fs warning .*"
      },
      {
        "type": "temporary",
        "reason": "IOError",
        "pattern": "Buffer I/O error .*"
      },
      {
        "type": "temporary",
        "reason": "MemoryReadError",
        "pattern": "CE memory read error .*"
      },
      {
        "type": "temporary",
        "reason": "ReadOnlyFileSystem",
        "pattern": "Remounting filesystem read-only"
      },
      {
        "type": "temporary",
        "reason": "CPUSoftLockup",
        "pattern": "BUG: soft lockup - CPU#\\d+ stuck for \\d+s!.*"
      },
      {
        "type": "temporary",
        "reason": "CPUHighTemperature",
        "pattern": "CPU\\d+: \\w+ temperature above threshold, cpu clock throttled \\(total events = \\d+\\)"
      },
      {
        "type": "temporary",
        "reason": "IncorrectCalbleReconn",
        "pattern": "\\w+: \\([\\S ]+\\): Enslaving as a backup interface with a down link"
      }
    ]
  }
day0-systemd-service-monitor.json: |-
  {
    "plugin": "journald",
    "pluginConfig": {
      "source": "systemd"
    },
    "logPath": "/var/log/journal",
    "lookback": "5m",
    "bufferSize": 10,
    "source": "day0-systemd-service-monitor",
    "metricsReporting": true,
    "conditions": [],
    "rules": [
      {
        "type": "temporary",
        "reason": "SystemdNetworkdStart",
        "pattern": "Starting Network Service..."
      }
    ]
  }
day0-systemd-networkd-monitor.json: |-
  {
    "plugin": "journald",
    "pluginConfig": {
      "source": "systemd-networkd"
    },
    "logPath": "/var/log/journal",
    "lookback": "5m",
    "bufferSize": 10,
    "source": "day0-systemd-networkd-monitor",
    "metricsReporting": true,
    "conditions": [],
    "rules": [
      {
        "type": "temporary",
        "reason": "BondInterfaceConfigured",
        "pattern": "bd\\d+: Configured"
      }
    ]
  }
day0-ucs-monitor.json: |-
  {
    "plugin": "journald",
    "pluginConfig": {
      "source": "otelcol"
    },
    "logPath": "/var/log/journal",
    "lookback": "5m",
    "bufferSize": 10,
    "source": "day0-ucs-monitor",
    "metricsReporting": true,
    "conditions": [],
    "rules": [
      {
        "type": "temporary",
        "reason": "CorrectableDIMMErrors",
        "pattern": ".*\\| read \\d+ correctable ECC errors on CPU\\d+ DIMM [A-Z]\\d+\\s+\\| Asserted"
      },
      {
        "type": "temporary",
        "reason": "RAIDCtrlReset",
        "pattern": ".*SLOT-HBA:Controller encountered a fatal error and was reset"
      },
      {
        "type": "temporary",
        "reason": "RAIDCtrlFIFOFull",
        "pattern": ".*I2C Controller \\d+ software FIFO is full.*"
      },
      {
        "type": "temporary",
        "reason": "RAIDCtrlI2cRWError",
        "pattern": ".*Restarting storaged as we hit an I2C read/write error = 0[xX][0-9a-fA-F]+"
      }
    ]
  }
day0-clock-sync-monitor.json: |-
  {
    "plugin": "custom",
    "pluginConfig": {
      "invoke_interval": "60s",
      "timeout": "10s"
    },
    "source": "day0-clock-sync-monitor",
    "metricsReporting": true,
    "conditions": [],
    "rules": [
      {
        "type": "temporary",
        "reason": "ClockOutOfSync",
        "path": "/npd/plugin/check_timedatectl_property.sh",
        "args": ["NTPSynchronized", "yes"],
        "timeout": "5s"
      }
    ]
  }

Step 2

[Optional] If additional monitoring rules are required, configure them using the CEE CLI. Custom rules can address specific issues unique to your environment.

The following is an example configuration for additional rules.

node-problem-detector agent enabled
node-problem-detector agent monitors docker-corrupt-overlay-monitor
 journald source       dockerd
 journald log-path     /var/log/journal
 journald enable-report-metrics true
 journald default-conditions CorruptDockerOverlay2
  reason  NoCorruptDockerOverlay2
  message "docker overlay2 is functioning properly"
 exit
 journald rules a-rules
  pattern "Error trying v2 registry: failed to register layer: rename /var/lib/docker/image/(.+) /var/lib/docker/image/(.+): directory not empty.*"
  type    temporary
  reason  CorruptDockerImage
 exit
 journald rules b-rules
  pattern   "returned error: readlink /var/lib/docker/overlay2.*: invalid argument.*"
  type      permanent
  condition CorruptDockerOverlay2
  reason    CorruptDockerOverlay2
 exit
exit
node-problem-detector agent monitors ntp-monitor
 custom invoke-interval 60s
 custom timeout  5s
 custom default-conditions NTPProblem
  reason  NTPIsUp
  message "NTP service is up"
 exit
 custom rules rule1
  type      permanent
  condition NTPProblem
  reason    NTPIsDown
  path      /npd/plugin/check_systemd_service.sh
  args      [ chrony.service ]
  timeout   3s
 exit
exit
node-problem-detector agent monitors readonlyfs-monitor
 kmsg log-path /dev/kmsg
 kmsg look-back 5m
 kmsg default-conditions ReadonlyFilesystem
  reason  FilesystemIsNotReadOnly
  message "Filesystem is not read-only"
 exit
 kmsg rules ruleee
  pattern   "Remounting filesystem read-only"
  type      permanent
  condition ReadonlyFilesystem
  reason    FilesystemIsReadOnly
 exit
exit
node-problem-detector agent monitors syslog-bad-disk-monitor
 filelog timestamp-regex ^.{15}
 filelog message-regex  "(?i)Currently unreadable.*sectors|(?i)Offline uncorrectable sectors"
 filelog timestamp-format-regex "Jan _2 15:04:05"
 filelog log-path       /var/log/messages
 filelog skip-list      [ " audit:" " audit[" ]
 filelog default-conditions DiskBadBlock
  reason  DiskBadBlock
  message "Disk has no Bad Block"
 exit
 filelog rules rule1
  pattern   "Currently unreadable.*sectors|Offline uncorrectable sectors"
  type      permanent
  condition DiskBadBlock
  reason    DiskBadBlock
 exit
exit

Step 3

Confirm that NPD is running and actively monitoring nodes.

Step 4

Use monitoring tools such as Prometheus or Grafana to visualize metrics generated by NPD.


Metrics for node issues

When the node problems are detected, the SMI generates the following key metrics for monitoring:

Metric Name Description Value Type

problem_counter_total

Note


Temporary issue counts may increase, while permanent issues are either 0 or 1 (since permanent issues require a node reset).

Displays the total number of occurrences of a specific type of problem. Counter
problem_gauge Indicates whether a specific type of problem is currently affecting the node (1 for yes, 0 for no). Gauge
service_status Displays the status of an internal service (1 if the service is up, 0 if it is down). Gauge

These metrics provide valuable insights into the health and performance of nodes, enabling administrators to take corrective actions.

Best practices for using NPD

To maximize the benefits of NPD, follow these best practices:

  • Customize for specific needs: Add custom monitoring rules to address unique issues in your environment.

  • Integrate with monitoring tools: Leverage tools such as Prometheus and Grafana to visualize and act on alerts.

  • Regularly update rules: Keep detection rules updated to reflect changes in your infrastructure or application stack.

  • Monitor system overhead: Ensure that NPD operates efficiently with minimal impact on cluster resources.

Push KPIs to S3 Using Thanos

Feature Description

In this feature, the CEE provides you the option to backup the local data stored in Prometheus to a remote storage object, for example, Amazon Web Services (AWS) S3, by using Thanos.

This feature provides the following two deployment models:

  • Thanos Sidecar

  • Thanos Receive

Architecture

This section describes the high-level architecture for the two deployment models namely, Thanos Sidecar and Thanos Receive with AWS S3 as the storage object.

Figure 6. Architecture for Thanos Sidecar Deployment
Figure 7. Architecture for Thanos Receive Deployment
Components

This section describes the main components for the architecture of the two deployment models.

  • Sidecar: It connects to Prometheus, reads its data for query and/or uploads it to the cloud storage.

  • Store Gateway: It serves metrics inside of a cloud storage bucket.

  • Receiver: It receives data from Prometheus’s remote-write WAL, exposes it and/or uploads it to the cloud storage.

  • Querier/Query: It implements Prometheus’s v1 API to aggregate data from the underlying components.

  • Query Frontend: It implements Prometheus’s v1 API and proxies it to Query while caching the response and optional splitting by queries day.

How it Works

Thanos with Sidecar

This section describes how to configure the Sidecar deployment with AWS S3.

Prerequisites

  • S3 bucket in AWS


    Note


    For more information about how to create an AWS S3 bucket, refer to the original product documentation.


Configuring the Sidecar

Use the following sample CLI commands in the CEE Ops-Center to set up the Sidecar deployment.

prometheus thanos-s3-object-store bucket zx-thanos-test
prometheus thanos-s3-object-store endpoint s3.us-east-1.amazonaws.com
prometheus thanos-s3-object-store access-key
prometheus thanos-s3-object-store secret-key

Thanos with Receive

This section describes how to configure the Remote-write target including the Receiver URL and enable TLS support for the same using the CEE Ops-Center for the Receive deployment with AWS S3.

Prerequisites

  • S3 bucket in AWS

  • Deploy Thanos Recieve


    Note


    For more information about how to create an AWS S3 bucket, refer to the original product documentation.


Configuring the Remote Write Target with Receiver URL

Enter the URL of the Thanos Receiver in the CEE Ops-Center CLI.

A sample configuration for Prometheus to work with Thanos Receive with an HTTP endpoint is shown below.


[user/global] cee# config
Entering configuration mode terminal
[user/global] cee(config)# prometheus remote-write target demo
[user/global] cee(config-target-demo)# url http://thanos-receive-hi-res:10000/api/v1/receive
[user/global] cee(config-target-demo)# commit
Fri Dec  10 04:28:29.838 UTC+00:00
Commit complete.
[user/global] cee(config-target-demo)#
Message from confd-api-manager at 2021-12-10 04:28:31...
Helm update is STARTING.  Trigger for update is CHANGE.

Configuring the Remote Write Target with TLS Enabled

Remote write to Thanos Receive or any other target with TLS enabled is also supported. You can input the necessary ca/cert/key file by using the CEE Ops-Center CLI.

A sample configuration about how to configure remote-write target with TLS enabled is shown below. This configuration enables you to configure Prometheus to work with Thanos Receive with an HTTPS endpoint.

Assume the target remote server has a self-signed server and user has the CA certificate for it.

[user/global] cee(config)# prometheus remote-write target demo
Fri Dec  3  20:58:39.735 UTC+00:00
[user/global] cee(config-target-demo)# url https://thanos-receive-hi-res:10908/api/v1/receive
Fri Dec  3  20:58:51.609 UTC+00:00
[user/global] cee(config-target-demo)# tls-config tls-
Possible completions:
  tls-ca     CA certificate to validate API server certificate with.
  tls-cert   Certificate file for client cert authentication to the server.
  tls-key    Key file for client cert authentication to the server.
[user/global] cee(config-target-demo)# tls-config tls-ca
Fri Dec  3  20:59:05.384 UTC+00:00
(<AES encrypted string>):
[Multiline mode, exit with ctrl-D.]
> ***************************
> ****************************************************************
> ****************************************************************
> ****************************************************************
> ****************************************************************
[user/global] cee(config-target-demo)# tls-config skip-verify
Possible completions:
  false  true
[user/global] cee(config-target-demo)# tls-config skip-verify false
Fri Dec  3  20:59:40.188 UTC+00:00
[user/global] cee(config-target-demo)# commit
Fri Dec  3  20:59:42.797 UTC+00:00
Commit complete.

After the configuration, the Prometheus remote_write is configured as follows and the CA certificate from user input is created on the shown path in the Prometheus container.

remote_write:
- tls_config:
    ca_file: /etc/remote-write-certs-shared/demo-ca
    insecure_skip_verify: false
  url: https://thanos-receive-hi-res:10908/api/v1/receive

Sending Prometheus Server Metrics to Grafana Cloud

Feature Description

The CEE leverages the existing remote-write feature to support the following functionalities:

  • Push the Prometheus server metrics to Grafana Cloud

  • Enable the following Prometheus parameters for CNDP Grafana Cloud integration:

    • Remote Timeout

      The remote-timeout-seconds command sets the timeout for requests to the remote write endpoint, in seconds. Default: 30 seconds.

    • Queue Configuration

      The queue-config command configures the queue used to write to remote storage.

    • Relabel Configuration

      The relabel-configs command defines a list of relabel configurations before the metrics are written to remote storage. The relabeling feature in Prometheus rewrites the label set of a target dynamically.

Remote Write Configuration

Configuring Remote Write to Push Prometheus Metrics

To push the Prometheus metrics to Grafana Cloud using remote-write, use the following sample configuration:

prometheus remote-write target demo
   url https://prometheus-us-central1.grafana.net/api/prom/push
   basic-auth username 725569
   basic-auth password $8$ntCDRl2FkMDlm8mj9FohYwTuy/jo+7Cka0msfP2qW3Y=
   proxy-url http://proxy-wsa.esl.cisco.com:80
   exit

NOTES:

  • url —Specify the target URL of Grafana Cloud.

  • basic-auth username —Specify the username in Confd.

  • basic-auth password —Specify the password in Confd. The password is encrypted in Confd and passed to the metrics helm chart.

  • proxy-url —Specify the optional proxy URL to access Grafana Cloud in Confd.

Configuring Prometheus Parameters

To configure the Prometheus parameters to Grafana Cloud using remote-write, use the following sample configuration:

  • Remote Timeout—The remote-timeout-seconds command sets the timeout for requests to the remote write endpoint, in seconds. Default: 30 seconds.

    The following is a sample configuration:

    prometheus remote-write target demo
       remote-timeout-seconds 60
       exit
  • Queue Configuration—The queue-config command configures the queue used to write to remote storage.

    The following is a sample configuration:

    prometheus remote-write target demo
       ...
       queue-config capacity 500
       queue-config max-shards 100
       queue-config min-shards 2
       queue-config max-samples-per-send 300
       queue-config batch-send-deadline-seconds 10
       exit

    NOTES:

    • queue-config capacity : Specify the number of samples to buffer per shard. Default: 2500.

      It is recommended to have adequate capacity in each shard to buffer several requests. The adequate capacity can maintain the throughput while processing occasional slow remote requests.

    • queue-config max-shards : Specify the maximum number of shards. Default: 200.

    • queue-config min-shards : Specify the minimum number of shards. Default: 1.

    • queue-config max-samples-per-send : Specify the maximum number of samples per send. Default: 500.

    • queue-config batch-send-deadline-seconds : Specify the maximum time in seconds that a sample will wait in buffer. Default: 5 seconds.

  • Relabel Configuration—The relabel-configs command defines a list of relabel configurations before the metrics are written to remote storage. The relabeling feature in Prometheus rewrites the label set of a target dynamically.

    The following is a sample configuration:

    prometheus remote-write target demo
     ...
     relabel-configs test1
        target-label test1_label
        regex        (.+);(.+)
        replacement  ${1}@${2}
        action       replace
        source-labels container
        source-labels pod
        exit
     exit

NOTES:

  • target-label : Specify the label to which the resulting value is written in a replace action.

  • regex : Specify the regular expression against which the extracted value is matched.

    Default = (.*)

  • replacement : Specify the replacement value against which a regex replace is performed if the regular expression matches.

    Default = $1

  • action : Specify the replace, keep, or drop action to perform based on regex matching.

    Default = replace

  • source-labels : Specify the source label to select values from existing labels.

  • Multiple relabeling steps can be configured per scrape configuration. The steps are applied to the label set of each target in order of appearance in the configuration file.

  • Note that Prometheus will drop any label with empty value, hence use the labels with caution.

K8s Certificates Auto-Renewal

Certificate Management with Kubeadm

In kubeadm v1.21.0, client certificates generated by kubeadm expire after 1 year. The root certificates expires in 10 years. This feature enables monitoring and automatic renewal of kubeadm certificates before the expiry date from the CM or CEE. The CEE triggers an alert to notify the user of any certificate that is going to expire in 30 days.

The smi-cluster-maintainer pod monitors the k8s certificates and automate the renewal process, regardless of the cluster sync.

How it Works

This section describes the sequence of operation for the feature.

  1. The certificates in CM managed K8s clusters, control planes, workers, and external ETCD nodes is checked every 12 hours.

  2. If any certificate is expiring in 60 days on the nodes, then the auto-renew process is triggered.

    • If the renewal is successful, then the following checks shows all the certificates as valid.

    • If the renewal is unsuccessful, then the auto-renew process is re-initiated for the next cycle or iteration of validating the certificates.

  3. If any certificate is expiring in 30 days on the nodes, then the auto-renew process is triggered along with sending an alert to the user.

    In such cases, a manual intervention might be required to renew the certificates, which are nearing their expiry date.

    The kubernetes certificate expiry alert is show below.

    Rules:

    • Alert: kube_certificate_expiring

      • Annotations:

        • Type: Kubernetes Certificate Expiring Alarm

        • Summary: "Kubernetes certificate {{ $labels.cert_path }} on host: {{ $labels.node_name }} is expiring in {{ $labels.days_to_expiry }} days."

      • Expression:

         | 
              kube_certificate_expiring != 0 
      • Labels:

        • Severity: critical


Note


The certificate auto-renewal process must restart the api-server. You might experience a temporary k8s API downtime during the certificate auto-renewal process.


OnDemand LDAP Connectivity Check

Feature Summary and Revision History

Summary Data

Applicable Product (s) or Functional Area

KVM-based application deployment support

K8s-based application deployment support

Applicable Platforms

Bare Metal, OpenStack, VMware

Feature Default Setting

Disabled – Configuration Required

Related Changes in this Release

Not Applicable

Related Documentation

UCC CEE Configuration and Administration Guide

UCC SMI Operations Guide

Revision History

Revision Details

Release

First introduced.

2022.02.1

Feature Description

The SMI Ops Center provides an external authentication using LDAP support. The LDAP configuration can be configured in the SMI Ops Center using CLI or the RESTCONF APIs.

This feature enables you to validate a new LDAP configuration before adding it to the system or an existing LDAP configuration.

How it Works

This section describes how the feature works.

How to Validate a New Configuration

The steps to validate a new LDAP configuration are as follows.

  1. Login to the SMI Ops Center.

  2. Provide the LDAP new configuration inputs to validate (see the following example ).
    [pv/global] cee# smildap validate-security-config validate-new-security-config { ?
    Possible completions:
      base-dn                LDAP Base DN
      bind-dn                LDAP Bind DN
      group-attr             Group attribute
      group-mapping          LDAP group to application security mapping
      ldap-filter            LDAP Filter - use %s to sub username
      ldap-server-url        LDAP Server URL (https://tools.ietf.org/html/rfc2255)
      ldap-username-domain   LDAP Username Domain
      password               Password
      username               Existing User name in LDAP server
  3. Validate the LDAP new configuration (see the following example configuration).

    cee(config)# smildap validate-security-config validate-new-security-config 
    { base-dn dc=smi-lab,dc=com bind-dn cn=%s,ou=people,dc=smi-lab,dc=com group-attr 
    memberOf group-mapping { group admin ldap-group group1 } username user5 password 
    Passwd@123 ldap-filter cn=%s ldap-server-url ldap://209.165.200.224 }
    Mon Jun  20 05:02:24.635 UTC+00:00
    message accept "admin" external-user-group 1117 1117 /tmp

How to Validate an Existing LDAP Configuration

Use the following example configuration to validate an existing LDAP configuration.

cee# smildap validate-security-config validate-current-security-config
 
Mon Jun  20 05:07:41.765 UTC+00:00
 
Value for 'username' (<string>): user5
 
Value for 'password' (<string>): ********
 
message accept "admin" external-user-group 1117 1117 /tmp