Troubleshoot Wireless Issues with Catalyst Center
Available Languages
Contents
Introduction
This document describes troubleshooting Catalyst 9800 Wireless LAN Controller (WLC), AP, and client connectivity issues using Cisco Catalyst Center.
Prerequisites
- The Wireless LAN Controller must be added to Catalyst Center and show a Managed state in inventory.
- Telemetry status on the WLC must show Up.
Requirements
Cisco recommends that you have the knowledge of these topics:
- Command Line Interface (CLI) or Graphic User Interface (GUI) access to Wireless LAN Controller
- Command Line Interface (CLI) or Graphic User Interface (GUI) access to Catalyst Center
Components Used
The information in this document is based on these software and hardware versions:
- 9800 Model WLC
- Cisco IOS XE 17.15.5 version
- Catalyst Center 2.3.7 version
The information in this document was created from the devices in a specific lab environment. All of the devices used in this document started with a cleared (default) configuration. If your network is live, ensure that you understand the potential impact of any command.
Collect Data from Catalyst Center
Once a Catalyst 9800 Series WLC is added to Catalyst Center for Assurance, the platform pulls data through multiple collection methods — SNMP polling, streaming telemetry, NetFlow, Syslog, CLI-based collection, APIs, and IP SLA. Each mechanism serves a different purpose: some report basic device health (CPU, memory, KPIs), while others deliver granular detail (PoE status, client sessions, wireless performance).
- Device/Inventory Health (SNMP + CLI): Reachability, CPU, memory, interface stats, and software version — collected via standard SNMP polling and CLI.
- Syslog: System and operational log messages sent to Catalyst Center, which acts as the configured syslog server.
- Wireless Telemetry (NETCONF/YANG streaming): The core Assurance feed. It streams AP and client-level data in near real time — client onboarding and roaming events, RSSI/SNR, AP radio/RF statistics, and WLC internal health counters.
To receive this data, the Wireless LAN Controller must be in managed state on Catalyst Center, with the telemetry status showing as up between the 9800 Controller and Catalyst Center.
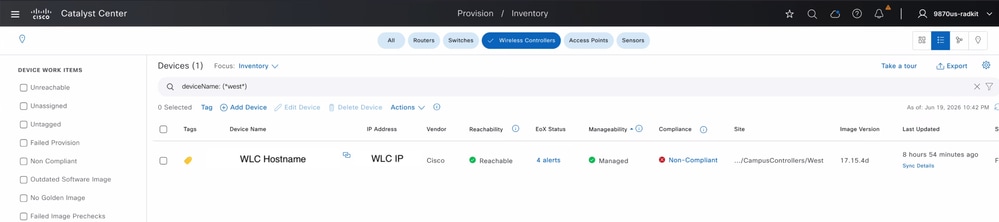 Wireless LAN Controller Status on Catalyst Center
WLC#show telemetry connection all
Telemetry connections

Index     Peer Address            Port VRF       Source Address         State     State Description
----- -------------------------- ----- --- -------------------------- ---------- --------------------
0            CATC_IP             25103  0         WLC_IP                Active    Connection up
By default, Cisco Catalyst Center is configured with health, issue, and event settings that include specific thresholds and priorities for Wireless Controllers, Access Points, Wireless Clients, and Applications. Catalyst Center generates events and alerts based on the data it receives from these managed devices and the configured event settings. Additionally, custom profiles can be created to tailor these settings according to specific network requirements, allowing for more precise monitoring and alerting based on the unique needs of the network environment.
Issue with Catalyst 9800 Series Wireless Controller
When a Wireless LAN Controller (WLC) experiences problems such as reachability loss, slow performance, accessibility errors, an outage, or degradation in a specific service, Cisco Catalyst Center provides built-in visibility that lets you reconstruct what was happening on the controller at the exact time of the issue — without needing to log in to the device directly.
Reviewing Controller Health with Device 360
The Device 360 view consolidates a controllers reachability, telemetry status, historical issues, generated events, and performance statistics into a single timeline-driven dashboard, making it the first place to look when investigating a reported WLC problem.
Navigate to Provision > Inventory > Wireless Controller > [search for the controller] > click the device name > Device 360.
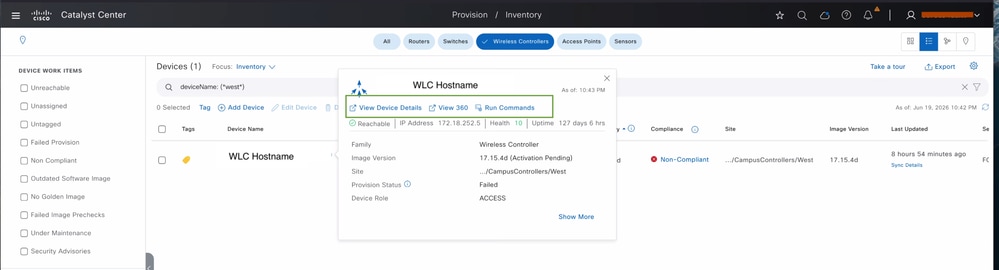 View 360 for Wireless LAN Controller

Note: The same view can also be reached from Assurance > Health > Network, then clicking the device name in the Network Devices table.
Device 360 lets you move the health timeline slider back to any point within the supported historical window (Catalyst Center Assurance data is retained for up to 30 days) to see exactly what the controller status looked like at the time of the incident. For that selected window, the view surfaces:
Device reachability — whether the controller was reachable and managed.
Telemetry status — health of the SNMP/Syslog/NETCONF telemetry feeding Assurance.
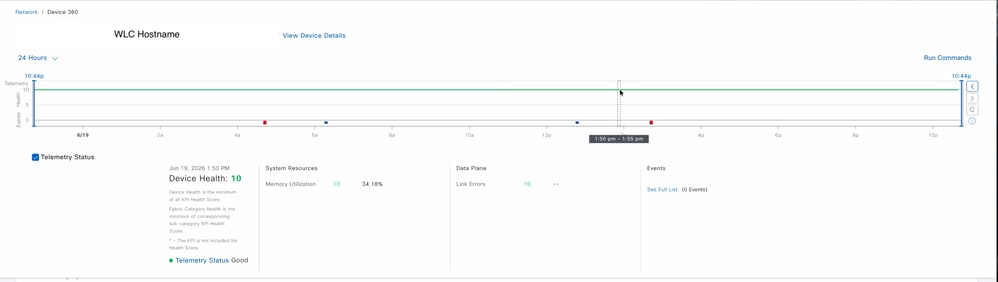 Telemetry Status of Wireless LAN Controller
Issues observed — Assurance-detected problems on the device during that period.
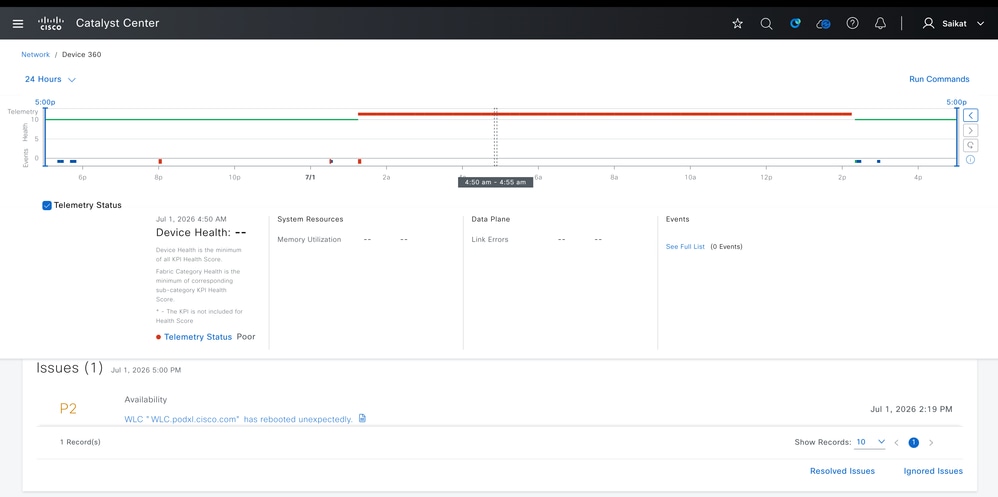 Issues Reported for Wireless LAN Controller
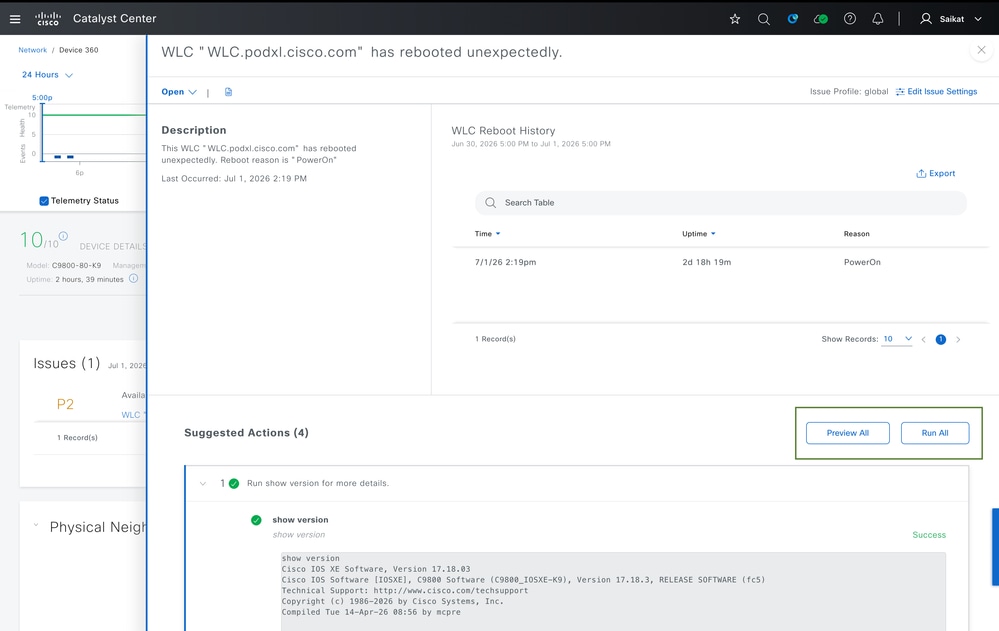
By clicking a specific issue you can see detailed information about it, along with suggested actions to resolve it or investigate further.
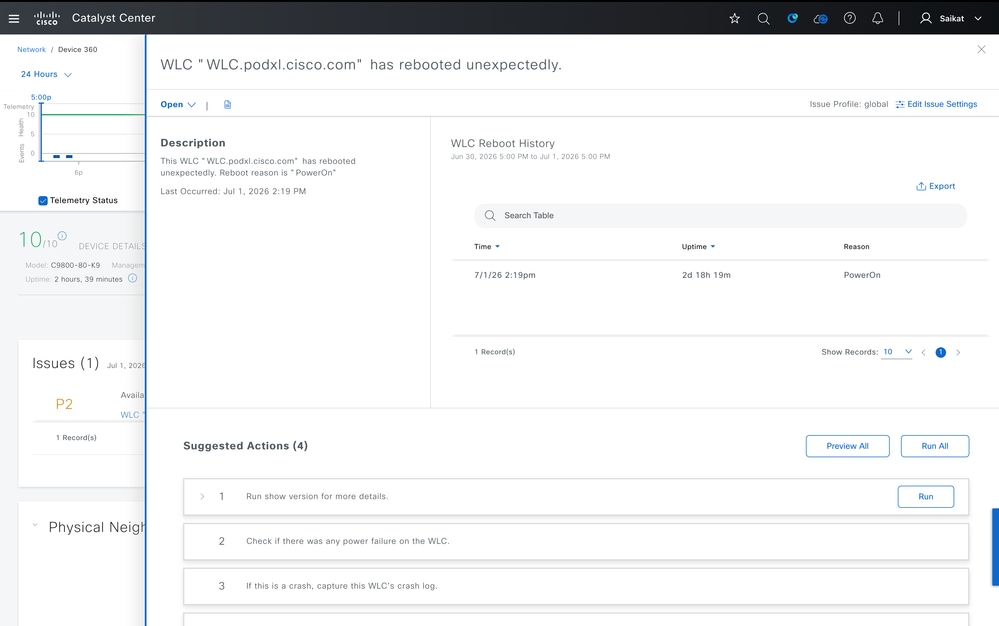 Suggested Action for Issue Reported on WLC
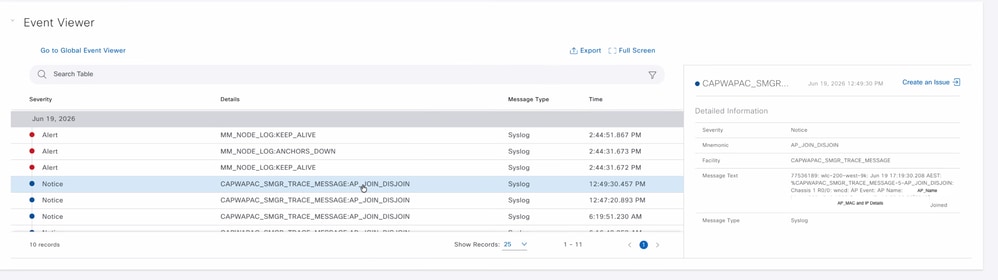
 Event Viewer for Wireless LAN Controller - Example1
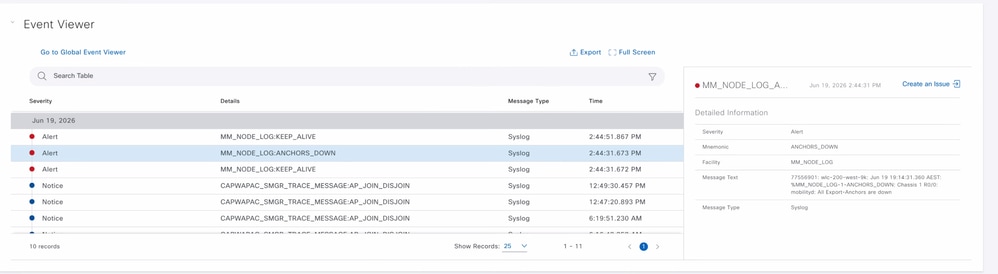
 Event Viewer for Wireless LAN Controller - Example2
Performance statistics — CPU and memory utilization, temperature, uptime, HA state, and last reload reason.
Connected clients — including breakdowns by local, foreign, anchor, and idle client counts.
AP status — the join/health state of access points associated with the controller.
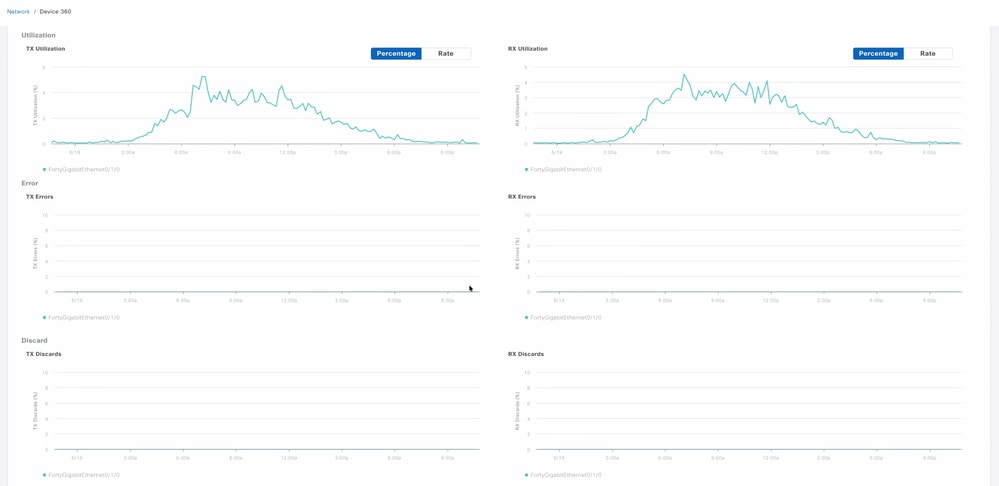
 WLC Statistics on Catalyst Center
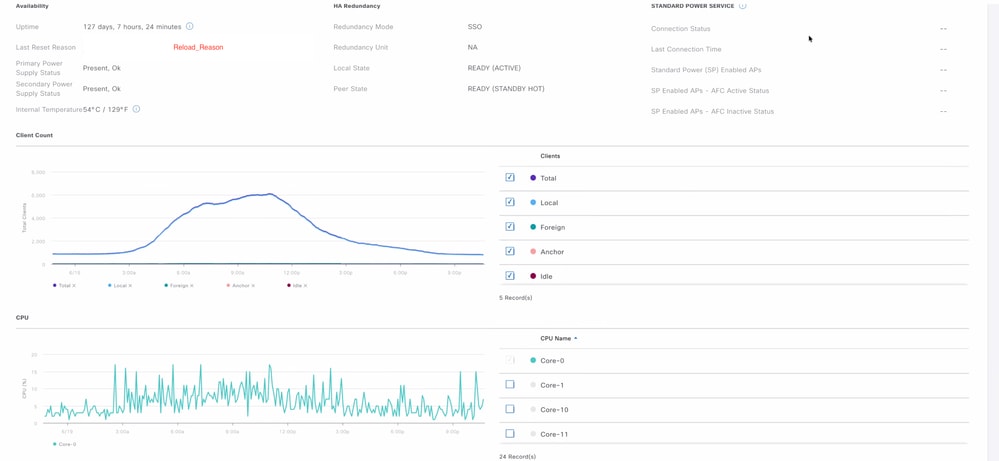 WLC Statistics on Catalyst Center
Interface statistics — per-interface status, RX/TX packet counts, utilization, discards, and errors.
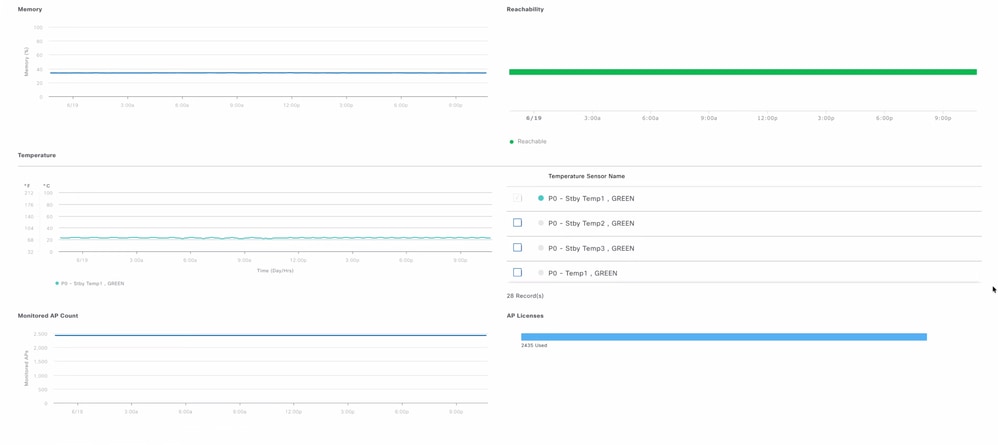 WLC Statistics on Catalyst Center
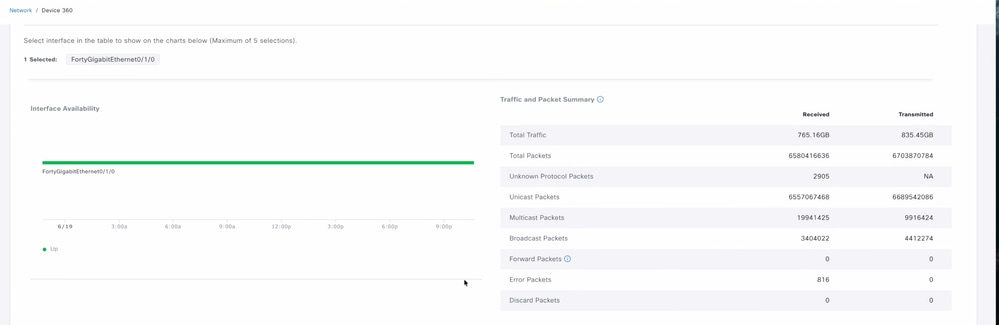 WLC Statistics on Catalyst Center
Because all of this is correlated, you can correlate multiple related factors during the time of issue and get the clear understanding. With these statistics you can not exactly get the root cause of the issue but we can rule out all the potential causes that can help us to troubleshoot further and setup the type of logs required to be collected real-time.
Issue with an Access Point
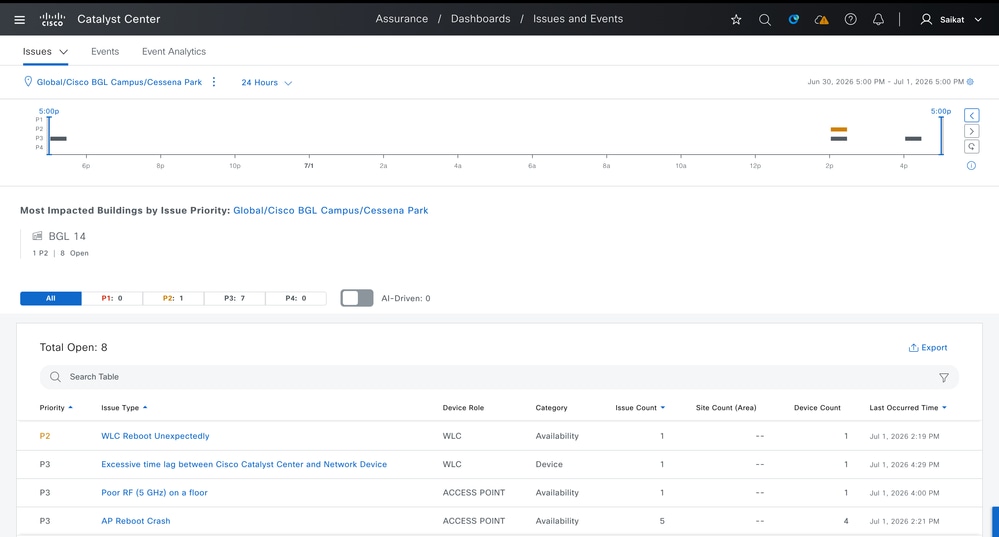
When a Cisco Access Point encounters issues such as disconnect events, radio status anomalies, reboots, crashes, poor RF conditions, high channel utilization, or inactivity, Catalyst Center generates alerts with appropriate priority levels. You can view these alerts by navigating to Assurance > Issues and Health Settings.
 Issues Reported Generates an Alerts with Respective Priority
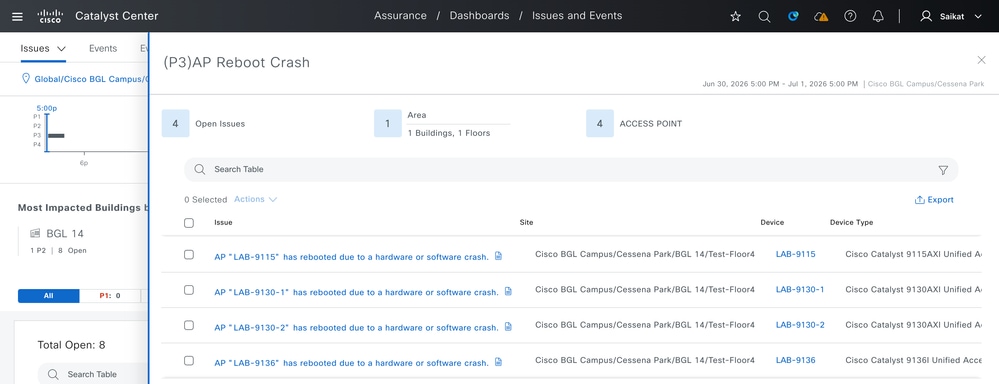
This section displays all open issues in your environment. By clicking individual events, you can get the detailed insight by clicking each event individually:
 Detailed Overview of Issue Reported
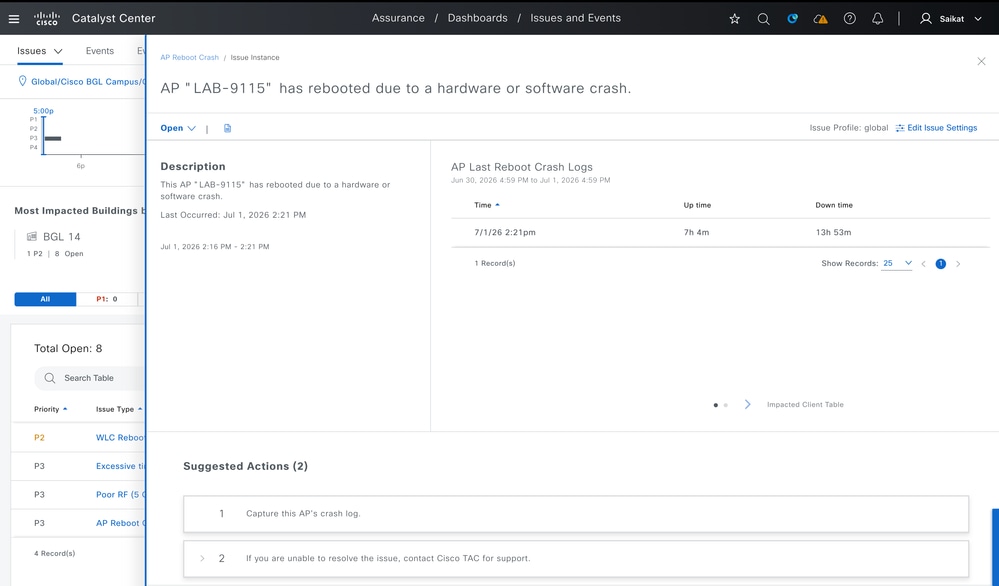
By clicking a specific issue you can see detailed information about it, along with suggested actions to resolve it or investigate further.
 Suggestion Action for Issue Reported on AP
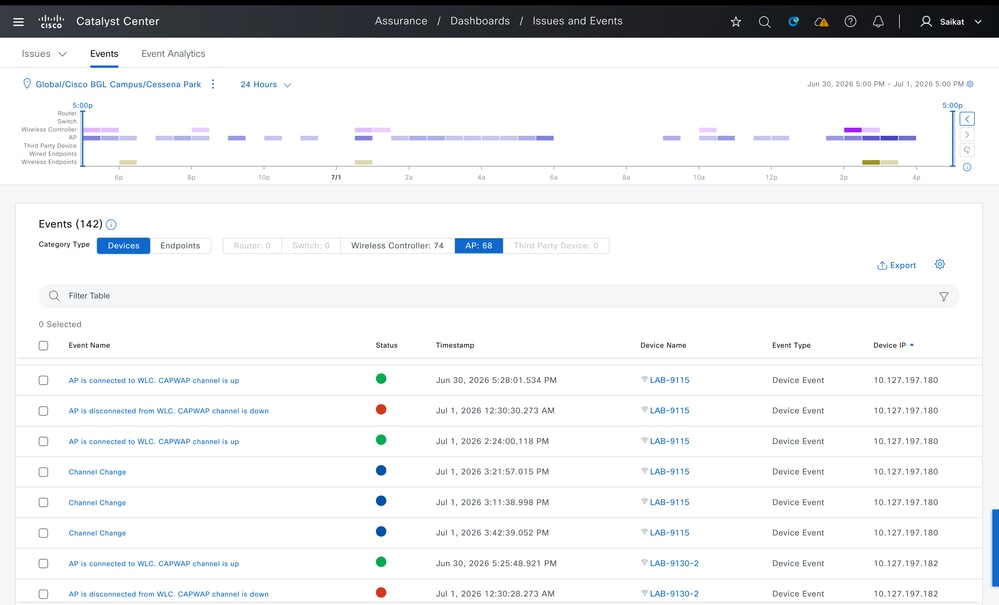
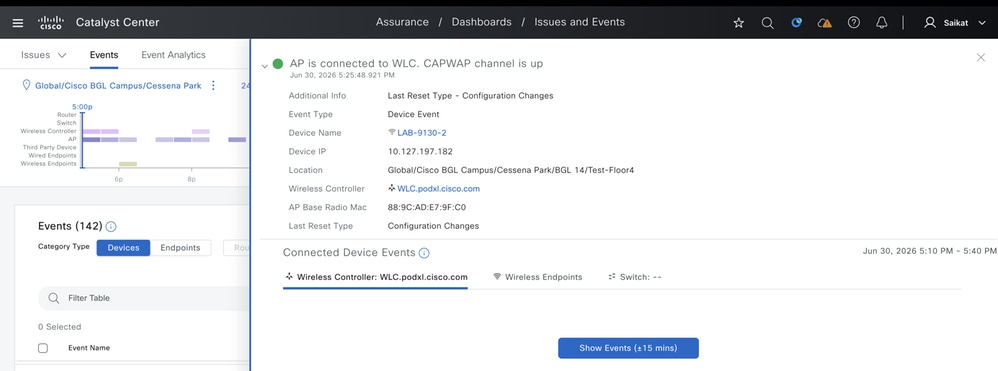
Additionally, you can access the Event Viewer, which contains all events received by Catalyst Center as syslogs. This is useful for tracking all events such as AP join/disjoin activity, channel changes, TX power modifications, and reboots. These events are captured for both the wireless controller and individual APs.
 Events Viewer for APs on Catalyst Center
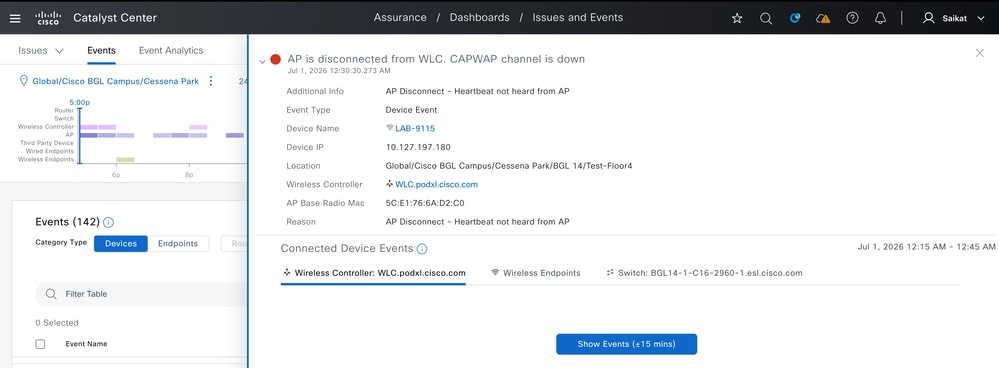 Detailed Overview of Event Reported (Notice)
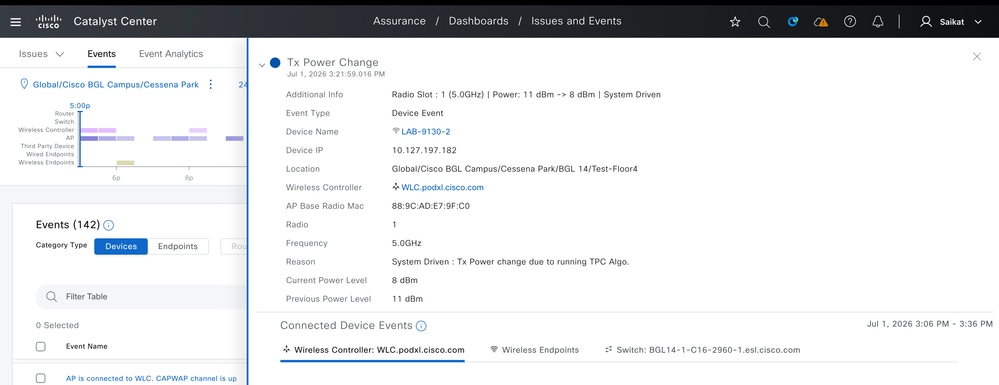 Detailed Overview of Event Reported (Notice)
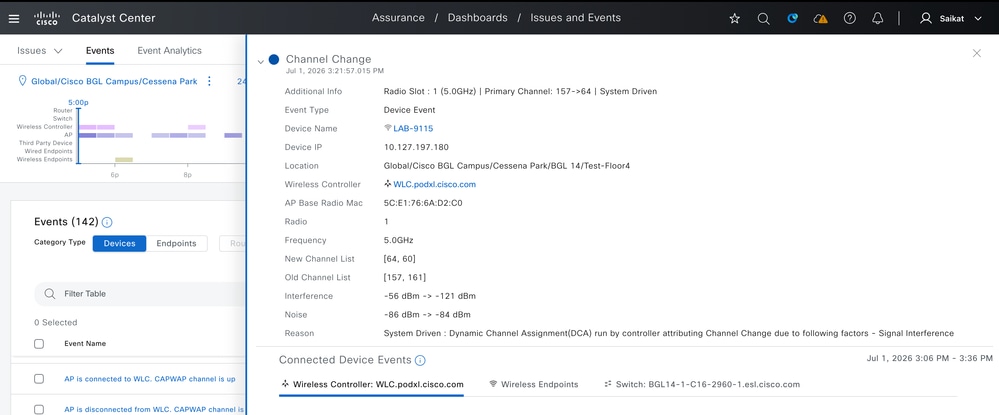 Detailed Overview of Event Reported (Info)
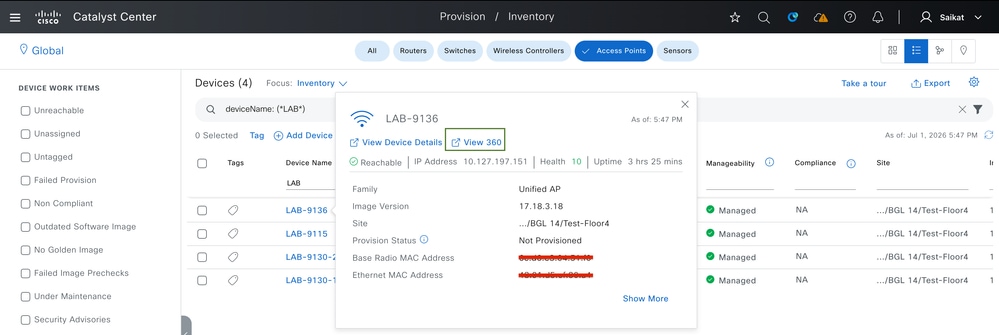
For issues specific to an individual AP, you can check the 360 Health view for that device. Here you can see the reachability status, reported events and issues, along with the health score for that AP at a given point in time. The health score is calculated based on memory utilization, channel utilization, air quality, interference, and traffic utilization. For this navigate to Provision > Inventory > Access Point > AP:
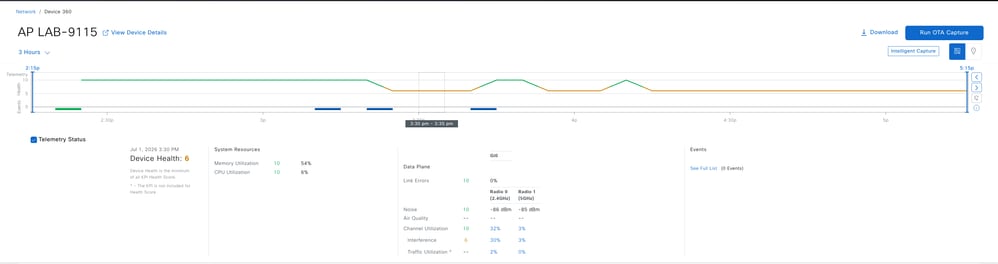
Device 360 Telemetry Summary: Here you can see the APs overall health score timeline, system resource utilization (memory, CPU), data plane link errors, and radio-specific stats (noise, channel utilization, interference, traffic utilization) for both radios. Device 360 lets you move the health timeline slider back to any point within the supported historical window (30 days).
 View 360 : AP Telemetry Status and Health
Issues - Here you can see the list of open issues for the AP, along with severity (P1-P4), issue category, description, and timestamps.
 Issue Reported for AP
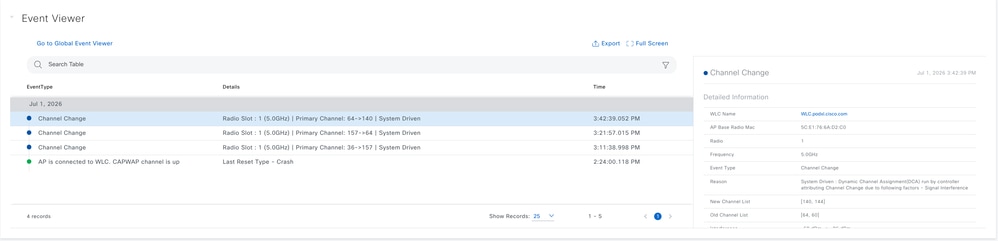
Event Viewer - You can see a chronological log of AP events (example channel changes, CAPWAP status) along with detailed event information such as WLC name, radio, frequency, reason, and old/new channel lists.
 Event Viewer of Individual AP
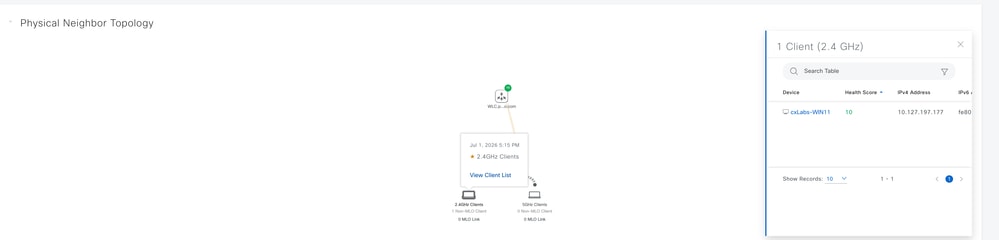
Physical Neighbor Topology with Client List - This view displays the physical topology connecting the WLC, AP, and connected clients, along with additional client details like device name, health score and MLO.
 Physical Topology of AP
Channel Utilization - You can see the APs channel utilization trend, interference sources (neighbor APs, rogue APs, unknown interferers), and a detailed neighbor AP table with RSSI, channel, and type.
 Channel Utilization for Individual AP
Detail Information (Device Tab) - This section shows device information (AP name, IP, model, MAC addresses, software version), availability details (uptime, controller join time, last reset reason), CPU/memory utilization graphs, and the AP-to-WLC connectivity chart.
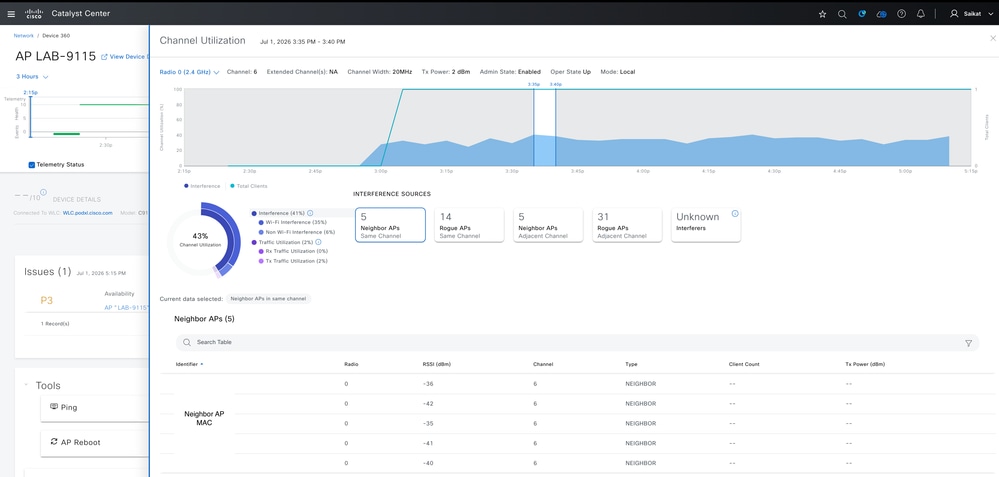 Device Details for AP
Radio Specific KPIs: Here you can view radio-level KPIs including channel utilization, client count, throughput (Rx/Tx rate), retries, noise, and air quality for the selected radio.
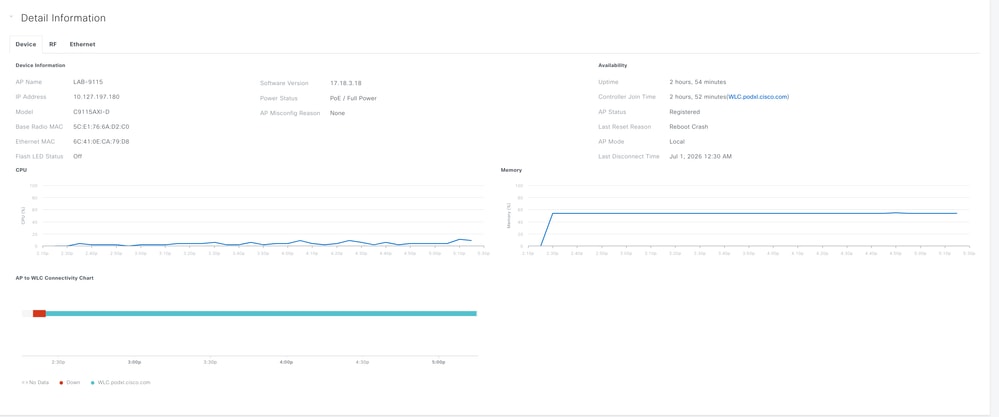 RF Statistics for Individual AP
Tx Power, Channel Information & Frame Stats: On this screen, you can see Tx power trends, channel assignment history, AP radio operational state, Tx frame counts by type (data vs. management), and top SSIDs by client/packet count.
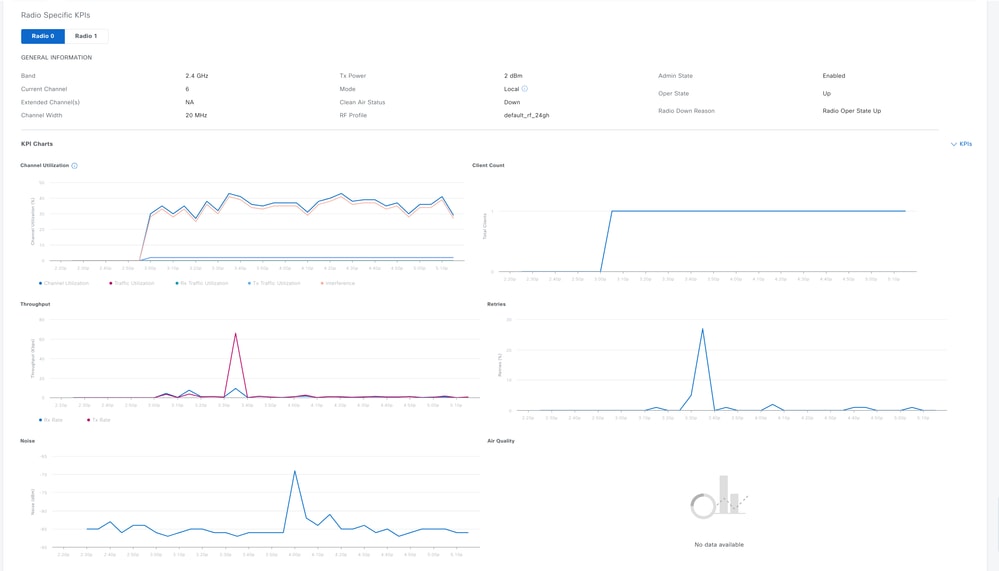 RF Statistics for Individual AP
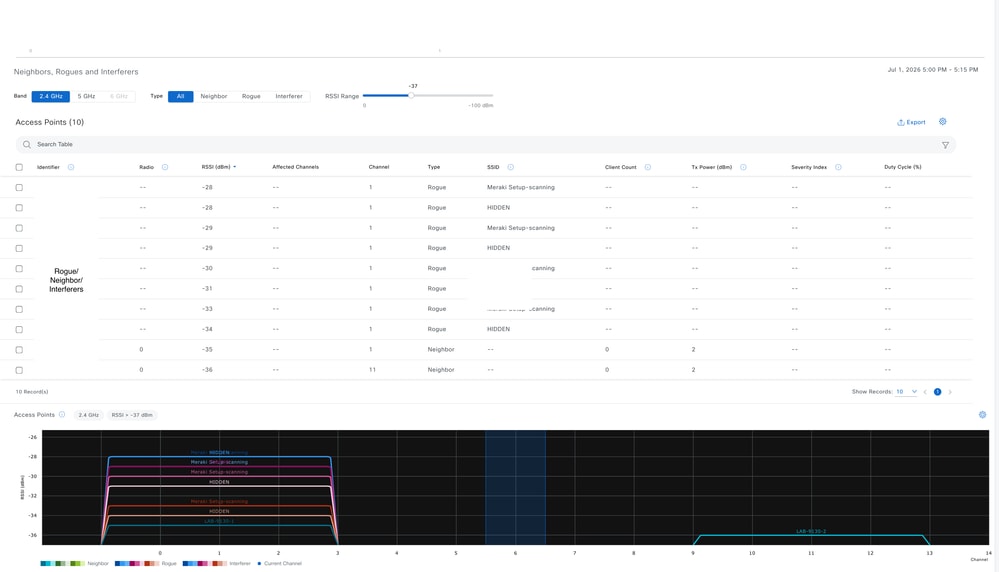
Neighbors, Rogues and Interferers: This view lets you see all nearby neighbor, rogue, and interferer devices with their RSSI, affected channels, SSID, client count, Tx power, and severity index, along with a visual RSSI-vs-channel plot. Rogue, Neighbor and Interferers Reported for Individual AP
The Device 360 dashboard brings together RF details like channel usage, interference, noise, and retries, along with nearby neighbor, rogue, and interferer information — helping you figure out if an AP problem is caused by RF congestion, channel conflicts, or rogue devices. Device health data like CPU, memory, reboot history, and connectivity status, along with the Event Viewer and Issues panel, help you understand hardware crashes, connection drops, and unexpected channel changes. Combined with the topology and client views, this gives a complete picture for troubleshooting — from RF issues down to individual client problems — with suggested actions built in to help resolve them
Intelligent Captures for Access Point
Intelligent Capture for the access point offers two main features: always-on real-time RF monitoring, anomaly detection and on-demand over the air capture, spectrum analysis.
AP Statistics Capture
You can enable and manage AP Statistics data collection for one or more access points — including AP radio statistics, WLAN statistics, and AP client statistics — with support for up to 1000 APs.
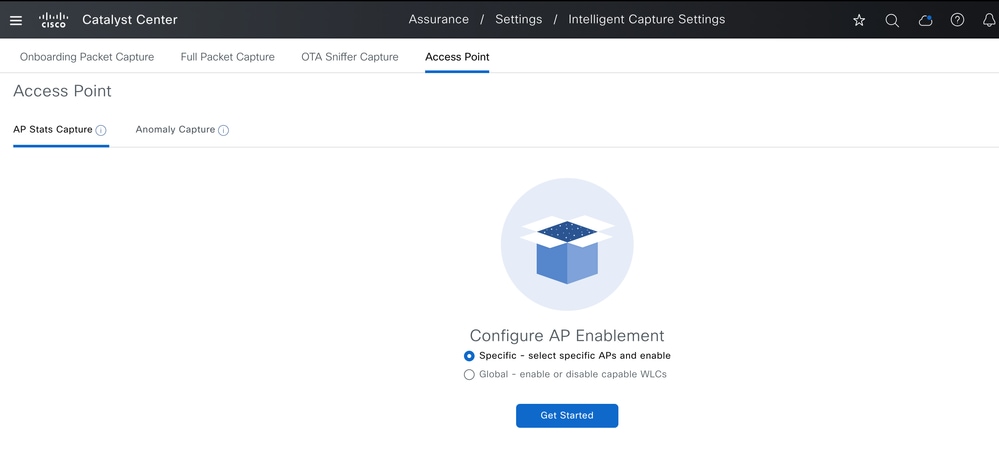
To enable AP Stats Capture, navigate to Assurance > Settings > Intelligent Capture Settings > Access Point > AP Stats Capture. From here, you have the flexibility to either:
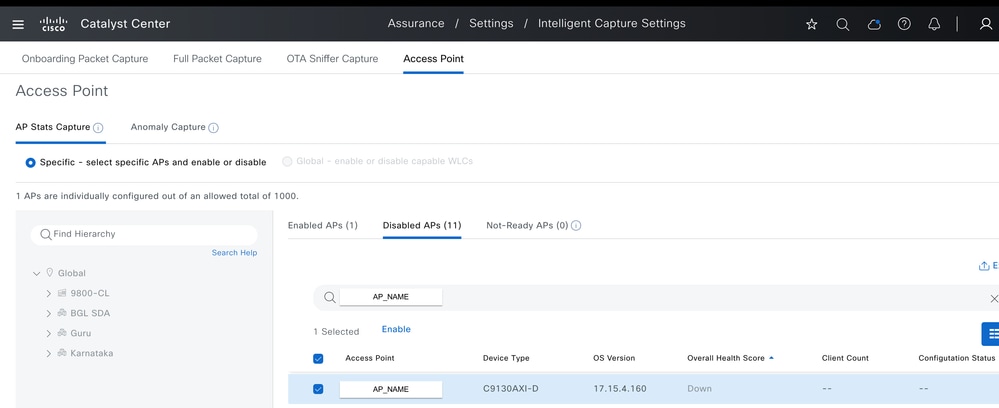
- Enable it for specific APs (up to 1000), or
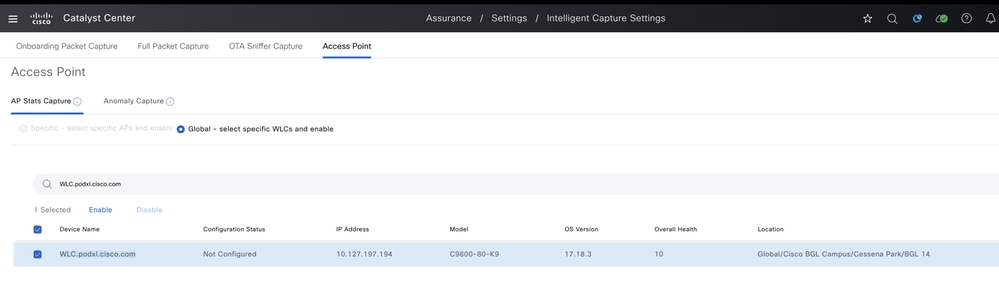
- Enable it globally for all APs managed under a particular WLC.
 AP Stats Capture Option
 Enable AP Stats Intelligent Captures on Specific AP
 Enable AP Stats Intelligent Capture Globally
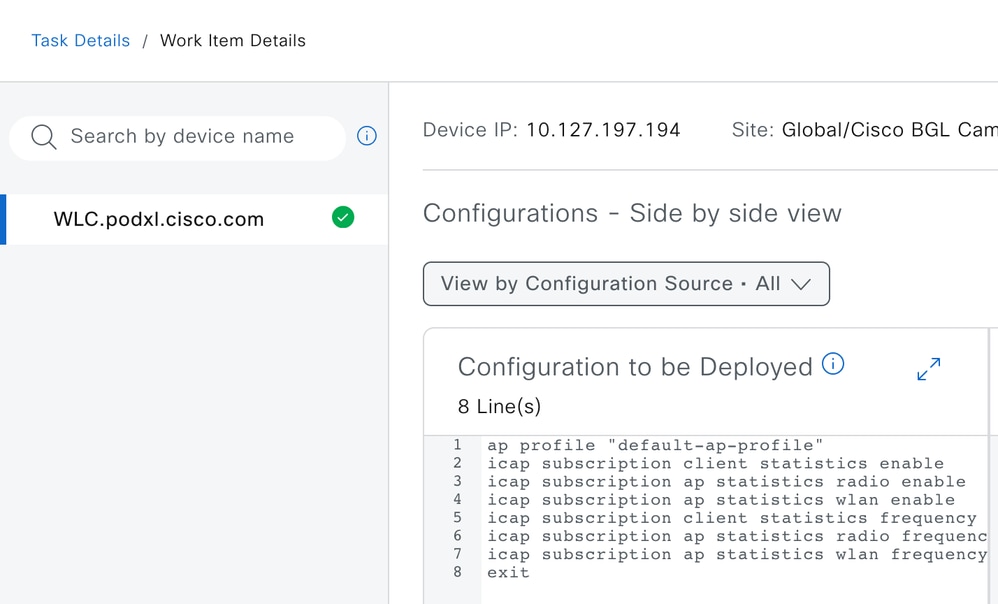
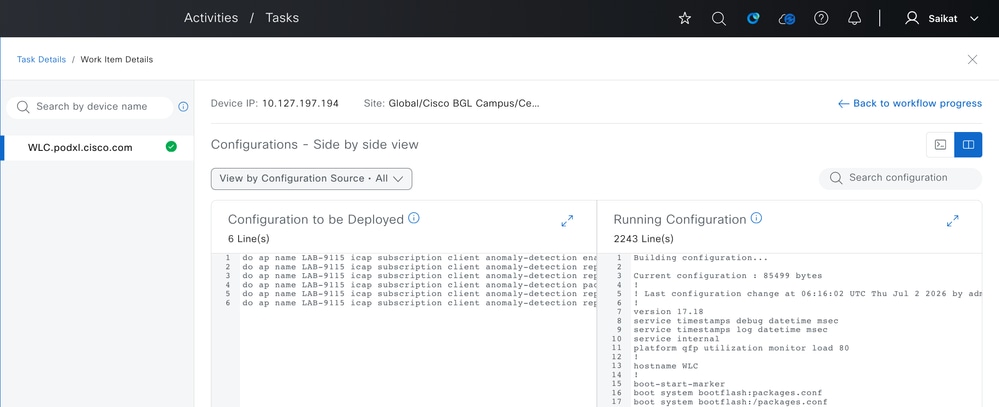
Once AP Stats Capture is enabled, Catalyst Center pushes the corresponding configuration to the WLC — either for the specific AP(s) selected or for all APs, depending on whether it was enabled at the individual AP level or globally at the WLC level.
 Configuration to be Pushed when AP Stats Capture is Enabled
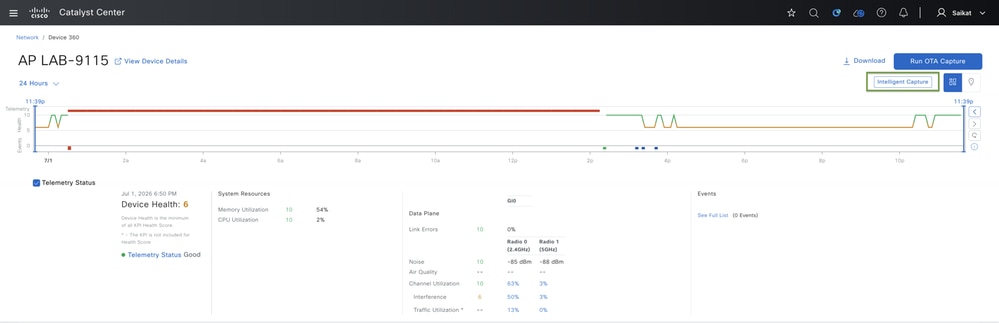
After enabling this capture, you can view the real-time data collected through Intelligent Capture directly from the Device 360 page. Additionally, you can run Spectrum Analysis on demand as needed to further investigate RF conditions.
 Intelligent Capture for AP in Device 360
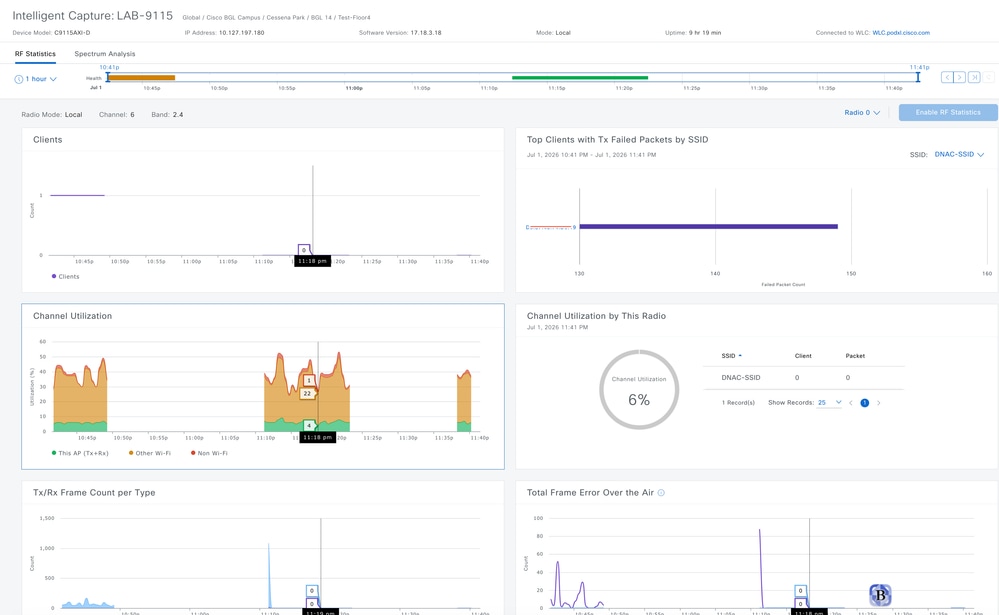
 AP Stats Captured using Intelligent Capture on Catalyst Center
Here you can see real-time statistics covering Tx/Rx frame count per type, total frame errors over the air, multicast/broadcast counters, Tx power and noise floor, channel utilization, top clients with failed Tx packets by SSID, and client data captured for specific AP using Intelligent capture.
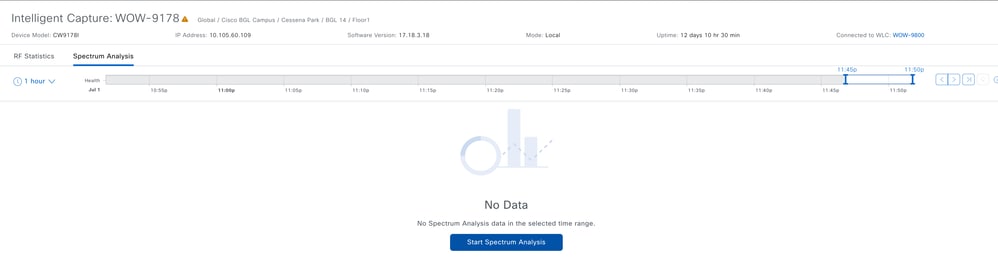
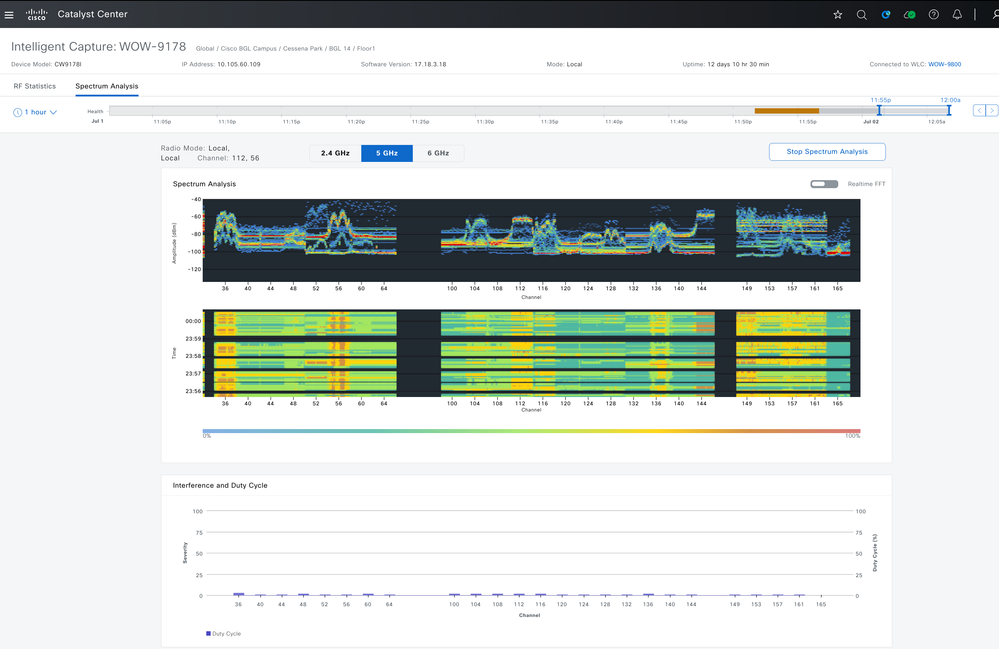
You can also run on-demand spectrum analysis for an individual AP whenever needed to inspect RF conditions. However, this feature requires the AP model to support it.
 On Demand Spectrum Analysis
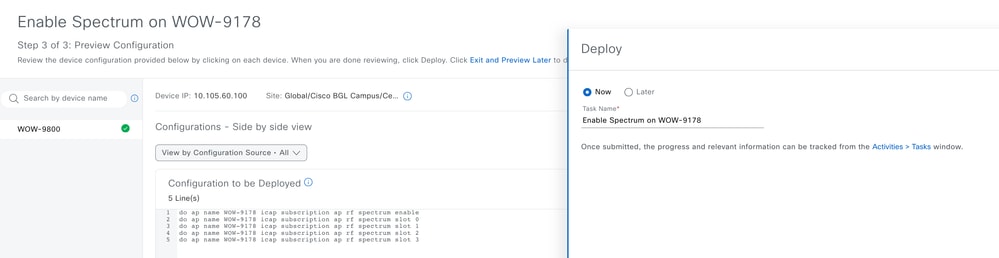
 Cpnfiguration Applied for Spectrum Analysis
 Spectrum Analysis Result
OTA Sniffer Capture
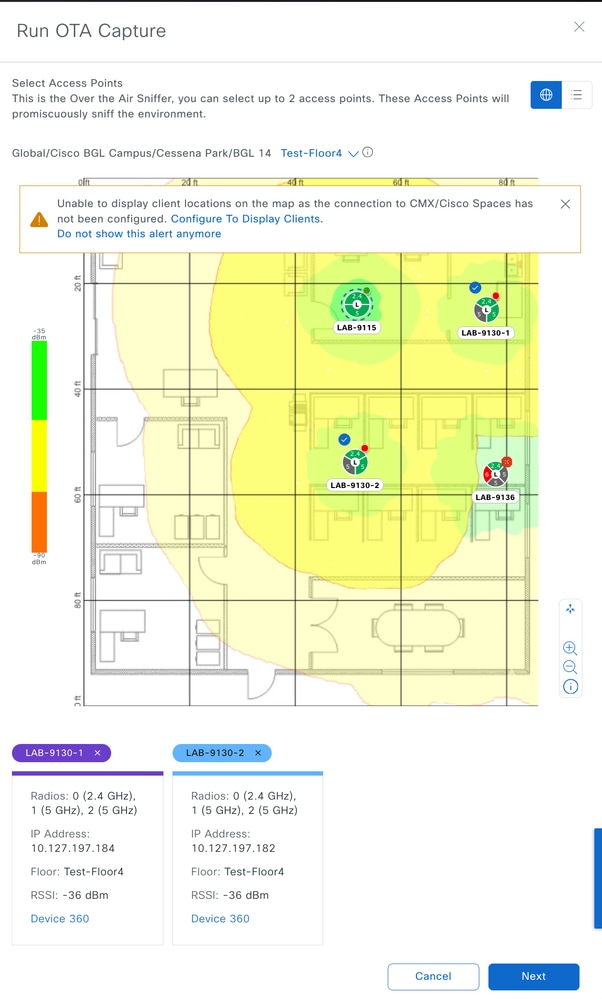
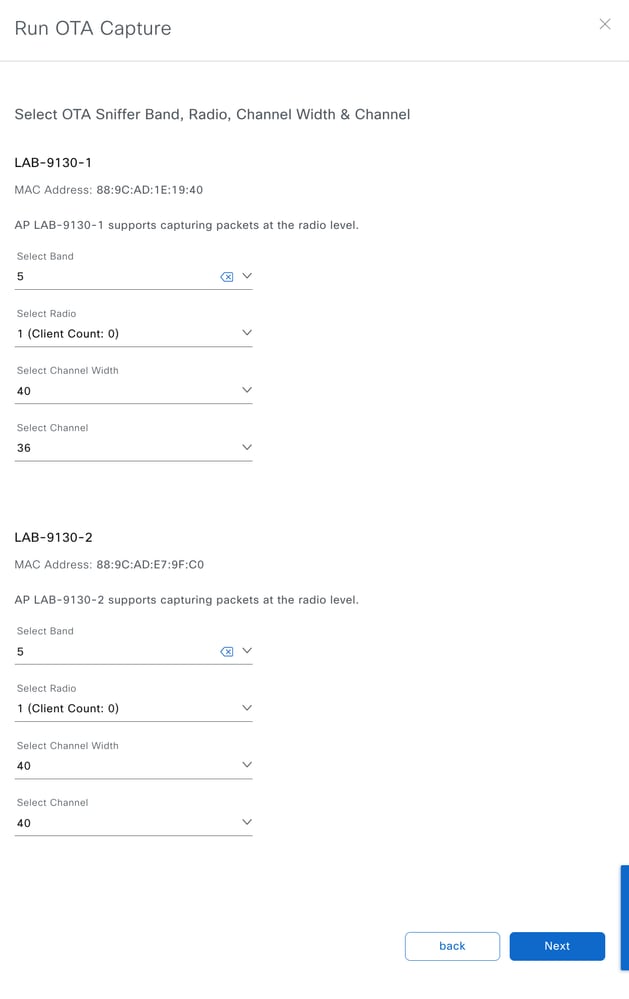
Catalyst Center lets you enable OTA Sniffer Capture on a specific radio, bandwidth, and channel. Once enabled, all Wi-Fi data packets traveling on that radio and channel are captured. You can select up to 2 APs to perform the sniffing. Keep in mind that the 2 APs configured for traffic sniffing can switch to sniffer mode on their respective radio/slot for as long as OTA Capture is enabled.
To enable this, navigate to Provision > Inventory > Access Points, click the AP for which you want to collect OTA data, then select Run OTA Capture. Choose up to two nearby access points to sniff the traffic.
 Run OTA Capture on Traget AP
 Selection of Neighbor APs (Upto 2) to Sniff the Traffic
 Select Radio, Channel-Width, Channel to Sniff the Traffic
 Config Preview for Enabling OTA Capture
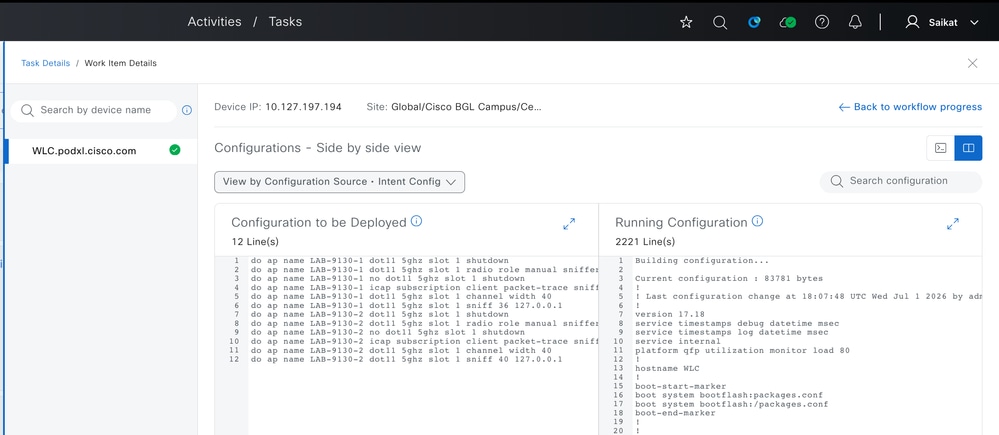 Task Scheduled when OTA Capture is Enabled
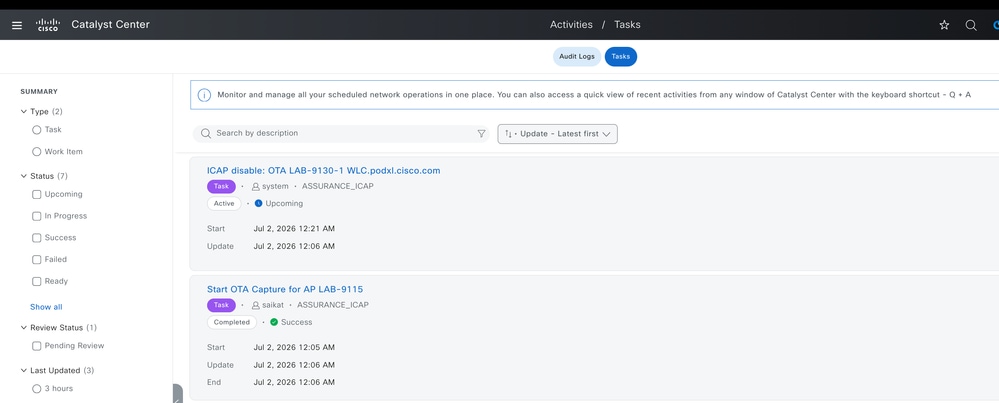 Slot 1 in Sniffer Mode for the AP Enabled to Sniff the Traffic
To check the status of running OTA capture by navigate to Assurance > Settings > Intelligent Capture Settings > OTA Sniffer Capture:
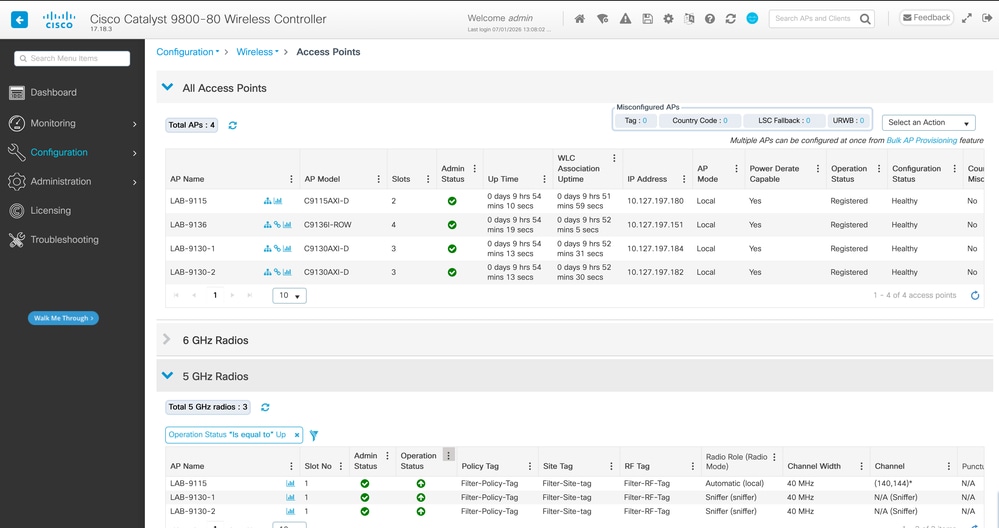 Status of OTA Capture
Note: By default, Catalyst Center runs this task for 15 minutes before automatically disabling it, though it can also be stopped manually at any time.
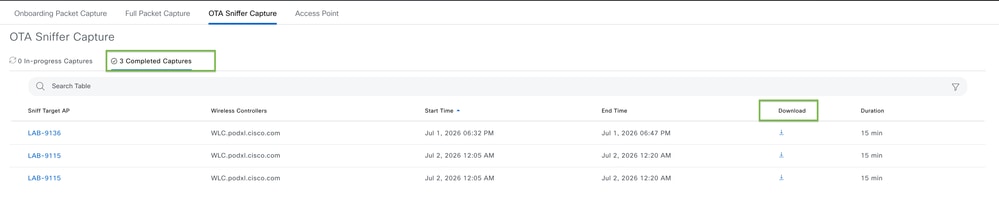
Once the OTA capture is completed, it appears in the Completed Captures section, from where you can download the file.
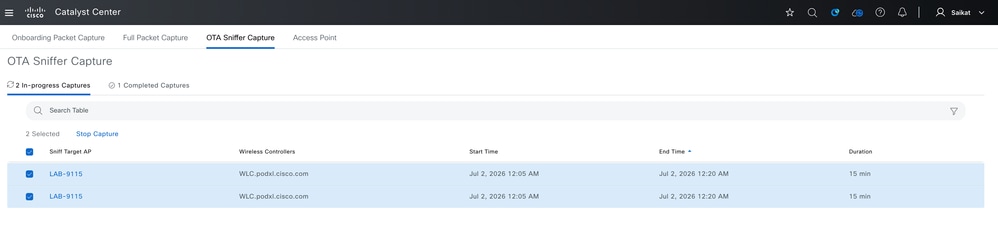 Completed Capture - OTA Sniffer Capture
Anomaly Detection
This feature allows Cisco APs to detect possible irregularities in the behavior of wireless clients associated with them. It includes:
- Anomaly Detection
- Anomaly Packet Capture
- Anomaly Individual Reports
- Anomaly Summary Reports
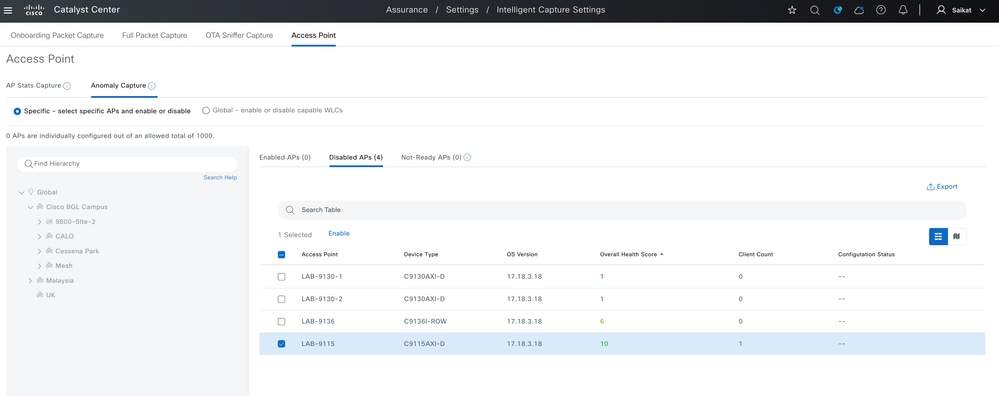
To enable AP Anomaly Capture navigate to Assurance > Settings > Intelligent Capture Settings > Access Point > Anomaly Capture. From here, you have the flexibility to either:
- Enable it for specific APs (up to 1000), or
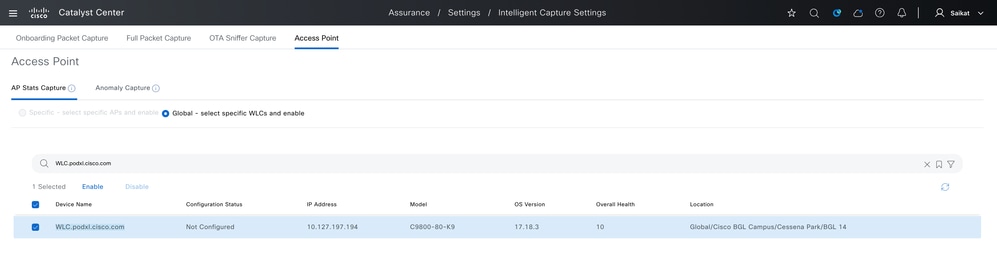
- Enable it globally for all APs managed under a particular WLC.
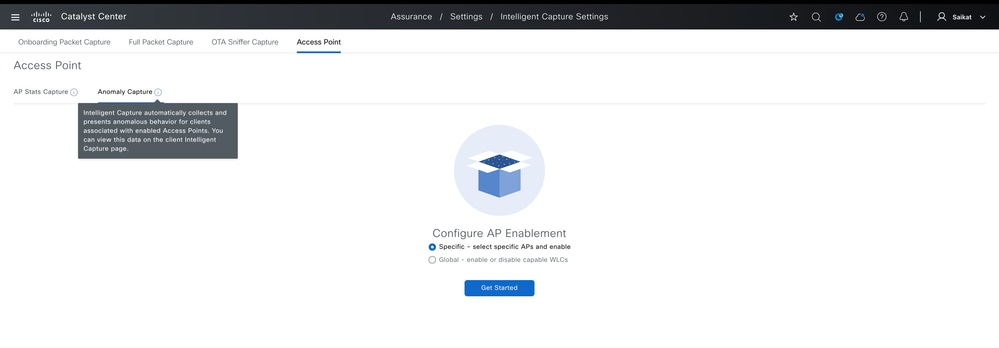
Once enabled, Intelligent Capture automatically collects and presents anomalous behavior for clients associated with those APs, and this data can be viewed on the Client Intelligent Capture page.
 Configure Anomaly Capture
 Enable Anomaly Capture for Specific AP
 Enable Anomaly Capture Globally for Specific WLC
 Config Preview for Anomaly Capture
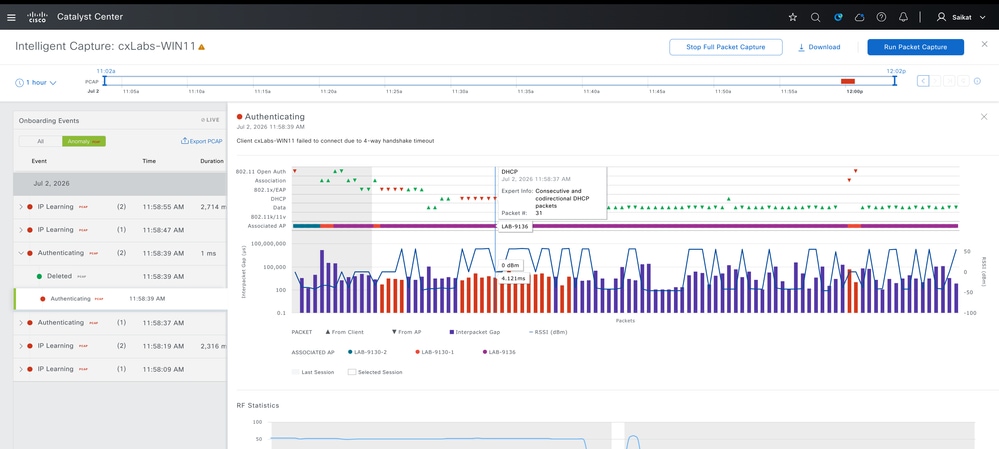
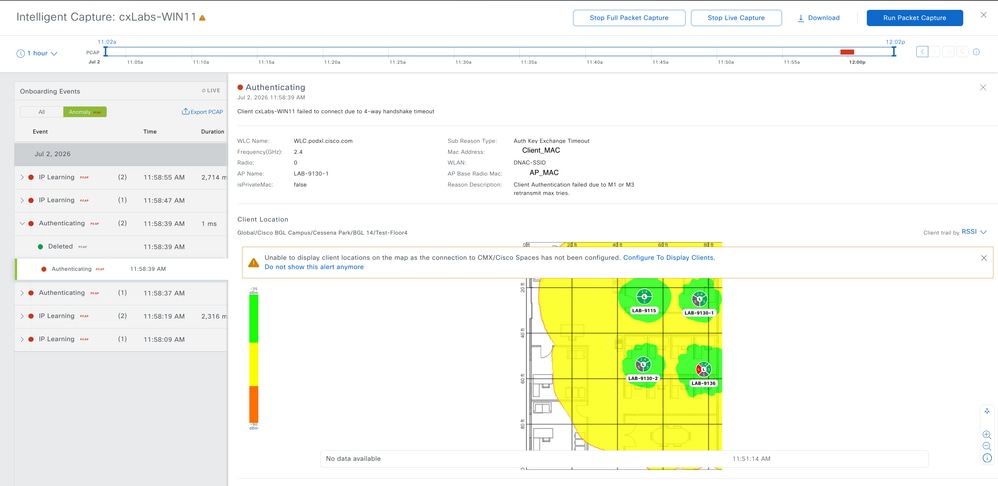
Once enabled, it continuously collect anomaly behaviors for clients associated with the AP, and these can be viewed within the Intelligent Captures (Onboarding and Full) taken for specific client IDs.
 Anomaly Capture View for Client
 Anomaly Capture Details for Client
With this we can troubleshoot irregular or unexpected client behavior — such as failed onboarding, authentication issues, or abnormal association patterns — by automatically detecting and flagging these events for APs where it is enabled. Combined with onboarding and full packet captures for specific client IDs, it allows administrators to trace the exact sequence of events leading up to an anomaly, making it easier to pinpoint root causes of recurring client connectivity or performance issues without manually monitoring every client session.
Issue with Wireless Client Connectivity
Wireless client issues — onboarding failures, roaming drops, RF interference, or intermittent connectivity — are often transient and difficult to reproduce, making traditional polling-based monitoring insufficient for troubleshooting Cisco Catalyst Center addresses this gap through continuous, sub-second telemetry collected directly from access points and wireless controllers, correlated across Device 360, Client 360, and Intelligent Capture workflows. This telemetry-driven architecture enables to reconstruct the exact RF and protocol-level conditions at the time of failure — from channel utilization and interference to 802.11 onboarding frames.
The Client Health section provides a comprehensive, global overview of wireless client statistics across all sites. This includes key metrics such as onboarding performance, RSSI, SNR, roaming activity, per-SSID and per-radio distribution, data rates, and physical connectivity status. You can filter this data by a specific site and view historical trends going back up to the last 30 days, giving you both a network-wide perspective and site-level granularity. Navigate to Assurance > Dashboard > Health > Client.
 Wireless Client Statistics on Catalyst Center
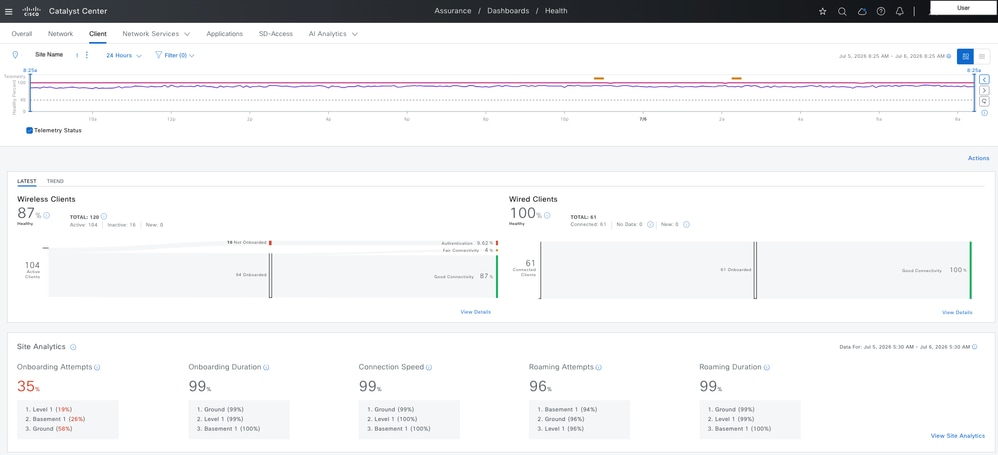 Wireless Client Statistics on Catalyst Center
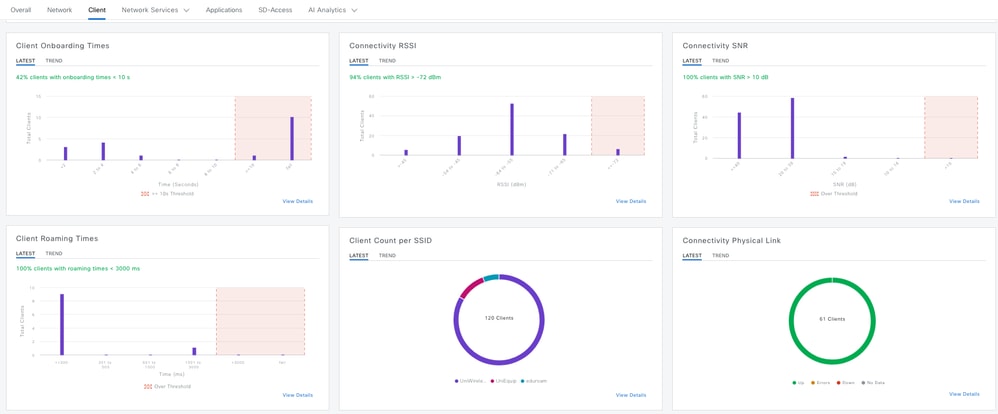 Wireless Client Statistics on Catalyst Center
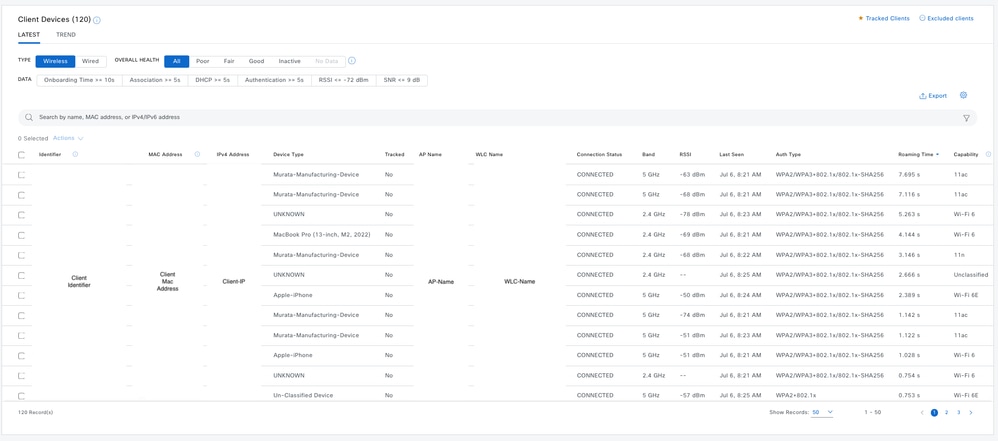 Wireless Client Statistics on Catalyst Center
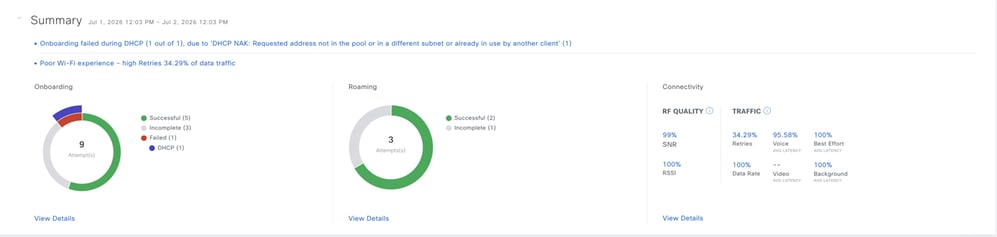
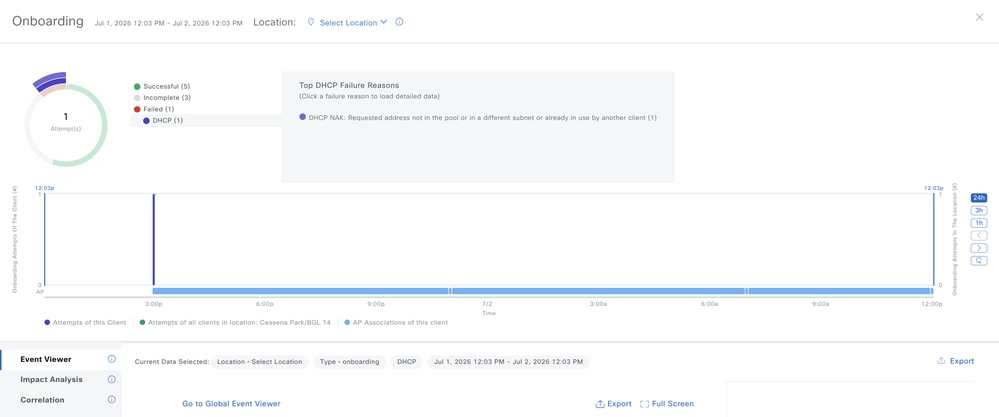
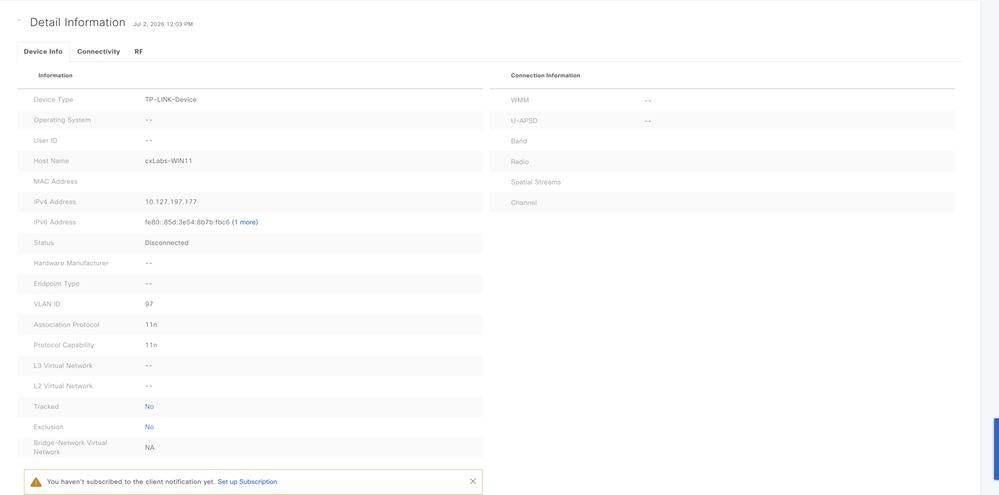
For troubleshooting a specific client, you can search using the clients MAC address, which takes you to the Client 360 view. This page presents detailed, client-specific statistics — including onboarding history, connectivity events, RF metrics, and session details — scoped exclusively to that individual client, allowing for precise root cause analysis of individual client issues.
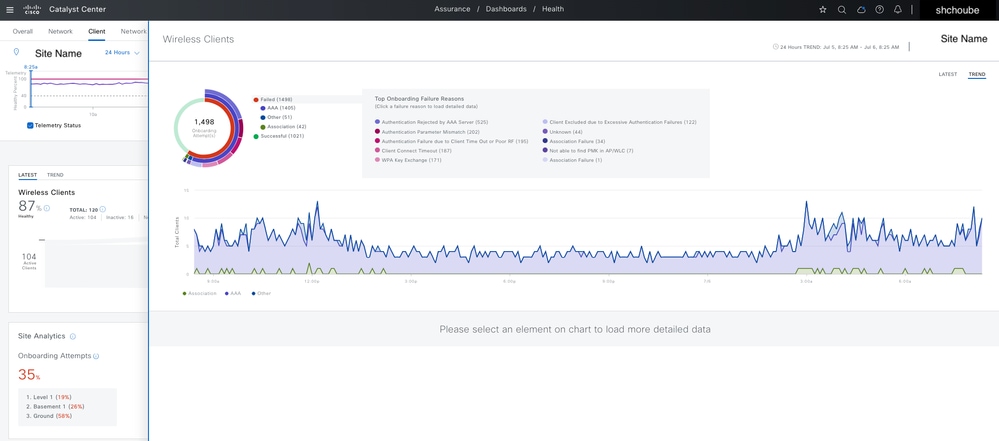 Specific Client Mac Address Device 360
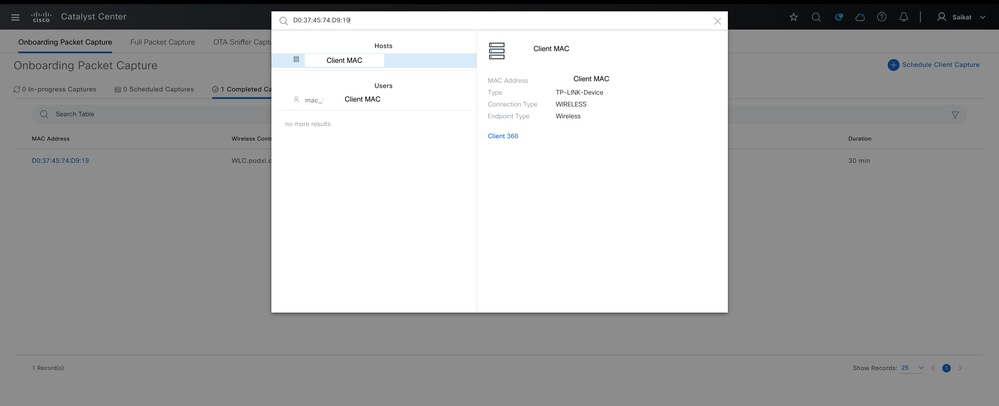 Telemetry + Health Status of Client
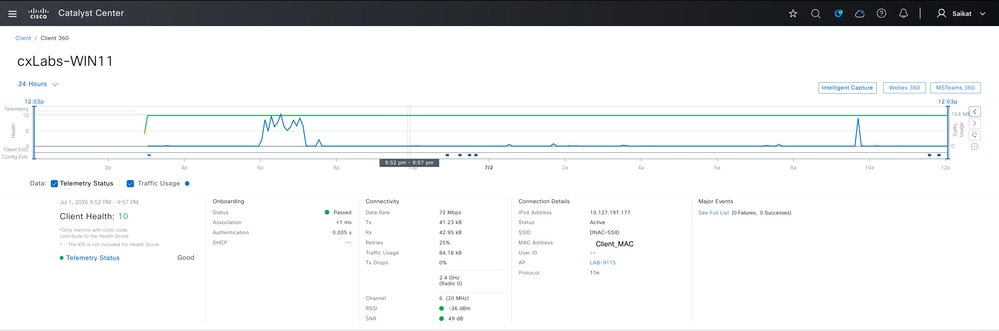 Overall Summary for Client
 Event Reported for Client in Detail
 Client Device Details
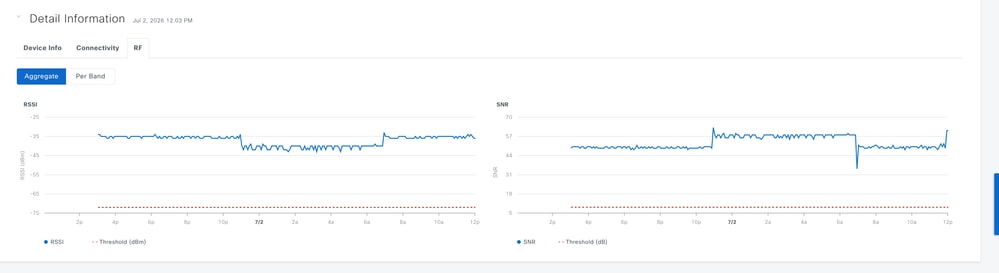
 RF Statistics for Client
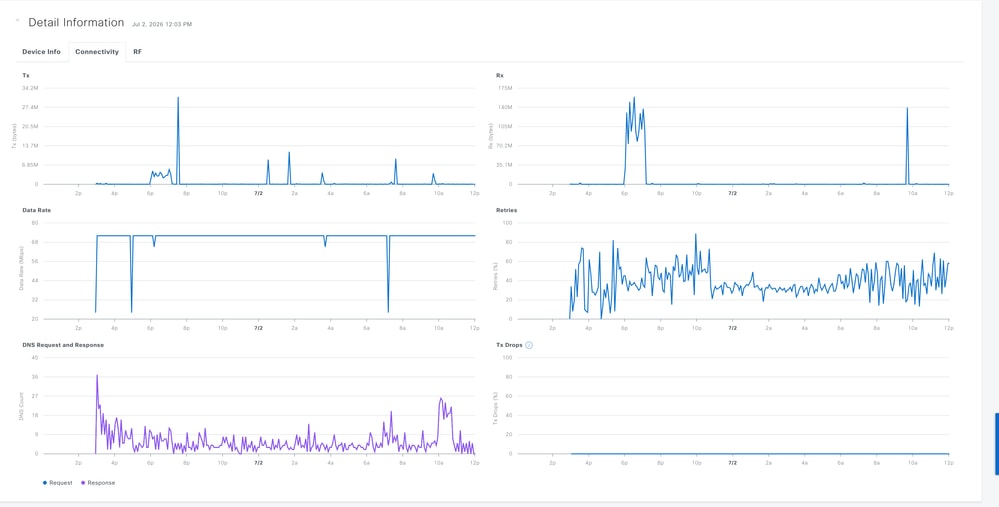
 Connectivity Statistics for Client
Intelligent Captures for Wireless Clients
Intelligent Capture (iCAP) helps troubleshoot wireless client connectivity issues by capturing real packet-level data directly from Catalyst Center. It can capture 802.11 management, DHCP, and EAP frames to pinpoint where a connection attempt fails, unencrypted data and management packets for a specific client tot troubleshoot onboarding, accessibility and application issues. You can also schedule intelligent captures to run at a later time as per the requirement. The default duration of the session is 30 minutes and can be set up to eight hours.
Onboarding Packet Capture
Onboarding Packet Capture records the sequence of packets a client device exchanges while attempting to join the wireless network, including 802.11 management frames (such as association and authentication requests), DHCP packets, and EAP packets used during 802.1X authentication. Alongside this, it collects the clients RF statistics giving visibility into signal conditions at the exact moment of onboarding. These captures are useful for troubleshooting a scenario when a client fails to connect and helps to pinpoint the precise stage — whether during association, authentication, or IP address assignment — where the failure occurs. By default, Onboarding Packet Capture is enabled on the last client-connected wireless controller. Select up to three wireless controllers to cover the client roaming scenario.
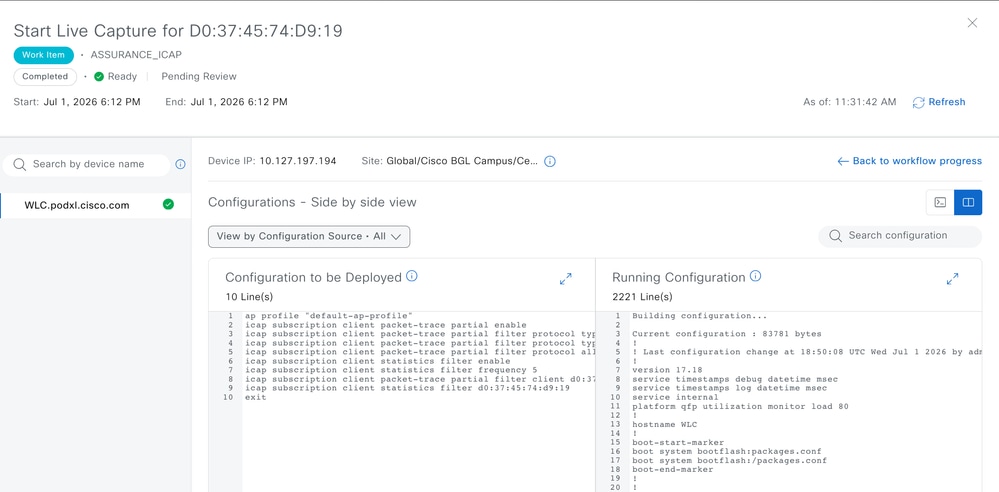
To enable Onboarding Packet capture, navigate to Assurance > Settings > Intelligent Capture Settings > Onboarding Capture > Schedule Client Capture (at the top right corner) > search for Client Identifier (Mac address).
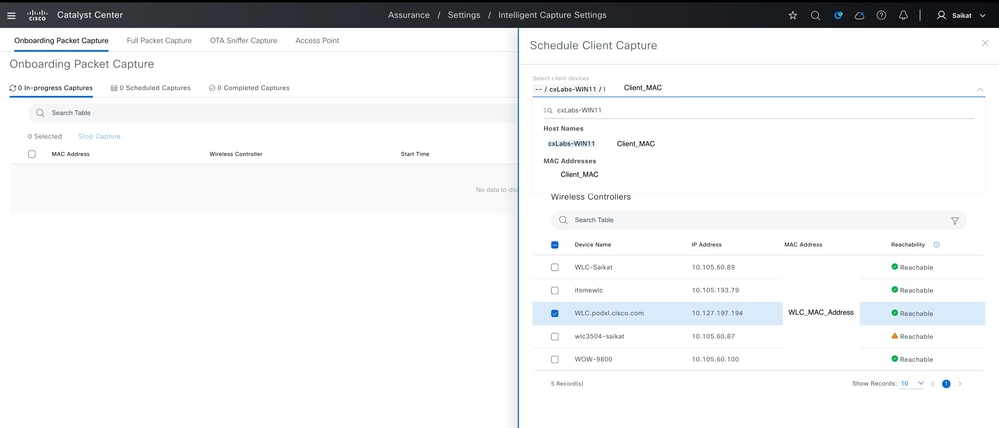 Scheduled Onboarding Capture
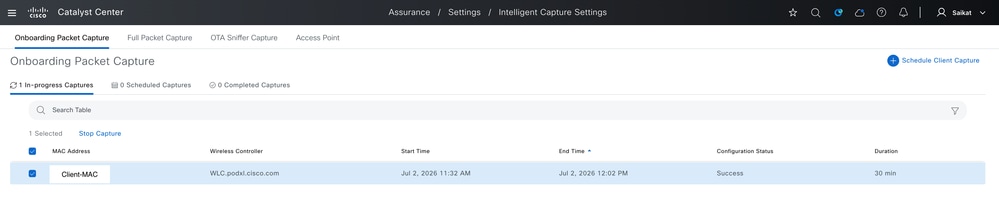 Config Preview for Onboarding Capture
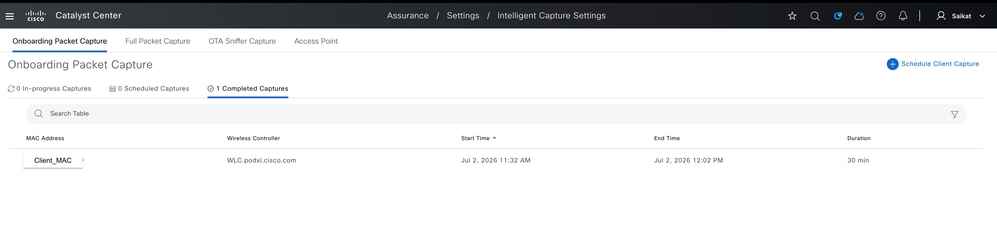
The onboarding capture can either be stopped manually or automatically disabled once the scheduled duration (ranging from 30 minutes to 8 hours) elapses. Once stopped, the capture appears under Completed Captures, where you can click the clients MAC address to view the detailed capture data, and export the file in PCAP format for further analysis.
 Completed Onboarding Capture
 Example of Complete Onboarding Capture
Full Packet Capture
Full Packet Capture session can capture complete data for a specific client, providing deep, packet-level visibility into that clients ongoing wireless traffic which allows us to inspect both data and management packets in detail to troubleshoot access issues, application performance problems, or other connectivity anomalies that go beyond what standard RF statistics can reveal. It can capture up to 1 GB of rolling data for a specific client and continuously retains the most recent data up to the limit.
To enable Full Packet Capture navigate to Assurance > Settings > Intelligent Capture Settings > Onboarding Capture > Run Data Capture (on the Top Right Corner) > Search for Client Identifier (Mac address):
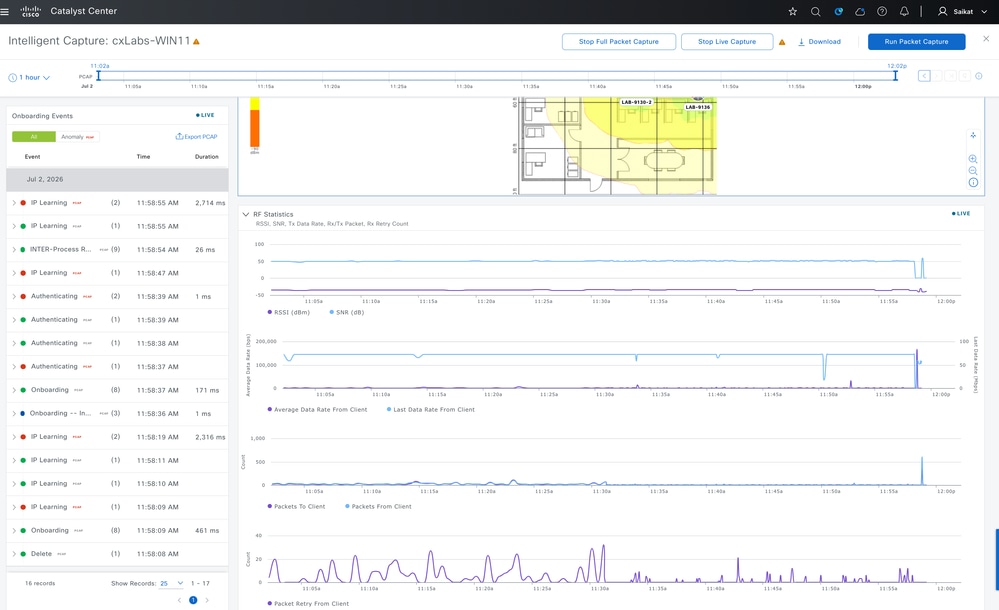 Full Packet Capture for Client
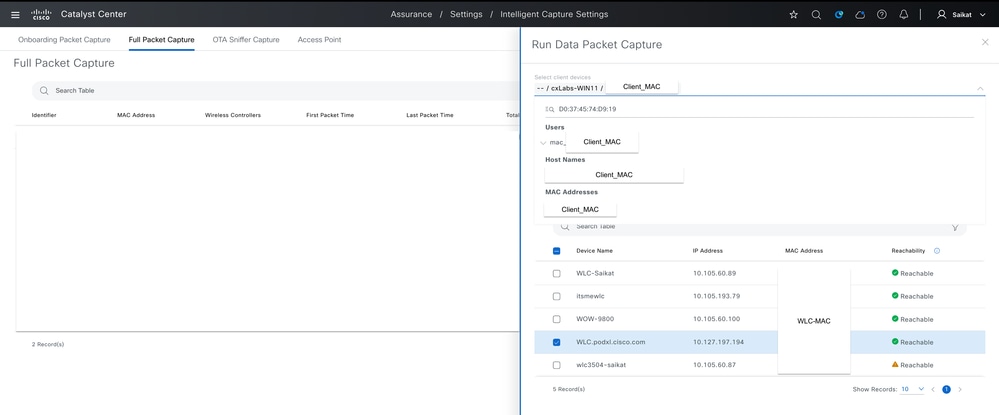 Scehduled Full Packet Capture for Client
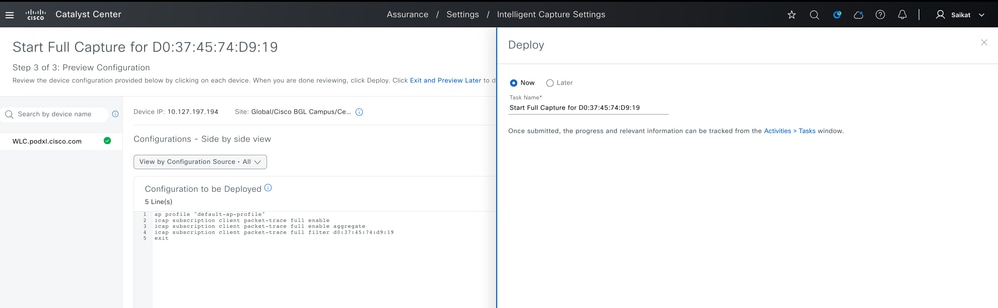
 Config Preview for Full Packet Capture
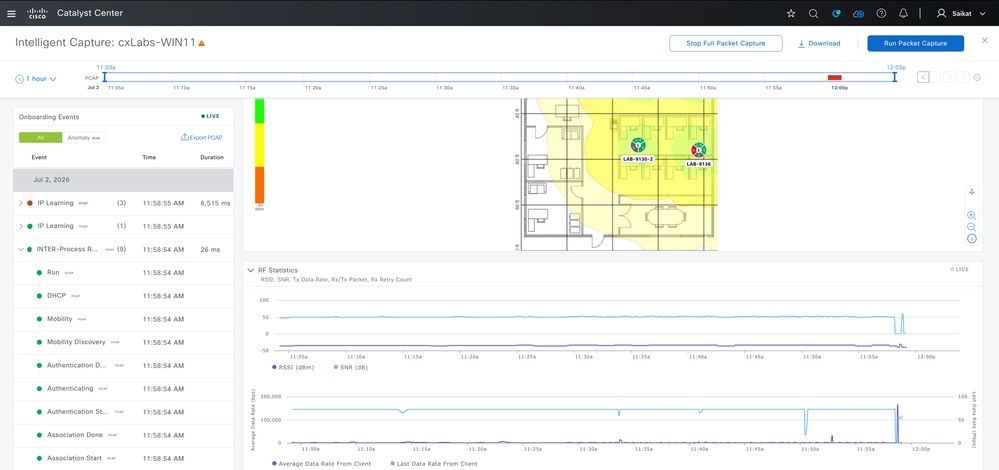
The full Packet capture can either be stopped manually or automatically disabled once the scheduled duration (ranging from 30 minutes to 8 hours) elapses. Once stopped, the capture appears under completed captures, where you can click the clients MAC address to view the detailed capture data, and export the file in PCAP format for further analysis.
 Example of Full Capture Collected for Client
Isolate Network Service Issues (AAA, DHCP, DNS)
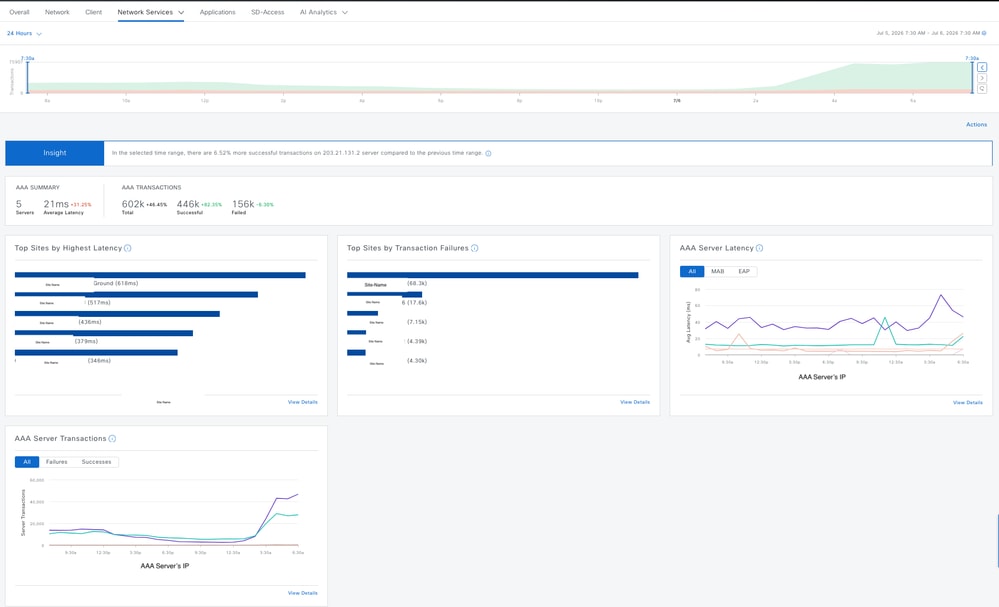
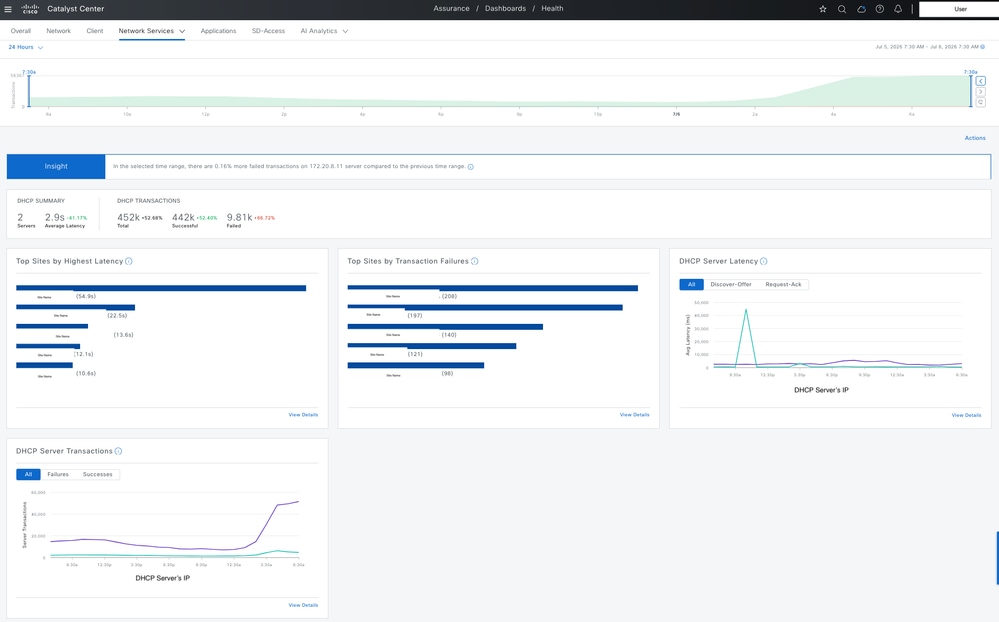
If the reported symptom points to a specific network service rather than the controller itself — for example, clients failing authentication, not receiving an IP address, or failing name resolution — Catalyst Center Network Services dashboard under Assurance gives you visibility into those transactions as reported by the WLC.
Navigate to Assurance > Dashboard > Health > Network services > AAA/DHCP/DNS:
 Wireless Client AAA Statistics on Catalyst Center
 Wireless Client DHCP Statistics on Catalyst Center
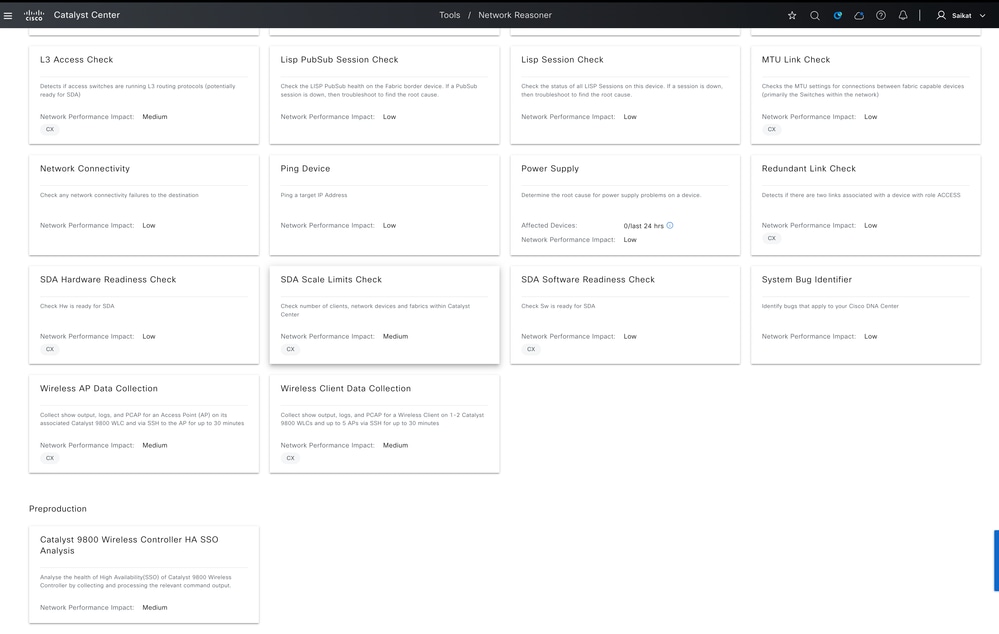
Network Reasoner
Network Reasoner is a built-in tool in Catalyst Center that automatically investigates network problems for you — you do not have to dig through logs manually. You can find it under Tools > Network Reasoner. Each troubleshooting option (called a workflow) shows you a short description, how many devices were affected in the last 24 hours, and what happen if you run it. It can only detect issues on devices that are either added to Catalyst Center for Assurance monitoring or provisioned through Catalyst Center.
 Various Network Troubleshooting Options Available on Network Reasoner
For wireless networks, there are three main things you can troubleshoot:
1. For controller problems — especially with High Availability (HA) setups — Network Reasoner checks things like:
- Is the controller reachable?
- Is HA set up correctly?
- Are the active and standby controllers in sync?
- Is the connection between them working?
If it finds an issue, it tells you exactly what is wrong and suggests how to fix it. There is also a separate option for troubleshooting devices that are not sending any monitoring data at all.
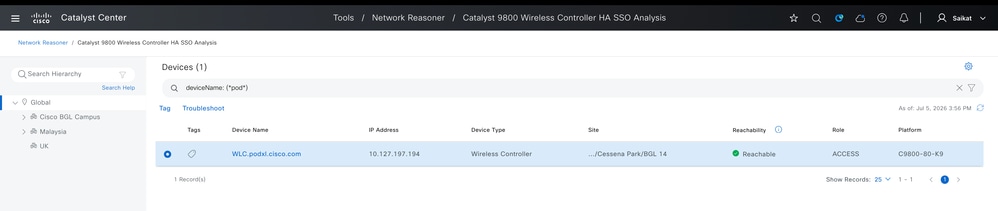
 Troubleshooing HA using Network Reasoner
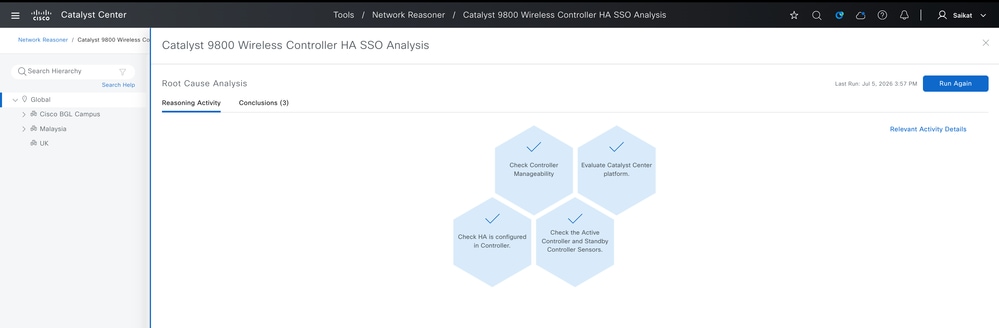
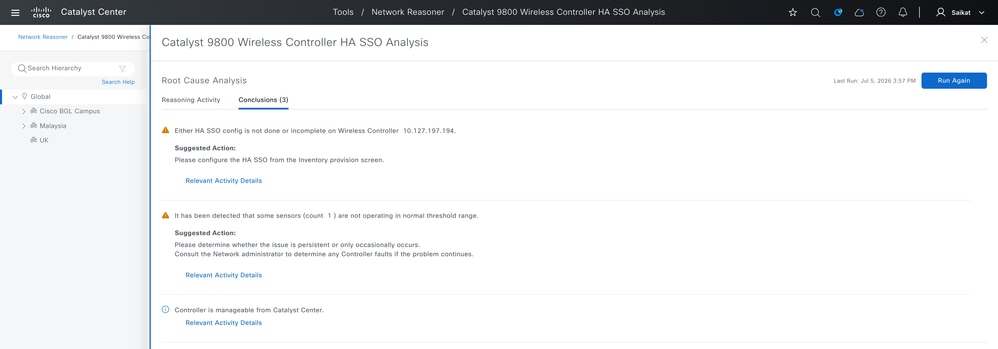
When you enable the troubleshoot feature for HA SSO analysis on the 9800 WLC using Network Reasoner, it performs several checks and provides a conclusion based on the results. If any issues are found with HA SSO, it also suggests corrective actions to resolve them.
!! Task Workflow !!
Check Controller Manageability
Evaluate Catalyst Center platform.
Check HA is configured in Controller.
Check the Active Controller and Standby Controller Sensors.
 Tasks Performed by CATC for HA SSO Analysis
 Conclusion Example for HA SSO Troubleshooting using Network Reasoner
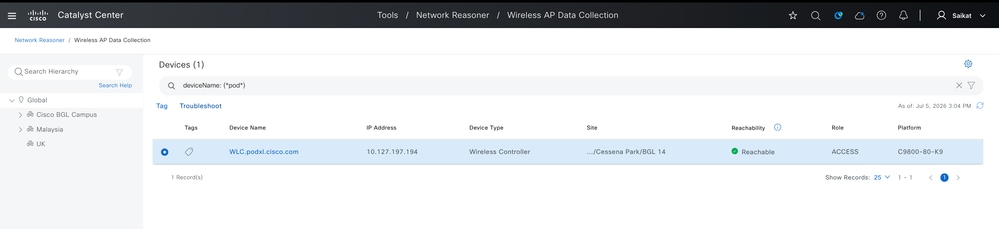
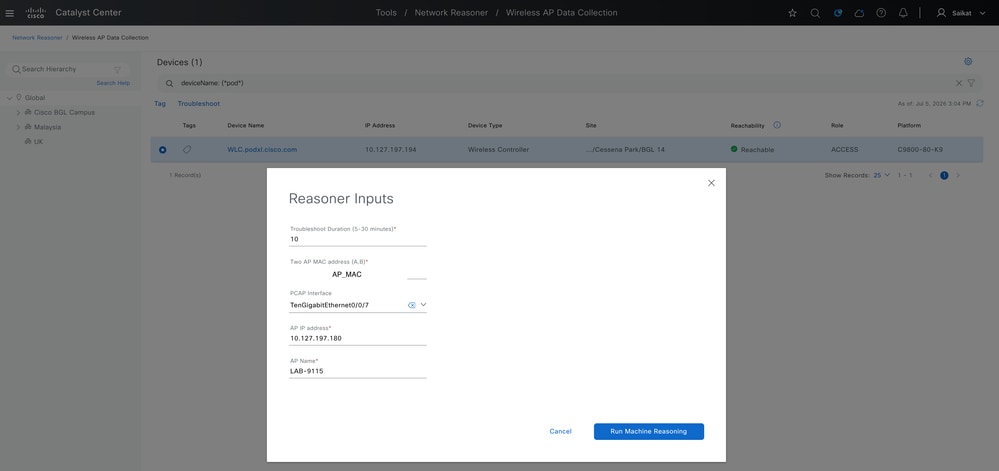
2. Access Points - If an AP is experiencing issues, select the controller that manages it, then enter the APs MAC address, set the duration for the check to run. It enables logs and packet capture from the WLC and AP, for deeper visibility. Here is the workflow for enabling Network Reasoner for an AP, along with the corresponding results:
 Select Managed AP AP WLC to Troubleshoot
 Provide AP Details to Troubleshoot
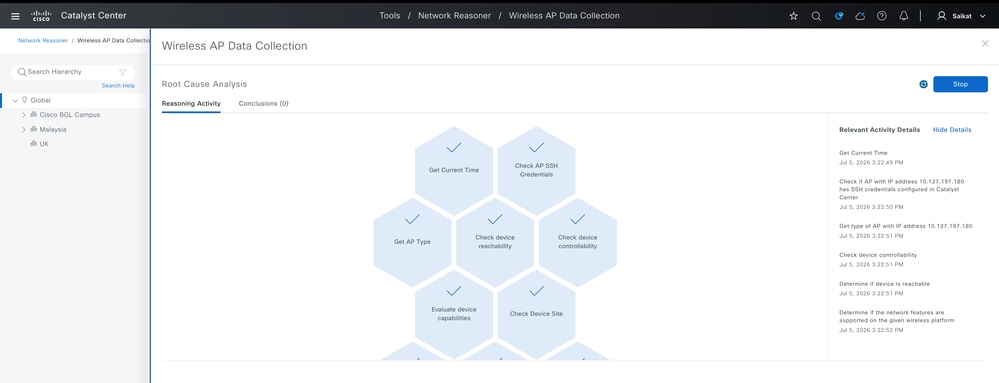
 Tasks Running to Troubleshoot AP Issue
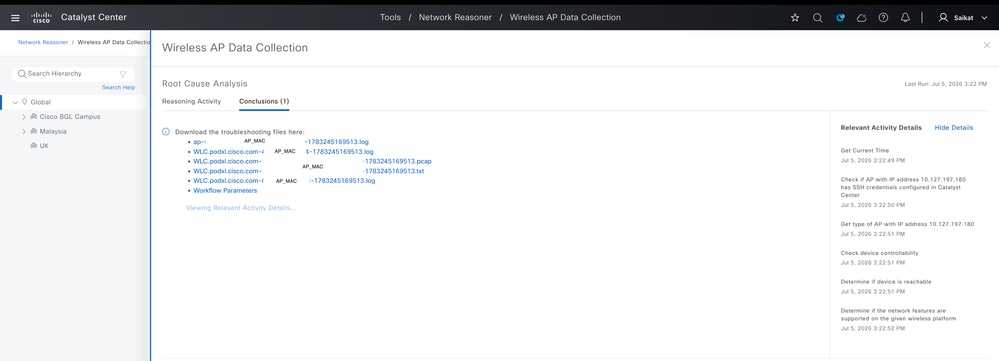
 Captures Collected from WLC and AP for AP issue
!! Task Workflow !!
Get Current Time
Jul 5, 2026 5:04:39 PM
Check if AP with IP address 10.127.197.180 has SSH credentials configured in Catalyst Center
Jul 5, 2026 5:04:40 PM
Get type of AP with IP address 10.127.197.180
Jul 5, 2026 5:04:40 PM
Check device controllability
Jul 5, 2026 5:04:41 PM
Determine if device is reachable
Jul 5, 2026 5:04:41 PM
Determine if the network features are supported on the given wireless platform
Jul 5, 2026 5:04:41 PM
Check if the device <device> is provisioned or assigned to a site.
Jul 5, 2026 5:04:42 PM
Start RA Trace
Jul 5, 2026 5:04:49 PM
Get Current Time
Jul 5, 2026 5:04:54 PM
Starting AP PCAP session <file-name> with filter 10.127.197.180 on interface TenGigabitEthernet0/0/7
Jul 5, 2026 5:04:55 PM
Get file store URL on Catalyst Center for wireless data collection upload on WLC with IP address 10.127.197.194 for filename: <file-name>
Jul 5, 2026 5:04:57 PM
Start AP statistics collection on WLC with IP address 10.127.197.194 and wait for data collection for 300 seconds - save into file bootflash:<file-name>
Jul 5, 2026 5:04:58 PM
Start logging on COS AP with IP address 10.127.197.180 over SSH for feature set apDataCollection, saved into file <file-name>, and wait for all data collection to complete after 5.0 minutes.
Jul 5, 2026 5:04:59 PM
Stop AP statistics collection on WLC with IP address 10.127.197.194 with data saved into file bootflash:<file-name>
Jul 5, 2026 5:10:00 PM
Stop data collection on COS AP with IP address 10.127.197.180 over SSH for feature set apDataCollection and saved into file <file-name>
Jul 5, 2026 5:10:01 PM
Start AP show-tech wireless collection on WLC with IP address 10.127.197.194 for AP name LAB-9115 and save data into file bootflash:<file-name> This may take a while.
Jul 5, 2026 5:10:02 PM
Check if bootflash:<file-name> is present and its data collection is complete on WLC with IP address 10.127.197.194 (initial check)
Jul 5, 2026 5:10:07 PM
Check if bootflash:<file-name>is present and its data collection is complete on WLC with IP address 10.127.197.194 (data collection not complete)
Jul 5, 2026 5:10:15 PM
Check if bootflash:<file-name> is present and its data collection is complete on WLC with IP address 10.127.197.194 (data collection not complete)
Jul 5, 2026 5:10:20 PM
Check if bootflash:<file-name> is present and its data collection is complete on WLC with IP address 10.127.197.194 (data collection not complete)
Jul 5, 2026 5:10:27 PM
Check if bootflash:<file-name>is present and its data collection is complete on WLC with IP address 10.127.197.194 (data collection not complete)
Jul 5, 2026 5:10:34 PM
Stop AP show-tech wireless collection on WLC with IP address 10.127.197.194 with data saved into file bootflash:<file-name>
Jul 5, 2026 5:10:35 PM
Start to upload file bootflash:<file-name> from WLC with IP address 10.127.197.194 to https://10.105.193.40/api/v1/file/temporaryupload/ef81bc2e-8727-4b46-9e63-cb01cef5be94
Jul 5, 2026 5:10:36 PM
Check if file bootflash:<file-name>has been uploaded successfully from WLC with IP address 10.127.197.194 to https://10.105.193.40/api/v1/file/temporaryupload/ef81bc2e-8727-4b46-9e63-cb01cef5be94
Jul 5, 2026 5:10:41 PM
File bootflash:<file-name> uploaded successfully from WLC with IP address 10.127.197.194 to https://10.105.193.40/api/v1/file/temporaryupload/ef81bc2e-8727-4b46-9e63-cb01cef5be94
Jul 5, 2026 5:10:41 PM
Delete the file bootflash:<file-name> from WLC with IP address 10.127.197.194
Jul 5, 2026 5:10:41 PM
Get file store URL on Catalyst Center for wireless data collection upload on WLC with IP address 10.127.197.194 for filename: <file-name>
Jul 5, 2026 5:10:43 PM
Stop RA Trace for AP: <MAC>
Jul 5, 2026 5:10:46 PM
Check if bootflash:<file-name> is present and its data collection is complete on WLC with IP address 10.127.197.194 (initial check)
Jul 5, 2026 5:10:49 PM
Check if bootflash:<file-name> is present and its data collection is complete on WLC with IP address 10.127.197.194 (data collection not complete)
Jul 5, 2026 5:10:53 PM
Check if bootflash:<file-name> is present and its data collection is complete on WLC with IP address 10.127.197.194 (data collection not complete)
Jul 5, 2026 5:10:57 PM
Check if bootflash:<file-name> is present and its data collection is complete on WLC with IP address 10.127.197.194 (data collection not complete)
Jul 5, 2026 5:11:02 PM
Start to upload file bootflash:<file-name> from WLC with IP address 10.127.197.194 to https://10.105.193.40/api/v1/file/temporaryupload/c1f1e287-e221-451e-9506-df41ad78368a
Jul 5, 2026 5:11:03 PM
Check if file bootflash:<file-name> log has been uploaded successfully from WLC with IP address 10.127.197.194 to https://10.105.193.40/api/v1/file/temporaryupload/c1f1e287-e221-451e-9506-df41ad78368a
Jul 5, 2026 5:11:08 PM
File bootflash:<file-name> uploaded successfully from WLC with IP address 10.127.197.194 to https://10.105.193.40/api/v1/file/temporaryupload/c1f1e287-e221-451e-9506-df41ad78368a
Jul 5, 2026 5:11:08 PM
Delete the file bootflash:<file-name> from WLC with IP address 10.127.197.194
Jul 5, 2026 5:11:08 PM
Get file store URL on Catalyst Center for wireless data collection upload on WLC with IP address 10.127.197.194 for filename: <file-name>
Jul 5, 2026 5:11:10 PM
Stop RA Trace for AP: <MAC>
Jul 5, 2026 5:11:13 PM
Check if bootflash:<file-name> is present and its data collection is complete on WLC with IP address 10.127.197.194 (initial check)
Jul 5, 2026 5:11:15 PM
Check if bootflash:<file-name> is present and its data collection is complete on WLC with IP address 10.127.197.194 (data collection not complete)
Jul 5, 2026 5:11:19 PM
Check if bootflash:<file-name> is present and its data collection is complete on WLC with IP address 10.127.197.194 (data collection not complete)
Jul 5, 2026 5:11:22 PM
Check if bootflash:<file-name> is present and its data collection is complete on WLC with IP address 10.127.197.194 (data collection not complete)
Jul 5, 2026 5:11:27 PM
Check if bootflash:<file-name> is present and its data collection is complete on WLC with IP address 10.127.197.194 (data collection not complete)
Jul 5, 2026 5:11:30 PM
Start to upload file bootflash:<file-name> from WLC with IP address 10.127.197.194 to https://10.105.193.40/api/v1/file/temporaryupload/80fa42db-3ea2-438e-9b64-81d6d23d9404
Jul 5, 2026 5:11:32 PM
Check if file bootflash:<file-name> has been uploaded successfully from WLC with IP address 10.127.197.194 to https://10.105.193.40/api/v1/file/temporaryupload/80fa42db-3ea2-438e-9b64-81d6d23d9404
Jul 5, 2026 5:11:37 PM
File bootflash:<file-name> uploaded successfully from WLC with IP address 10.127.197.194 to https://10.105.193.40/api/v1/file/temporaryupload/80fa42db-3ea2-438e-9b64-81d6d23d9404
Jul 5, 2026 5:11:37 PM
Delete the file bootflash:<file-name> from WLC with IP address 10.127.197.194
Jul 5, 2026 5:11:39 PM
Get file store URL on Catalyst Center for wireless data collection upload on WLC with IP address 10.127.197.194 for filename: <file-name>
Jul 5, 2026 5:11:41 PM
Stopping PCAP <file-name> session with <AP-MAC> filter on TenGigabitEthernet0/0/7 interface.
Jul 5, 2026 5:11:41 PM
Start to upload file bootflash:<file-name> from WLC with IP address 10.127.197.194 to https://10.105.193.40/api/v1/file/temporaryupload/31f31472-f491-4235-a8df-02051ada273f
Jul 5, 2026 5:11:41 PM
Check if file bootflash:<file-name> has been uploaded successfully from WLC with IP address 10.127.197.194 to https://10.105.193.40/api/v1/file/temporaryupload/31f31472-f491-4235-a8df-02051ada273f
Jul 5, 2026 5:11:46 PM
File bootflash:<file-name> uploaded successfully from WLC with IP address 10.127.197.194 to https://10.105.193.40/api/v1/file/temporaryupload/31f31472-f491-4235-a8df-02051ada273f
Jul 5, 2026 5:11:53 PM
Delete the file bootflash:<file-name> from WLC with IP address 10.127.197.194
Jul 5, 2026 5:11:56 PM
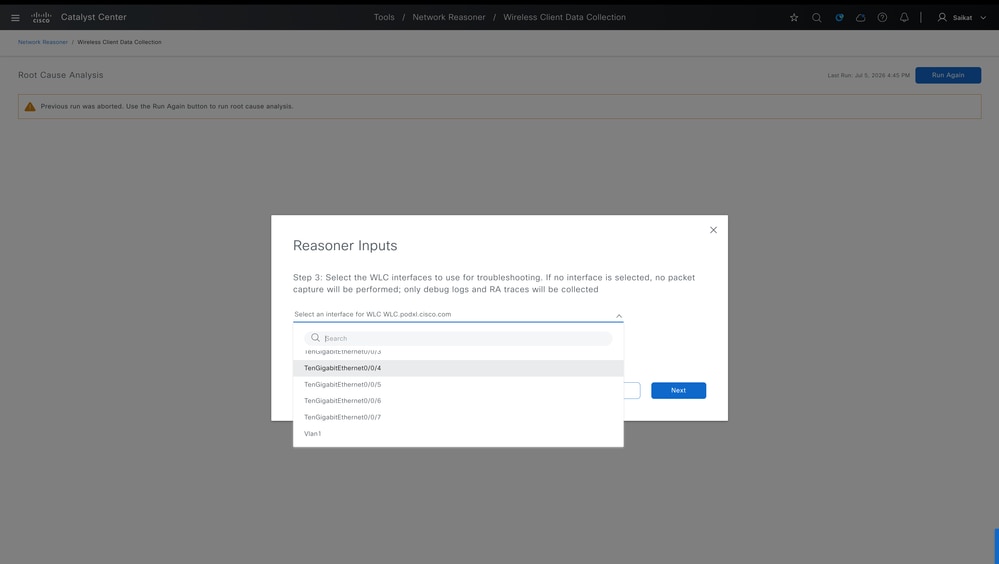
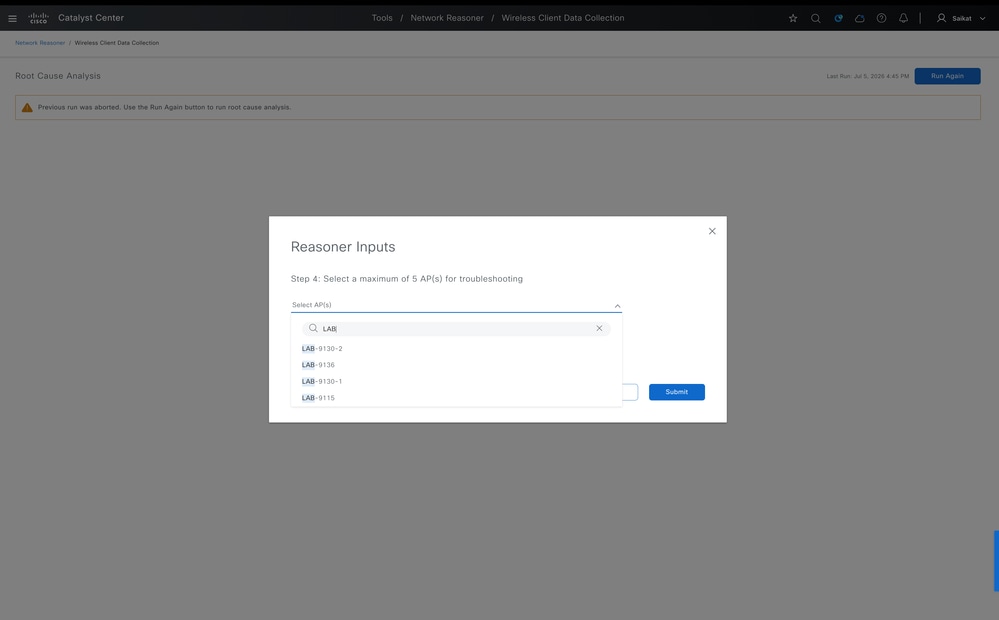
3. Wireless Clients - If a user is having Wi-Fi problems, pick the wireless controller they are connected to, enter their device MAC address, and choose how long you want the tool to monitor. It enables statistics logs, RA traces and packet capture to see the actual data exchanged. Here is the workflow for enabling Network Reasoner for wireless client, along with the corresponding results:
 Provide Client Details to Troubleshoot
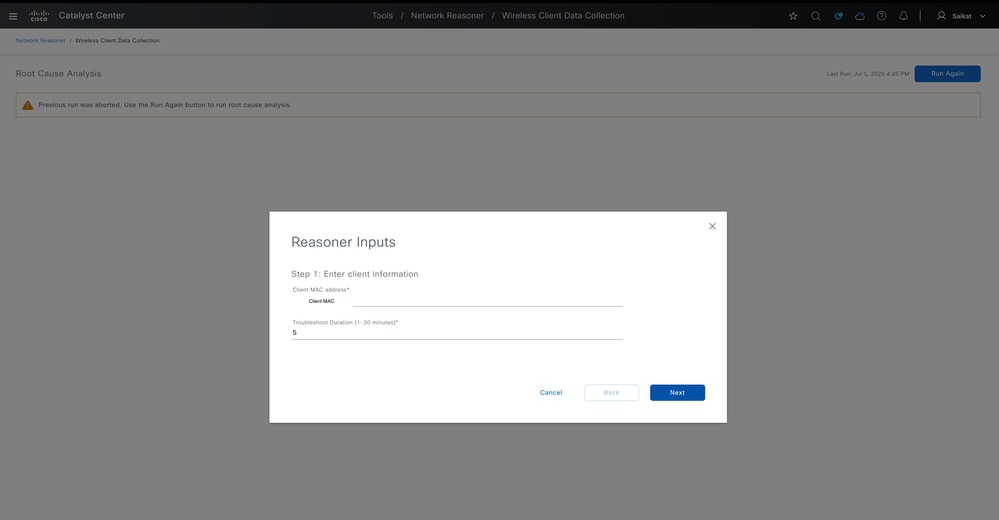 Select WLC to Troubleshoot Wireless Client MAC
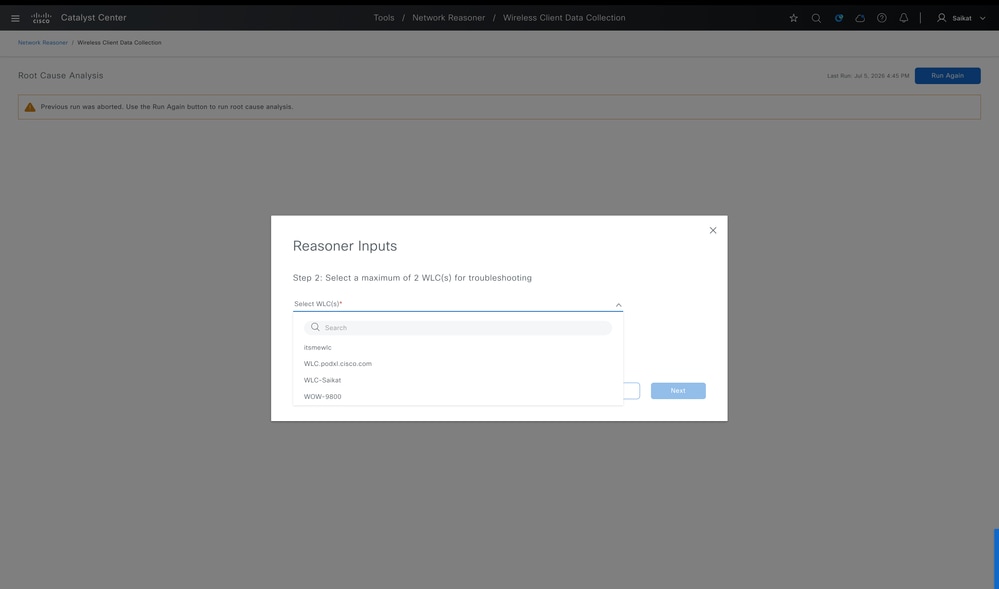 Select Interface on WLC to Troubleshoot Wireless Client
 Select APs (Max 4) to Troubleshoot Wireless Client
 Tasks Running to Troubleshoot Wireless Client Issue
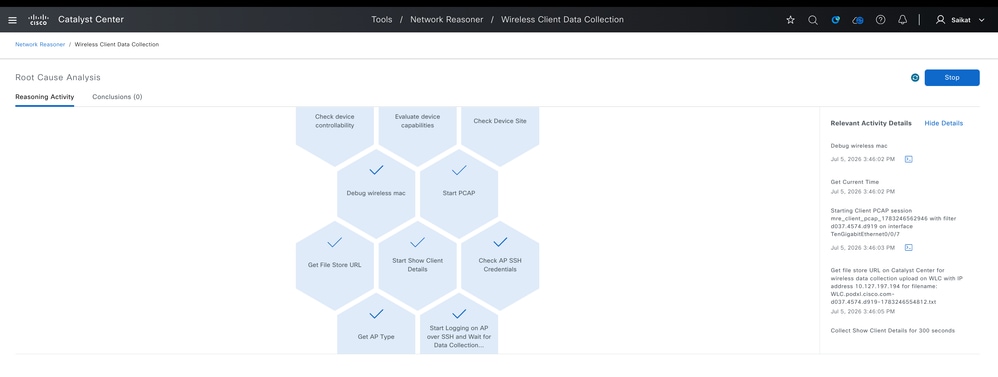 Captures Collected from WLC and AP for Wireless Client Issue
!! Task Workflow !!
Get Current Time
Jul 5, 2026 5:53:11 PM
Check device controllability
Jul 5, 2026 5:53:11 PM
Determine if device is reachable
Jul 5, 2026 5:53:11 PM
Determine if the network features are supported on the given wireless platform
Jul 5, 2026 5:53:11 PM
Check if the device <device> is provisioned or assigned to a site.
Jul 5, 2026 5:53:12 PM
Debug wireless mac
Jul 5, 2026 5:53:18 PM
Get Current Time
Jul 5, 2026 5:53:19 PM
Starting Client PCAP session <file-name> with filter <clien-mac> on interface TenGigabitEthernet0/0/7
Jul 5, 2026 5:53:20 PM
Get file store URL on Catalyst Center for wireless data collection upload on WLC with IP address 10.127.197.194 for filename: <file-name>
Jul 5, 2026 5:53:21 PM
Collect Show Client Details for 300 seconds
Jul 5, 2026 5:53:22 PM
Check if AP with IP address 10.127.197.180 has SSH credentials configured in Catalyst Center
Jul 5, 2026 5:53:24 PM
Get type of AP with IP address 10.127.197.180
Jul 5, 2026 5:53:25 PM
Start logging on COS AP with IP address 10.127.197.180 over SSH for Client MAC <client-mac> feature set clientDataCollection, saved into file <file-name>, and wait for all data collection to complete after 5.0 minutes.
Jul 5, 2026 5:53:28 PM
End Show Client Details
Jul 5, 2026 5:58:35 PM
Stop data collection on COS AP with IP address 10.127.197.180 over SSH for Client MAC <client-mac> feature set clientDataCollection and saved into file <file-name>
Jul 5, 2026 5:58:36 PM
Stop data collection on COS AP with IP address 10.127.197.151 over SSH for Client MAC <client-mac> feature set clientDataCollection and saved into file <file-name>
Jul 5, 2026 5:58:38 PM
Check File Size: <file-name>
Jul 5, 2026 5:58:38 PM
Start to upload file <file-name> from WLC with IP address 10.127.197.194 to https://10.105.193.40/api/v1/file/temporaryupload/a1ff47e6-89f1-4b7d-94c9-d7123800e5e8
Jul 5, 2026 5:58:40 PM
Check if file <file-name> has been uploaded successfully from WLC with IP address 10.127.197.194 to https://10.105.193.40/api/v1/file/temporaryupload/a1ff47e6-89f1-4b7d-94c9-d7123800e5e
Jul 5, 2026 5:58:45 PM
File <file-name> uploaded successfully from WLC with IP address 10.127.197.194 to https://10.105.193.40/api/v1/file/temporaryupload/a1ff47e6-89f1-4b7d-94c9-d7123800e5e8
Jul 5, 2026 5:58:45 PM
Delete the file <file-name> from WLC with IP address 10.127.197.194
Jul 5, 2026 5:58:45 PM
Get file store URL on Catalyst Center for wireless data collection upload on WLC with IP address 10.127.197.194 for filename: <file-name>
Jul 5, 2026 5:58:47 PM
No debug wireless mac
Jul 5, 2026 5:58:49 PM
Check if bootflash:<file-name> is present and its data collection is complete on WLC with IP address 10.127.197.194 (initial check)
Jul 5, 2026 5:58:52 PM
Check if bootflash:<file-name> is present and its data collection is complete on WLC with IP address 10.127.197.194 (data collection not complete)
Jul 5, 2026 5:58:56 PM
Check if bootflash:<file-name> is present and its data collection is complete on WLC with IP address 10.127.197.194 (data collection not complete)
Jul 5, 2026 5:58:59 PM
Check if bootflash:<file-name> is present and its data collection is complete on WLC with IP address 10.127.197.194 (data collection not complete)
Jul 5, 2026 5:59:03 PM
Check if bootflash:<file-name> is present and its data collection is complete on WLC with IP address 10.127.197.194 (data collection not complete)
Jul 5, 2026 5:59:07 PM
Start to upload file bootflash:<file-name> from WLC with IP address 10.127.197.194 to https://10.105.193.40/api/v1/file/temporaryupload/adcf1c89-8f47-4ac3-9a91-689aa59321c7
Jul 5, 2026 5:59:09 PM
Check if file bootflash:<file-name> has been uploaded successfully from WLC with IP address 10.127.197.194 to <https://10.105.193.40/api/v1/file/temporaryupload/adcf1c89-8f47-4ac3-9a91-689aa59321c7
Jul 5, 2026 5:59:14 PM
File bootflash:<file-name> uploaded successfully from WLC with IP address 10.127.197.194 to https://10.105.193.40/api/v1/file/temporaryupload/adcf1c89-8f47-4ac3-9a91-689aa59321c7
Jul 5, 2026 5:59:14 PM
Delete the file bootflash:<file-name> from WLC with IP address 10.127.197.194
Jul 5, 2026 5:59:14 PM
Get file store URL on Catalyst Center for wireless data collection upload on WLC with IP address 10.127.197.194 for filename: <file-name>
Stopping PCAP <file-name> session with d037.4574.d919 filter on TenGigabitEthernet0/0/7 interface.
Check File Size:bootflash:<file-name>
Start to upload file bootflash:<file-name> from WLC with IP address 10.127.197.194 to https://10.105.193.40/api/v1/file/temporaryupload/f5162b24-17e0-47e3-9112-355276925a7f
Check if file bootflash:<file-name> has been uploaded successfully from WLC with IP address 10.127.197.194 to https://10.105.193.40/api/v1/file/temporaryupload/f5162b24-17e0-47e3-9112-355276925a7f
File bootflash:<file-name> uploaded successfully from WLC with IP address 10.127.197.194 to
Technical References
- Cisco Intelligent Capture Deployment Guide
- Manage Intelligent captures
- Cisco Catalyst Assurance User Guide, Release 2.3.7.x
- Troubleshoot Network Device using Network Reasoner - HA on Wireless LAN Controller using MRE Workflow
Revision History
| Revision | Publish Date | Comments |
|---|---|---|
1.0 |
08-Jul-2026
|
Initial Release |

 Feedback
Contact Cisco
- Open a Support Case

- (Requires a Cisco Service Contract)