About Intelligent Capture
For Catalyst Center, all information about device and client health is typically available from Cisco Wireless Controllers. Intelligent Capture (iCAP) provides support for a direct communication link between Catalyst Center and access points (APs), so each of the APs can communicate with Catalyst Center directly. Using this channel, Catalyst Center can receive packet capture data, AP and client statistics, and spectrum data. With the direct communication link between Catalyst Center and APs, iCAP allows you to access data from APs that is not available from wireless controllers.
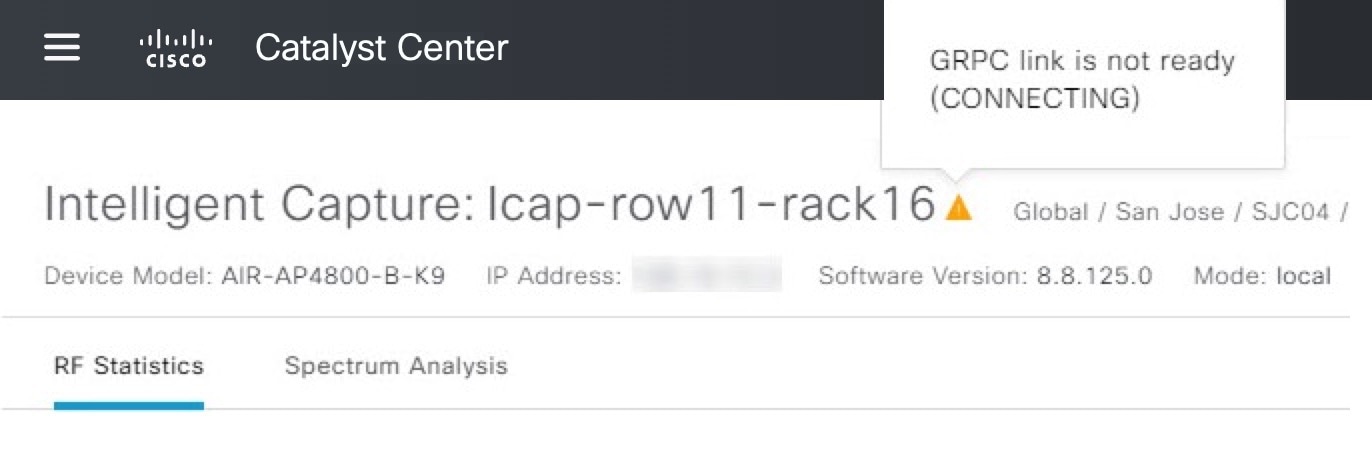
To ensure that the iCAP feature functions effectively, APs need to establish a connection to the Catalyst Center. If any firewalls exist between the APs and the Catalyst Center, make sure to open these TCP ports:
-
TCP 443: Used by APs to initiate an HTTPS connection to Catalyst Center for iCAP
-
TCP 32626: Used to establish a gRPC channel for receiving AP/client statistics and packet capture data related to the Cisco Catalyst Assurance iCAP feature.
 Note |
|
 icon with the message
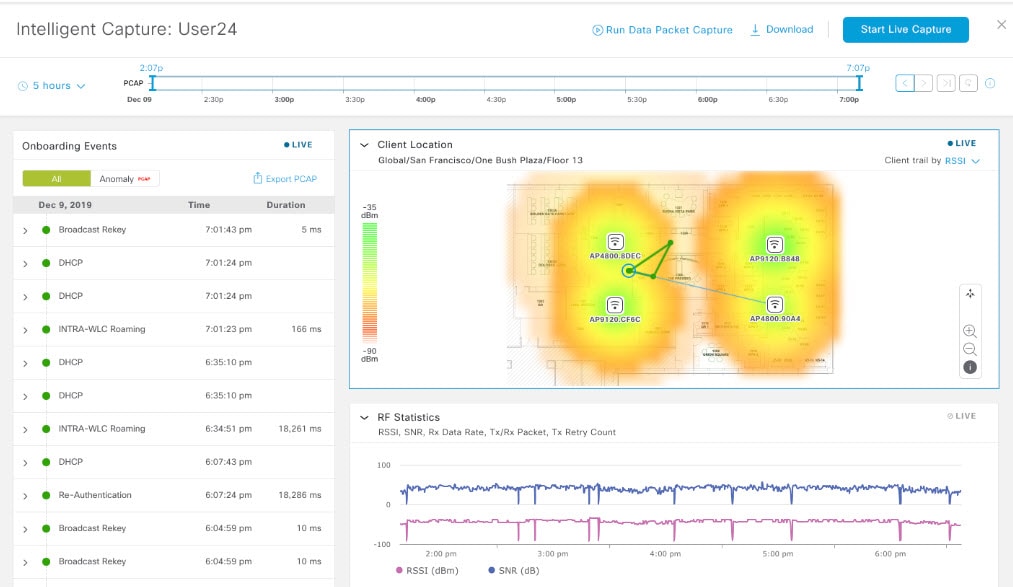
 filter
 : Successful onboarding event.
 : Incomplete event.
 : Anomaly event.
 : Good
  : Fair
  : Poor
 icon.
icon.
 Feedback