Monitor Application Health

About Application Experience and Application Visibility

Assurance processes complex application data and presents the findings in Assurance health dashboards to provide insight into the performance of applications.

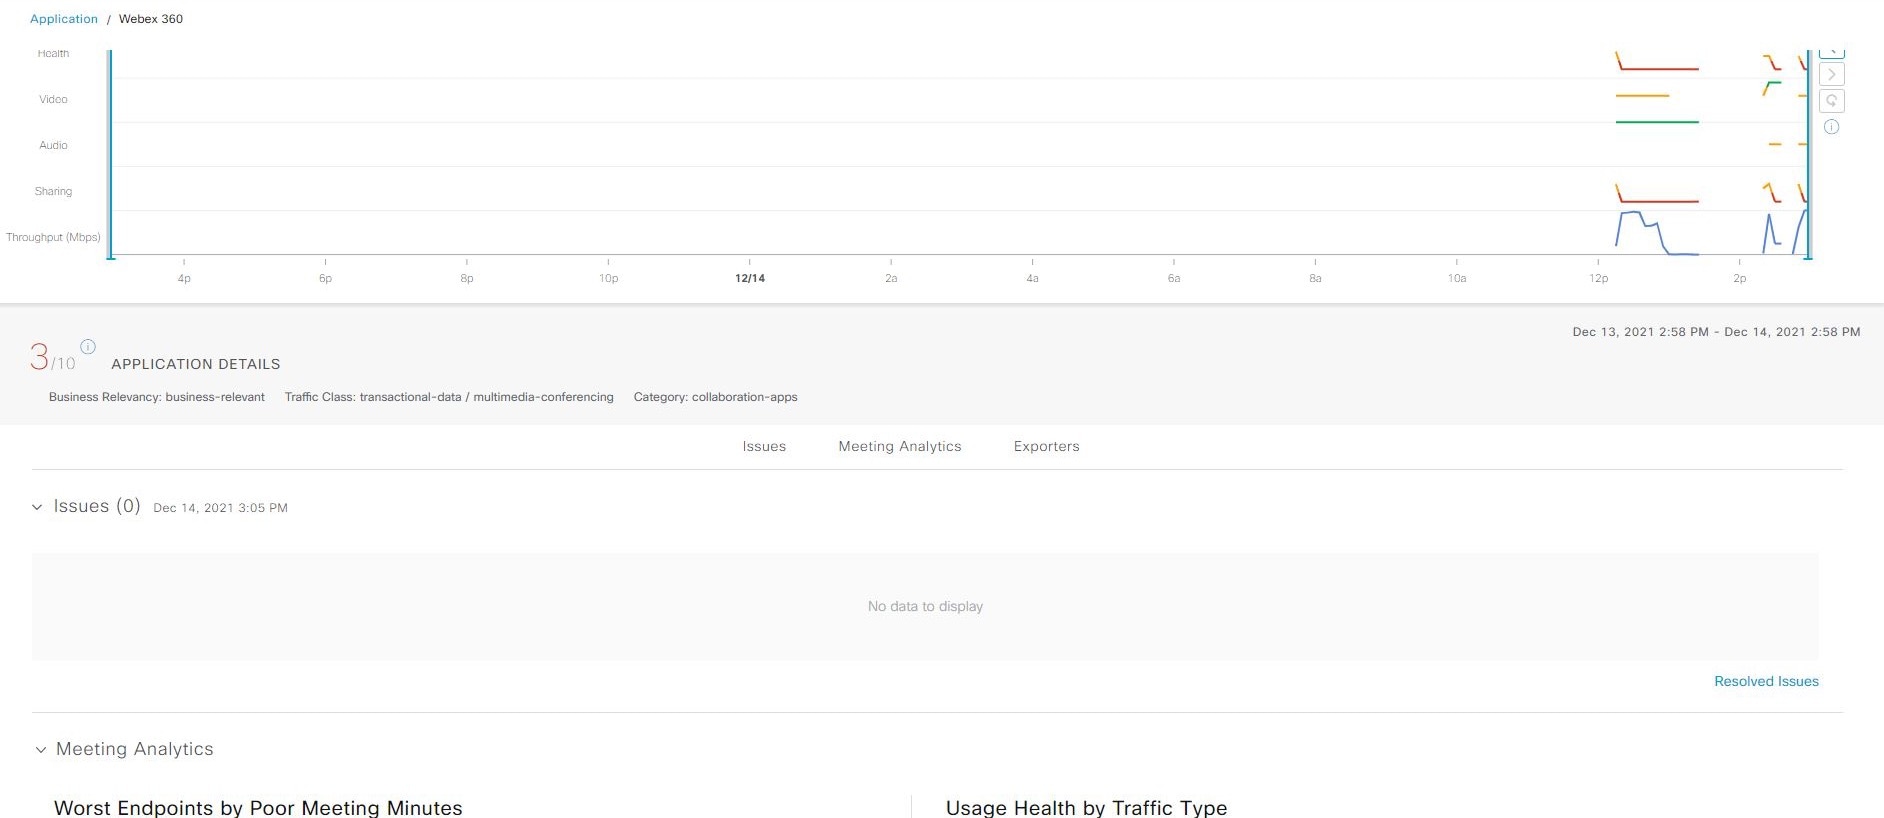
You can view the health data from a device perspective (Device 360 window), from the user perspective (Client 360 window), or from the application perspective (Application 360 window).

Depending from where the data is collected, you can see some or all of this information:

  • Application name

  • Throughput

  • DSCP markings

  • Performance metrics (Latency, Jitter, and Packet Loss)

Application Name and Throughput are collectively referred to as Quantitative metrics. Data for the Quantitative metrics comes from enabling Application Visibility.

DSCP Markings and Performance Metrics (Latency, Jitter, and Packet Loss) are collectively referred to as Qualitative metrics. Data for the Qualitative metrics comes from enabling Application Experience.

Application Visibility

Application Visibility data is collected from switches running IOS-XE, and from wireless controllers running AireOS.

For switches running IOS-XE, Application Visibility data is collected using a predefined NBAR template that is applied bidirectionally (ingress and egress) to the physical layer access switch ports.

For wireless controllers running AireOS, Application Visibility data is collected at the wireless controller, and then streaming telemetry is used to transport this data to Catalyst Center.

Application Experience

Application Experience data is collected from Cisco IOS-XE router platforms, specifically using the Cisco Performance Monitor (PerfMon) feature and the Cisco Application Response Time (ART) metrics.

Examples of router platforms include ASR 1000, ISR 4000, and CSR 1000v. For device compatibility with Catalyst Center, see the Cisco Catalyst Center Compatibility Matrix.

To view the Cisco Performance Monitor feature availability, use the Cisco Feature Navigator tool. Click Research Features, and then add Easy Performance Monitor Phase II in the filter field.

Optimized Application Performance Monitoring

Optimized Application Performance Monitoring (APM) is a feature on the device that reduces the overhead in collecting NetFlow data. APM is supported on Cisco IOS-XE routers, Cisco 9800 series wireless controllers, and the Catalyst Center Traffic Telemetry Appliance. For minimum software versions, see Supported platforms.

Supported platforms

This table lists the supported platforms, type of data collection, and software and license requirements.


Note


For device compatibility with Catalyst Center, see the Cisco Catalyst Center Compatibility Matrix.


Cisco platform support for Application Experience and Application Visibility in Catalyst Center
Platform Data collection Notes

Cisco IOS XE Routers

Application Experience data collection.

  • Requires an active NBAR2 license.

  • Cisco IOS XE 16.3 minimum software version.

  • For Optimized APM: Cisco IOS XE 17.3 minimum software version.

Catalyst 9000 Series Switches

Application Visibility data collection for 9200, 9300, 9400.

  • Requires an Advantage license.

  • Cisco IOS XE 16.10.1 minimum software version.

  • IP routing must be enabled.

Cisco AireOS Wireless Controllers

Application Visibility data collection.

  • Requires an Advantage license.

  • Requires 8.8 MR2 software version 8.8.114.130 or later.

Cisco 9800 Series Wireless Controller

Application Visibility data collection for Flex/Fabric SSIDs.

Application Experience data collection for central switching/local SSIDs, and Flex/Fabric SSIDs.

  • Application Visibility for Optimized APM: Cisco IOS XE 16.12.1 minimum software version.

  • Application Experience for local mode: Cisco IOS XE 16.12.1 minimum software version.

    For flex/fabric mode: Cisco IOS XE 17.10.1 minimum software version.

Catalyst Center Traffic Telemetry Appliance

Application Experience data collection.

  • Requires an Advantage license.

  • For Optimized APM: Cisco IOS XE 17.3 minimum software version.

Criteria for enabling application telemetry on devices

Catalyst Center automatically enables application telemetry on all applicable interfaces or WLANs that are selected based on the new automatic interfaces or WLAN selection algorithm.


Note


  • The conventional tagging-based algorithm is supported and has precedence over the newer automatic interfaces or WLAN selection algorithm.

  • If you want to switch over from the automatic selection algorithm to the tagging-based algorithm, you must disable telemetry before provisioning the tagged SSIDs to the devices.


This table provides the criteria for selecting interfaces and WLANs based on the conventional tagging-based algorithm (with lan keyword) and the new automatic selection algorithm for all the supported platforms:

Platform Conventional tagging-based algorithm Automatic selection algorithm

Router

  • Interface description has the lan keyword.1, 2

  • Interface has an IP address other than the management IP address.

  • Interface has an IP address other than the management IP address.

  • Interface is not any of these types:

    • WAN

      Note


      An interface is treated as a WAN-facing interface if it has a public IP address, and if there is a route rule with a public IP address that routes through the interface.

      In this context, a public IP address is not in a private range (for example, not in 192.168.x.x, 172.16.y.y, 10.z.z.z), or is an IP address that is not in the system's IP pools.

      Route rules can be dynamically learned. In this context, the show ip route command does not show a route to a public IP address that goes through this interface.

    • Loopback.

    • Management interface: GIGABITETHERNET0, GIGABITETHERNET0/0, MGMT0, FASTETHERNET0, or FASTETHERNET1.

Switch

  • Interface description has the lan keyword.1, 2

  • Switch port is configured as an access port.

  • Switch port is configured with the switch-mode access command.

  • Interface is a physical interface.

  • Access port does not have neighbors.

  • Interface is not any of these types:

    • Management interface: FASTETHERNET0, FASTETHERNET1, GIGABITETHERNET0/0, or MGMT0

    • LOOPBACK0, Bluetooth, App Gigabit, WPAN, Cellular, or Async

    • VSL interface.

Cisco AireOS Controller

WLAN profile name is tagged with the lan keyword.1, 2

If the SSIDs are mixed, that is Local mode, Flex mode, and Fabric mode, Wireless Service Assurance (WSA) processing is enabled. If all the SSIDs are in Local mode, NetFlow is enabled.

Cisco Catalyst 9800 Series Wireless Controller with Optimized Application Performance Monitoring (APM) profile and IOS 16.12.1 and later.

WLAN profile name is tagged with the lan keyword.1, 2

If the SSIDs are mixed—that is, central switching, Flex mode, and Fabric mode—the Cisco Application Visibility and Control (AVC) basic record is configured. If all the SSIDs use central switching, the Optimized APM record is configured.

For Cisco Catalyst 9800 Series Wireless Controllers with IOS 17.10 and later, Catalyst Center pushes the APM profile, not the AVC basic profile, for flex and fabric SSIDs.

Note

 
If you want to update the telemetry configuration, you must disable telemetry and then enable it after making the configuration changes.

Catalyst Center Traffic Telemetry Appliance with Optimized APM profile and IOS 17.3 and later.

  • Interface description has the lan keyword.1, 2

  • Interface is a physical interface.

  • Interface is a physical interface.

  • Interface is not a management interface: GIGABITETHERNET0, GIGABITETHERNET0/0, MGMT0, FASTETHERNET0, and FASTETHERNET1.

1 The lan keyword is case insensitive and can be separated by a space, hyphen, or underscore.
2 Resynchronize the network device to read the lan keyword.

For example, to use the conventional tagging-based algorithm to enable application telemetry:

  • the WLAN profile name test-lan on this Cisco Catalyst 9800 Series Wireless Controller includes the lan keyword:

    WLAN Profile Name               SSID                     VLAN Status
    --------------------------------------------------------------------------------
    1    test-lan                   test1-ssid               137   UP
    
  • the interface description wired-lan on this switch includes the lan keyword:

    interface GigabitEthernet1/0/1
    description wired-lan
    

Application health prerequisites

This topic provides the prerequisites relating to application health for routers, Cisco AireOS Wireless Controllers, and switches.

Application Experience prerequisites on routers

  • Requires Cisco IOS XE software with an active NBAR2 license.

  • Application flows within the Layer 3 network are not visible.

  • Traffic associated with the management interface is not part of Application Experience.

  • Ports cannot be enabled for ETA.

  • Clocks must be synchronized between Catalyst Center and the device for Assurance to display Application Health data.

  • The conventional tagging-based algorithm (with keyword lan) is supported, but the newer automatic interface or WLAN selection algorithm allows you to enable Application Telemetry on interfaces or WLANs without tagging them with the keyword lan. For information about the criteria that is used, see Criteria for enabling application telemetry on devices.

Application Visibility prerequisites on switches

  • Requires Cisco IOS XE software.

  • Requires an Advantage license.

  • Implemented only on access ports that contain the command switchport mode access.

  • Support for L2 logical interfaces is not available.

  • Limited visibility if the switch port is connected to an AP and configured with switchport mode access.

  • Ports cannot be enabled for ETA.

  • Only IPv4 flows are monitored.

  • These management interfaces cannot be used as a source interface of a NetFlow export:

    • GIGABITETHERNET0/0

    • MGMT0

    • FASTETHERNET0

    • FASTETHERNET1

    • GIGABITETHERNET0

  • Clocks must be synchronized between Catalyst Center and the device for Assurance to display Application Health data.

  • The conventional tagging-based algorithm (with keyword lan) is supported, but the newer automatic interface or WLAN selection algorithm allows you to enable Application Telemetry on interfaces or WLANs without tagging them with the keyword lan. For information about the criteria that is used, see Criteria for enabling application telemetry on devices.

Application Visibility prerequisites on AireOS Wireless Controllers

  • Requires an Advantage license.

  • Supported only on wireless controllers that have AireOS software and not on wireless controllers that have IOS XE software.

  • NetFlow must be enabled on the Cisco AireOS Wireless Controllers.

  • Clocks must be synchronized between Catalyst Center and the device for Assurance to display Application Health data.

  • Flexible NetFlow (FNF) flow monitors are not implemented. Instead, Application Visibility data is collected using streaming telemetry by subscribing to the Client-app-stat-events channel.

  • The conventional tagging-based algorithm (with keyword lan) is supported, but the newer automatic interface or WLAN selection algorithm allows you to enable Application Telemetry on interfaces or WLANs without tagging them with the keyword lan. For information about the criteria that is used, see Criteria for enabling application telemetry on devices.

Application Visibility prerequisites on Cisco 9800 Series Wireless Controller

Application Experience prerequisites on traffic telemetry appliance

  • Requires an Advantage license.

  • Requires IOS XE software for Optimized APM. See Criteria for enabling application telemetry on devices.

  • Clocks must be synchronized between Catalyst Center and the device for Assurance to display Application Health data.

  • To enable visibility of CAPWAP-encapsulated wireless traffic, manually enter the ip nbar classification tunneled-traffic CAPWAP command on the appliance.

Provision application telemetry settings

Configure global telemetry settings as described in Configure syslog, SNMP traps, NetFlow Collector servers, and wired client data collection using telemetry.

Procedure


Step 1

From the main menu, choose Provision > Network Devices > Inventory.

The Inventory window displays the device information gathered during the discovery process. To view devices available in a particular site, expand the Global site in the left pane and select the site, building, or floor.

Step 2

Select the devices that you want to provision.

Step 3

From the Actions drop-down list, select Telemetry and do one of these steps:

Note


The Enable Application Telemetry and Disable Application Telemetry options are enabled only when the device supports application telemetry from Catalyst Center.

  1. Enable Application Telemetry: To configure application telemetry for the selected devices.

  2. Disable Application Telemetry: To remove the application telemetry configuration from the chosen devices.

Step 4

Click Apply.

The Application Telemetry column shows the telemetry configuration status. If you don’t see the Application Telemetry column in the default column setting, click the ellipsis icon () at the right end of the column headings and check the
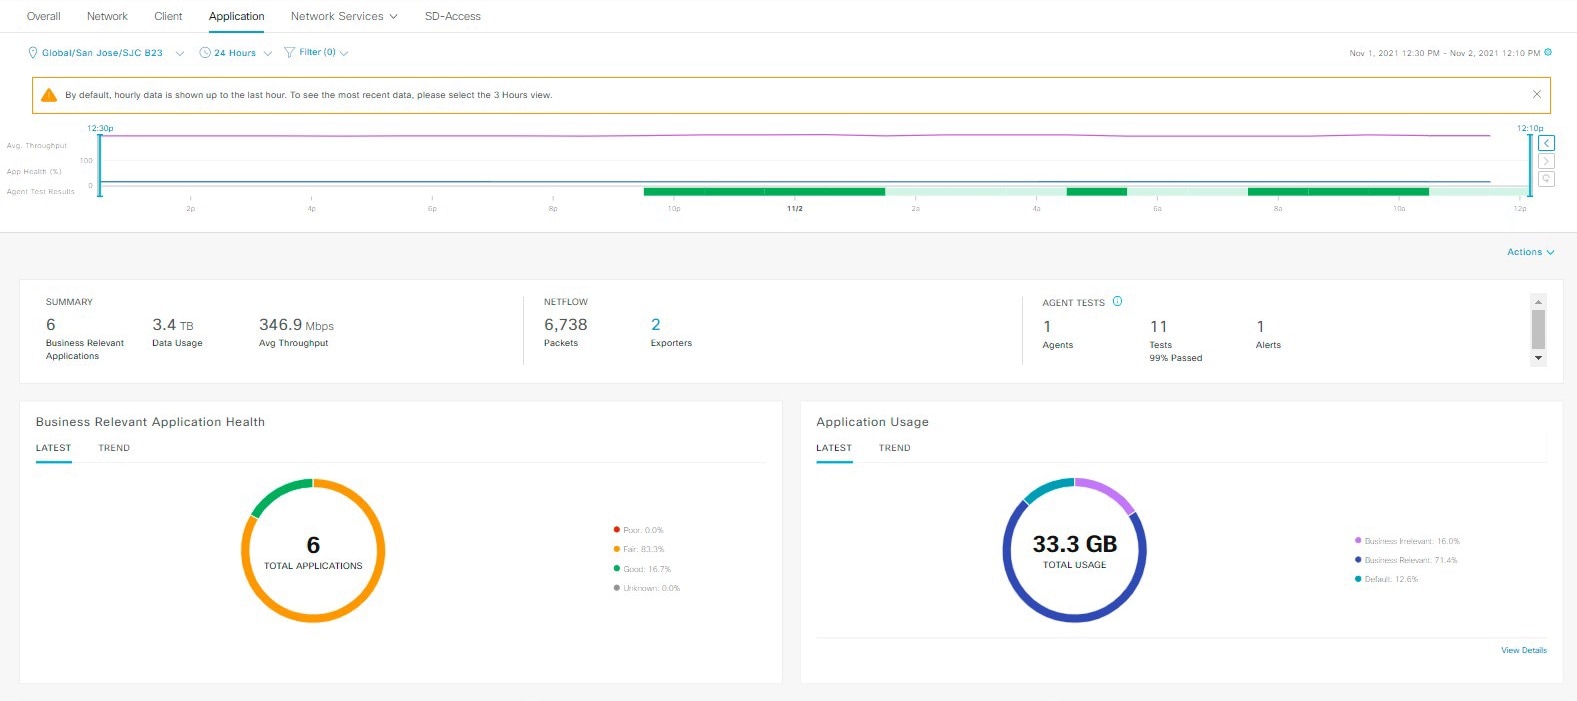
 Application Telemetry check box.


View Application Experience of a host

Use this procedure to view the qualitative and quantitative metrics of the applications running on a host.

Before you begin

Procedure


Step 1

From the Client 360 window, expand the Application Experience category.

Step 2

From the Application Experience category, you can do these steps:

  1. View the Application Experience data in table format from a specific business relevance group by clicking its corresponding tab. The tabs are: Business Relevant, Business Irrelevant, or Default.

    Note


    The displayed data is based on the time you selected from the drop-down menu in the Client 360 window. Options are: 3 Hours, 24 Hours, and 7 Days. Default is 24 Hours.

  2. View Application Experience data in the table.

    • Name: The application name.

    • Health: The health score is calculated on the basis of a combination of metrics of packet loss, latency, and jitter. You can also include application delay for health score calculation. For more information, see Individual application health score.

    • Usage Bytes: The number of bytes transferred by the client for this application.

    • Average Throughput: The rate of the application traffic (in Mbps) flowing between the client and the server.

    • DSCP: The application's current (Observed) and default (Expected) DSCP value.

      Note


      This metric is not available for Optimized APM.

    • Packet Loss: The percentage (maximum and average) of packet loss.

    • Network Latency: The network latency time (maximum and average) in milliseconds.

    • Jitter: The variance in time delay in milliseconds (maximum and average) between data packets over your network.

  3. To view the Application Experience metrics in chart format, click the radio button next to an application. The metrics are: Throughput, Packet Loss, Jitter, Network Latency, Client Network Latency, Server Network Latency, and Application Server Latency.

    Note


    Application Visibility data that is exported by a Cisco Catalyst 9200 switch, Cisco Catalyst 9300 switch, or a Cisco AireOS wireless controller only provides data for Application Name, Usage, and Throughput.


View Application Experience of a network device

Use this procedure to view the qualitative and quantitative metrics of the applications running on a network device.

Before you begin

Procedure


Step 1

From the Device 360 window, expand the Application Experience category.

Step 2

From the Application Experience category, you can do these steps:

  1. View the Application Experience data in table format from a specific business relevance group by clicking its corresponding tab: Business Relevant, Business Irrelevant, or Default.

    Note


    The displayed data is based on the time you selected from the drop-down menu in the Device 360 window. Options are 3 Hours, 24 Hours (the default), and 7 Days.

  2. Filter the Application Experience data for a specific VRF or a specific router interface by using the appropriate filters: All VRFs and All Interfaces.

    Note


    The All VRFs and All Interfaces filters are only available for routers.

  3. View Application Experience data in the table:

    • Name: The application name.

    • Health: The health score is calculated on the basis of a combination of metrics of packet loss, latency, and jitter. You can also include application delay for health score calculation.

      Note


      The health score is not available for Cisco Catalyst 9000 Series Switches and Cisco AireOS wireless controller. These devices do not poll the KPIs that are required to calculate a health score.

    • Usage Bytes: The number of bytes transferred by the client for this application.

    • Average Throughput: The rate of the application traffic (in Mbps) flowing between the client and the server.

    • DSCP: The application's current (Observed) and default (Expected) DSCP value.

      Note


      This metric is not available for Optimized APM.

    • Packet Loss: The percentage (maximum and average) of packet loss.

    • Network Latency: The network latency time (maximum and average) in milliseconds.

    • Jitter: The variance in time delay in milliseconds (maximum and average) between data packets over your network.

  4. To view the Application Experience metrics in chart format, click the radio button next to an application. The metrics are Throughput, Packet Loss, Jitter, Network Latency, Client Network Latency, Server Network Latency, Application Server Latency, and Application Response Time.

    Note


    Application Visibility data that is exported by a Cisco Catalyst 9200 switch, Cisco Catalyst 9300 switch, or a Cisco AireOS wireless controller only provides data for Application Name, Usage, and Throughput.


Monitor the health of all applications

Use this procedure to get a global view of applications at a site.

Before you begin

Procedure


Step 1

From the main menu, choose Assurance > Health.

The Overall health dashboard appears.

Step 2

Click the Application tab.

The Application health dashboard appears.

Figure 1. Application Health Dashboard
Figure 14: Application Health dashboard, with activity, summary, and application health.

Step 3

Use the Application health dashboard top-menu bar for this functionality:

Application Health Dashboard Top-Menu Bar
Item Description

Location drop-down list

Click to display the location icon. Click the location icon to display the Site List View. To view the application information from a specific site or building, click Go to Site in the appropriate row. The information is refreshed in the dashboard based on your selection.

Time Range setting

Enables you to display data within a specified time range on the dashboard. Do these steps:

  1. From the drop-down menu, select the length of the range: 3 Hours, 24 Hours, or 7 Days.

  2. Specify the Start Date and time; and the End Date and time.

  3. Click Apply.

Filter

Select the SSID from the drop-down list and then click Apply. Depending on your selection, the information in the dashboard is refreshed.

Actions drop-down list

Enables you to customize the dashboard display when you select Edit Dashboards from the drop-down list. See Change the position of a dashlet and Create a custom dashboard.

Application Health Timeline Slider

Enables you to view the healthy business-relevant application percentage, throughput, and agent test result for a more granular time range. Hover your cursor within the timeline to view the health score percentage at a specific time.

You can click and drag the timeline boundary lines to specify the time range. This sets the context for application data that is displayed in the dashboard dashlets.

You can use the arrow buttons on the right of the timeline to view data for up to 30 days.

Step 4

Use the Summary dashlet for this functionality:

Summary Dashlet
Item Description

Summary

Displays the total number of business-relevant applications, data usage, and average throughput in your overall network or selected site.

Netflow

Displays the total number of NetFlow packets.

Displays the total number of exporters. Click an exporter to view a slide-in pane that displays a table that contains device name, packet count, record count, and rate limit drops.

ThousandEyes Tests

Displays the total number of ThousandEyes enterprise agents, tests, and active alerts running on your supported Cisco Catalyst 9300 or 9400 Series switch.

These types of ThousandEyes agent tests are supported:

  • Network agent-to-server test: Collects network data, including jitter, packet loss, and latency.

  • Web HTTP server test: Collects HTTP server data, including response time.

  • Network agent-to-agent test: Collects network data, including jitter, packet loss and latency.

  • Voice RTP test: Collects Mean Opinion Score (MOS), packet loss, latency and Packet Delay Variation (PDV).

To configure ThousandEyes Integration, see Configure ThousandEyes Integration in the Cisco Catalyst Center Administrator Guide.

Step 5

Use the Application Health dashlet for this functionality:

Application Health dashlet
Item Description

Business Relevant Application Health

Contains a health score for business-relevant applications. The health score is the percentage of healthy (good) business-relevant applications in your overall network, or selected site. See Understand application health score and KPI metrics.

These charts appear:

  • Application count distribution trend chart that shows the count of all business-relevant applications over time, which is shown as a stacked area chart based on their health scores.

  • Circle chart that shows the count of business-relevant applications categorized by the application's health score. You can click a category to show the list of applications with the lowest health score within the category.

Application Usage

  • Circle chart: Shows the total application usage categorized by the application's business-relevance group. You can click a category to show the list of the top 10 applications by usage within the category.

    Note


    The application usage is the taken from the application's bidirectional traffic.

  • View Details: Click View Details to open a slide-in pane with additional details. From the slide-in pane, you can:

    • Click the All Applications, Business Relevant, Business Irrelevant, and Default tabs to display a chart with its application usage and the top 10 applications by usage.

    • Filter the chart by application group or traffic class with the drop-down list at the top right of the slide-in pane.

    • Click a category in the chart to display the applications and its detailed information in the Application table.

Top Applications by Throughput Click LATEST and TREND tabs to view the top 5 applications by their average throughput values. Each application name is clickable and redirects to the relevant Application 360 page.
Top Endpoints by Throughput Shows the top 5 endpoints by their average throughput values. Each endpoint identifier (IP address) is clickable and redirects to the relevant Client 360 page.
Worst Applications by Health

Click LATEST and TREND tabs to view the worst 5 application by their health score. Each application name is clickable and redirects to the relevant Application 360 page.

View Details: Click View Details to open a slide-in pane with additional details about the worst applications by different health KPIs, such as packet loss and jitter.

Step 6

Use the Application dashlet for this functionality:

Application dashlet
Item Description

Type

Filter the table based on the business-relevance groups. Options are Business Relevant, Business Irrelevant, Default, and All.

Health

Filter the table based on the application's health scores. Options are:

  • Poor: Applications with a health score range from 1 to 3.

  • Fair: Applications with a health score range from 4 to 7.

  • Good: Applications with a health score range from 8 to 10.

  • All: All applications.

  • Unknown: Applications are missing qualitative metrics for determining a health score.

Application table

View detailed application information in a table format. The application table displays this information by default:

  • Name: Displays the application name. The names are based on the standard applications from Cisco Next Generation Network-Based Application Recognition (NBAR).

    Changing an application's name with the Application Policy package does not show the changed name in Application Experience. There is no integration between the Application Policy package and Application Experience.

  • If an application is not a standard application from the NBAR, its HTTP hostname or SSL common name is displayed, if available. These applications are assigned to the Default business-relevance group.

    You can click the name to display a 360° view of an application. See Monitor the health of an application.

  • The application table lists new applications:

    ms-teams-video, ms-teams-app-sharing, ms-teams-audio, ms-teams-media and ms-teams applications. These are grouped under microsoft-teams.

    Click microsoft-teams to display an MS Teams 360 view of Microsoft Teams applications. See Monitor and troubleshoot the health of a Microsoft Teams application.

    webex-video, webex-audio, and webex-app-sharing. These are grouped under webex, where the data is collected from the NetFlow data.

    Click webex to display a Webex 360 view of Webex applications. See Monitor and troubleshoot health of a Webex application.

  • Health: Displays the health score of the application.

  • Business Relevance: Possible values are All, Business Relevant, Business Irrelevant, and Default.

  • Usage Bytes: The number of bytes transferred for this application.

  • Average Throughput: The rate of application traffic (in Mbps) flowing between the client and server.

  • Packet Loss (%): The percentage of packet loss.

  • Network Latency: The network latency time, in milliseconds, for Transmission Control Protocol (TCP)-based applications.

  • Jitter: The variance in time delay in milliseconds between data packets over your network. Jitter is for Real-time Transport Protocol (RTP)-based applications.

Customize the data that you want displayed in the table:

  1. From the Table Appearance tab, set the table density and striping.

  2. From the Edit Table Columns tab, check the check boxes for the data you want displayed in the table.

  3. Click Apply.

Click Export to export the table data to a CSV file.

Step 7

Use the ThousandEyes Enterprise Agent Tests dashlet for this functionality:

ThousandEyes Enterprise Agent Tests
Item Description

Enterprise Agent Tests table

View detailed ThousandEyes Enterprise Agent Tests information in a table format. The agent table displays these details:

  • Test Name: Displays the enterprise agent test name.

    Click the name to go to the ThousandEyes Agent page.

  • Test Type: Displays the name of the test type.

  • Target: Displays the target server used for the agent test.

  • Device Name: Displays the device name.

  • Average Packet Loss (%): The average percentage of packet loss during data collection between agents and servers.

  • Average Jitter: The variance in time delay in milliseconds between data packets over your network. Jitter is for RTP-based applications.

  • Average Latency: The network latency time, in milliseconds, for TCP-based applications.

  • # of Active Alerts: Displays the number of active alerts during the agent test.

  • # of Alerts: Displays the total number of alerts during the agent test.

  • # of Failed Tests: Displays the number of failed agent tests.

  • MOS: Displays average and latest of mean opinion score.

  • PDV (ms): Displays average and latest score of packet delay variation.

Install Agents

Click Install Agents to install the ThousandEyes Enterprise Agents. Cisco Catalyst 9000 series switches (such as the Catalyst 9300 and 9400) support running ThousandEyes Enterprise Agents as an application directly on the switch. See Install ThousandEyes Enterprise Agents.

Manage Agents

Click Manage Agents to manage all the installed enterprise agents and perform uninstall, upgrade, start, stop, resync, assign Test, or add new test in the manage agents window. You can view global agent stats such as running, stopped, failed, and in progress agents. See Manage enterprise agents and tests.

Customize the data that you want displayed in the table:

  1. From the Table Appearance tab, set the table density and striping.

  2. From the Edit Table Columns tab, check the check boxes for the data you want displayed in the table.

  3. Click Apply.

Click Export to export the table data to a CSV file.


Install ThousandEyes Enterprise Agents

Use this procedure to install the ThousandEyes Enterprise agents onto Catalyst 9300 and 9400 series switches. If you have installed agents previously, you can manage agents and add tests to run on them.

Before you begin

Procedure


Step 1

In the Connect ThousandEyes window, choose the ThousandEyes Account Group from the Thousand Eyes Account Group drop-down list and click Next.

Step 2

In the Select Applications window, select the application for which you want to install the agents and do enhanced application monitoring from these options:

  • Microsoft 365

  • Slack

  • Webex

  • Salesforce

  • Zoom

  • AWS Console

  • Custom Application.

Step 3

In the Configure Application window, you can configure the application based on the application you selected.

If you chose

Then

Microsoft 365

Configure these microsoft 365 parameters and tests:

  • Subdomain name - Enter the Microsoft 365 subdomain name.

  • Test interval - Select the test interval from the Test interval drop-down list. The test interval values are 1 minute, 2 minutes, 5 minutes, 10 minutes, 15 minutes, 30 minutes, and 1 hour.

  • To select the tests to be added, check the Test included check box. The available tests are M365 - OneDrive Web, M365 - Login Web, M365 - App Portal Web, M365 - Sharepoint Web, M365 - Outlook Web. You must configure at least one test to run the test on the application.

Slack

Configure these Slack parameters and tests:

  • Subdomain name - Enter the Slack subdomain name.

  • Test interval - Select the test interval from the Test interval drop-down list. The test interval values are 1 minute, 2 minutes, 5 minutes, 10 minutes, 15 minutes, 30 minutes, and 1 hour.

  • To add a test, check the Test included check box. The available tests are Slack - Web, and Slack - api.slack.com. You must configure at least one test to run the test on the application.

Webex

Configure these Webex parameters and tests:

  • Webex site ID - Enter the Webex site ID.

  • Test interval - Select the test interval from the Test interval drop-down list. The test interval values are 1 minute, 2 minutes, 5 minutes, 10minutes, 15 minutes, 30 minutes, and 1 hour.

  • To add a test check the Test included check box. The available test is Webex - Server. You must configure at least one test to run the test on the application.

Salesforce

Configure these Salesforce parameters and tests:

  • Subdomain name - Enter the salesforce subdomain name.

  • Test interval - Select the test interval from the Test interval drop-down list. The test interval values are 1 minute, 2 minutes, 5 minutes, 10 minutes, 15 minutes, 30 minutes, and 1 hour.

  • To add a test, check the Test included check box. The available tests are Salesforce - Classic, Salesforce - Lighting, Salesforce - Login, Salesforce - Files, and Salesforce - Static Assets. You must configure at least one test to run the test on the application.

Zoom

Configure these Zoom parameters and tests:

  • Subdomain name - Enter the Zoom subdomain name.

  • Test interval - Select the test interval from the Test interval drop-down list. The test interval values are 1 minute, 2 minutes, 5 minutes, 10 minutes, 15 minutes, 30 minutes, and 1 hour.

  • To add a test, check the Test included check box. The available test is Zoom - Web You must configure at least one test to run the test on the application.

AWS Console

Configure these AWS console parameters and tests:

  • Template - Enter the AWS template name.

  • Test interval - Select the test interval from the Test interval drop-down list. The test interval values are 1 minute, 2 minutes, 5 minutes, 10 minutes, 15 minutes, 30 minutes, and 1 hour.

  • To add a test, check the Test included check box. The available test is AWS - Web You must configure at least one test to run the test on the application.

Custom Application

Configure the custom application parameters and tests:

  • Target domain - Enter the target domain url or IP address.

  • Target port - Enter the target port number.

  • Test interval - Select the test interval from the Test interval drop-down list. The test interval values are 1 minute, 2 minutes, 5 minutes, 10 minutes, 15 minutes, 30 minutes, and 1 hour.

  • Template name - Enter the AWS template name.

  • To add a test, check the Test included check box. The available test is Custom application - Network You must configure at least one test to run the test on the application. You can create a maximum of 10 custom applications.

Or

(Optional) If you want to skip setting up an application, select Continue without an application and click Next.

Step 4

In the Select Locations window, select the location from the location drop-down list and click Next.

Step 5

In the Select Switches, select the switch and configure the switch configuration, and proxy settings.

Step 6

In the Summary window, review the application monitoring settings and click Complete setup.


What to do next

You can now manage the enterprise agents and tests. See Manage Enterprise Agents and Tests.

Manage enterprise agents and tests

Use this procedure to manage all installed enterprise agents. You can uninstall, upgrade, start, stop, resync, assign test, or add new test on the manage agents page.

Before you begin

Ensure that you have installed ThousandEyes Enterprise agents and tests. To install agents and add tests, see Install ThousandEyes Enterprise Agents.

Procedure

Step 1

From the Catalyst Center home page, click the Assurance tab, and then choose Health > Applications.

The Applications page appears.

Step 2

From the ThousandEyes Enterprise Agent Tests table, click Manage Agents. The ThousandEyes Integration Enterprise Agents window appears. You can view only the switches and hubs where ThousandEyes is deployed.

The Global agent stats area displays the status of the running, stopped, failed, and in progress agents in the All Agents table.

Step 3

Use the Search Hierarchy search field or the filter icon to find a site, building, or area to view the agent and test information.

Step 4

Use the Enterprise Agents page to view this information:

Enterprise agents
Item Description

Global agent stats

Displays the number of running, stopped, failed, and in progress agents in the application.

All Agents table

Displays the agent's status, hostname, tests, test type and so on.

  • From the All Agents table, check the check box to select the agent name and do these tasks:

    • Uninstall

    • Upgrade

    • Start

    • Stop

    • Resync

    • Assign Test

    • Add New Test

  • In the All Agents table, click on the host name to open a slide-in pane, agents details tab displays the agents data such as resources, network and docker run time options. To download technical supports logs, click Tech Support Logs

  • Click Tests tab in the slide-in pane to view the test name, test type and interval and target values assigned to the added to the agent. To detach the tests from agent, check the check box near the test name column and click Detach from this agent.


Monitor the health of an application

Use this procedure to view details about a specific application.

Procedure


Step 1

From the main menu, choose Assurance > Health.

The Overall health dashboard appears.

Step 2

Click the Application tab.

The Application health dashboard appears.

Step 3

In the Application table, click the name of an application.

The Application 360 window appears, which provides a 360° view of the application.

Step 4

Click the time range setting () at the top-left corner to specify the time range for the data that you want displayed on the window:

  1. From the drop-down menu, select a time range: 3 hours, 24 hours, or 7 days.

  2. Specify the Start Date and time; and the End Date and time.

  3. Click Apply.

Step 5

To display application information for a particular location, select the location from the Location drop-down list.

Step 6

From the Filter drop-down list, select the SSID and click Apply to display the information for a particular SSID.

Step 7

Use the application health timeline slider to view the application's health score for a more granular time range and to view the application quality information.

Hover your cursor within the timeline to view this information:

Health Score: The health score at a specific time is displayed. Metrics that are color-code in the Quality area contribute to the health score.

Quality: The Quality information area displays information about latency, jitter, and packet loss. For latency, these aspects of delay between the client and the application appear:

  • LAN delay: The delay in milliseconds between the client and router.

  • WAN delay: The delay in milliseconds between the router and server.

  • Application delay: The delay in milliseconds between the server and the application.

Under Maintenance: When a device is under maintenance mode during the specific time period, the specific device name is displayed below the Under Maintenance banner.

You can click and drag the timeline boundary lines to specify the time range. This sets the context for the application data that is displayed in the Application 360 window.

Step 8

Use the Application Details area, below the timeline, to view this information:

Application details
Item Description

Health Score

The health score of an application is calculated based on the weighted average of the application's qualitative metrics, which include packet loss, network latency, and jitter.

Note


The health score is not available for Cisco Catalyst 9000 Series Switches and Cisco AireOS wireless controller. These devices do not poll the KPIs that are required to calculate a health score.

Time and Date range

Displays the time and date range for the data that is displayed in the Application 360 window.

Business Relevance

Traffic Class

Category

Displays the application's Next Generation Network-Based Application Recognition (NBAR) classifying information.

Issues tab

Click to view the list of issues.

Exporters tab

Click to view the list of devices that send NetFlow traffic to Catalyst Center and other details.

Step 9

Click Issues to view this information:

Issues

Displays any issues that must be addressed. Issues are listed based on the timestamp. The most recent issue is listed first.

Click an issue to open a slide-in pane to view the corresponding details, such as the description of the issue, impact, and suggested actions.

From the slide-in pane, you can do these tasks:

  • To resolve an issue:

    1. From the drop-down list, select Resolve.

    2. To view the list of issues that have been resolved, click Resolved Issues.

  • To ignore an issue:

    1. From the drop-down list, select Ignore.

    2. Set the number of hours to ignore the issue on the slider.

    3. Click Confirm.

    4. To view the list of issues that have been ignored, click Ignored Issues.

For information about the types of issues, see View and Manage Issues.

Step 10

Click Exporters to view this information:

Exporters
Item Description

Device

Displays the list of devices that is sending NetFlow traffic to Catalyst Center such as router, switch, wireless controller, and appliance.

Note


This warning message appears for the device under maintenance mode during specific time range:

The exporters with warning icon were in maintenance mode during the selected period of time.

Health Score

The last 5-minute health score. The health score is calculated on the basis of the application's qualitative metrics, which include packet loss, network latency, and jitter.

Note


The health score is not available for Cisco Catalyst 9000 Series Switches and Cisco AireOS wireless controller. These devices do not poll the KPIs that are required to calculate a health score.

Traffic Class

Displays the application's NBAR classifying information if available.

Go to Device 360

Click to open the Device 360 window for a specific device.

Step 11

To view metric charts:

  • For routers and appliances, click the exporter row to display charts (below the row) for these metrics: usage, average throughput, packet loss, jitter, and latency.

  • For switches and wireless controllers, click the device name to open a slide-in pane to view charts for these metrics: usage and average throughput.

    You can also click Device 360 in the slide-in pane to open the Device 360 window for a specific device.

Metric charts
Charts Description

Usage

The number of bytes transferred by the client for the particular application.

Throughput

The rate of the application traffic (in Mbps) flowing between the client and the server.

Packet Loss

The percentage (maximum and average) of packet loss.

Note


This metric is not available for switches and wireless controllers.

Latency

The network latency time (maximum and average) in milliseconds. These latency charts are available:

  • Network Latency

  • Client Network Latency

  • Server Network Latency

  • Application Network Latency

Note


This metric is not available for switches and wireless controllers.

Jitter

The variance in time delay in milliseconds (maximum and average) between data packets over your network.

Note


This metric is not available for switches and wireless controllers.

DSCP

  • Observed: The application's current DSCP value.

  • Expected: The default DSCP value assigned by NBAR.

Note


This metric is not available for Optimized APM.

Step 12

View the list of clients that are accessing the application in the Application Endpoint table (displayed after the metric charts).

Click the Managed Clients tab, if you want to view only the clients that are managed by Catalyst Center.

Details about each client is provided in the table, such as identifier (user ID, hostname, IP address, or MAC address, whichever is available in that order), client, client health, app health, usage, device type, MAC address, and VLAN ID.

For active clients, you can click the Identifier column to open the Client 360 window.

You can view up to 100 clients in this table. To view additional clients, click Show More.


Monitor and troubleshoot health of a Webex application

Use this procedure to view details about a Webex application.

Procedure


Step 1

From the main menu, choose Assurance > Health.

The Overall health dashboard appears.

Step 2

Click the Application tab.

The Application health dashboard appears.

Step 3

In the Application table, click the Webex application.

The Webex 360 window appears, which provides a 360° view of the application.

Figure 2. Webex 360 window
Figure 15: Webex 360, with activity.

Step 4

Use the Summary dashlet to view the total number of data usage, average throughput, and active clients in your overall network, or selected site.

Step 5

Click the time range setting () at the top-left corner to specify the time range for the application data that you want displayed on the window:

  1. From the drop-down menu, select a time range: 3 hours, 24 hours, or 7 days.

  2. Specify the Start Date and time; and the End Date and time.

  3. Click Apply.

Step 6

To display application information for a particular location, select the location from the Location drop-down list.

Step 7

Use the application health timeline slider to view the application's health score for a more granular time range, sub applications, the network quality and application quality information.

Hover your cursor within the timeline to view the health score at a specific time.

Step 8

Use the Application Details area, below the timeline, to view this information:

Application details
Item Description

Health Score

The health score of an application is calculated based on the weighted average of the application's qualitative metrics, which include packet loss, network latency, and jitter.

Time and Date range

Displays the time and date range for the data that is displayed in the Webex 360 window.

Business Relevance

Traffic Class

Category

Displays the application's Next Generation Network-Based Application Recognition (NBAR) classifying information.

Issues category

Click to view the list of issues.

Meeting Analytics

Click to view the Meeting Analytics data.

Exporters tab

Click to view the list of devices that send NetFlow traffic to Catalyst Center and other details.

Step 9

You can view information about issues from the Issues category:

  1. Click an issue to open a slide-in pane to view the corresponding details, such as description of the issue, impact, and suggested actions.

  2. From the slide-in pane, you can do these tasks:

  • To resolve an issue:
    1. From the Status drop-down list, select Resolve.

    2. Click Resolved Issues to view the list of issues that are resolved.

  • To ignore an issue:
    1. From the Status drop-down list, select Ignore.

    2. Set the number of hours to ignore the issue on the slider.

    3. Click Confirm.

For information about issues, see View and Manage Issues.

Step 10

Use the Meeting Analytics dashlets for this functionality:

Worst endpoints by poor meeting minutes

Click Latest and Trend chart to view the status of worst endpoints by poor meeting minutes. You can filter the data based on By Percentage or By Total Poor Minutes.

Usage health by traffic type

Click Latest to view the chart to view usage health based on the traffic type for Audio, Sharing, and Video.

Click Trend to view the chart displays usage health based on the traffic type for Audio, Sharing, and Video.

You can hover on a color segment in the chart to view the percentage of health.

Step 11

Click Exporters to view this information:

Exporters
Item Description

Device

Displays the list of devices that is sending NetFlow traffic to Catalyst Center such as router, switch, wireless controller, and appliance.

Note


This warning message appears for the device under maintenance mode during specific time range:

The exporters with warning icon were in maintenance mode during the selected period of time.

Health Score

The last 5-minute health score. The health score is calculated on the basis of the application's qualitative metrics, which include packet loss, network latency, and jitter.

Note


The health score is not available for Cisco Catalyst 9000 Series Switches and Cisco AireOS wireless controller. These devices do not poll the KPIs that are required to calculate a health score.

Traffic Class

Displays the application's NBAR classifying information if available.

Go to Device 360

Click to open the Device 360 window for a specific device.

Step 12

To view metric charts for audio, video and sharing:

Metric charts
Charts Description

Usage

The number of bytes transferred by the client for the particular application.

Throughput

The rate of the application traffic (in Mbps) flowing between the client and the server. You can hover your cursor over chart to view the throughput value for audio, video, and sharing.

Packet Loss

The percentage (maximum and average) of packet loss.

Note


This metric is not available for switches and wireless controllers.

Latency

The network latency time (maximum and average) in milliseconds. These latency charts are available:

  • Network Latency

  • Client Network Latency

  • Server Network Latency

  • Application Network Latency

Note


This metric is not available for switches and wireless controllers.

Jitter

The variance in time delay in milliseconds (maximum and average) between data packets over your network.

Note


This metric is not available for switches and wireless controllers.

Step 13

View the list of clients that are accessing the application in the Application Endpoint table (displayed after the metric charts).

Details about each client is provided in the table, such as identifier (user ID, hostname, IP address, or MAC address, whichever is available in that order), client, client health, app health, usage, device type, MAC address, and VLAN ID.

For active clients, you can click the Identifier column to open the Client 360 window.

You can view up to 100 clients in this table. To view additional clients, click Show More.


Monitor and troubleshoot the health of a Microsoft Teams application

Use this procedure to view details about a Microsoft Teams application.

Procedure


Step 1

From the main menu, choose Assurance > Health.

The Overall health dashboard is displayed.

Step 2

Click the Application tab.

The Application health dashboard appears.

Step 3

In the Application table, click a microsoft-teams application.

An MS Teams 360 window appears, which provides a 360° view of an application.

Figure 3. MS Teams 360 window
Figure 16: Microsoft-teams dashboard, displaying data.

Step 4

Use the Summary dashlet to view the total number of data usage, average throughput, active clients, good minutes, fair minutes, and poor minutes in your overall network or selected site.

Step 5

In the top-left corner, click the time range setting () to specify the time range for the application data that you want to be displayed on the window.

  1. From the drop-down menu, select a time range: 3 hours, 24 hours, or 7 days.

  2. Specify the Start Date and time and the End Date and time.

  3. Click Apply.

Note


By default, selected site and time range in the Application dashboard is displayed in an MS Teams 360.

Step 6

Use the application health timeline slider to view the Throughput, Total Minutes, and Network APM Score.

Hover your cursor in the timeline to view the health score at a specific time.

Note


Network APM score is a health score, which is calculated based on NetFlow exported from the managed network devices. For more information regarding APM, see Supported platforms.

Step 7

Use the Application Details area, below the timeline, to view this information:

Application details
Item Description

Time and Date range

Displays the time and date range for the data that is displayed in the MS Teams 360 window.

Health

Displays the health score of Audio, Video, and Sharing.

Quantity

Displays Throughput data.

MS Teams Meeting Minutes

Displays information about Good, Fair, and Poor minutes.

Business Relevance

Traffic Class

Category

Displays the application's next generation Network-Based Application Recognition (NBAR) classifying information.

Issues category

Click to view the list of issues.

Meeting Analytics

Click to view the Meeting Analytics data.

Exporters tab

Click to view the list of devices that send NetFlow traffic to Catalyst Center and other details.

Step 8

You can view information about issues from the Issues category:

  1. Click an issue to open a slide-in pane to view the corresponding details, such as a description of the issue, impact, and suggested actions.

  2. From the slide-in pane, you can do these tasks:

  • To resolve an issue:
    1. From the Status drop-down list, select Resolve.

    2. Click Resolved Issues to view the list of issues that are resolved.

  • To ignore an issue:
    1. From the Status drop-down list, select Ignore.

    2. Set the number of hours to ignore the issue on the slider.

    3. Click Confirm.

For information about issues, see View and Manage Issues.

Step 9

Use the Meeting Analytics dashlets for this functionality:

Meeting analytics
Item Description

Top Access Devices

Click the Latest and Trend charts to view the status of top access devices by good and poor minutes.

You can filter the data based on By Poor Meeting Minutes, By Total Meeting Minutes, By Total Usage, and By Poor Network APM Score.

Top Endpoints

Click the Latest and Trend charts to view the status of top endpoints by good and poor minutes.

You can filter the data based on By Poor Meeting Minutes, By Total Meeting Minutes, By Total Usage, and By Poor Network APM Score.

Step 10

Click Exporters to view this information:

Exporters
Item Description

Device

Displays the devices that are sending NetFlow traffic to Catalyst Center.

Note


This warning message is displayed for the device under maintenance mode during a specific time range:

The exporters with warning icon were in maintenance mode during the selected period of time.

Health Score

The last 5-minute health score. The health score is calculated based on the application's qualitative metrics, which include packet loss, network latency, and jitter.

Note


The health score is not available for Cisco Catalyst 9000 Series Switches and Cisco AireOS wireless controller. These devices do not poll the KPIs that are required to calculate a health score.

Traffic Class

Displays the application's NBAR classifying information, if available.

Step 11

To view metric charts for audio, video, and sharing:

Metric charts
Charts Description

Usage

The number of bytes transferred by the client for the particular application.

Throughput

The rate of the application traffic (in Mbps) flowing between the client and the server. You can hover your cursor over the chart to view the throughput value for audio, video, and sharing.

Packet Loss

The percentage (maximum and average) of packet loss.

Note


This metric is not available for switches and wireless controllers.

Jitter

The variance in time delay in milliseconds (maximum and average) between data packets over your network.

Note


This metric is not available for switches and wireless controllers.

Step 12

View the list of clients that are accessing the application in the Application Endpoint table (displayed after the metric charts).

The table shows details about each client, such as identifier (user ID, hostname, IP address, or MAC address), client health, Network APM score, Microsoft Teams Score, usage, device type, MAC address, and VLAN ID.

For active clients, click the Identifier column to open the Client 360 window.

You can view up to 100 clients in this table. To view additional clients, click Show More.


Configure health score settings for applications

Use this procedure to configure the health score settings for applications. You can customize the health score calculation for applications by changing the KPI thresholds on a per-traffic class basis and specifying the KPIs that are included for the calculation.

Procedure


Step 1

From the main menu, choose Assurance > Settings > Health Score Settings.

Step 2

Click the Application Health tab.

Step 3

Click the tab of the application category to customize its health score calculation settings.

The tab displays the KPIs that affect the health score calculation of the application.

Step 4

From the KPI Name column, click the KPI name link.

The slide-in pane for the KPI appears.

Step 5

Configure the KPI health score settings:

  1. Customize the KPI threshold value for Poor, Fair, and Good health score.

  2. Weight: Valid weights are between 1–10. The higher the weight is, the KPI has more impact on the application health.

  3. Check Include for health score check box if you want this KPI to be included in the health score calculation.

  4. Click Reset to Default to restore the default KPI settings.

Step 6

Click Apply.


Understand application health score and KPI metrics

This section provides information about how the overall and individual application health scores and KPI metrics are computed.

Overall application health score

The application health score is the percentage of the number of healthy business-relevant applications (a health score from 8 to 10), divided by the total number of business relevant applications. The score is calculated over the latest 5-minute interval.

Example: 90% (health score) = 90 (business-relevant applications with a health score from 8 to 10) ÷ 100 (total number of business-relevant applications)

Individual application health score

The individual application health score is calculated based on the weighted average of the application's qualitative metrics, which include packet loss, network latency, and jitter.

The individual application health is measured on a scale of 1 to 10, with 10 being the best score. This formula is used to calculate the individual application health score:

Individual application health score = (Latency_Weight * Latency_VoS_Score + Jitter_Weight * Jitter_VoS_Score + PacketLoss_Weight * PacketLoss_VoS_Score) ÷ (Latency_Weight + Jitter_Weight + PacketLoss_Weight)


Note


The health score is not available for Cisco Catalyst 9000 Series Switches and Cisco AireOS Wireless Controller. These devices do not poll the KPIs that are required to calculate a health score.


The workflow for calculating the individual application health score includes:

  1. Obtain the KPIs: Jitter, Latency, and Packet Loss.

  2. Determine the application's Traffic Class based on the DSCP value from the flow record.

  3. Convert the KPI numbers into Validation of Service score (VoS score) using the Cisco Validated Design (CVD) thresholds for each Traffic Class and KPI metric.

  4. Get the weightage of the KPIs based on the application's Traffic Class and Tolerance level. The weightage is based on RFC4594.

  5. Calculate the application health score. This is the weighted average of packet loss, network latency, and jitter.