Configure Verify Troubleshoot Intel Analytics on 9800 Series WC
Available Languages
Contents
Introduction
This document describes the configuration and operation of the Intel Connectivity Analytics feature on a 9800 Series Wireless Controller.
Background Information
As an aspect of Cisco Enterprise Wireless Device Analytics feature, Intel Wi-Fi adapters can now send diagnostic information to 9800 series controllers, such as:
- Client device information, including:
- PC manufacturer/model
- OS version, adapter driver version
- RF environment information, including RSSI of the associated Access Point (AP), and of neighbor APs
Prerequisites
- 9800 Series Wireless Controller
- Aironet/Catalyst/Cisco Wireless Wave 2 / Wi-Fi 6/6E/7 APs
- Intel Wi-Fi adapter (AC9560, AX200, AX201, AX210, or later)
Requirements
- 9800 WC must have Cisco IOS XE® 17.6.1 or later installed
- The Intel Wi-Fi adapter must have 22.50 or later driver installed
- The WLAN must have Protected Management Frames (PMF) enabled or optional
- The client must be configured to use either the native Windows supplicant or AnyConnect NAM
- If using NAM, see Cisco bug ID CSCwc57807 for the minimum NAM and Windows versions necessary to work with PMF
Components Used
In this lab setup:
- 9800-L-C running 17.6.3
- AP4800, C9105, C9120, C9130
- Lenovo X1 Carbon Gen 9 PC running Windows 11, with Intel AX201 adapter with 22.150 driver
The information in this document was created from the devices in a specific lab environment. All of the devices used in this document started with a cleared (default) configuration. If your network is live, ensure that you understand the potential impact of any command.
Configure
9800 CLI
1. Enable network assurance.
9800-L#configure terminal
Enter configuration commands, one per line. End with CNTL/Z.
9800-L(config)#network-assurance enable
2. Enable device classifier.
9800-L(config)#device classifier
3. Enable device analytics on each WLAN.

Note: "device-analytics" and "device analytics pc-analytics" are enabled by default and "device-analytics export" is optional. Also enable optional or mandatory PMF (which can impact client connectivity and/or performance.)
9800-L(config)#wlan TUCSONLAB 1 TUCSONLAB
9800-L(config-wlan)#shutdown
9800-L(config-wlan)#device-analytics
9800-L(config-wlan)#device-analytics pc-analytics
9800-L(config-wlan)#device-analytics export     # optional
9800-L(config-wlan)#security pmf optional       # or "mandatory"
9800-L(config-wlan)#no shutdown
9800 GUI
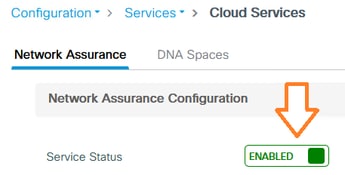
1. Enable network assurance.
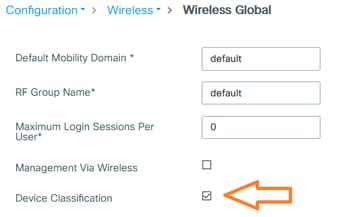
2. Enable device classification.
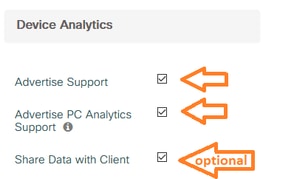
3. For each WLAN, under Advanced > Device Analytics, enable Device Analytics support, PC Analytics support and (optionally) Share Data with Client.
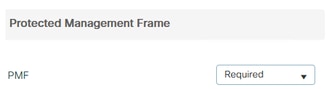
4. For each WLAN, set PMF to Optional or Required, this can impact client connectivity and/or performance.
Verify
Associate the Intel client to the wireless network.
9800 CLI
1. View the STA INFO report for the client MAC address:
9800-L#show device classifier mac-address 36da.2624.f622 detail
Client Mac: 36da.2624.f622
Device Type: LENOVO 20XXS3JC01
Confidence Level: 40
Day Zero Classification: LENOVO
Device Name: Unknown Device
Software Version: 22.150.00.03
Device OS: Windows 10
Device Vendor: Intel
Power Type: AC Powered
Hardware Model: AX201 160MHz
2. View the PC Analytics info from the client. The PC Analytics data shown in the next example is not populated until 5 minutes after the initial association. Cisco bug ID CSCwp19148 addresses this limitation.
9800-L#show wireless client mac-address 36da.2624.f622 stats pc-analytics
-------------------------
Neighbor APs Info:
-------------------------
Reported time:: 08/02/2022 22:40:39
-------------------------
Roaming Reasons:
-------------------------
Selected AP RSSI:: -55
Candidate BSSIDs:
-----------------
Neighbor AP                      RSSI(dB)
683b.78aa.230e                   -62
04eb.409f.0d6e                   -55
3c41.0e3b.0d6e                   -64
-------------------------
Failed AP Report:
-------------------------
Last Reported Time:: 08/02/2022 22:40:39
APs with Invalid IEs: None
APs not sending response:
-------------------------
BSSID                            Frame Type
084f.f983.4a4e                   Authentication Response
04eb.409f.0d6e                   Other Frame types
-------------------------
PC Analytics report stats
-------------------------
----------------------------------------------------------------------
    Report Type            Processed Reports          Dropped Reports
----------------------------------------------------------------------

    STA Info                      1                             0
    Neigh AP                      1                             0
    Low RSSI                      0                             0
    Beacon Miss                   0                             0
    Failed AP                     1                             0
    Unknown APs                   0                             0
9800 GUI
1. View the STA INFO report, in Monitoring > Wireless > Clients > client MAC:
2. Under the 360 View tab: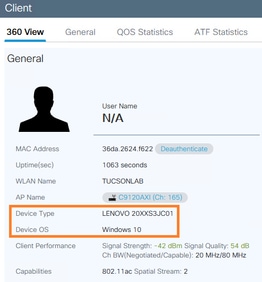
3. Under the General > Client Properties tab: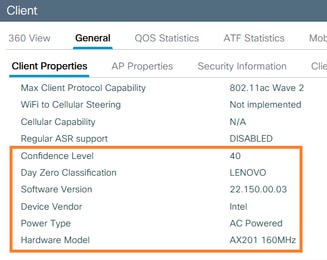
4. Under the General > Client Statistics tab (statistics viewable 5 minutes after the initial client association):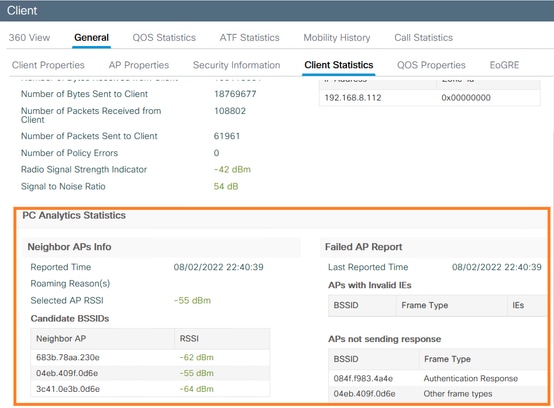
Troubleshoot
You can collect any of these:
- Client debugs from the AP
- Client RA traces from the 9800
- Over the Air (OTA) packet capture
- EPC from the 9800, filtered on client MAC
These examples show a working case (use the Windows supplicant) and a non-working case (using AnyConnect NAM):
RA Traces
Enable the RA Traces on the 9800
debug wireless mac 38:87:D5:09:33:EB internal monitor-time 2085978494
(have the client under test associate to the AP)
Turn off RA Traces and Copy to TFTP Server
no debug wireless mac 38:87:D5:09:33:EB internal monitor-time 2085978494
(locate the latest ra_trace file)
dir bootflash: | include ra_trace
copy bootflash:ra_trace_MAC_38:87:d5:09:33:eb_211303_UTC_Fri_Aug_05_2022.log tftp://192.168.10.2/ra_trace.log
If PC Analytics is working with the Intel client, then the RA Traces can show the feature parsing the data from the received action frame:
2022/08/05 21:12:14.083830 {wncd_x_R0-0}{1}: [client-orch-sm] [24548]: (debug): MAC: 3887.d509.33eb IEEE802.11 protected action frame processing
2022/08/05 21:12:14.083831 {wncd_x_R0-0}{1}: [dot11-validate] [24548]: (debug): MAC: 3887.d509.33eb Dot11 vendor specific protected action frame received
2022/08/05 21:12:14.083836 {wncd_x_R0-0}{1}: [dot11-validate] [24548]: (debug): MAC: 3887.d509.33eb PC analytics support enabledParse the vendor specific protected action frame
You can see data as reported, for example the driver version:
2022/08/05 21:12:14.083917 {wncd_x_R0-0}{1}: [dot11-validate] [24548]: (debug): PC-Analytics SW Version = 16960003 22.150.00.03
Embedded Packet Capture
Start EPC on the 9800
monitor capture MYCAP clear
monitor capture MYCAP interface Ten0/1/0 both
monitor capture MYCAP buffer size 100
monitor capture MYCAP match any
monitor capture MYCAP inner mac 38:87:D5:09:33:EB
monitor capture MYCAP start
(have the client under test associate to the AP)
Stop EPC and export to TFTP server
monitor capture MYCAP stop
monitor capture MYCAP export tftp://192.168.10.2/MYCAP.pcap
no monitor capture MYCAP
What to Look for in the EPC
In Wireshark, look for an action frame (wlan.fc.type_subtype == 0x000d) whose Category Code is "Vendor-specified Protected" (wlan.fixed.category_code == 126). The payload can show the PC make/model in ASCII:

Client Debugs on AP
Start debugs
terminal monitor
debug client 38:87:D5:09:33:EB
(have the client under test associate to the AP)
Stop Debugs
undebug all
terminal monitor disable
What to Look for in the AP Debugs
Look for an INTEL_DEO_ANALYTICS line, as the AP parses an incoming ACTION frame from the client, for example:
Aug 5 21:12:13 kernel: [*08/05/2022 21:12:13.0674] [1659733933: 67444] [AP4800] [38:87:d5:09:33:eb] <apr1v1> [U:W] DOT11_ACTION : Category Code: 23, Action Code: 53
Aug 5 21:12:13 kernel: [*08/05/2022 21:12:13.0675] CLSM[38:87:D5:09:33:EB]: US Action(d0) seq 1744 IF 30 slot 1 vap 1 len 93 state FWD
Aug 5 21:12:13 kernel: [*08/05/2022 21:12:13.0676] CLSM[38:87:D5:09:33:EB]: INTEL_DEO_ANALYTICS: Total Frames Received: 1, Type: ef, SubType: 2, MessageID: 2
OTA Packet Capture
In this example, a MacBook running Wireless Diagnostics was used, refer to the Collect Packet Captures Over the Air on a MacBook document. You can see the client sending one or more ACTION frames that are CCMP protected (wlan.ccmp.extiv && wlan.fc.type_subtype == 0x000d.) As these frames are encrypted, you cannot read the payload (look to the EPC, or a span from the APs switchport.)
If the client is not sending CCMP-protected management frames, ensure PMF is set to optional or mandatory.
To verify the 9800 WC is correctly configured to advertise Intel Analytics, look at the beacon frame or probe response. Find a vendor specific tag with the Cisco OUI (00:40:96 - such as, wlan.tag.oui == 0x004096.) The next octet (in the Vendor Specific OUI Type field) has a value of 0x2c, this is the DEO_IE. The octet is bit-encoded; its fourth-least-significant bit is the Intel Analytics bit.
Intel Adapter Driver Version Note
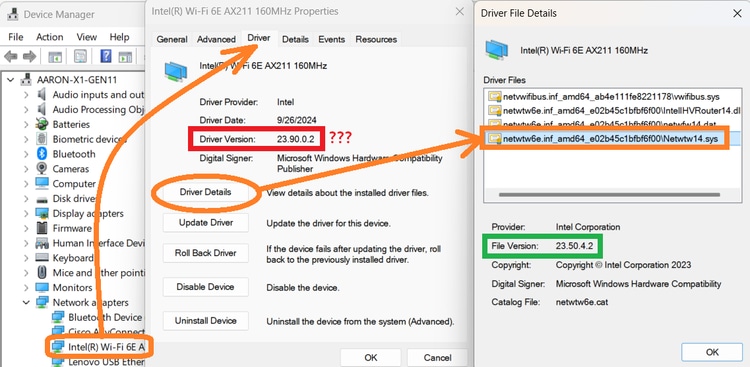
Beginning with the 23.50.0 Intel driver bundle, all supported adapters apparently have the same 23.x driver version (as seen in Windows Device Manager.) Depending on the adapter model and host CPU, a different internal driver version (this is reported to Intel Analytics) can be in use. For example, the AX211 driver from the 23.90.0 bundle running on an Intel Core i7 13th Gen has an "outer" driver version of 23.90.0.2; however, once you drill into the driver details, the "inner" driver version turns out to be 23.50.4.2.
Revision History
| Revision | Publish Date | Comments |
|---|---|---|
4.0 |
02-Sep-2026
|
Updated recert, spelling/grammar, title, intro, inserted horizontal lines to separate sections for readability, alt text, and fixed CCW alerts. |
3.0 |
21-May-2025
|
Note the 5-minute delay in reporting analytics details. |
2.0 |
03-Apr-2025
|
Explain Intel adapter driver versions |
1.0 |
27-Nov-2024
|
Initial Release |

 Feedback
Contact Cisco
- Open a Support Case

- (Requires a Cisco Service Contract)
This Document Applies to These Products
- Aironet 1800 Access Points
- Aironet 1815 Series Access Points
- Aironet 1830 Series Access Points
- Aironet 1840 Series Access Points
- Aironet 1850 Series Access Points
- Aironet 2800 Series Access Points
- Aironet 3800 Series Access Points
- Aironet 4800 Access Points
- Catalyst 9100 Access Points
- Catalyst 9105AX Series Access Points
- Catalyst 9115AX Series Access Points
- Catalyst 9117AX Series Access Points
- Catalyst 9120AX Series Access Points
- Catalyst 9130AX Series Access Points
- Catalyst 9136 Series Access Points
- Catalyst 9162 Series Access Points
- Catalyst 9164 Series Access Points
- Catalyst 9166 Series Access Points
- Catalyst 9800 Series Wireless Controllers
- Catalyst 9800 Wireless Controllers for Cloud
- Embedded Wireless Controller on Catalyst Access Points
- Wireless 9172 Series Access Points
- Wireless 9176 Series Access Points
- Wireless 9178 Series Access Points
- Wireless LAN Controller Software