Collect Logs and Debugs from Catalyst 9800 WLC
Available Languages
Contents
Introduction
This document describes steps to collect important debugs or show commands from Catalyst 9800 Wireless LAN Controllers (WLC).
Prerequisite
Requirement
Cisco recommends that you have knowledge of this topic:
- Basic understanding of Catalyst 9800 Wireless LAN Controllers (WLC)
Components Used
The information in this document is based on these software and hardware versions:
- Catalyst 9800 WLC
The information in this document was created from the devices in a specific lab environment. All of the devices used in this document started with a cleared (default) configuration. If your network is live, ensure that you understand the potential impact of any command.
Background Information
This document describes steps to collect important debugs or show commands from Catalyst 9800 Wireless LAN Controllers (WLC).
Logs to be Collected on Any WLC Issue
- Document exact and detailed problem description:
Provide information about the WLC platform, version of code, number of APs/clients impacted, SSIDs where the issue is seen, and issues observed.
Example: 9800-40 in HA with software version 16.12.3 guest clients not able to connect to SSID ACME_CORP_GUEST, 500 APs, and 200 clients impacted.
- AP details/Client details: Make, MAC Address, Model, OS version, WLAN Adapter Version.
Provide one concrete example of client/AP when it does not work with the MAC address of the AP/Client, model, software version, and WLAN adapter driver version. Ensure that this is AP/Client used to collect outputs and debugs.
Example: Issue is seen in AP AP02_ACME 9120AXI where client fails to connect Intel AX200 client MAC@ aaaa.bbbb.cccc with driver version 10.21.0.5
- Timestamps of the issue. Frequency of the issue:
When did the issue start? How often does the issue occur? Is the issue consistently observed?
Provide concrete timestamps of the issue seen when you collect data.
Example: The issue is consistently seen every time client tries to connect. The issue started to occur on 16/0/4/2020 after upgrade to 16.12.3.
- Working vs non-working/changes / Trigger:
Was this working fine before? If it was working fine, what changes occurred that could trigger the issue? Is it reproducible? What are the steps done to reproduce it? Provide details about what is working and what is not working.
Example: It was working fine in 16.12.2s, the issue started to occur in 16.12.3. The issue is consistently reproducible when you connect any client to ACME_CORP_GUEST. Other SSIDs are working fine, the same client is able to connect to other SSID in the same AP.
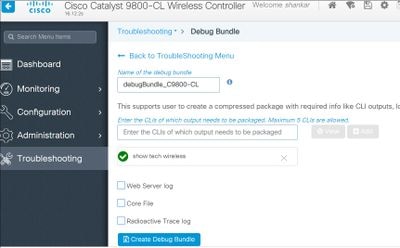
- From Catalyst 9800 CLI, collect output of:
WLC-9800-CLI# show tech wireless
Alternatively, you can collect the same output via GUI. Navigate to Troubleshooting>Debug Bundle menu:
Advanced Information on AP/Client Debugs from 9800 WLC
Some of the debugging functions available in Catalyst 9800 WLC are summarized in this document Understand Wireless Debugs and Log Collection on Catalyst 9800 Wireless LAN Controllers. This guide provides a detailed explanation of the purpose and use of these debugs.
Always-on-tracing
show logging profile wireless filter mac <radio-or-ethernet-AP-mac> to-file always-on-<FILENAME.txt>
RadioActive Tracing
debug wireless mac <MAC> [internal]
!!Reproduce
no debug wireless mac <MAC> [internal]
!! Provide ra_trace file generated in bootflash:
dir bootflash: | i ra_trace
Embedded Packet Capture
Packet Capture Filtered on AP IP
ip access-list extended CAP-FILTER
 permit ip host <AP_IP> any
 permit ip any host <AP_IP>

monitor capture MYCAP clear
monitor capture MYCAP interface Po1 both
monitor capture MYCAP buffer size 100
monitor capture MYCAP match any
monitor capture MYCAP access-list CAP-FILTER
monitor capture MYCAP start
!!Reproduce
monitor capture MYCAP stop
monitor capture MYCAP export flash:|tftp:|http:.../filename.pcap
Packet Capture Filtered on Client MAC (available after Cisco IOS® XE 17.1.1s)
monitor capture MYCAP clear
monitor capture MYCAP interface Po1 both
monitor capture MYCAP buffer size 100
monitor capture MYCAP match any
monitor capture MYCAP inner mac <Client_MAC>
monitor capture MYCAP start
!!Reproduce
monitor capture MYCAP stop
monitor capture MYCAP export flash:|tftp:|http:.../filename.pcap
Verify
show monitor capture MYCAP
show monitor capture MYCAP buffer brief/detail/dump
Scenario Specific Log Collection
WLC Platform Issues
This scenario covers WLC instability due to WLC reloads, switchovers, crashes, high CPU, memory issues.
Outputs to check key performance indicators (KPIs) to identify if there could be WLC platform issues.
Check for uptime lower than expected, high CPU utilization or WLC crashes.
show ver | i uptime
show redundancy | i Uptime
show proc cpu sorted | i CPU
dir all | i core
Additional logs to collect for WLC platform issues:
Collect crashes/coredumps system-reports/AP crashes. This can be done via GUI. Navigate to Troubleshooting > CoreDump and System Report.

Or via CLI:
# more bootflash:system-report*
# copy bootflash:system-report-YYYYMMDD-HHMMSS-Timezone.tar.gz {tftp: | ftp: | https: ..}

OR

# more harddisk:system-report*
# copy harddisk:system-report-YYYYMMDD-HHMMSS-Timezone.tar.gz {tftp: | ftp: | https: ..}
Also, collect these outputs:
show proc cpu platform sorted 1min
show proc mem platform accounting
show redundancy switchover history
show redundancy history
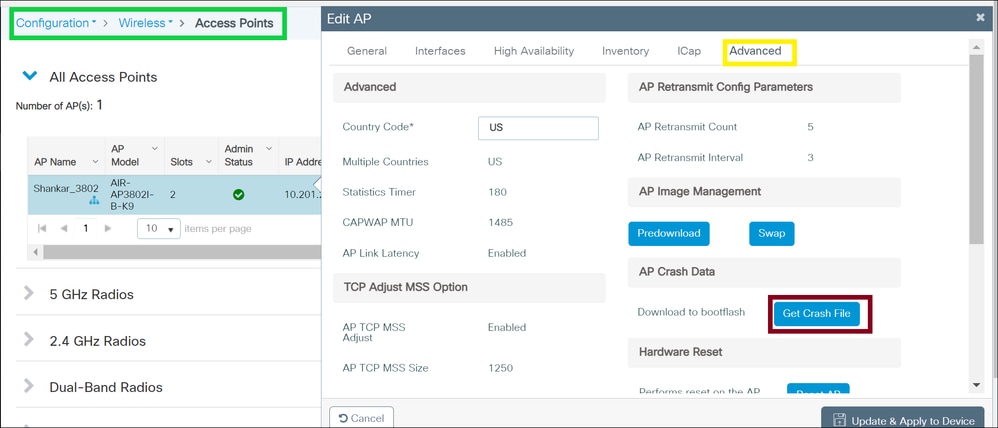
For any AP crashes, you can collect the AP crash files from WLC GUI > Configuration > Wireless > Access Points. Click relevant AP > Advanced tab.
AP Join/Connectivity Issues
This scenario covers AP instability due to APs not having been able to join WLC, AP disconnections, CAPWAP tunnel flaps, AP crashes.
Outputs to check key performance indicators to identify if there could be AP issues:
Check for AP crashes, and for APs with an uptime lower than expected, check for APs that have association uptime lower than expected.
show ap uptime
show ap crash-file
dir all | i crash
Additional logs to collect for AP issues:
Always-On Tracing:
show logging profile wireless filter mac <radio-or-ethernet-AP-mac> to-file always-on-<FILENAME.txt>
RadioActive Tracing:
debug wireless mac <AP_Radio_MAC>
debug wireless ip <AP_IP>
Embedded Captures filtered by AP IP address ACL
ip access-list extended CAP-FILTER
 permit ip host <AP_IP> any
 permit ip any host <AP_IP>

monitor capture MYCAP clear
monitor capture MYCAP interface Po1 both
monitor capture MYCAP buffer size 100
monitor capture MYCAP match any
monitor capture MYCAP access-list CAP-FILTER
monitor capture MYCAP start
!!Reproduce
monitor capture MYCAP stop
monitor capture MYCAP export flash:|tftp:|http:.../filename.pcap

show wireless stats ap discovery
show wireless stats ap join summary
show wireless stats ap history
show tech-support wireless ap
show tech-support wireless ap name <ap-name>
Client Connectivity Issues
This scenario covers client connectivity issues, association issues, authentication issues, disconnections, and roam issues.
Outputs to check KPIs to identify if there could be client connectivity issues:
Check for client delete reasons, identify top delete reason, and see if counters increase.
show wireless stats client delete reasons | ex 0
Additional logs to collect for client connectivity issues.
Always-On Tracing:
show logging profile wireless filter mac <Client_MAC> to-file always-on-<FILENAME.txt>
RadioActive Tracing:
debug wireless mac <Client_MAC>
Embedded Captures filtered by client MAC:
monitor capture MYCAP clear
monitor capture MYCAP interface Po1 both
monitor capture MYCAP buffer size 100
monitor capture MYCAP match any
monitor capture MYCAP inner mac <Client_MAC>
monitor capture MYCAP start
!!Reproduce
monitor capture MYCAP stop
monitor capture MYCAP export flash:|tftp:|http:.../filename.pcap

show wireless stats client summary | i MAC|<Client_MAC>
show tech-support wireless client
show tech-support wireless client mac-address <Client_MAC>
Guest Central Web Authentication (CWA) or Local Web Authentication (LWA) Issues
This scenario covers guest client web authentication issues; client does not receive redirect URL, or not able to authenticate.
Outputs to check KPIs to identify if there could be web authentication issues:
Check for clients stuck in webauth state, check the number of intercepted request, received messages and replied error status replies.
show wireless client summary | i Webauth|Number
show wireless stats client detail | i HTTP
Additional logs to collect for web authentication issues:
Always-On Tracing:
show logging profile wireless filter mac <rClient_MAC> to-file always-on-<FILENAME.txt>
RadioActive Tracing:
debug wireless mac <Client_MAC>
Embedded Captures filtered by client MAC:
monitor capture MYCAP clear
monitor capture MYCAP interface Po1 both
monitor capture MYCAP buffer size 100
monitor capture MYCAP match any
monitor capture MYCAP inner mac <Client_MAC>
monitor capture MYCAP start
!!Reproduce
monitor capture MYCAP stop
monitor capture MYCAP export flash:|tftp:|http:.../filename.pcap
show wireless stats client summary | i <Client_MAC>
show wireless stats client delete reasons
show tech wireless client mac-address <Client_MAC>
!!Client WLAN Adapter wireshark captures or Over The Air(OTA) sniffer trace.
show ip http server all
show tcp statistics
show ip traffic
show ip access-list
show tech-support wireless client
show tech-support wireless client mac-address <Client_MAC>
Radio Frequency (RF) or Radio Resource Management (RRM) Issues
Outputs to check KPIs to identify if there could be RF or RRM issues:
Check for APs with the same channel, max transmit power, high channel count or high channel utilization. For more detailed RF analysis use config analyzer.
show ap dot11 [24ghz|5ghz] summary
sh ap auto-rf dot11 [24ghz|5ghz] | i Channel Change Count|Channel Utilization
Additional logs to collect for RF and RRM issues:
set platform software trace wireless chassis active r0 rrm all info
!!Debug txpower logs:
set platform software trace wncd chassis active r0 radio-history-txpower info
!!Debug channel changes logs:
set platform software trace wncd chassis active r0 radio-history-channel info
!!Debug radio resets
set platform software trace wncd chassis active r0 radio-history-reset info
!!Debug DFS events
set platform software trace wncd chassis active r0 radio-history-dfs info
!!Collect and decode traces:
show logging profile wireless internal [to-file <file-name>]
!!Change level back to notice:
set platform software trace wncd chassis active R0 all-modules notice
set platform software trace wireless chassis active R0 rrm all notice
License Issues
Outputs to check KPIs to identify if there could be license issue:
Confirm that WLC is shown as registered, and number of APs licensed matches the number of APs.
show license summary | i Status:|AP
sh ap sum | i Number of APs
Additional logs to collect for license issues:
show tech-support license
show logging process ios start last boot to-file bootflash: <file-name>
High Availability Issues
Outputs to check KPIs to identify if there could be any High Availability issue.
Check uptime for redundancy peers, and if there is any redundancy event:
show redundancy | i ptime
sh log | i REDUNDANCY
Additional logs to collect for High Availability issues:
show redundancy states
show redundancy counters
show redundancy switchover history
sh logging onboard uptime !!just for physical WLCs: 9800-40/9800-80/9800-L
show chassis ha-status active
show chassis ha-status standby
sh platform software stack-mgr chassis active R0 sdp-counters
sh platform software stack-mgr chassis standby R0 sdp-counters
sh platform software stack-mgr chassis active R0 peer-timeout
sh platform software stack-mgr chassis standby R0 peer-timeout
Web User Interface or GUI Issues
- Exact screen capture of the error/issue and reproduction steps.
- Web Browser - Name (Firefox, Chrome, and so on,) Browser Version.
- Frontend HTTP Archive Format (HAR) file. The steps are mentioned Generate a HAR File to Troubleshoot.
- Frontend console logs. This can be exported out with the steps in Gather Chrome Console Logs.
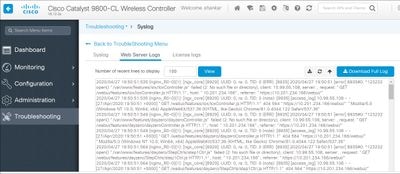
- Backend Webserver logs. Download from webUI Troubleshooting > Logs > Web Server Logs.
Related Information
Revision History
| Revision | Publish Date | Comments |
|---|---|---|
8.0 |
17-Aug-2026
|
Updated Formatting. |
7.0 |
23-Apr-2025
|
Updated Grammar and Formatting. |
6.0 |
12-Apr-2024
|
Recertification |
5.0 |
24-Mar-2023
|
Correct CCW alerts, correct formatting. Recertification. |
4.0 |
23-Feb-2022
|
minor formatting changes and title change |
3.0 |
18-Feb-2022
|
minor changes |
2.0 |
17-Feb-2022
|
fixed minor mistakes |
1.0 |
13-May-2020
|
Initial Release |

 Feedback
Contact Cisco
- Open a Support Case

- (Requires a Cisco Service Contract)