Anomalies and Threats not Generating after Failover in User Behavior Analytics (UBA)
Available Languages
Applicability
UBA 5.4.1Description
After performing a failover in Splunk UBA, anomalies and threats stop being generated despite datasources continuing to ingest data. The UBA UI may show that models are not running, and the system diagnostics page indicates no recent anomaly creation. This issue prevents UBA from detecting security threats and behavioral anomalies, significantly impacting the effectiveness of the security monitoring capabilities.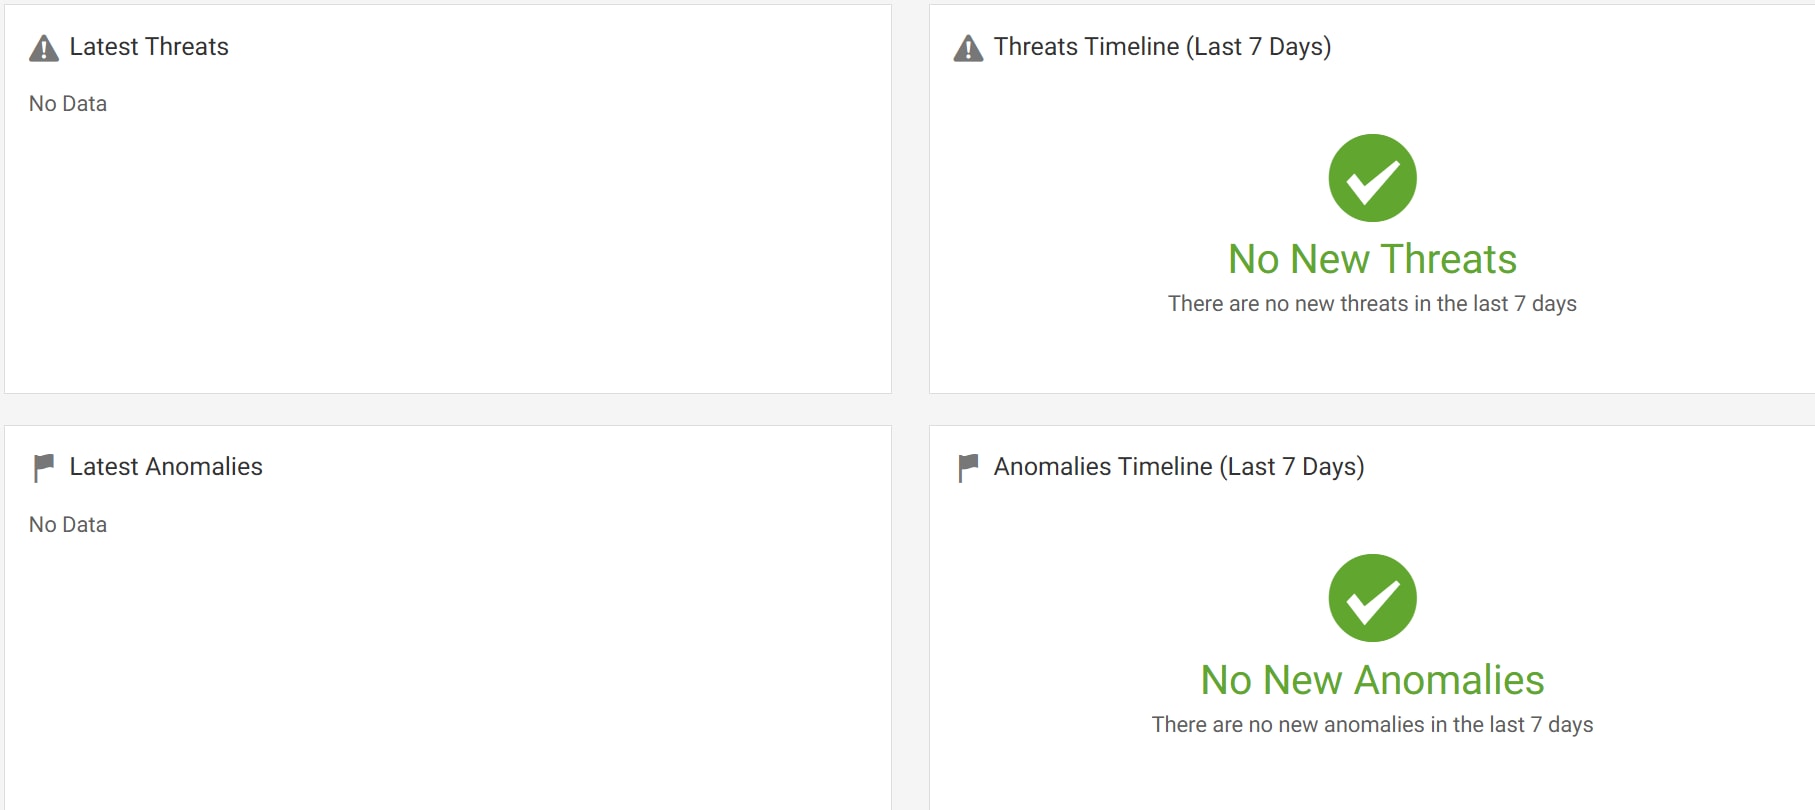
Investigation
During investigation, it was found that anomalies were not being created because the Spark services were not running properly. Even when Spark services were started manually, they would run for a short period and then fail again, entering a continuous restart loop. The root cause of the issue was identified as an empty "sparkserverregistry" table in the PostgreSQL database. This table is used by the Spark Server to register its presence and coordinate model execution. An empty sparkserverregistry table indicates that the Spark Server is not properly registered in the database, which prevents the execution of anomaly detection models and consequently stops the generation of anomalies and threats.

Further investigation revealed that the sparkserverregistry table was empty because the PostgreSQL database was in read-only mode(default_transaction_read_only = on). When the database is in read-only mode, it cannot accept write operations, including INSERT statements. This prevents the Spark Server from registering itself in the sparkserverregistry table during startup, causing the service to fail or operate without proper coordination, ultimately blocking all model execution and anomaly generation.
Resolution
Follow these steps to resolve the Spark Server registration issue and restore anomaly and threat generation:
Step 1: Verify Spark Server Registration Status
Check if the "sparkserverregistry" table is empty by executing the below command on the management node (for single-node) or on the Spark Master node (for cluster environments):
psql -d caspidadb -c "SELECT * FROM sparkserverregistry;"
An empty table confirms that Spark Server is not properly registered, which prevents model execution.
Step 2: Re-setup Spark Configuration
Execute the below command to reconfigure Spark services:
/opt/caspida/bin/Caspida setupsparkOutput: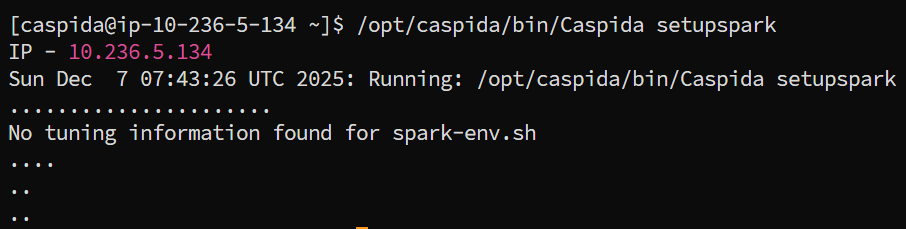
Step 3: Restart Spark Services
Restart all Spark services by running the following commands:
/opt/caspida/bin/Caspida stop-spark
/opt/caspida/bin/Caspida start-spark
Step 4: Verify Spark Server Registration
Check the sparkserverregistry table again:
psql -d caspidadb -c "SELECT * FROM sparkserverregistry;"Expected Output: Step 5: Check Database Read-Only Mode
Verify if the database is in read-only mode:
psql -d caspidadb -c "SHOW default_transaction_read_only;"
When set to "on", the database cannot accept write operations, preventing Spark Server from registering itself.
Step 6: Disable Read-Only Mode
Change the database from read-only mode to read-write mode by executing the below command:
psql -d caspidadb -c 'BEGIN; SET transaction read write; ALTER DATABASE caspidadb SET default_transaction_read_only = off; COMMIT'This command begins a transaction, enables write operations, alters the database default transaction mode to read-write, and commits the changes, allowing write operations such as Spark Server registration and anomaly creation.
Verify the change:
psql -d caspidadb -c "SHOW default_transaction_read_only;"
Step 7: Verify All Spark Services Are Running
Execute the below command to verify all expected Spark services are running (run on Spark Master node in cluster environment):
ps -ef | grep spark | grep -v grep | grep -o "org.apache.spark.[^ ]*\|com.caspida.[^ ]*"
Expected Output:
In UBA, there are four Spark services that should be running:
- Spark Master
- Spark Worker
- Spark History Server
- UBA Spark Server
Step 8: Trigger Batch Model Execution
Manually trigger all offline (batch) anomaly detection models to verify they can execute:
curl -k -H "Authorization: Bearer $(grep '^\s*jobmanager.restServer.auth.user.token=' /opt/caspida/conf/uba-default.properties | cut -d'=' -f2)" -X POST 'https://localhost:9002/models/trigger/offline?name=all&force=false'This command calls the Job Manager REST API to immediately start all offline anomaly detection models, forcing model execution to verify the Spark Server can coordinate and execute models properly.
Step 9: Verify Anomaly and Threat Generation
After 30-60 minutes (allowing time for models to process data), verify that anomalies and threats are being created:
# Check recent anomalies
psql -d caspidadb -c "SELECT DATE(creationtime) AS date, COUNT(*) AS anomaly_count FROM anomalies WHERE creationtime > NOW() - INTERVAL '24 hours' GROUP BY DATE(creationtime) ORDER BY date DESC;"# Check recent threats
psql -d caspidadb -c "SELECT DATE(firstcomputedtime) AS date, COUNT(*) AS threat_count FROM threats WHERE firstcomputedtime > NOW() - INTERVAL '24 hours' GROUP BY DATE(firstcomputedtime) ORDER BY date DESC;"
Related Links
Document Link: Reference
Revision History
| Revision | Publish Date | Comments |
|---|---|---|
1.0 |
01-Oct-2026
|
Initial Release |
 Feedback
