Configure ZTNA Logging for Troubleshooting
Available Languages
Contents
Introduction
This document describes how to collect detailed ZTA troubleshooting logs and when to enable step by step.
Background Information
As organizations increasingly adopt Zero Trust Architecture (ZTA) to secure users, devices, and applications, troubleshooting connectivity and policy enforcement issues have become more complex. Unlike traditional perimeter-based models, ZTA relies on multiple real-time decisions across identity, device posture, network context, and cloud-based policy engines. When issues arise, high-level logs are often insufficient to pinpoint the root cause.
Collecting detailed ZTA level tracing plays a critical role in gaining deep visibility into client behavior, policy evaluation, traffic interception, and cloud service interactions. These traces enable engineers to move beyond symptom based troubleshooting and analyze the exact sequence of events leading to access failures, performance degradation, or unexpected policy outcomes.
Collecting Logs
Pre-Checks Before Opening a TAC Case
These pre-checks help the TAC team identify the issue more efficiently. Providing this information to the engineers assists them in resolving your problem as quickly as possible:
-
What is the issue, and how many users are affected?
-
Which OS and versions are impacted?
-
Is the issue consistent or intermittent? If intermittent, is it user-specific or widespread?
-
Did the issue start after a change, or has it been present since deployment?
-
Are there any known triggers?
-
Is there a workaround available?
Logs to Collect
-
DART bundle
- ZTNA Debug Trace mode logs
-
Wireshark capture (all interfaces, including loopback)
-
Error messages observed
-
Timestamps of the issue
-
CSC ZTA module status screenshot
-
Username of the affected user
The next sections explain how to enable and collect each of these logs in detail.
Enable ZTNA Debug Trace Mode
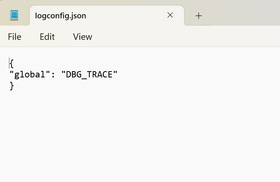
Create a file named logconfig.json with these details below:
{ "global": "DBG_TRACE" }

Warning: Be sure your file is saved with the name logconfig.json.
After creating the file, place it in the appropriate location based on the operating system:
-
Windows:
C:\ProgramData\Cisco\Cisco Secure Client\ZTA -
macOS:
/opt/cisco/secureclient/zta


Note: Once you have created the specified file, you must restart the Zero Trust Access Agent service (Please check step Restarting ZTA service ). If restarting the service is not possible, please restart the computer.
Increase ZTA Log Size in Event Viewer
On Windows PCs, after enabling trace-level logging, you must manually increase the ZTA log file size.
- Open
Event Viewer. - In the left pane, expand
Applications and Services Logs. - Right click
Cisco Secure Client – Zero Trust Accessand selectProperties. - Under
Maximum log size (KB), set the value to204800(equivalent to 200 MB).
To finalize click Apply and then OK.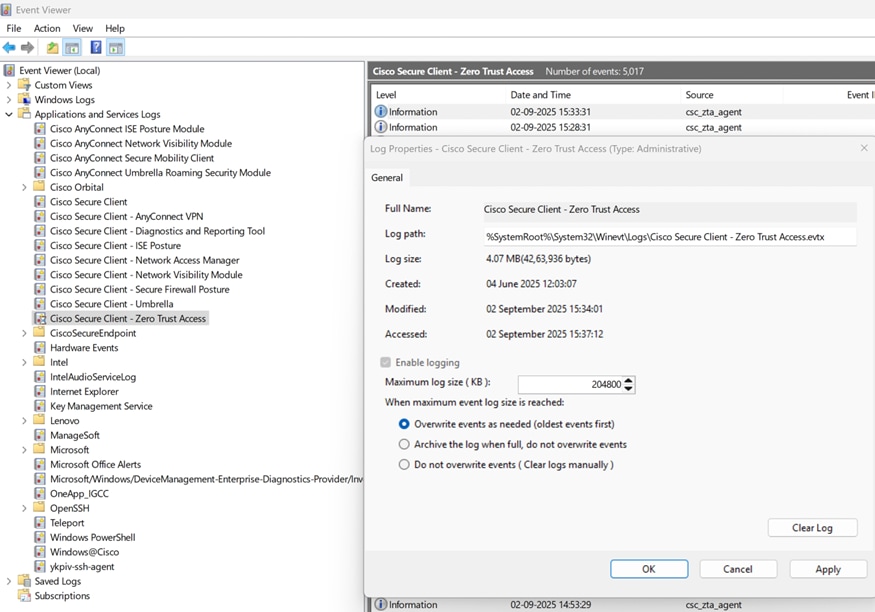
Restarting ZTA Service
Windows
- Use
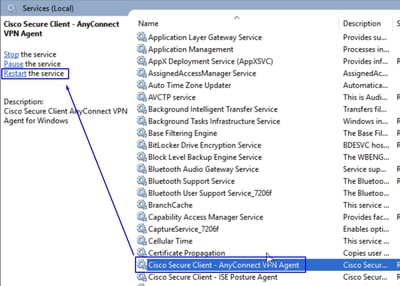
Windows + Rto open theRun Searchwriteservices.mscand press enter. - Locate the service
Cisco Secure Client - Zero trust Access Agentand clickRestart. Once its done, verify the CSC ZTA module status to confirm it is active.
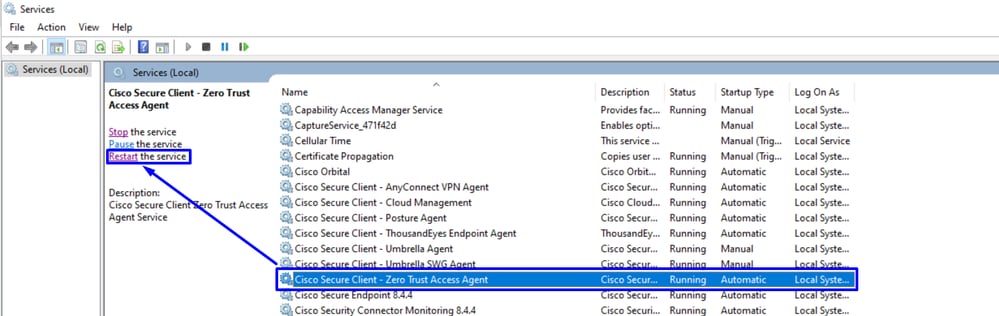
Note: If ZTA service cannot be restarted due to lack of administrative access, a full system reboot is your next option.
MacOS
Stop Service.
sudo "/opt/cisco/secureclient/zta/bin/Cisco Secure Client - Zero Trust Access.app/Contents/MacOS/Cisco Secure Client - Zero Trust Access" uninstallStart Service.
open -a "/opt/cisco/secureclient/zta/bin/Cisco Secure Client - Zero Trust Access.app"
Note: If commands cannot be executed or the ZTA service cannot be restarted due to lack of administrative access, a full system reboot is your next option.
Enable KDF Logging, Packet Capture, Duo Debug Mode and Dart Bundle
Windows
Open a CMD with admin privileges and run the next command:
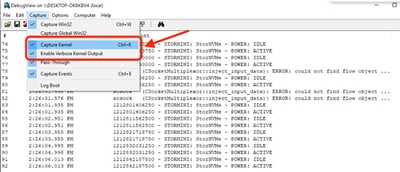
"%ProgramFiles(x86)%\Cisco\Cisco Secure Client\acsocktool.exe" -sdf 0x400080152- Download DebugView from SysInternal to capture the KDF log.
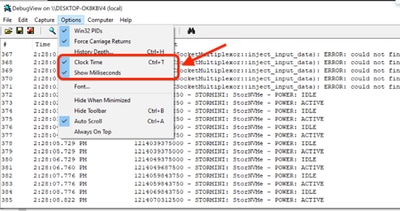
- Run
DebugViewasadministratorand enable the next menu options: - Click Capture.
- Checkmark
Capture Kernel. - Checkmark
Enable Verbose Kernel Output.
- Checkmark
- Options
- Checkmark
Clock Time. - Checkmark
Show Milliseconds.
- Checkmark
-
Restart the client service via admin prompt:
net stop csc_vpnagent && net start csc_vpnagent- If
net stop csc_vpnagent && net start csc_vpnagentdoes not work, restartCisco Secure Clientservice from services.msc.
- Enable Duo in Debug mode
-
Start
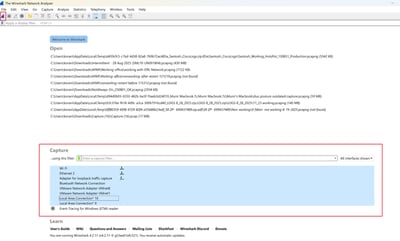
Wireshark Capture. -
Select all the interfaces, and start the packet capture.

- Reproduce the issue, and save
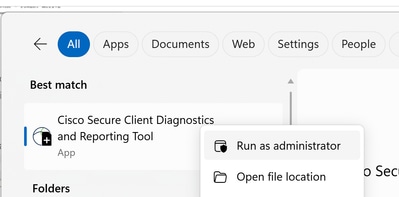
KDF LogsandWireshark Capturethen follow the steps to captureDART Bundle. - Open the
Cisco Secure Client Diagnostics & Reporting Tool (DART)with administrator privileges.
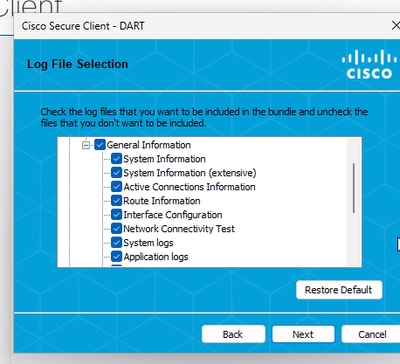
- Click
Custom.- Include
System Information ExtensiveandNetwork Connectivity Test.
- Include
- To stop the KDF logging on Windows, use the next command:
"%ProgramFiles(x86)%\Cisco\Cisco Secure Client\acsocktool.exe" -cdfNote: Collect all the logs: KDF Logs, Wireshark Capture and DART Bundle to the TAC Case.
Windows Powershell Commands to Enable and Disable, It must be Run as Administrator:
#Enable ZTNA Logs
New-Item -Path "C:\ProgramData\Cisco\Cisco Secure Client\ZTA\logconfig.json" -ItemType "file" -Value '{"global" : "DBG_TRACE"}'
Limit-EventLog -LogName "Cisco Secure Client - Zero Trust Access" -MaximumSize 2240000KB
& "C:\Program Files (x86)\Cisco\Cisco Secure Client\acsocktool.exe" -sdf 0x400080152
Restart-Service csc_vpnagent
Restart-Service csc_zta_agent

#Disable ZTNA Logs
Remove-Item -Path "C:\ProgramData\Cisco\Cisco Secure Client\ZTA\logconfig.json"
Limit-EventLog -LogName "Cisco Secure Client - Zero Trust Access" -MaximumSize 6400KB
& "C:\Program Files (x86)\Cisco\Cisco Secure Client\acsocktool.exe" -cdf 0x400080152
Restart-Service csc_vpnagent
Restart-Service csc_zta_agent
MacOS
Open terminal and follow the next command chain to enable KDF Logging on MacOS:
StopService.
sudo "/opt/cisco/secureclient/bin/Cisco Secure Client - AnyConnect VPN Service.app/Contents/MacOS/Cisco Secure Client - AnyConnect VPN Service" uninstallEnableFlag.
echo debug=0x400080152 | sudo tee /opt/cisco/secureclient/kdf/acsock.cfgStartService.
open -a "/opt/cisco/secureclient/bin/Cisco Secure Client - AnyConnect VPN Service.app"- Enable Duo in Debug mode.
-
Start
Wireshark Capture. -
Select all the interfaces, and start the packet capture.
- Reproduce the issue, and save
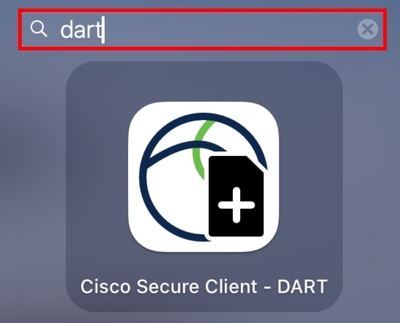
KDF LogsandWireshark Capturethen follow the steps to captureDART Bundle. - Open the
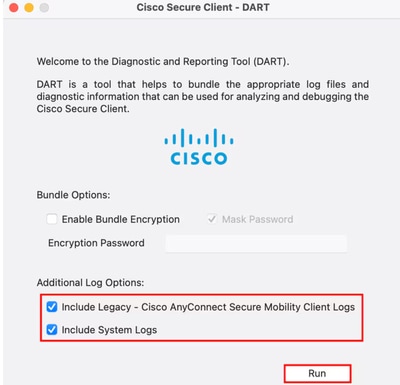
Cisco Secure Client - DART.
- Checkmark the next options:
IncludeLegacy - Cisco AnyConnect Secure Mobility Client Logs.IncludeSystem Logs.
- Click
Run.
Note: Collect all the logs: KDF Logs, Wireshark Capture and DART Bundle to the TAC Case.
Related Information
- Cisco Technical Support & Downloads
- Cisco Secure Access Help Center
- Cisco SASE Design Guide
- Collecting KDF Logs for Secure Client on Windows and MacOS
Revision History
| Revision | Publish Date | Comments |
|---|---|---|
2.0 |
30-Mar-2026
|
Updated Alt Text, and Formatting. |
1.0 |
31-Dec-2025
|
Initial Release |
 Feedback
Contact Cisco
- Open a Support Case

- (Requires a Cisco Service Contract)