Missing data observed on Splunk Observability Cloud dashboard charts
Available Languages
Applicability
Splunk Infrastructure MonitoringDescription
Splunk Observability may sometimes show missing data within its charts and dashboards. This data deficiency can arise from various factors, including exceeding data ingestion limits. Additionally, limitations imposed on tokens, expired tokens, or failures originating from the source application, platform, instrumentation, or even the OTel Collector itself can contribute to missing data.
Investigation
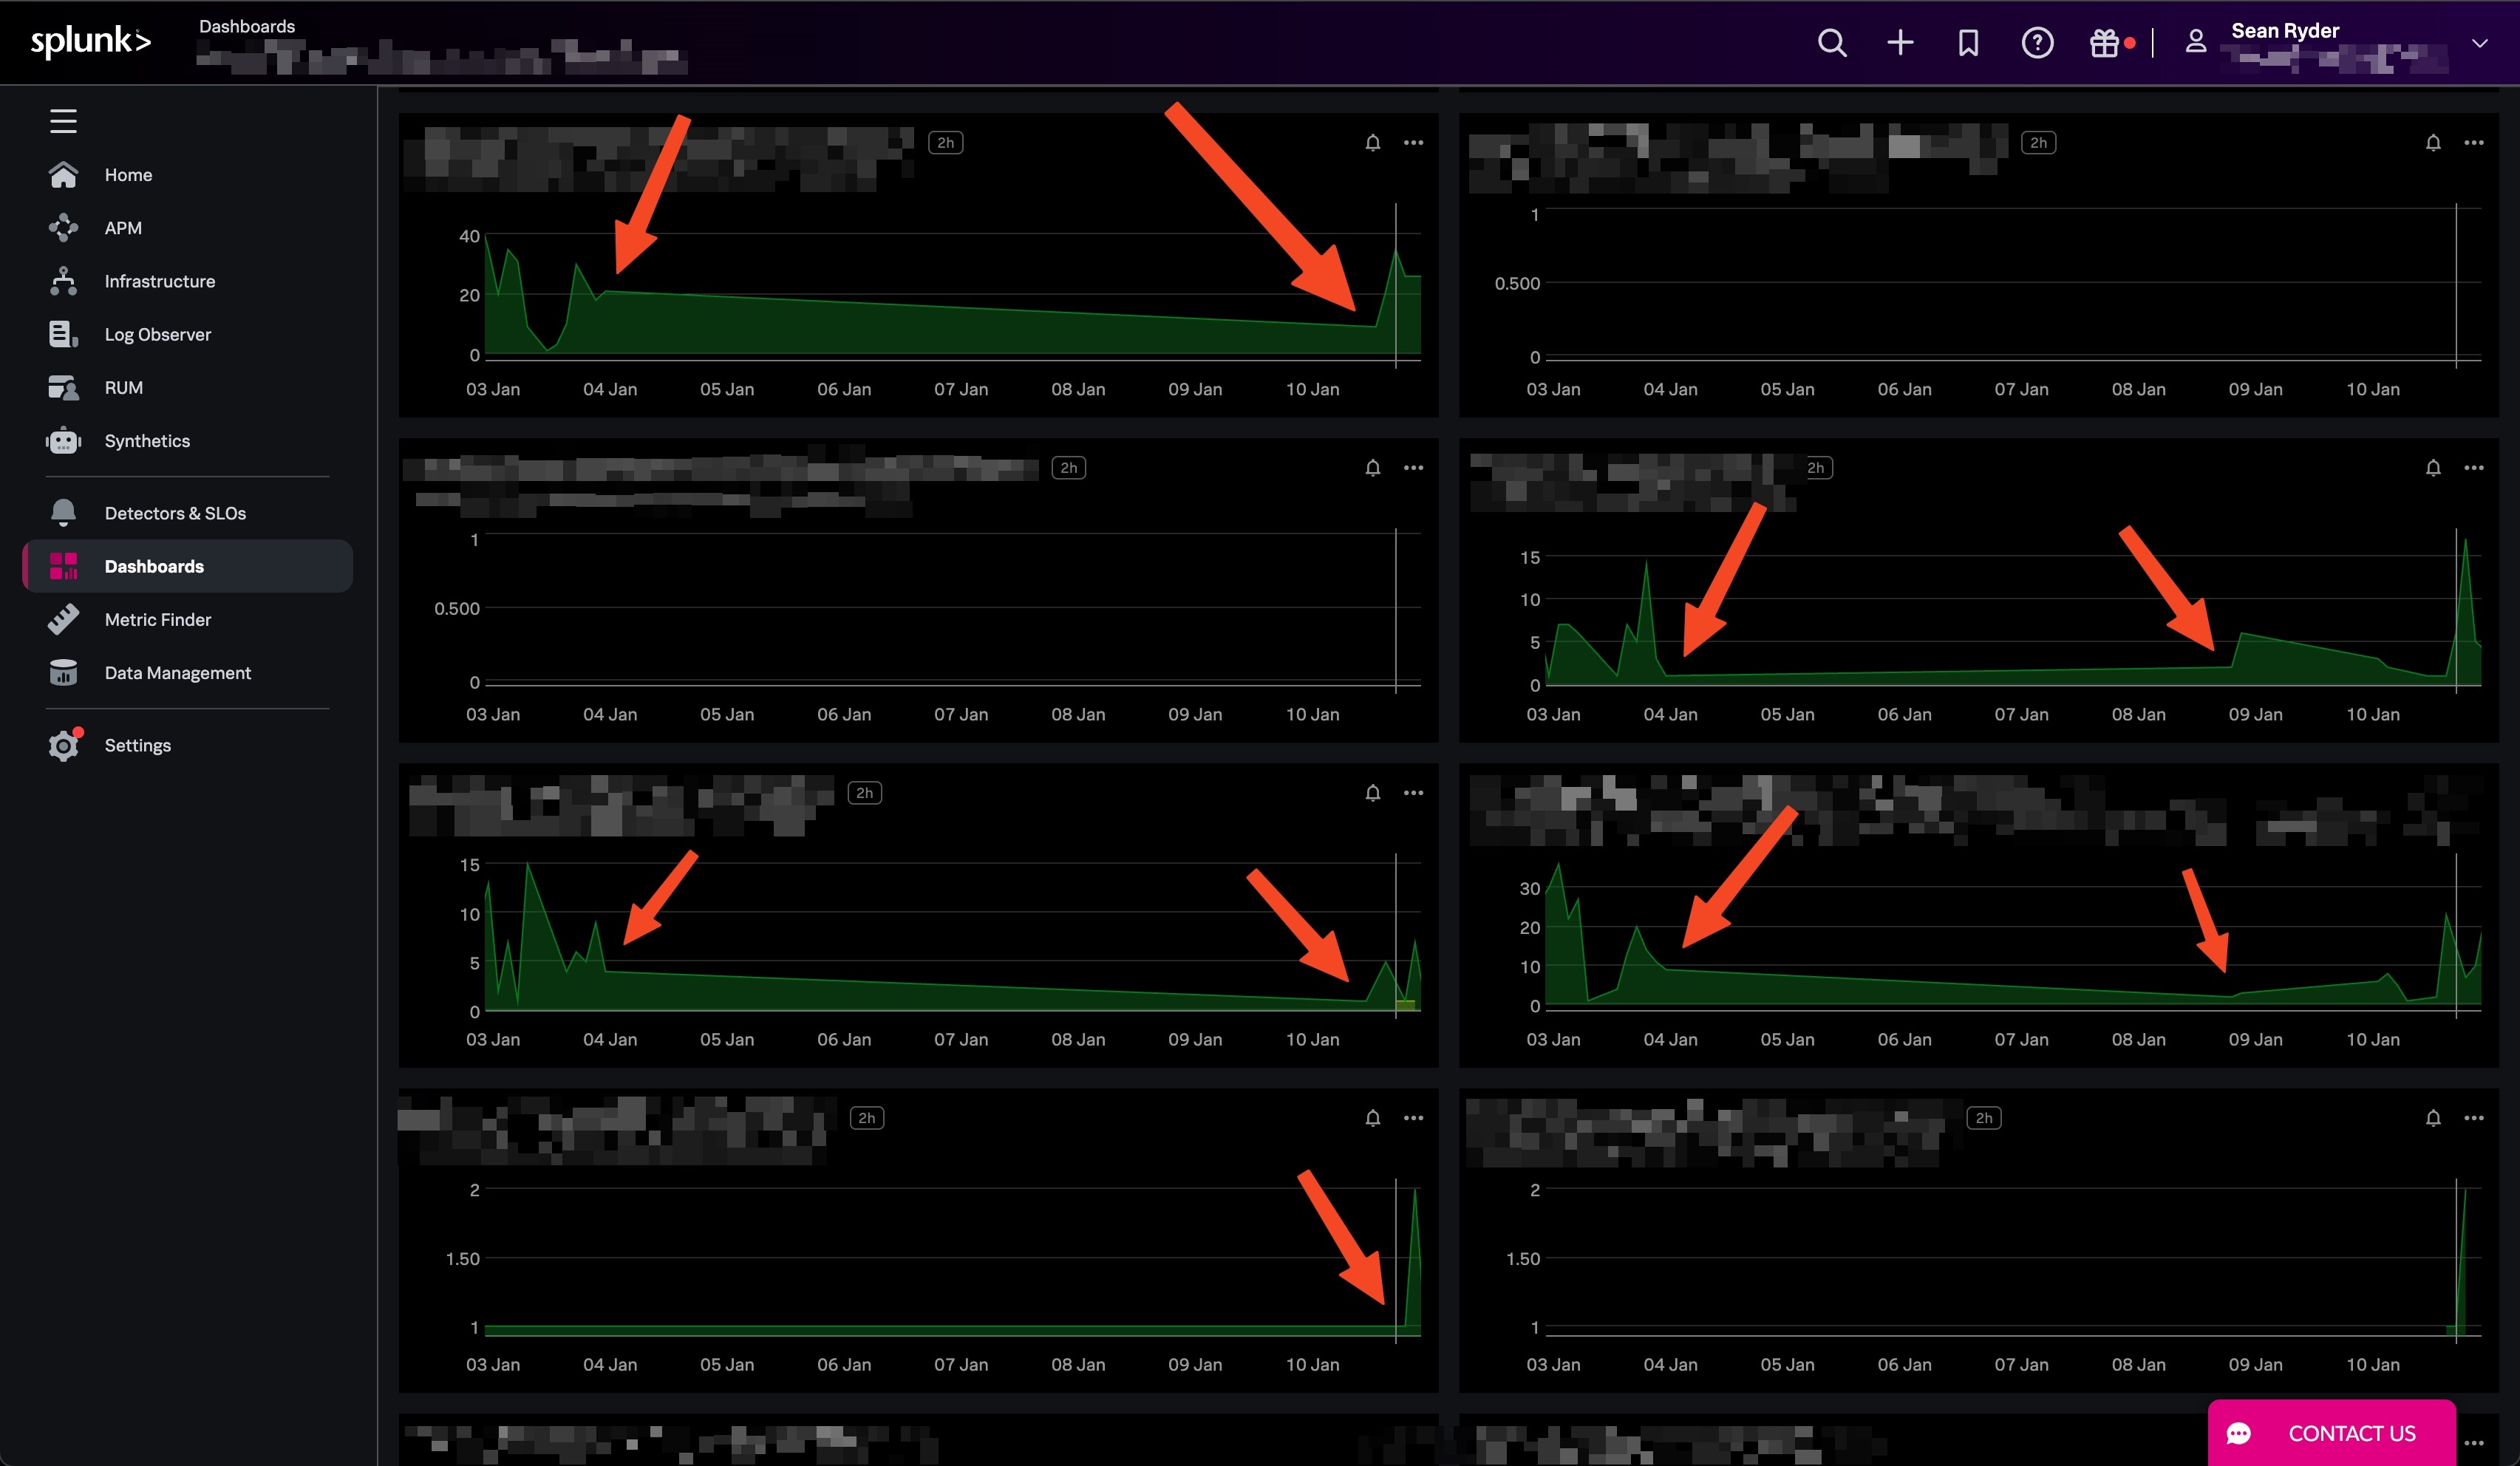
1) When visiting a dashboard or chart in Splunk Observability Cloud, you notice there is data missing as shown in the screenshot below
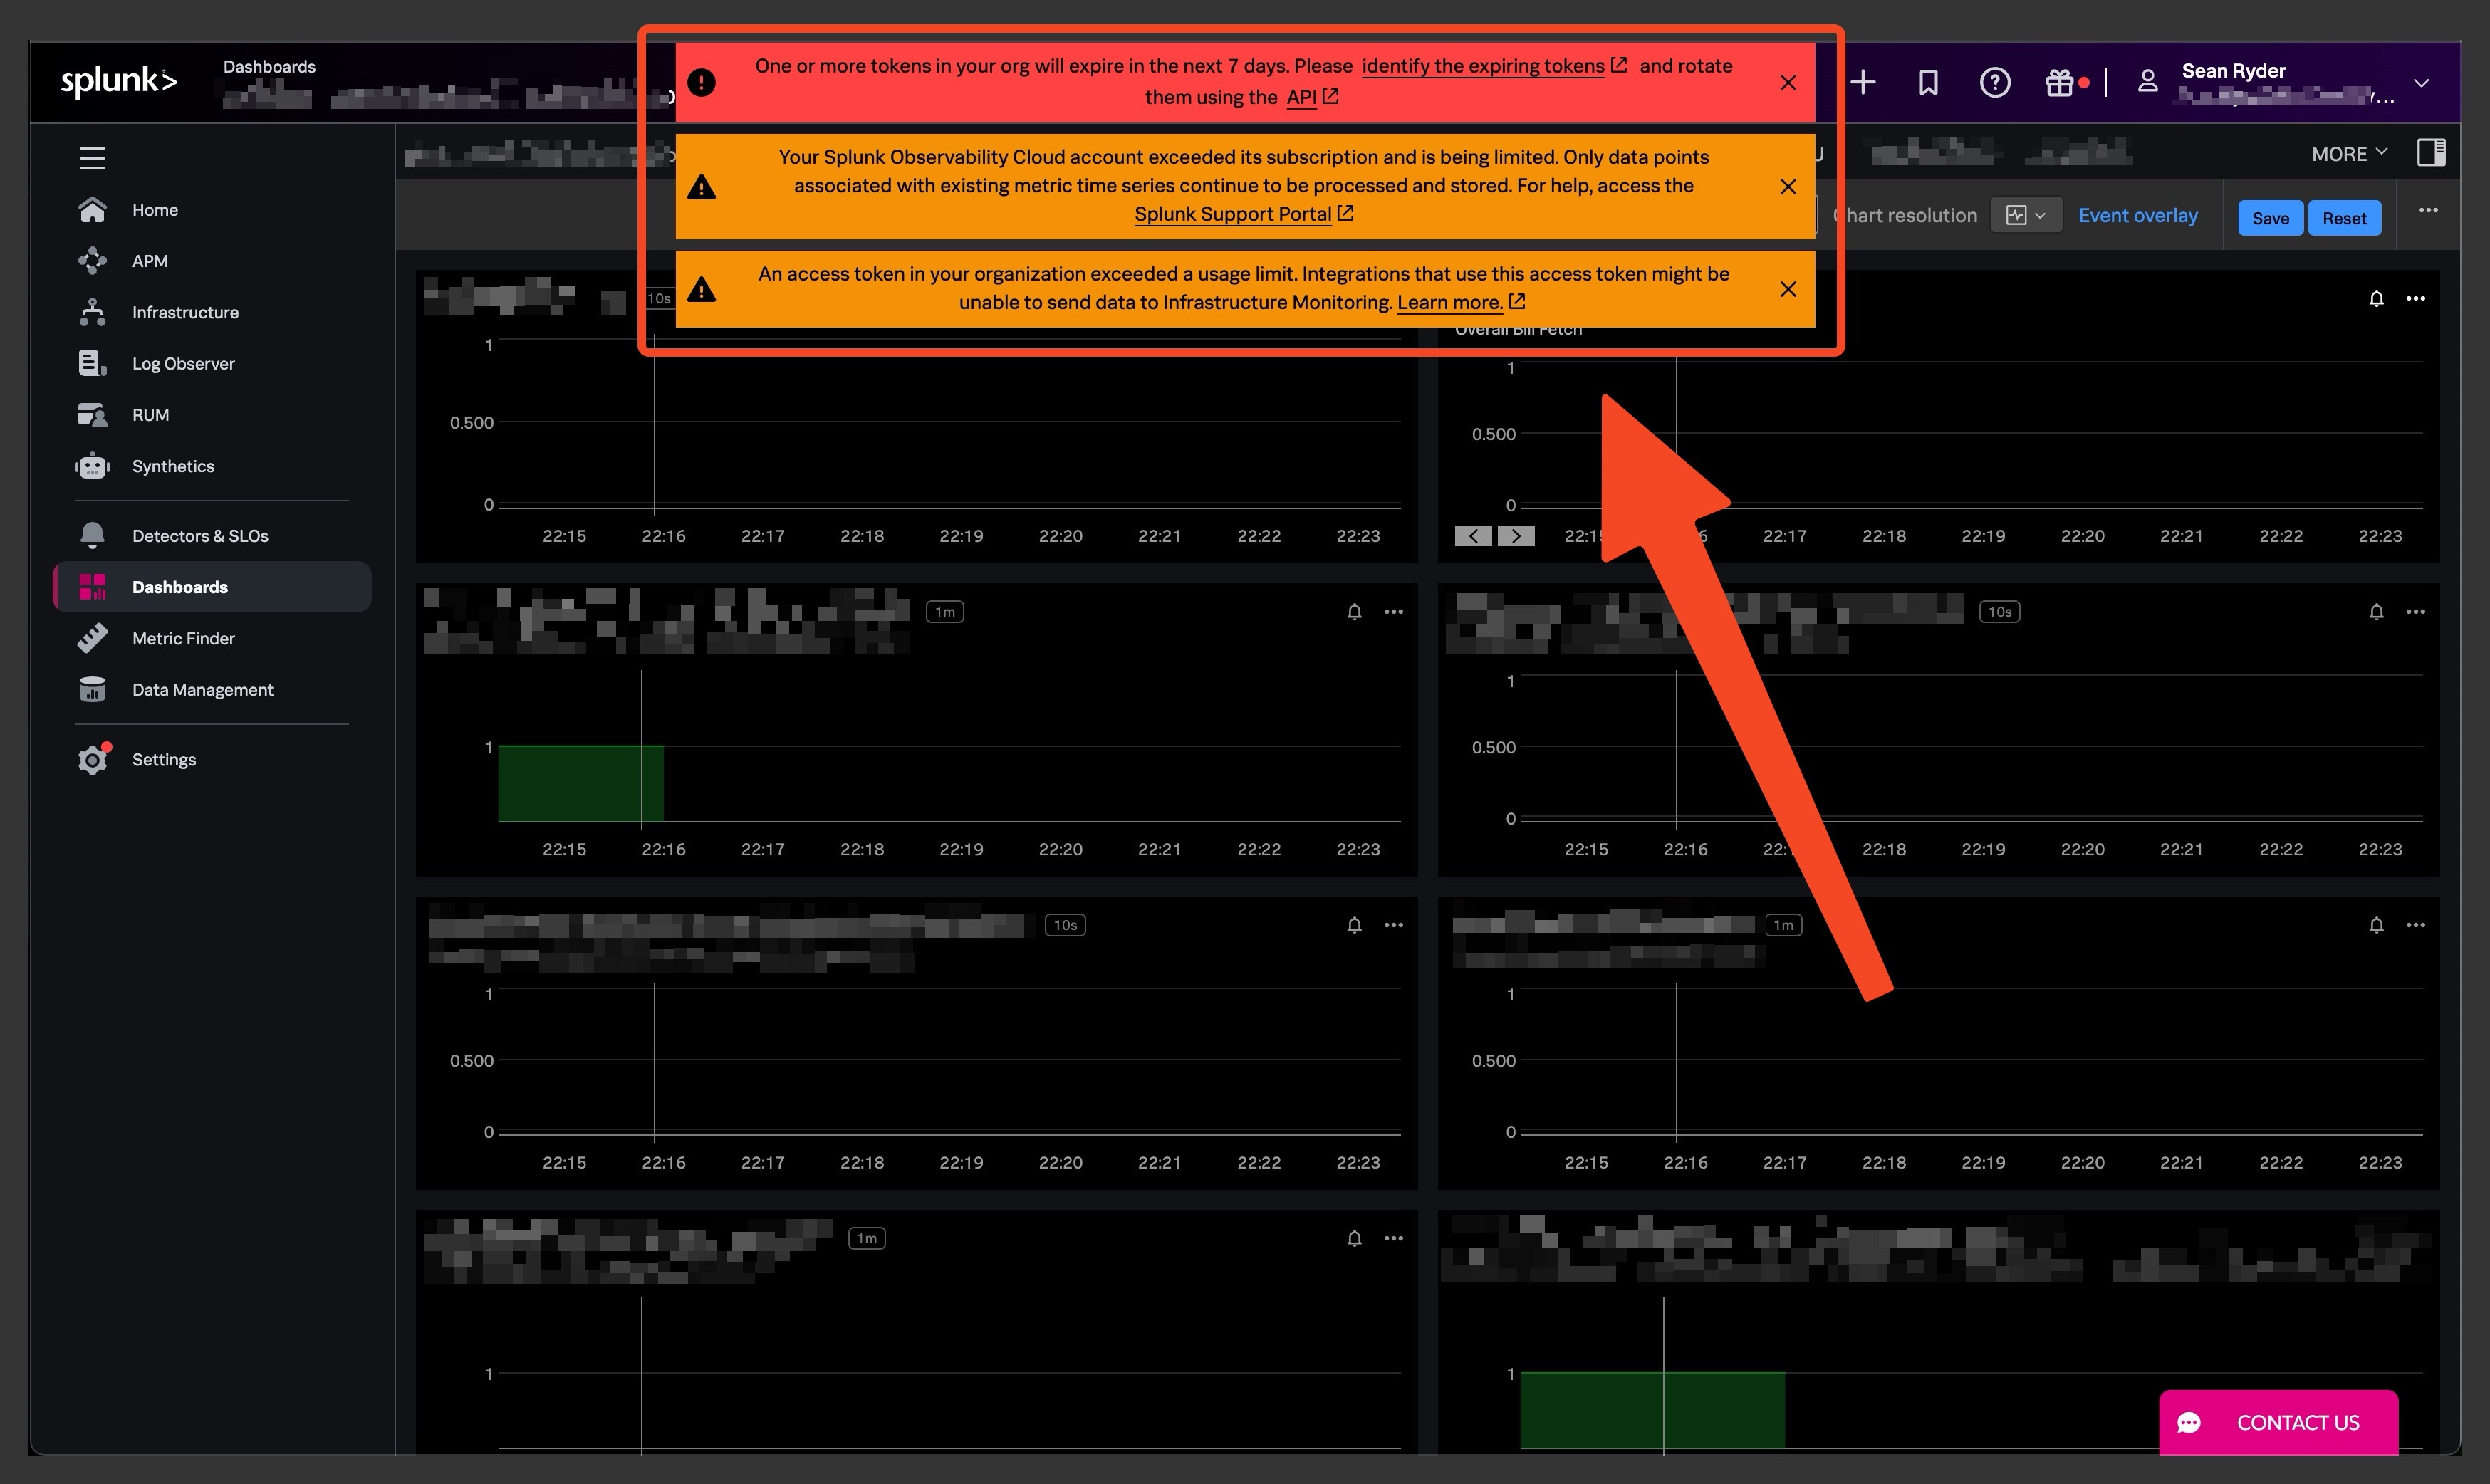
2) You might also notice alert and warning messages within the dashboard indicating potential issues. Click on the link to see more details.
Resolution
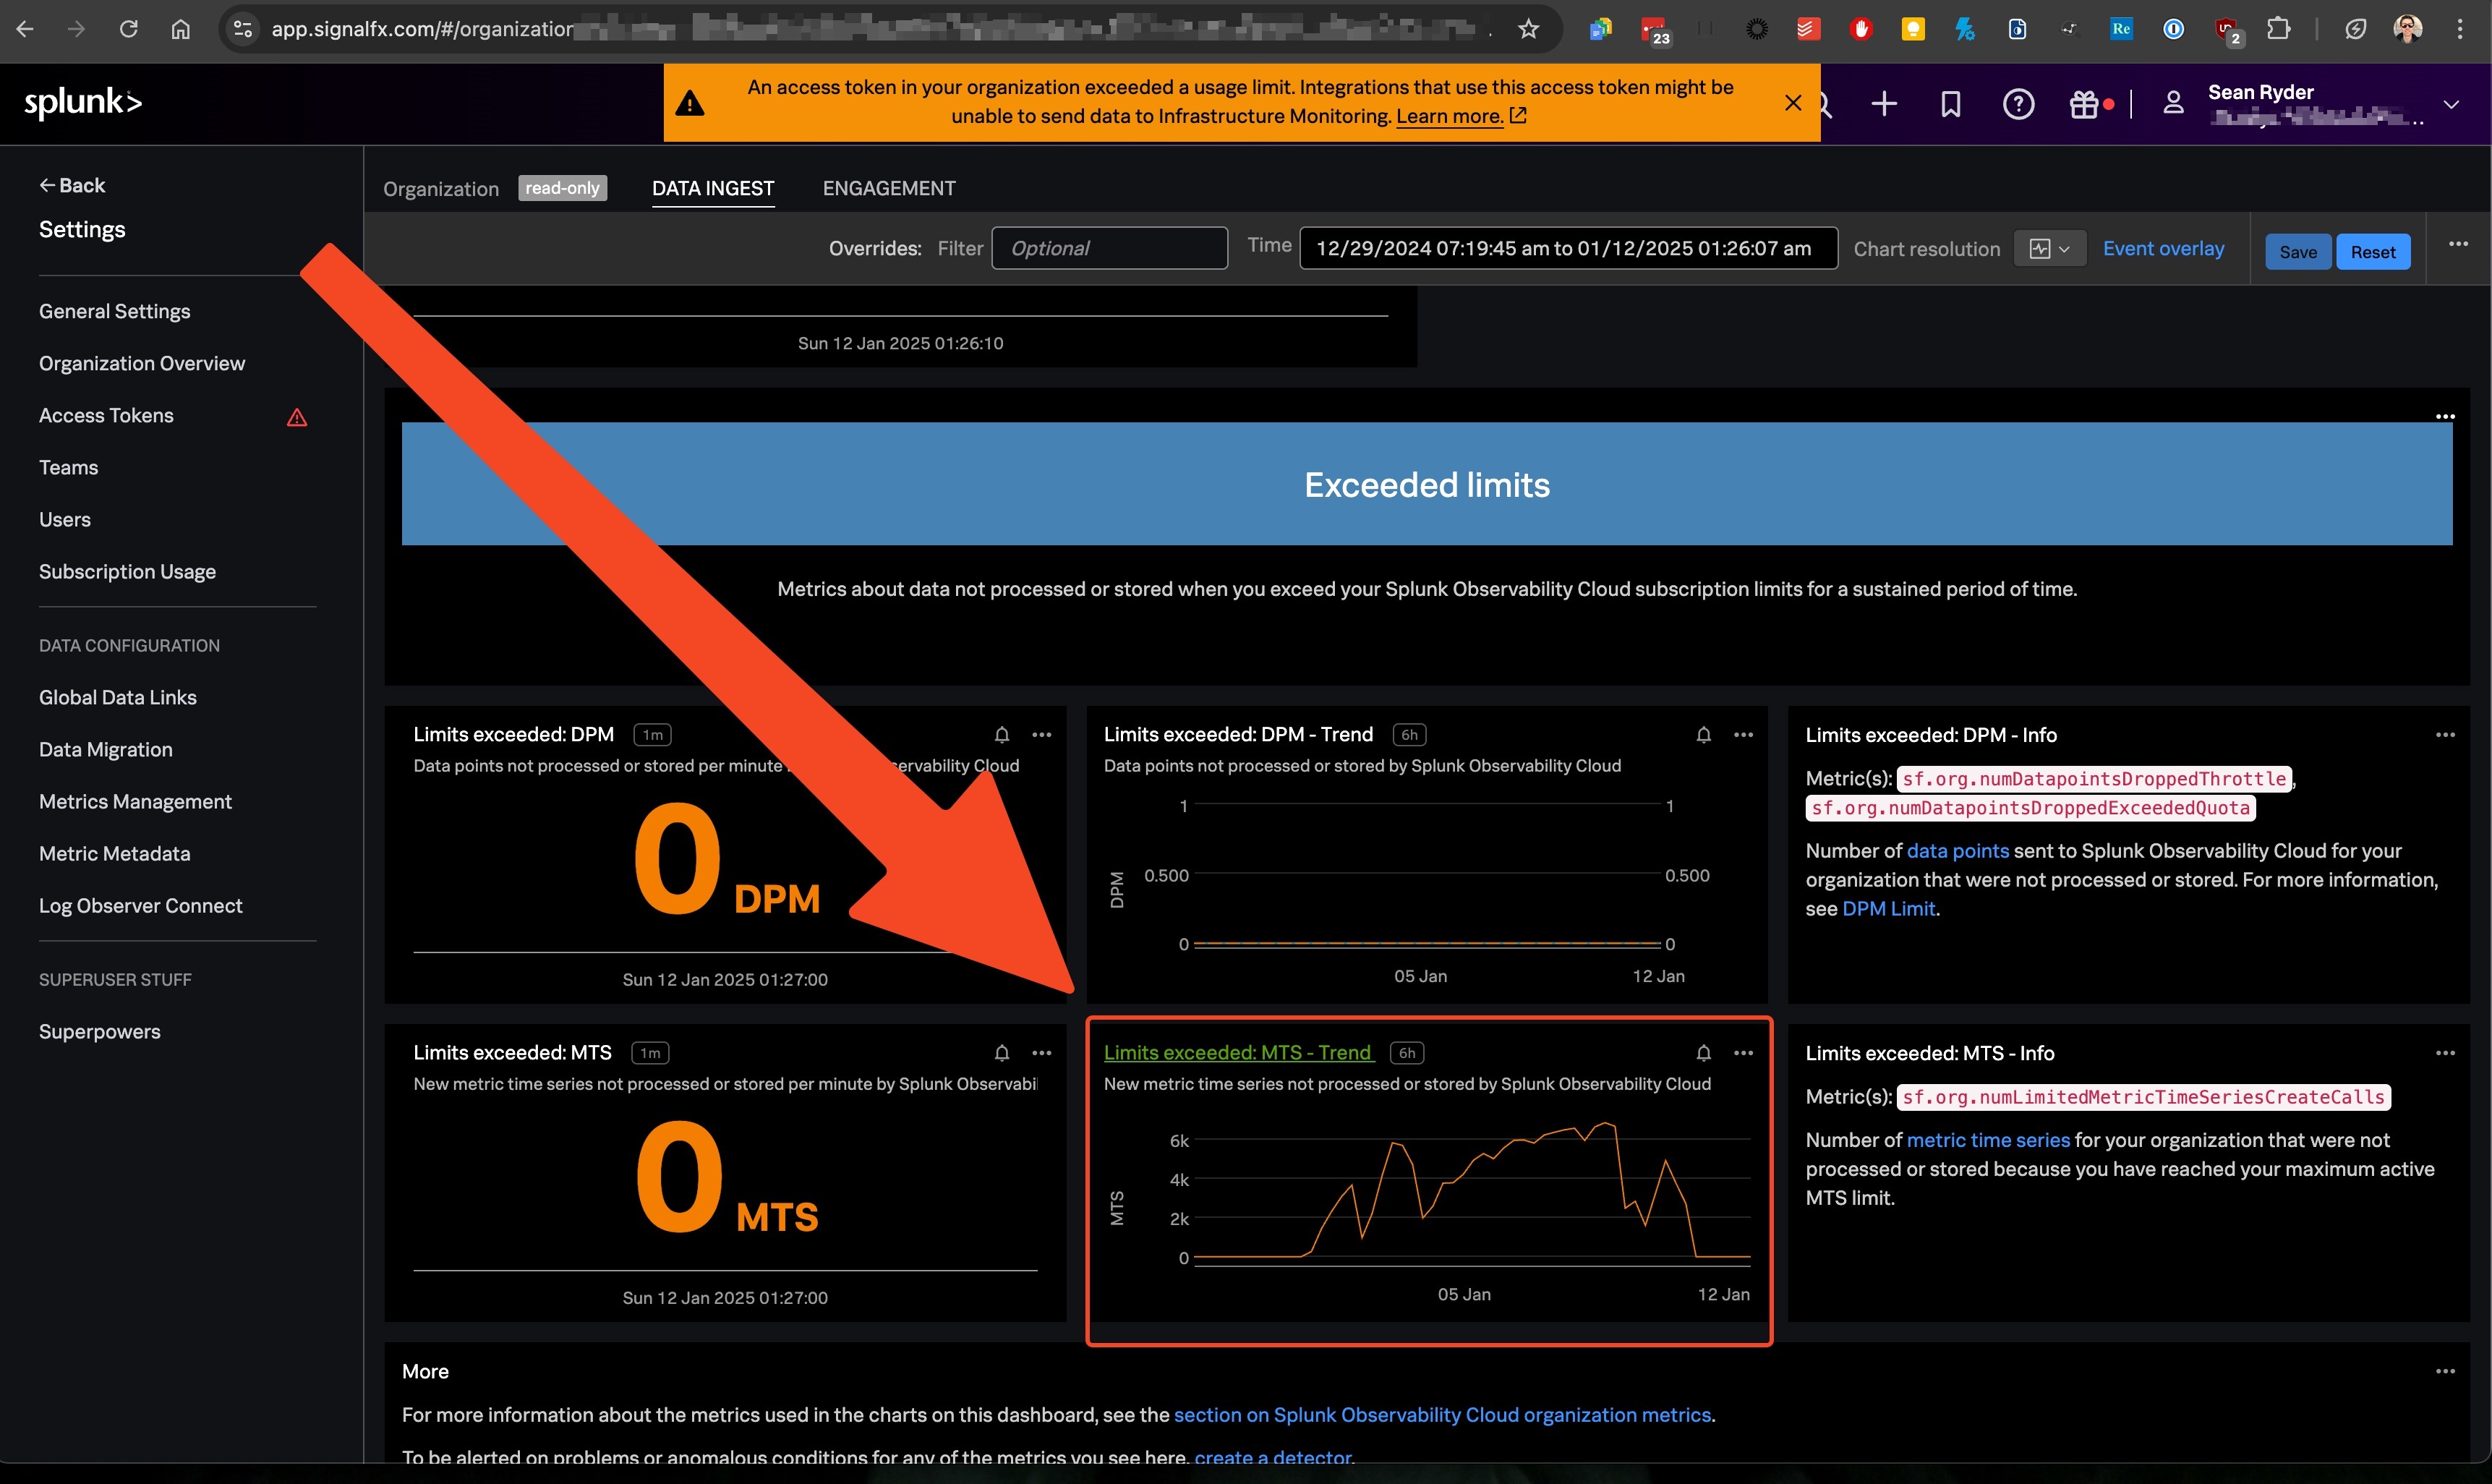
To check if the cause is due to limits, go to the Splunk Observability UI > Settings > Organisation Overview > Data Ingest tab > time: (enter the timeframe the issue occured. Eg: 12/29/2024 07:19:45 am to 01/12/2025 01:26:07 am AEDT) > scroll down to the Exceeded limits section.
Review these charts to see if limits are being exceeded.
In this example the dashboard chart "Limits Exceeded: MTS Trend" shows the organisation is not being processed due to exceeding the MTS limit.
Revision History
| Revision | Publish Date | Comments |
|---|---|---|
1.0 |
29-Sep-2026
|
Initial Release |
 Feedback
