Introduction
This document describes how to use Kibana in order to search specific logs among different Cisco DNA Center services.
Prerequisites
Requirements
You must have access Cisco DNA Center through GUI with ADMIN ROLE also, you must be familiar with the names and use of Cisco DNA Center services.
Components Used
The information in this document was created from the devices in a specific lab environment. All of the devices used in this document started with a cleared (default) configuration. If your network is live, ensure that you understand the potential impact of any command.
Background Information
Kibana is an open source data visualization plugin for Elasticsearch. It provides visualization capabilities on top of the content indexed on an Elasticsearch cluster that are available in Cisco DNA Center.
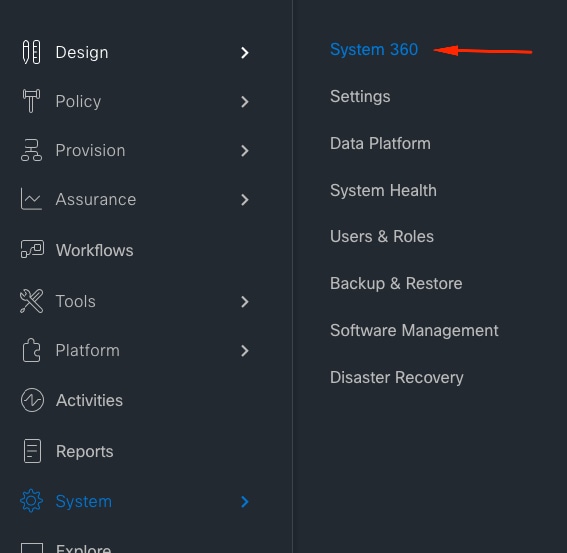
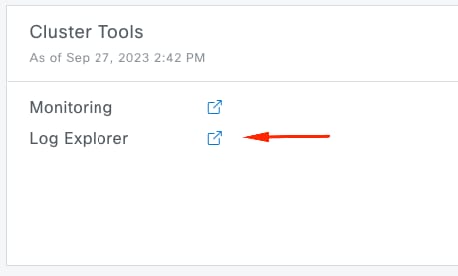
You can access Kibana in two ways:
- https://<Cisco DNA Center ip>/kibana
- Main Menu > System > System 360 -> Cluster Tools -> Log Explorer
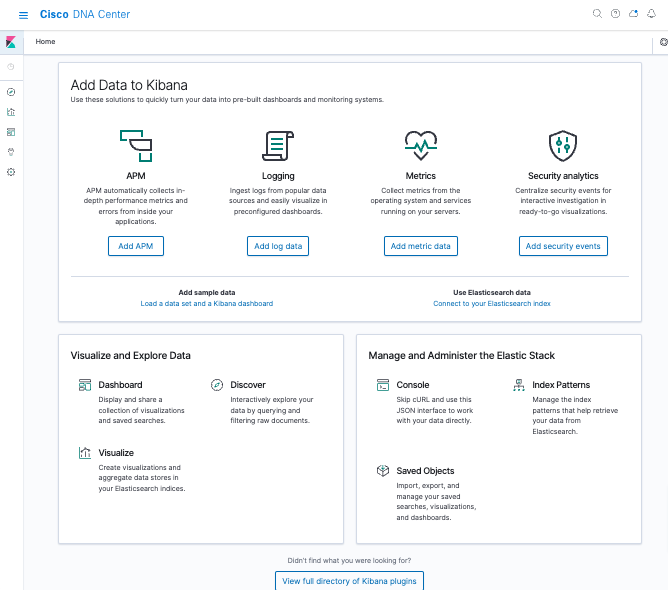
Default Kibana web page
Configure Kibana for log visualization
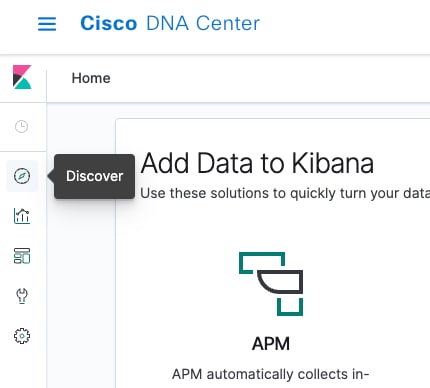
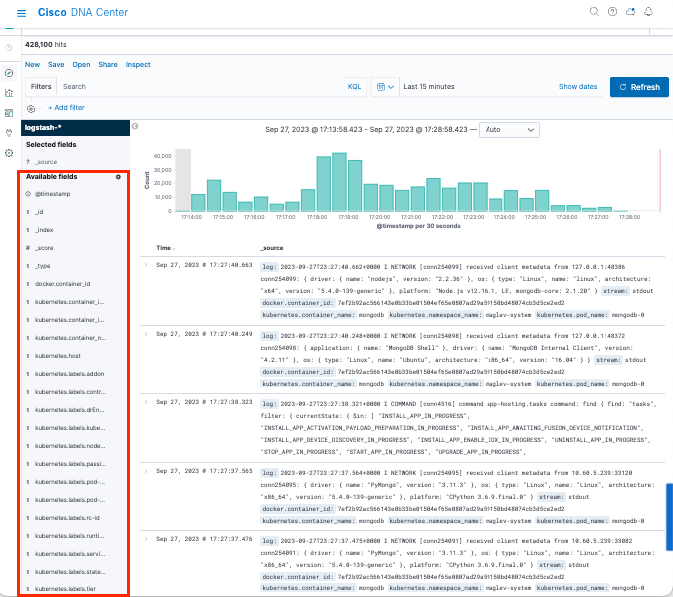
Navigate to the left bar menu and click on Discover:
Kibana has several fields, which are highlighted in the next image:
Add fields in Kibana
Navigate to Filters > Available fields
The fields that you must need to add for logs visualization are:
- Kubernetes.labels.serviceName - Service that displays the specific log
- Log - Raw content of the log
Click on the add button

Ensure that you have the next configuration:
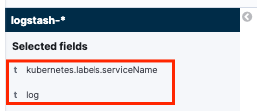

Note: Time field is added by default.
Add and edit filters in Kibana
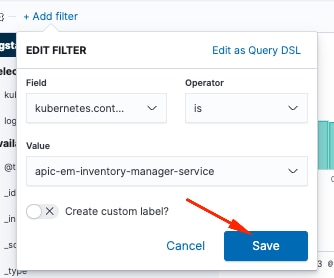
In order to add a filter, perform the next activity:
- Click in Add filter
- Field select: Kubernetes.labels.serviceName
- Operator select: is
- Value: select the service of your interest
- Click in Save button
Take a look the next example where the service selected is apic-em-inventory-manager-service:
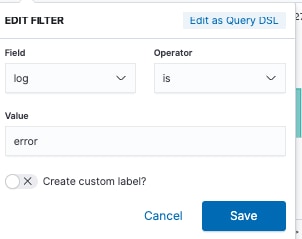
You can add more filters as you need.
The next example, a new filter was added where the Field:log, operator:is and Value: error:
Get logs from a specific date
You can add a time element to your search criteria.
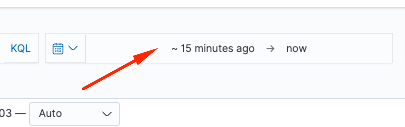
Use one of the next options from the Time Range field:
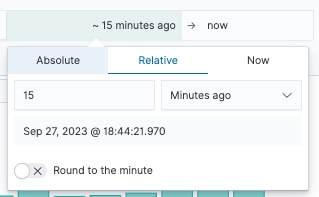
- Absolute - From a specific date to another specific date.
- Relative - From the last X minutes, hours, days, or weeks to a specific date.
- Now - Setting the time to "now" means that on every refresh this time is going to be set to the time of the refresh.
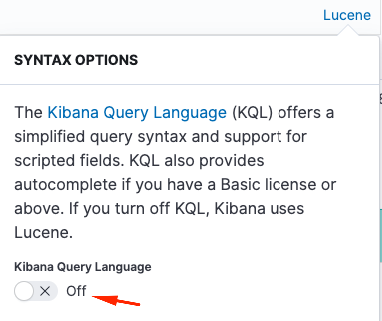
Use cases with Lucene
Lucene is a high-performance, full-featured text search engine library. It is a technology suitable for nearly any application that requires full-text search.
Navigate to search bar and disable KQL in order to enable Lucene:
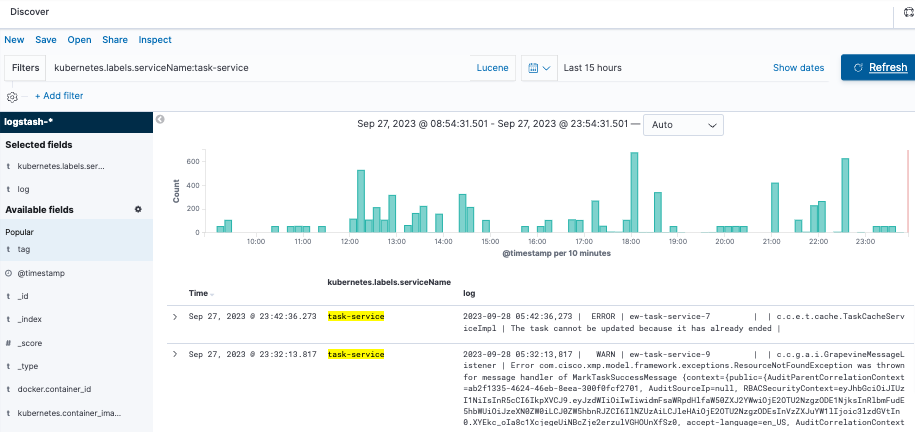
Get logs for a specific service
Type the next query into the filter bar and press Refresh button
kubernetes.labels.serviceName:<service-name>
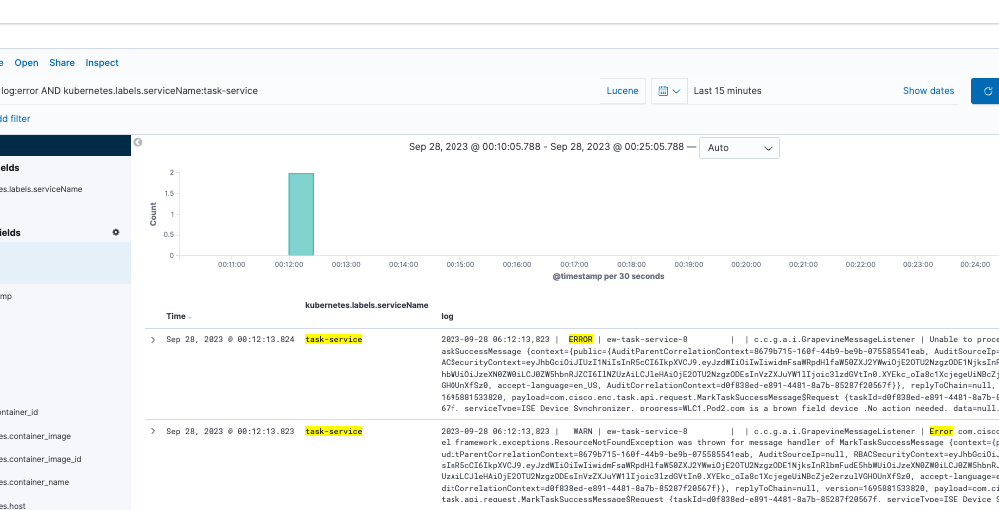
Take a look the next example with task-service:
kubernetes.labels.serviceName:task-service
Get logs that contain a specific word
Tip: The most common log entries that indicate problems contain " Error " , " Failed " and " Exception ", however, you can modify the string to be any other common string that can guide you in your troubleshooting.
Type the next query into the filter bar and press Refresh button
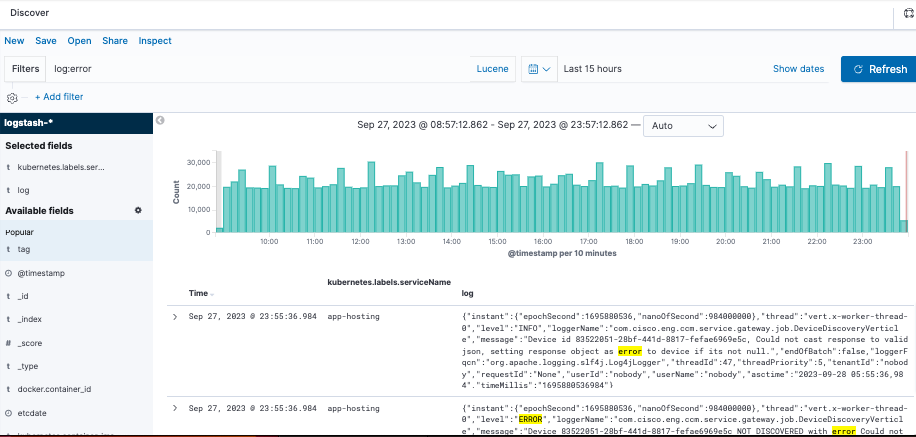
log:error
Mix and match your search
You can search entries that match a combination of strings by using AND (or &&) between the strings.
log:error AND kubernetes.labels.serviceName:onboarding-service
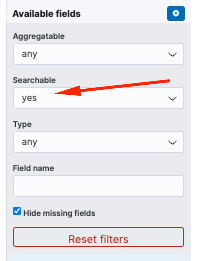
Note: Not all fields are searchable.
If you want to see only searchable fields in the Available Fields pane, select the cogwheel and customize the view. You can also define the type of search that you want to use, for example, string, Boolean, number, and so on.
Search two different services at the same time for an error
Include two or more services in your search criteria. Ensure that the services names are entered in parenthesis and separate them with OR.
log:error && (kubernetes.labels.serviceName:onboarding-service OR kubernetes.labels.serviceName:telemetry-agent)

Reference
 Feedback