Cisco UCS C880A M8 Rack Server Getting Started GuideDense GPU Server
Available Languages
Bias-Free Language
The documentation set for this product strives to use bias-free language. For the purposes of this documentation set, bias-free is defined as language that does not imply discrimination based on age, disability, gender, racial identity, ethnic identity, sexual orientation, socioeconomic status, and intersectionality. Exceptions may be present in the documentation due to language that is hardcoded in the user interfaces of the product software, language used based on RFP documentation, or language that is used by a referenced third-party product. Learn more about how Cisco is using Inclusive Language.
This guide is for use after the Cisco UCS® C880A M8 Rack Server is installed and cabled and its Baseboard Management Controller (BMC) is reachable at a known management address. It provides a practical first-server workflow for BMC configuration, firmware upgrade, operating system installation, host and Graphics Processing Unit (GPU) software installation, adapter configuration, final checks, monitoring, and support-data collection.
The examples in this guide use BMC firmware 4.0(1.260014) and Ubuntu Server 24.04 LTS. The procedures described here are based on the software versions available and tested when the guide was published; they are intended as guidance, not a permanent compatibility guarantee. Vendors can replace or withdraw firmware, drivers, packages, and repositories. Before deployment, use the current Cisco® compatibility information and the release notes for the selected Cisco, NVIDIA, operating system, and adapter software.
This guide does not repeat rack installation, power and network cabling, or the initial assignment of a BMC address. Those tasks are covered in the Cisco UCS C880A M8 Installation and Service Guide.
Follow this sequence for the first server:
1. Sign in to the BMC and check platform identity, health, KVM, and virtual media.
2. Upgrade the platform firmware to the release selected for the deployment.
3. Install Ubuntu Server through Common Internet File System (CIFS) remote media and the BMC KVM.
4. Configure the operating system and verify host inventory.
5. Check host-side firmware and configure the selected adapter profile.
6. Install and validate the NVIDIA GPU software stack.
7. Validate the connected deployment network.
8. Run the final platform checks.
9. Configure monitoring and learn how to collect support data.
A comprehensive Redfish monitoring and automation reference is provided in the final appendix.
1.2 How to use the optional sections
Unmarked chapters and sections belong to the first-server path. Use sections marked Optional when the feature belongs to the deployment. Use sections marked Conditional only when the server contains the hardware or configuration named in the heading.
Complete link negotiation, peer traffic, RDMA over Converged Ethernet (RoCE), and InfiniBand checks after the server is connected to the deployment fabric.
For an unexpected result, use Chapter 11, “Troubleshooting,” and the Cisco UCS C880A M8 Rack Server Troubleshooting Guide. If the result remains unresolved, collect the support bundle as described in Chapter 10, “Monitor and Support the Server,” and open a Cisco Technical Assistance Center (TAC) case.
1.3 Software used in this guide
The out-of-band and host procedures in this guide were tested with the software listed in the following table.
Table 1. Software used for testing in this guide
| Component |
Version used |
| Cisco BMC firmware |
4.0(1.260014) |
| Redfish service |
1.15.1 |
| Redfish service-root schema |
#ServiceRoot.v1_13_0.ServiceRoot |
| Host operating system |
Ubuntu Server 24.04.4 LTS |
| Host kernel |
6.8.0-136-generic |
| NVIDIA driver and Fabric Manager |
580.173.02 |
| NVLink Subnet Manager |
2025.10.14-1 |
| Compute Unified Device Architecture (CUDA) Toolkit |
13.0.3 (nvcc 13.0.88) |
| NVIDIA Collective Communications Library (NCCL) |
2.28.9-1+cuda13.0 |
| Data Center GPU Manager (DCGM) |
4.6.1 |
| NVIDIA firmware tools |
4.35.0-159 |
| ConnectX-8 firmware |
40.47.2526 |
| Host RDMA stack |
Ubuntu inbox mlx5_core and mlx5_ib; RDMA user space 50.0 |
| Data NVMe firmware |
Micron F3MU011 |
Firmware and driver compatibility can change. Before installing an operating system or software stack, confirm the target configuration in the Cisco C880 Hardware and Software Interoperability List and review the release notes supplied with the selected Cisco and NVIDIA software.
The Cisco UCS C880A M8 Rack Server supports multiple operating systems. This guide uses Ubuntu Server 24.04 LTS for the installation, driver, and validation procedures. Confirm the specific operating system release and platform configuration in the current Cisco compatibility information before deployment.
This guide covers:
● Initial BMC access and management-plane configuration
● BMC inventory, health, logs, alerting, KVM, virtual media, and support tools
● Redfish discovery, monitoring, event delivery, boot control, and task monitoring
● Firmware inventory and the Cisco UCS C880A M8 Rack Server out-of-band upgrade script
● Direct BIOS policy, host adapter firmware, and storage firmware lifecycle
● Interactive operating system installation and Redfish virtual media, one-time boot, and Preboot Execution Environment (PXE) handoff
● Host, GPU, NVLink, and network validation
● Reversible ConnectX-8 InfiniBand and Ethernet profiles and configuration-dependent ConnectX-7 or BlueField-3 north-south networking
● Host networking-stack selection and Ethernet/RoCE configuration
● Support data collection
2. Configure and verify the BMC
This chapter signs in to the BMC, configures the essential management settings, and checks inventory, health, KVM, virtual media, and power control. Use the BMC web interface throughout the chapter. Redfish equivalents are provided in Appendix D, “Redfish Monitoring and Automation Reference.”
From a management workstation, open https://<bmc-address> and sign in with the active BMC account. Confirm that the dashboard loads and identifies the Cisco UCS C880A M8 Rack Server. Hardware installation, cabling, and initial BMC network configuration are covered by the Cisco UCS C880A M8 Rack Server Installation and Service Guide and Troubleshooting Guide.
2.2 Sign in and confirm platform identity
Open https://<bmc-ip-or-fqdn>/ in a supported browser and sign in with an authorized BMC account. A factory or self-signed certificate can produce a browser warning during initial deployment. Confirm that the certificate was presented by the intended BMC before continuing. Replace it with a site-trusted certificate after DNS and time are configured.
After sign-in, use the dashboard to confirm:
● Product model
● BMC firmware version
● Host power state
● Overall system health
● GPU count
● Active events or pending sensor deassertions
● BMC uptime and recent management access

BMC dashboard summary
Any active critical states must be investigated before firmware maintenance or operating system installation. Use the sensor and event-log workflows in Chapter 2, “Configure and Verify the BMC,” to identify the affected component(s).
2.3 Optional: Adjust BMC network identity and DNS
Use this section when the assigned BMC address, host name, or DNS settings must change. Open Settings > Network and select the page for the setting being changed.

BMC network-configuration areas
1. Configure the assigned IPv4 or IPv6 address, prefix or subnet mask, and default gateway.
2. Set the BMC host name and management Fully Qualified Domain Name (FQDN).
3. Configure the site DNS servers.
4. Select Save or Apply on the active page.
5. Reconnect by using the final management FQDN.
6. From the management workstation, confirm DNS resolution and HTTPS access.
Changing the active address ends the current browser session. Keep a route to the new address before applying the change.
2.4 Configure BMC time and Network Time Protocol (NTP)
Open Settings > Date & Time.
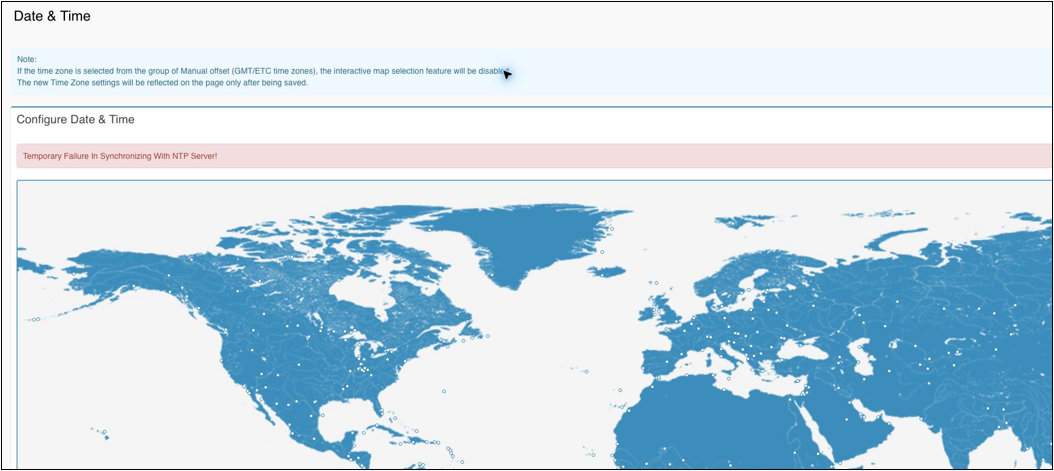
BMC date and time settings
Enable NTP, configure the primary and secondary site NTP servers, and select the site time zone or UTC. Save the settings.
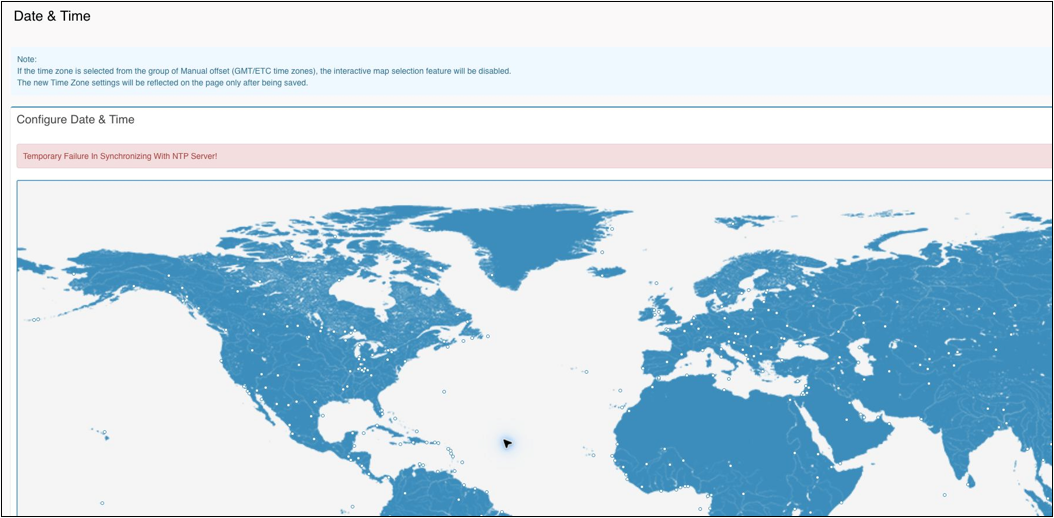
BMC NTP server fields
Refresh the page and confirm that the displayed time is current and both NTP servers remain configured. Section D.8 shows the Redfish readback and ETag-aware update method.
2.5 Optional: Install the BMC Transport Layer Security (TLS) certificate
Open Settings > SSL Settings. The BMC can display the current certificate, generate a certificate request, and upload a replacement certificate.

BMC certificate-management actions
Use a certificate whose subject alternative names include the management FQDN used by administrators and automation. After uploading the certificate:
1. Reconnect to the BMC by the FQDN.
2. Confirm that the certificate chain is trusted.
3. Confirm that the requested FQDN is present in the certificate Subject Alternative Names (SANs).
4. Test Redfish without curl -k.
5. Update automation to require certificate verification.
An IP address connection can still report a name mismatch when the certificate contains only DNS names. Prefer the management FQDN after the certificate is deployed.
2.6 Configure accounts and management services
Open Settings > User Management.
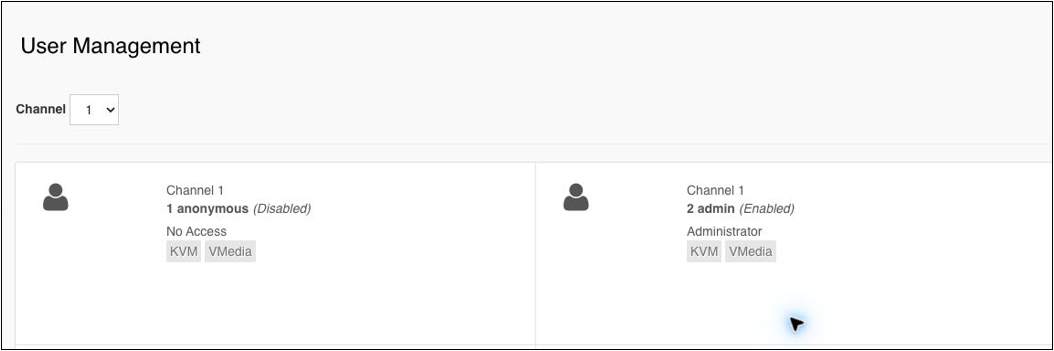
BMC user-management page
Select an available user slot, enable the account, enter the user name, assign the required role, and select Save. Reopen the slot and confirm the account name, enabled state, and role. Create the accounts required by the operating model before the server enters service.
Open Settings > Services.
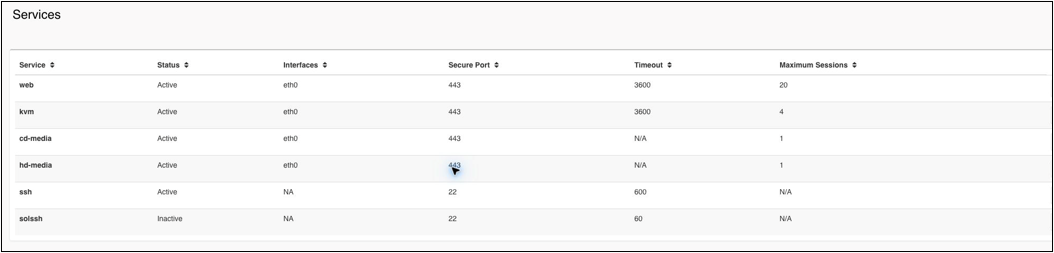
BMC network services and secure ports
Confirm that HTTPS, KVM, virtual media, and Redfish are available on the management network. Enable Secure Shell (SSH) or Serial over LAN (SOL) only when the operating model uses them. Save any change, reload the page, and test each required service from the management workstation.
Optional: Test Serial over LAN
If the deployment uses Serial over LAN, install ipmitool on the Ubuntu management workstation and confirm the BMC channel:
| sudo apt-get update sudo apt-get install -y ipmitool ipmitool -V
export IPMI_PASSWORD ipmitool -I lanplus -H <bmc-address> -U <bmc-user> -E sol info 1 |
Sample output:
| Enabled : true Volatile Bit Rate : 115.2 Non-Volatile Bit Rate: 115.2 Character Send Threshold: 96 Payload Port : 623 |
After the Ubuntu serial console is configured in Section 10.6, connect to it:
| ipmitool -I lanplus -H <bmc-address> -U <bmc-user> -E sol activate |
Expected session start:
| [SOL Session operational. Use ~? for help] |
Press ~. to close the SOL session.
The BMC firewall is under Settings > Firewall. Apply a firewall rule only after the required administrator, monitoring, DNS, NTP, and alerting source addresses have been identified.
2.7 Review inventory, sensors, and logs
Open Server Health > System Inventory and review the available categories:
● System
● Processor
● Memory controller
● Base board
● Power
● Thermal
● PCIe function
● Storage
● Network
Confirm that the expected processor count, memory population, storage devices, PCIe functions, and network devices are present.
Open Server Health > FRU Information to inspect Field-Replaceable Units (FRU).
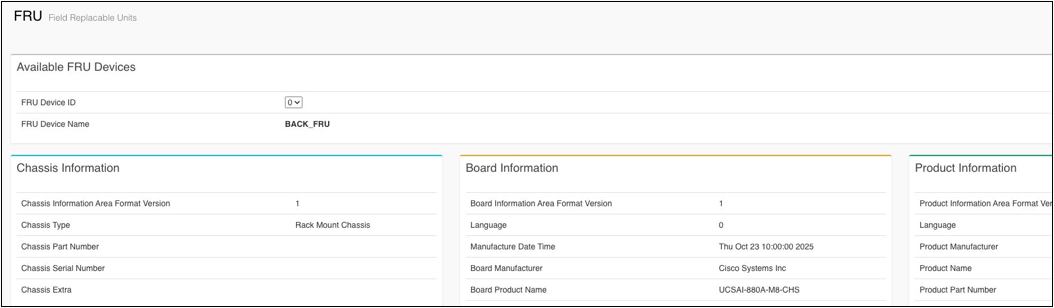
FRU inventory categories
Open Server Health > GPU Information to confirm that all eight GPU entries are present and report the expected model.
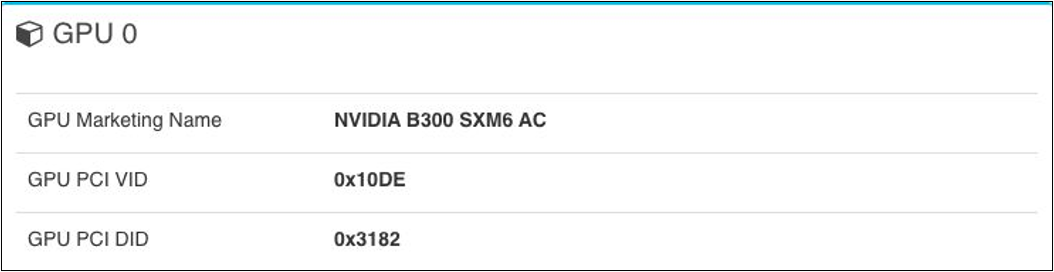
GPU inventory summary
Open Server Health > Sensor to inspect environmental and state sensors. Filter the table by status or sensor type and review:
● Temperature
● Fan speed and fan presence
● Power-supply presence, power-good state, and output
● Voltage and energy readings
● Thermal-limit and throttling indicators
● Component-presence signals
Use the dashboard for the first health summary, then use the sensor table and event log to find the source of a warning or critical state. A discrete sensor can report state rather than a numeric reading. A disabled sensor is not equivalent to a healthy measured value.
The Server Health > Event Log page provides severity, event, sensor, and time filters.
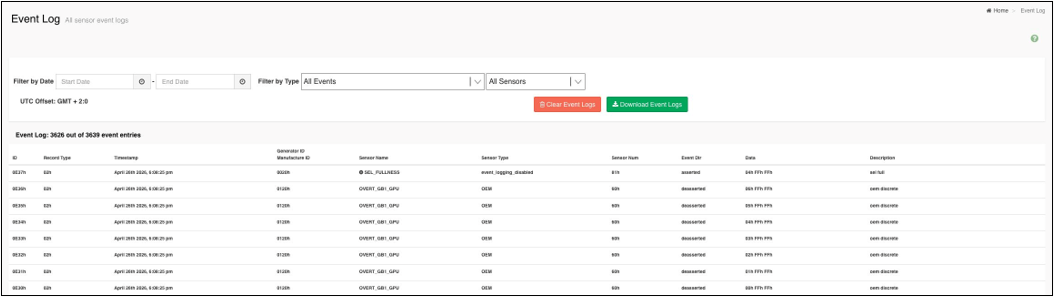
BMC event-log filters and export controls
Use the log sources shown in the following table together.
Table 2. Logs and their primary uses
| Log |
Primary use |
| Event log or SEL |
Hardware assertions, deassertions, power, thermal, and platform events |
| System log |
BMC services and management-plane activity |
| Audit log |
Authentication and administrator actions |
| BIOS log |
POST and BIOS activity |
| HGX event and journal logs |
HGX platform and GPU-baseboard events |
Download relevant logs before clearing them. Clearing a log is a state-changing action and can remove evidence required by Cisco TAC.
The system log controls support date and event filters.

System log filters
The audit log can be filtered and downloaded for security and change review.

Audit log filters and export controls
2.8 Verify KVM and virtual media
Open Remote Control. The page provides the HTML5 KVM viewer and Serial over LAN entry points.
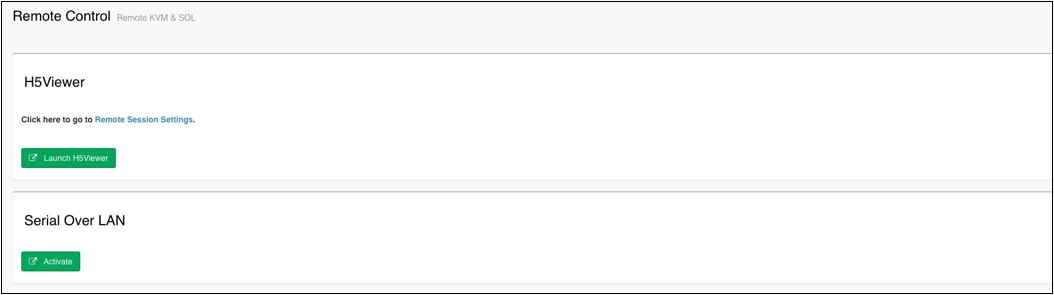
BMC remote-control options
Use the HTML5 viewer for:
● BIOS and POST observation
● One-time boot-menu selection
● Interactive operating system installation
● Virtual CD/DVD and hard-disk media
● Keyboard macros and special key sequences
● Console screenshots or recordings approved by the site
Before a maintenance window, launch KVM and confirm that video and keyboard input work. Close inactive KVM sessions when they are no longer needed. Review Settings > Media Redirection > Remote Session when keyboard layout, attach mode, reconnect behavior, or monitor behavior must be changed.
Open Settings > Media Redirection. The available pages include general remote-media support, virtual media instance limits, remote session settings, and active redirections.

Media redirection settings
Enable remote-media support before attempting to insert an ISO.
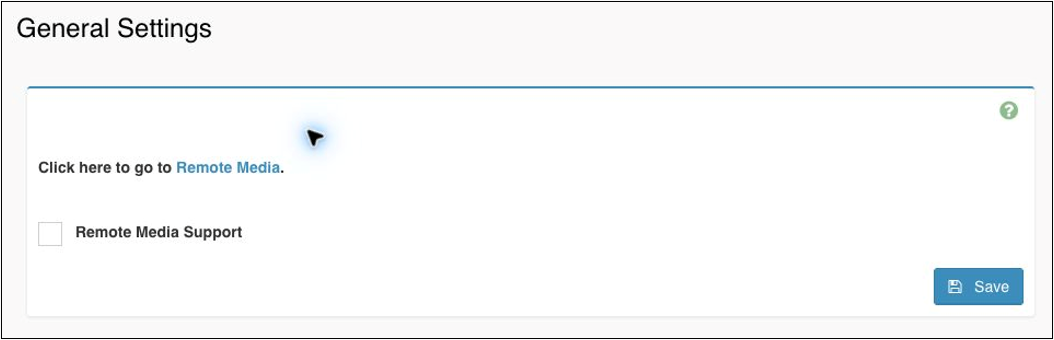
Remote Media Support setting
The settings page supports one CD/DVD instance, one hard disk instance, one remote KVM CD/DVD instance, and one remote KVM hard disk instance. Wait for the page to finish processing before interpreting the displayed values; the counters can briefly display zero while data is loading.
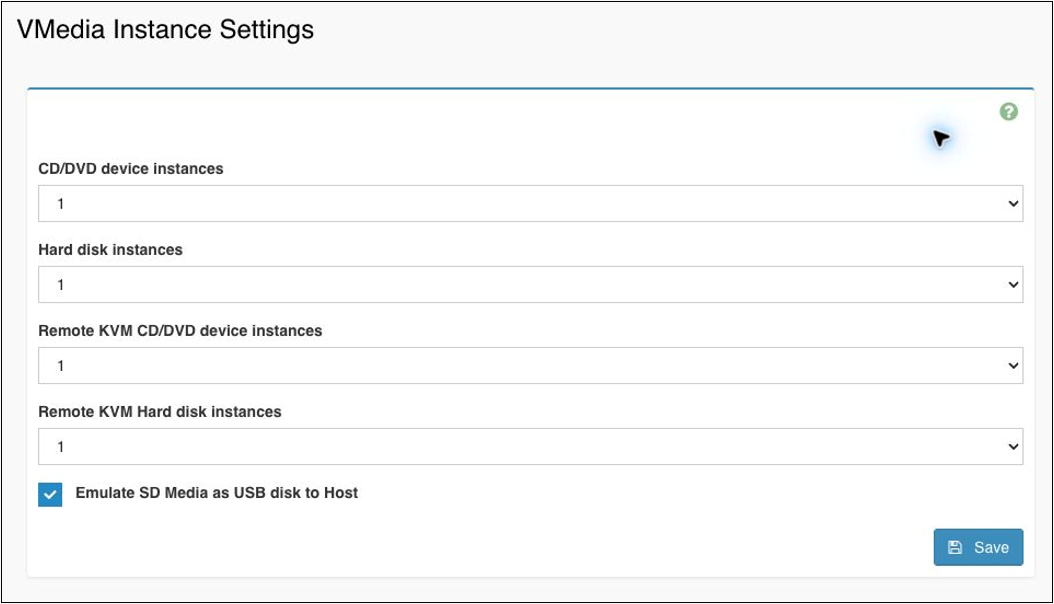
Virtual media instance settings
Use Active Redirections to verify whether media is currently attached before starting a new session or disabling remote-media support.

Active media redirection sessions
Open Power Control to view the host state and available actions.
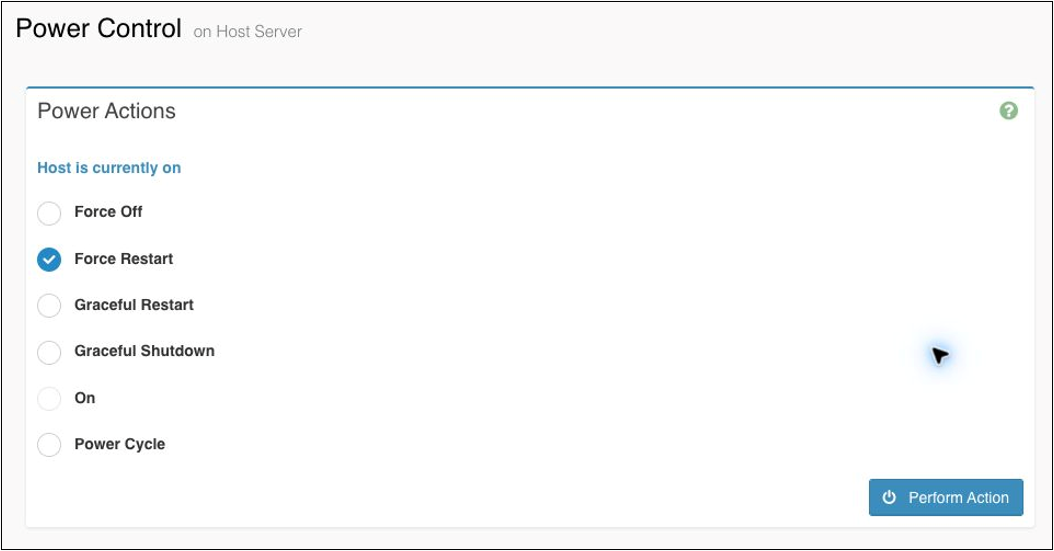
Host power control actions
The available choices can include:
● Force Off
● Force Restart
● Graceful Restart
● Graceful Shutdown
● On
● Power Cycle
Use the action required by the current procedure. Firmware activation can require a host power cycle or full power removal and restoration; follow the firmware bundle instructions.
Continue when the model and installed inventory are correct, all eight GPUs are present, no unexplained critical condition is active, BMC time is correct, KVM accepts input, virtual media is available, and the expected power actions are visible. Resolve hardware or sensor faults before the firmware upgrade.
This chapter uses the Cisco UCS C880A M8 Rack Server firmware bundle and its upgrade script to discover the installed versions, update the required components, and verify the running firmware after activation. The procedure was tested with BMC firmware 4.0(1.260014).
3.1 Select the firmware bundle
Download the C880A M8 bundle selected for the deployment from Cisco Software Download. Read the bundle release notes and the upgrade script README before starting. Save the bundle filename, checksum, and script version with the upgrade log.
3.2 Prepare the firmware workstation
The upgrade script version 1.1 README requires Python 3, OpenSSL 3.2 or later, and the Python requests, prettytable, and urllib3 packages. Run this preflight before connecting the script to a server:
| python3 --version openssl version sha256sum ucs-c880a-m8-upgrade-v1.1.py <firmware-bundle.tar.gz>
python3 -m venv .venv-c880a-upgrade source .venv-c880a-upgrade/bin/activate python3 -m pip install --upgrade pip python3 -m pip install requests prettytable urllib3 python3 - <<'PY' import requests, prettytable, urllib3 print("Python package imports: OK") PY |
Pass is indicated when Python 3 is active, openssl version reports 3.2 or later, both checksums match the files approved for the change, and the import test prints Python package imports: OK. If the workstation OpenSSL version is earlier than 3.2, use a management workstation that meets the upgrade script README requirement.
3.3 Check pre-update health and inventory
Open Firmware Inventory and save the displayed platform and HGX component versions. Also capture the dashboard health state, active conditions, event log, and current host power state.
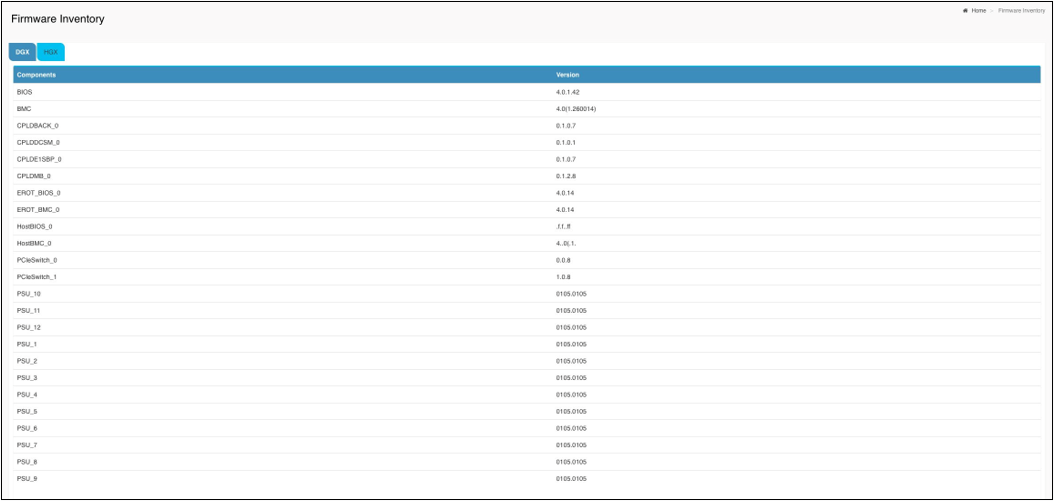
BMC platform firmware inventory
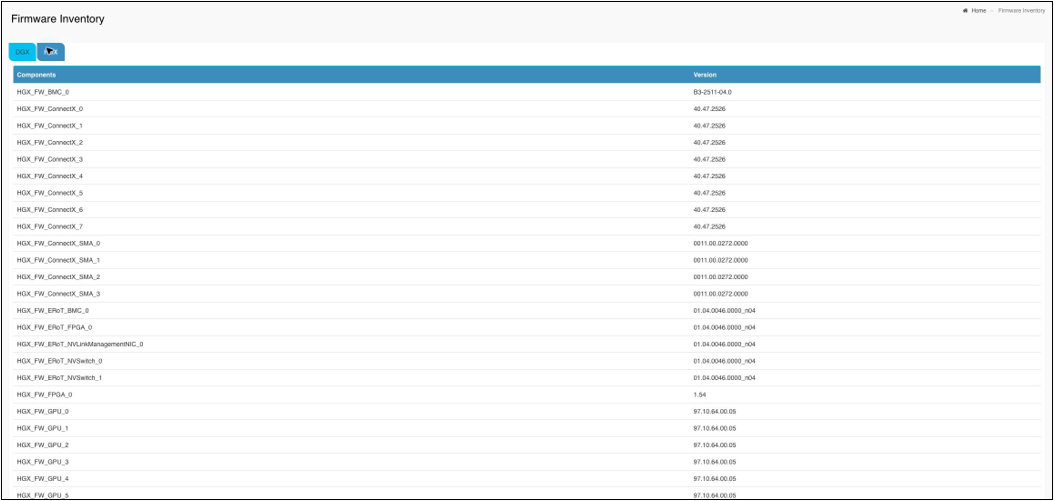
BMC HGX firmware inventory
The discovery command in Section 3.5 supplies the script-side inventory. The optional Redfish inventory procedure is in Section D.3.
3.4 Review the BMC update controls
Open Maintenance > Firmware Update.
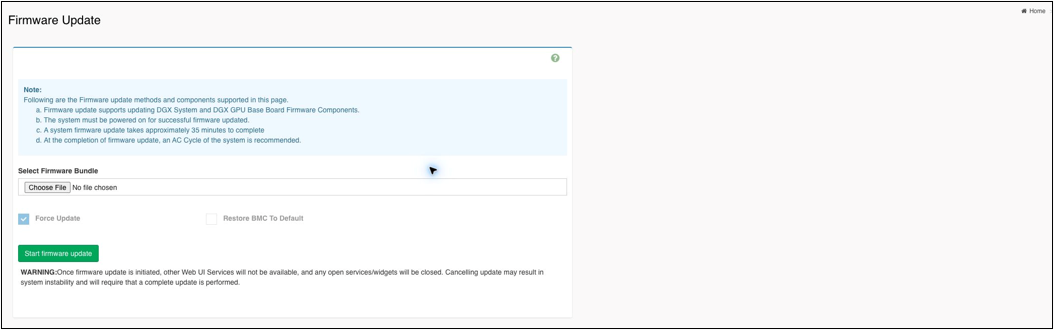
BMC Firmware Update entry page
The Firmware Update page supports server platform and GPU baseboard component images. The selected image, force-update option, restore-default option, target component, host power requirement, and activation requirement must match the Cisco bundle instructions.
Uploading or starting an update is disruptive. Do not use this page merely to test connectivity.
3.5 Run discovery and approve the target
| python3 ucs-c880a-m8-upgrade-v1.1.py \ -B <firmware-bundle.tar.gz> \ -U <bmc-user> \ -P '<bmc-password>' \ -I <bmc-ip-or-fqdn> \ -D |
The script's documented discovery output includes these stages and fields:
| Extracting firmware bundle... success Validating BMC login details... success Inventory started... success
Product Name : <configured-C880A-product-id> Host Power State : On GPU Model : NVIDIA B300 SXM6 AC
Component Running FW version Packaged FW version Update Required BMC 4.0(1.260014) 4.0(1.260014) No BIOS 4.0.1.42 4.0.1.42 No GPU <running-version> <packaged-version> Yes ... Inventory completed successfully |
Review the discovered product, host power state, GPU model, running versions, packaged versions, and Update Required result. Do not continue if the model, bundle, or firmware inventory does not match the intended target.
3.6 Run the update and activation cycles
Run an approved update:
| python3 ucs-c880a-m8-upgrade-v1.1.py \ -B <firmware-bundle.tar.gz> \ -U <bmc-user> \ -P '<bmc-password>' \ -I <bmc-ip-or-fqdn> \ -F |
Expected progress, abridged:
| The following component update(s) require power cycle for activation: Host power cycle : GPU/BIOS Full power cycle : <components-requiring-full-power-cycle> Do you want to proceed with the firmware update? [y/N]:
Component Update Required Update Status Update Percentage BMC Yes Completed 100 BIOS Yes Completed 100 GPU Yes Completed 100 ... |
The exact component list and activation requirements come from the selected bundle. Every required component must finish with Completed and 100, and the post-activation discovery must report the packaged versions as running.
The script can require:
● Host power cycling for BIOS and GPU activation
● Full power cycling for selected Complex Programmable Logic Device (CPLD) and ERoT activation
● Temporary loss of BMC HTTPS access
● Additional time for BIOS POST after activation
Use --skip-power-cycle-confirmation only in a separately approved, unattended maintenance workflow that has equivalent preflight and failure controls.
Run discovery again after the final activation cycle. Confirm that every updated component reports the intended running version, platform health is normal, and the host completes POST without a firmware-related fault.
If a component fails, remains staged, or disappears from inventory, stop the rollout. Include the upgrade script support archive, task history, and firmware inventory in the Cisco support case.
Use the same discovery, approval, update, activation, and verification sequence for each server. The supplied upgrade script accepts one target at a time, so a fleet wrapper should run one isolated process per BMC and preserve the exit status and output for that target. Limit concurrency to the capacity of the management network and maintenance window.
Create bmc-targets.txt with one BMC address or FQDN per line, then run:
| set -o pipefail
FIRMWARE_BUNDLE=<firmware-bundle.tar.gz> BMC_USER=<bmc-user> BMC_PASSWORD='<bmc-password>' LOG_DIR="$PWD/c880a-firmware-$(date -u +%Y%m%dT%H%M%SZ)" mkdir -p "$LOG_DIR"
while IFS= read -r BMC; do [ -n "$BMC" ] || continue
python3 ucs-c880a-m8-upgrade-v1.1.py \ -B "$FIRMWARE_BUNDLE" \ -U "$BMC_USER" \ -P "$BMC_PASSWORD" \ -I "$BMC" \ -D 2>&1 | tee "$LOG_DIR/$BMC-discovery-before.log" [ "${PIPESTATUS[0]}" -eq 0 ] || exit 1
python3 ucs-c880a-m8-upgrade-v1.1.py \ -B "$FIRMWARE_BUNDLE" \ -U "$BMC_USER" \ -P "$BMC_PASSWORD" \ -I "$BMC" \ -F 2>&1 | tee "$LOG_DIR/$BMC-update.log" [ "${PIPESTATUS[0]}" -eq 0 ] || exit 1
python3 ucs-c880a-m8-upgrade-v1.1.py \ -B "$FIRMWARE_BUNDLE" \ -U "$BMC_USER" \ -P "$BMC_PASSWORD" \ -I "$BMC" \ -D 2>&1 | tee "$LOG_DIR/$BMC-discovery-after.log" [ "${PIPESTATUS[0]}" -eq 0 ] || exit 1 done < bmc-targets.txt |
Expected result: Each target completes discovery, update, activation, and post-update discovery before the wrapper starts the next target. The wrapper stops at the first nonzero script exit.
4. Install the operating system
This chapter installs Ubuntu Server 24.04 LTS from CIFS-backed BMC remote media and the HTML5 KVM. Appendix D covers Redfish virtual media and PXE automation. If an HTTPS repository does not mount, use Section 11.1.
4.1 Prepare the CIFS image repository
1. Copy the supported Ubuntu Server 24.04 LTS ISO to a CIFS share reachable from the BMC management network.
2. Verify the ISO checksum against the value published by the image provider.
3. Verify that the filename identifies an amd64 or x86_64 image.
4. Create or select a read-only repository account.
5. Confirm name resolution, routing, and firewall access between the BMC and the CIFS server.
6. Have the CIFS server address, share and image path, and optional domain ready for the BMC form.
1. Sign in to the BMC.
2. Open Image Redirection.
3. Select Remote Images.
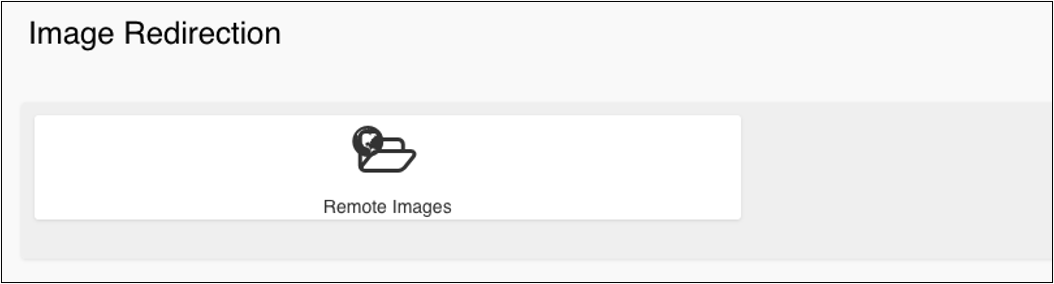
Remote Images entry point
4. Open Media General Settings.
5. Enable Remote Media Support.
6. In Server Address for CD/DVD Images, enter the CIFS server IP address or resolvable name.
7. In Path in server, enter the share and directory that contain the ISO.
8. Under Share Type for CD/DVD, select cifs.
9. Enter the domain when the repository account requires one.
10. Enter the read-only repository username and password.
11. Set Retry Interval and Retry Count according to site policy.
12. Select Save.
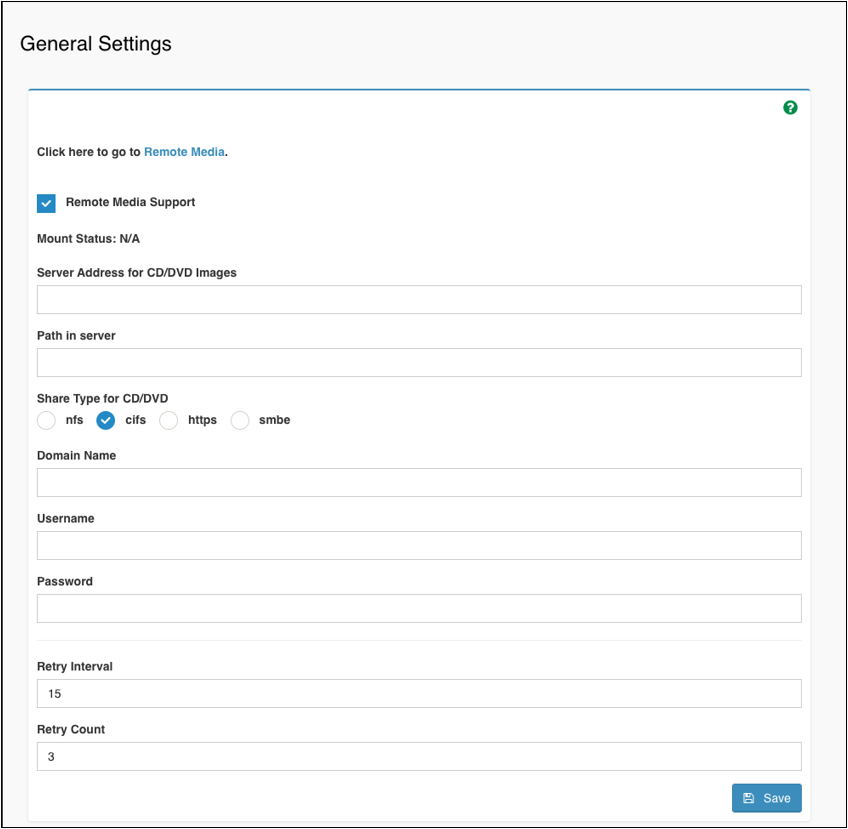
CIFS remote-media settings; repository and account values are masked
13. Follow the Remote Media link.
14. If the expected ISO is not listed, select Refresh Image List.
15. Select the Ubuntu Server 24.04 LTS AMD64 ISO.
16. Select the triangular Play button for the CD/DVD row.

Ubuntu Server ISO selected before starting redirection; unrelated repository entries are masked
17. Wait several seconds for the BMC to start the redirection.
18. If the displayed state does not update, select Sync Image Status.
19. Confirm that Redirection Status reports Started.

CIFS-backed virtual media in the Started state
Continue when Redirection Status reports Started. Keep the repository available until installation has completed and the virtual media has been detached.
4.3 Select the virtual CD/DVD from the boot menu
1. Confirm on the Remote Media page that the CIFS-backed virtual CD/DVD still reports Started.
2. Launch the HTML5 KVM viewer.
3. If the console reports Powered Off, open Power and select On.
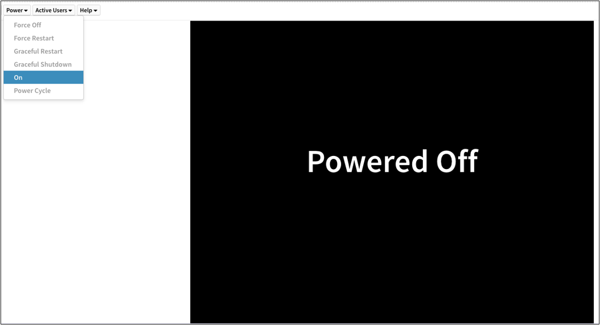
Powering on a server from the HTML5 KVM viewer..
4. If the host is already running, restart or power cycle it from the KVM or the BMC power controls, as described in Section 2.9.
5. When the POST prompt appears, press F7 to open the boot menu.
6. Confirm that the console reports Entering Boot Menu.
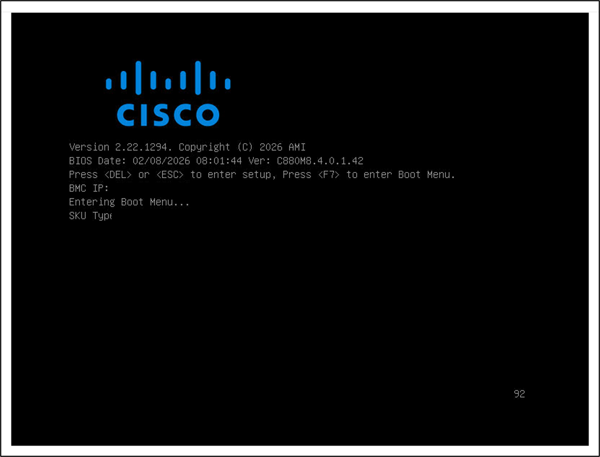
POST confirmation that the boot menu request was accepted
7. Select UEFI: CISCO Virtual CDROM0 1.00.
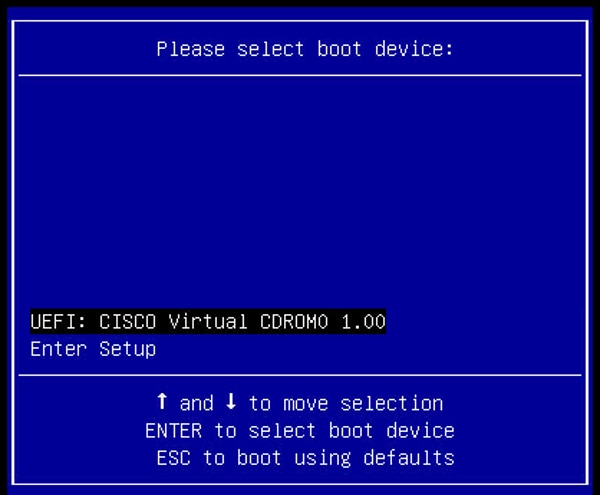
CIFS-backed virtual CD-ROM selected for one-time UEFI boot; unrelated boot entries are masked
8. Press Enter to boot from the virtual CD-ROM.
9. When the GNU GRUB menu appears, select Try or Install Ubuntu Server and press Enter.
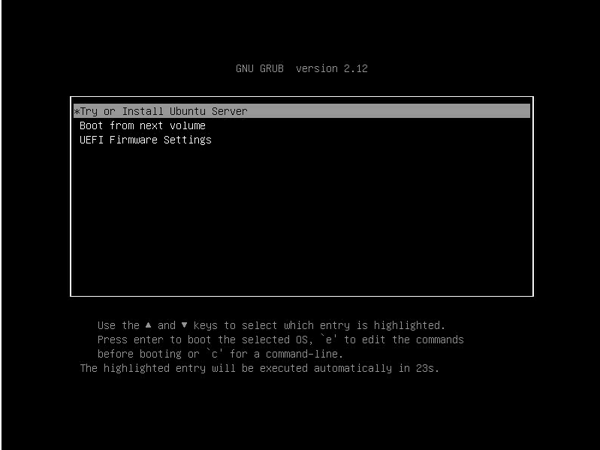
Ubuntu Server installation option in GNU GRUB..
The boot menu selection applies to the current startup only.
4.4 Complete the Ubuntu installation
1. On the welcome screen, select English and press Enter.
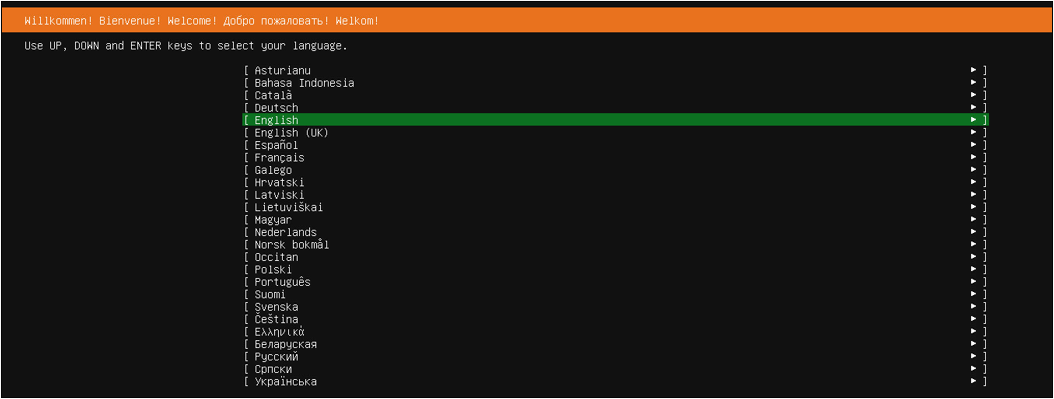
Ubuntu Server installer language selection
2. Select Ubuntu Server.
3. Leave Search for third-party drivers cleared. The GPU and network software are installed explicitly after the base operating system.
4. Select Done.

Standard Ubuntu Server installation selected.
5. On the Network configuration screen, identify the connected management interface from the site cabling plan. In the screen shown, the first Intel X710 10GBASE-T port appeared as enp88s0f0np0.
6. Edit the interface, set IPv4 Method to Manual, and enter the site-assigned values:
● Subnet:
● Address:
● Gateway:
● Name servers:
● Search domains: The site search domain, or leave blank when none is required
7. Select Save, verify that the interface reports the intended address, and then select Done.
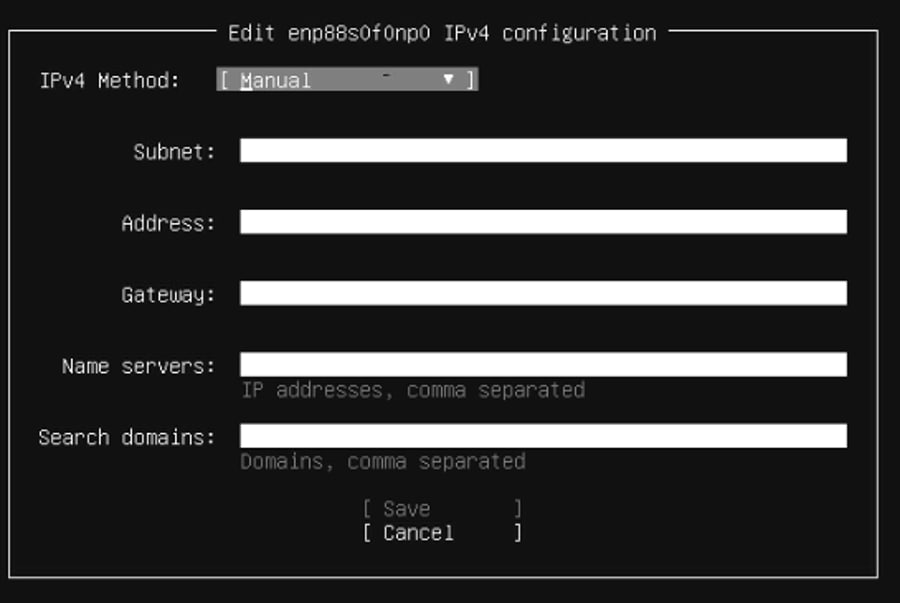
Manual IPv4 configuration for the host management interface
If archive-mirror validation reports that a release file is not valid yet, verify the installer clock before changing repository settings. From Help, open the installer shell and run:
| date -u sudo date -u -s '<YYYY-MM-DD HH:MM:SS>' date -u exit |
Expected output, generalized:
| <current-day> <current-month> <current-date> <current-HH:MM:SS> UTC <current-year> |
The first date -u can show an incorrect value. The final value must match current UTC closely enough for repository metadata and TLS validation.
Enter the current UTC date and time, return to the mirror screen, and retry validation. After the installation, configure the approved site NTP sources and confirm that the operating system clock is synchronized.
Confirm that the installer reports This mirror location passed tests, and then select Done.
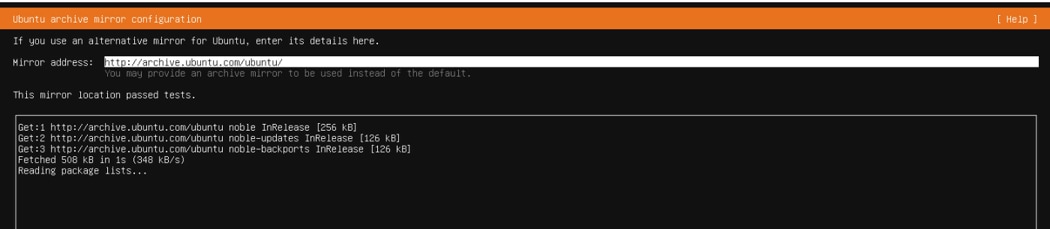
Successful Ubuntu archive mirror validation
If the installer offers to update itself, follow the site deployment policy. For this procedure, select Continue without updating so that the installation remains tied to the installer supplied by the selected Ubuntu Server media.
On the Guided storage configuration screen:
1. Select Use an entire disk and confirm that the intended boot device is selected. For the standard redundant boot layout, select the logical device provided by the two 960-GB M.2 SATA drives and the Cisco boot-optimized RAID controller.
2. Leave Set up this disk as an LVM group selected.
3. For this procedure, leave LUKS encryption cleared.
4. Select Done to generate the proposed file system layout. Review the layout before confirming the destructive storage operation.
Caution: Using an entire disk removes the existing data and partition layout from the selected disk. Before continuing, verify the device, capacity, and intended data-retention outcome.
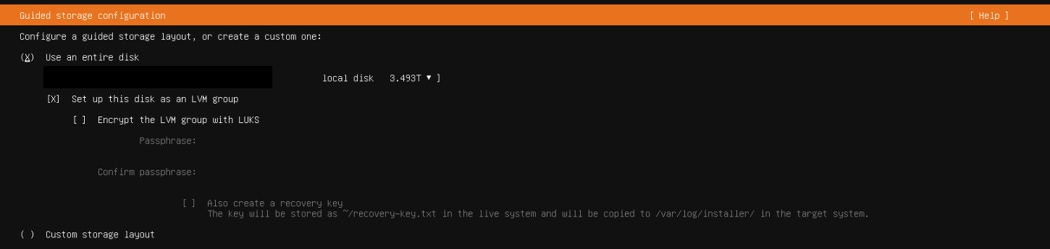
Entire-disk guided storage with LVM selected; the drive identifier is masked
This layout is an installation example, not a storage requirement. Select a different boot device or Custom storage layout when that is part of the deployment design.
With guided LVM, the installer can allocate only part of the volume group to the root logical volume and leave the remaining space free in the volume group. Verify the displayed root capacity. If it does not meet the deployment requirement, edit the logical-volume size, use a custom layout, or plan and document a post-install extension before accepting the storage changes.
This procedure accepts the generated 100 GB root logical volume and leaves the remaining volume-group capacity free for later allocation.
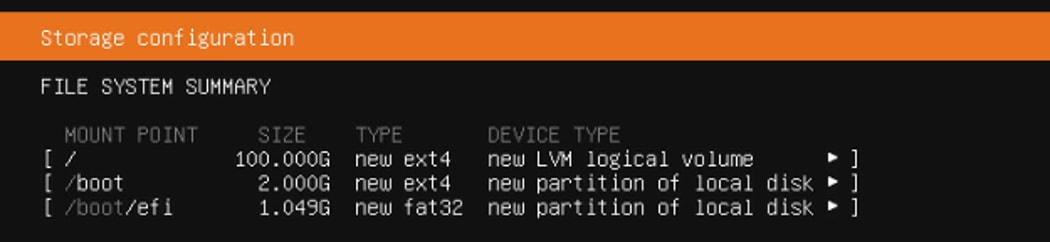
Generated file system summary for the accepted guided LVM layout
At the Confirm destructive action dialog, verify that:
● The intended installation disk is selected
● Required data has been backed up or is no longer needed
● The proposed file system layout is acceptable
Select Continue to format the selected disk and begin installation. The installer does not allow a return to the storage screens after this point.
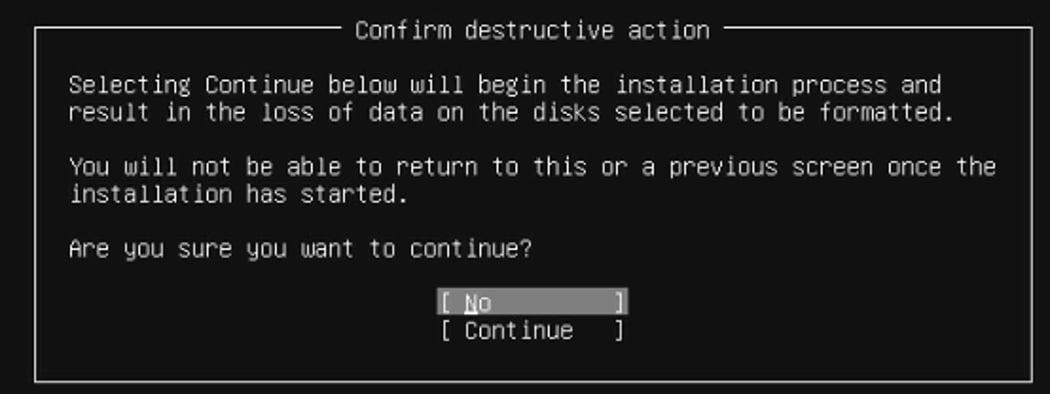
Final confirmation before the installer formats the selected disk
On the Profile configuration screen:
1. Enter the user's friendly name.
2. Enter the server hostname.
3. Enter the Linux username.
4. Enter and confirm the password.
5. Select Done.
The installer uses this password for local login and sudo.
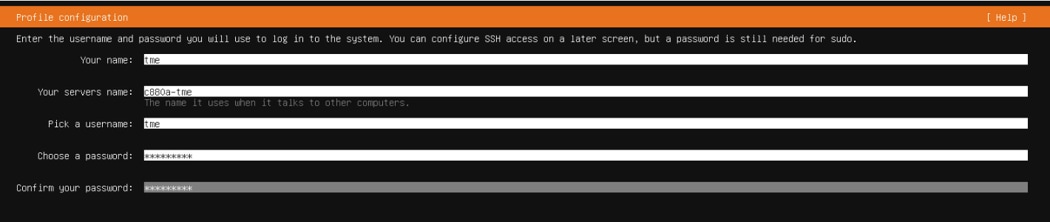
Local administrator profile; password values are masked by the installer..
On the SSH configuration screen, select Install OpenSSH server when the deployment requires remote command-line administration. The host-shell commands in the following chapters can also be run from the KVM console. This procedure installs OpenSSH and does not import an SSH key during installation.
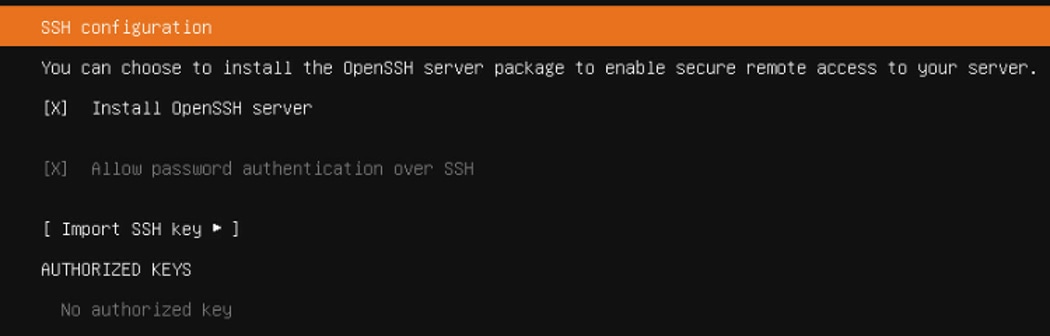
Optional OpenSSH server selected for remote administration
Allow the installer to configure storage, extract the operating system image, install packages, and configure the boot loader.
When the installer reports Installation complete!, allow the security update phase to finish. Do not select Cancel update and reboot unless the deployment procedure explicitly requires updates to be deferred.
When Reboot Now becomes available, the installation and update phases are complete.
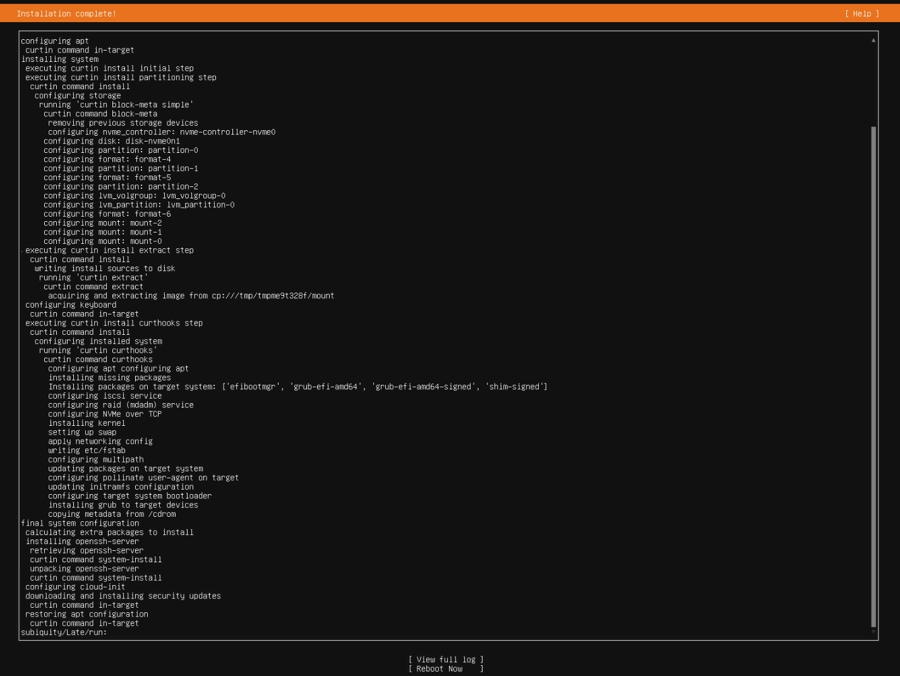
Installation complete and ready to restart
Before restarting:
1. Confirm that the boot loader was installed on the intended local boot device.
2. In the BMC UI, open Image Redirection > Remote Media.
3. Refresh or synchronize the image status. The Ubuntu installer can eject the virtual CD automatically. When this happens, the BMC reports Stopped - Device Ejected.
4. If the image remains active, stop or eject it before continuing.
5. Return to the KVM console and select Reboot Now.
6. Allow the system to boot from local storage.
7. Confirm the login prompt through KVM.

BMC confirmation that the installer ejected the virtual CD
After the restart, confirm that the system reaches the local Ubuntu login prompt. This verifies that the installation media is no longer controlling the boot and that the installed operating system starts from local storage.
Ubuntu login prompt after the first local boot
Press F7 during POST and select the UEFI: PXE IPv4 entry that names the cabled provisioning interface. Confirm the selected Network Interface Card (NIC) by its firmware boot-entry label, Bus:Device:Function (BDF) or MAC address, and cabling record before continuing.
Section D.12 describes the Redfish PXE boundary. BMC firmware 4.0(1.260014) advertises the generic Pxe target and a BootOptions collection, but the override request does not select a specific NIC. Configure the intended NIC in firmware boot order before using the generic Redfish PXE override.
4.6 Final operating system checks
Confirm that the virtual media is stopped or ejected, the server boots from local storage, the Ubuntu login prompt appears, and the selected KVM console or SSH management path is reachable.
5. Configure and verify the host
Use this chapter to update Ubuntu, confirm the installed hardware, and establish the host management path before installing NVIDIA software.
5.1 Verify OS, time, packages, and restart state
| cat /etc/os-release uname -a hostnamectl timedatectl systemctl --failed |
Sample output, abridged:
| PRETTY_NAME="Ubuntu 24.04.4 LTS" Linux <host-name> 6.8.0-136-generic ... Static hostname: <host-name> System clock synchronized: yes NTP service: active
UNIT LOAD ACTIVE SUB systemd-networkd-wait-online.service loaded failed failed |
Installer-generated Dynamic Host Configuration Protocol (DHCP) definitions for disconnected adapters can leave systemd-networkd-wait-online.service failed. Sections 5.4 and 5.5 map the interfaces and correct that condition. The final validation must report 0 loaded units listed.
Confirm that:
● The installed operating system release is supported
● The expected kernel is active
● The production host name is set
● Time synchronization is active
● No unexpected system services have failed
Configure redundant site NTP servers with a systemd-timesyncd drop-in:
| sudo install -d -m 0755 /etc/systemd/timesyncd.conf.d sudo tee /etc/systemd/timesyncd.conf.d/10-site-ntp.conf >/dev/null <<'EOF' [Time] NTP=<ntp-server-1> <ntp-server-2> FallbackNTP= EOF
sudo timedatectl set-ntp true sudo systemctl restart systemd-timesyncd timedatectl show -p NTP -p NTPSynchronized -p Timezone timedatectl timesync-status |
Pass is indicated when NTPSynchronized=yes and timedatectl timesync-status shows an active server.
Sample output:
| NTP=yes NTPSynchronized=yes Server: <ntp-server-address> (<ntp-server-1>) Stratum: 2 Offset: <single-digit milliseconds> Packet count: 3 |
If the site requires an APT proxy, configure it according to local policy. Then update the package index and installed packages:
| sudo apt-get update sudo DEBIAN_FRONTEND=noninteractive apt-get -y upgrade apt list --upgradable sudo apt-get check |
Sample result:
| Listing... Done Reading package lists... Done Building dependency tree... Done Reading state information... Done |
Pass is indicated when apt list --upgradable shows no remaining approved updates and apt-get check completes without dependency errors.
Check whether updated packages require a restart:
| if [ -f /var/run/reboot-required ]; then cat /var/run/reboot-required cat /var/run/reboot-required.pkgs fi |
Expected result: No output means no restart is pending. When a restart is required, the first file reports *** System restart required *** and the second lists the packages that triggered it.
Schedule a controlled restart before installing kernel-coupled GPU or network drivers. After the restart, repeat the operating system, time, package, service, and network checks.
The first restart can take several minutes. Wait for the selected KVM console or SSH management path to return.
After access returns, verify:
| uptime -p who -b uname -r timedatectl apt list --upgradable sudo apt-get check systemctl is-active systemd-timesyncd if systemctl list-unit-files ssh.service --no-legend | grep -q '^ssh.service'; then systemctl is-active ssh fi systemctl --failed test ! -e /var/run/reboot-required && echo 'No reboot is required.' |
Sample post-restart output:
| up <elapsed-time> system boot <date-time> 6.8.0-136-generic System clock synchronized: yes NTP service: active Listing... Done Reading package lists... Done Building dependency tree... Done Reading state information... Done active active 0 loaded units listed. No reboot is required. |
The second active line is present only when OpenSSH was selected during installation.
5.2 Verify CPU, memory, storage, and PCIe inventory
Install the Ubuntu inventory and health utilities:
| sudo apt-get update sudo apt-get install -y \ pciutils \ numactl \ nvme-cli \ smartmontools \ ethtool \ iproute2 \ ibverbs-utils \ infiniband-diags
command -v \ lspci \ numactl \ nvme \ smartctl \ ethtool \ rdma \ ibv_devices \ ibstat |
Expected output: One executable path for every command. On Ubuntu 24.04, rdma and dcb are supplied by iproute2, ibv_devices by ibverbs-utils, and ibstat by infiniband-diags.
| lscpu numactl --hardware free -h lsblk -e7 -o NAME,MODEL,SERIAL,SIZE,TYPE,FSTYPE,MOUNTPOINTS lspci -Dnn |
Expected output structure, abridged:
| Architecture: x86_64 CPU(s): <logical-cpu-count> NUMA node(s): <numa-node-count> Mem: <installed-memory> ... <boot-device> <boot-device-model> <size> disk <efi-partition> <size> part vfat /boot/efi <boot-partition> <size> part ext4 /boot <lvm-partition> <size> part LVM2_member 0000:<bdf> System peripheral: NVIDIA Corporation ... 0000:<bdf> Ethernet controller: NVIDIA Corporation ... |
CPU, memory, Non-Uniform Memory Access (NUMA), storage, and PCIe counts must agree with the purchased configuration and the BMC inventory.
Check the boot and data drives:
| findmnt cat /proc/mdstat sudo nvme list sudo smartctl --scan |
Expected result: findmnt shows the root, boot, and EFI mount points on the selected boot device. /proc/mdstat can report no active arrays when software RAID is not configured. nvme list and smartctl --scan enumerate only the devices visible through their supported management interfaces.
The exact storage tools depend on the configured boot controller and data devices.
5.3 Identify the host management interface
| ip -br link ip -br address ip route lspci -Dnn | grep -Ei 'ethernet|network|infiniband|mellanox|nvidia' |
Expected output, abridged:
| lo UNKNOWN 127.0.0.1/8 ::1/128 enp88s0f0np0 UP <host-ip-address>/<prefix-length> <data-interface> DOWN ... default via <default-gateway> dev enp88s0f0np0 0000:<bdf> Ethernet controller: Intel Corporation Ethernet Controller X710 0000:<bdf> Ethernet controller: Mellanox Technologies / NVIDIA ConnectX-8 0000:<bdf> Network controller: Mellanox Technologies / NVIDIA <configured-North-South-adapter> |
Identify the management interface from its active link, MAC address, PCI BDF address, and cabling plan. Verify the BDF-to-interface mapping in Section 5.4 before configuring production bonds, VLANs, RoCE policy, or data-network addresses.
5.4 Map PCI devices to Linux and RDMA names
Create the read-only interface map before changing Netplan. The PCI BDF joins PCI inventory, Linux interface names, driver information, and RDMA devices.
| lspci -Dnn | grep -Ei \ 'Ethernet|Network|InfiniBand|ConnectX-8|ConnectX-7|BlueField-3|15b3:1023|15b3:1021|15b3:a2dc'
rdma link show
for n in $(find /sys/class/net -maxdepth 1 -type l -exec basename {} \; | grep -E '^(en|ib)'); do printf '\n--- %s ---\n' "$n" ethtool -i "$n" 2>/dev/null | grep -E 'driver|version|firmware-version|bus-info' readlink -f "/sys/class/net/$n/device" done |
Expected output for each managed interface includes driver, firmware version, bus-info, and a sysfs path ending in the same BDF. The server has eight physical ConnectX-8 adapters. The active east-west profile exposes eight or sixteen ConnectX-8 PCI functions. The purchased configuration also has two north-south ConnectX-7, BlueField-3 B3220, or BlueField-3 B3240 cards. Runtime mlx5_X names can change; rediscover them after firmware, driver, or profile changes.
5.5 Complete the Netplan baseline
The Ubuntu installer can generate a DHCP configuration for every adapter it discovers. On a system with many unconnected data ports, this can leave systemd-networkd-wait-online.service failed even though the management interface is routable. Review the generated configuration:
| sudo netplan get networkctl --no-pager systemctl status systemd-networkd-wait-online.service --no-pager |
Sample condition, abridged:
| network: ethernets: enp88s0f0np0: addresses: [<host-ip-address>/<prefix-length>] routes: - to: default via: <default-gateway> <unused-interface>: dhcp4: true
systemd-networkd-wait-online.service: failed |
Use the map created in Section 5.4 to identify the active and unused interfaces.
Remove unintended DHCP configurations or mark unused interfaces optional. Regenerate and validate the Netplan configuration before the next restart. Run the change from KVM or another confirmed recovery session when the management interface is affected.
The following drop-in keeps the installer-generated definitions but prevents nonrequired data interfaces from blocking network-online.target. Include only interfaces that are not required during host startup. Do not include the active management interface:
| sudo tee /etc/netplan/99-data-interfaces-optional.yaml >/dev/null <<'EOF' network: version: 2 ethernets: <optional-data-interface-1>: optional: true <optional-data-interface-2>: optional: true EOF
sudo chmod 0600 /etc/netplan/99-data-interfaces-optional.yaml sudo netplan generate sudo netplan try --timeout 120 sudo systemctl reset-failed systemd-networkd-wait-online.service sudo systemctl restart systemd-networkd-wait-online.service
networkctl status <management-interface> --no-pager systemctl is-active systemd-networkd-wait-online.service systemctl --failed |
Confirm the Netplan prompt only after a second session can reach the host management address. If the test is not confirmed within the timeout, Netplan restores the previous configuration.
Sample result, abridged:
| <management-interface> State: routable (configured) Online state: online
active 0 loaded units listed. |
If an interface will later participate in a bond, VLAN, bridge, storage network, RoCE fabric, or InfiniBand fabric, replace the temporary optional definition with the production network configuration.
5.6 Choose the host networking stack
Check the current driver source and installed networking packages:
| uname -r modinfo -F filename mlx5_core modinfo -F filename mlx5_ib modinfo -F vermagic mlx5_core dpkg-query -W -f='${binary:Package}\t${Version}\n' | grep -E '^(rdma-core|ibverbs|libibverbs|doca|mlnx)' rdma link ibv_devices ibv_devinfo ibstat |
Sample output, abridged:
| Kernel: 6.8.0-136-generic mlx5_core source: Ubuntu in-tree kernel module mlx5_ib source: Ubuntu in-tree kernel module RDMA user space: 50.0 DOCA packages: none installed MLNX_OFED packages: none installed |
Use the Ubuntu inbox stack when it supports the deployment requirements. For new NVIDIA networking deployments that require vendor drivers or DOCA features, use a supported DOCA-Host profile. NVIDIA is transitioning standalone MLNX_OFED to DOCA-OFED; the final standalone MLNX_OFED release remains in long-term support through October 2027.
Confirm the supported operating system, kernel, adapter firmware, and required features before selecting a profile.
Table 3. Uses and scopes of host stacks and profiles
| Host stack or profile |
Use when |
Scope |
| Ubuntu inbox drivers |
The Cisco/NVIDIA support information permits the distribution driver and only supported inbox features are required |
Distribution kernel lifecycle and basic Ethernet/RDMA functions |
| doca-all |
Full BlueField functionality or a mixed BlueField and ConnectX environment is required |
Complete DOCA-Host libraries, drivers, and tools |
| doca-networking |
Accelerated networking is required without the full DOCA library set |
Networking-focused DOCA components |
| doca-ofed |
An MLNX_OFED-like driver and tool experience is required without additional DOCA libraries |
DOCA-packaged OFED drivers and tools |
| doca-roce |
The deployment requires a smaller Ethernet and RoCE package |
RDMA over Ethernet drivers and tools |
| doca-host-basic |
Only basic Ethernet is required and MFT/FW-Updater are intentionally excluded |
Minimal host networking |
Follow the selected profile's installation and transition instructions. After the required restart, repeat the commands above and confirm every expected PCI function, network interface, RDMA device, and firmware version.
Confirm that the supported OS and kernel are active, time is synchronized, approved updates are complete, no restart is pending, no unexpected service is failed, hardware counts match the ordered configuration, every managed interface has a verified BDF mapping, and the management path remains routable.
6. Configure host firmware and adapters
This chapter checks host-managed storage and network adapter firmware, then configures the eight ConnectX-8 east-west adapters for either 8x800-Gb/s InfiniBand or 16x400-Gb/s Ethernet or InfiniBand. North-south procedures depend on whether the server contains ConnectX-7 adapters or BlueField-3 DPUs.
6.1 Install MFT and inventory network adapter firmware
The Cisco out-of-band upgrade workflow does not update the host-managed ConnectX-8 or north-south adapters. On Ubuntu 24.04, enable the NVIDIA CUDA repository and install the NVIDIA firmware tools (MFT):
| sudo apt-get update sudo apt-get install -y curl ca-certificates
curl -fL -o /tmp/cuda-keyring_1.1-1_all.deb \ https://developer.download.nvidia.com/compute/cuda/repos/ubuntu2404/x86_64/cuda-keyring_1.1-1_all.deb sudo dpkg -i /tmp/cuda-keyring_1.1-1_all.deb sudo apt-get update apt-cache policy mft sudo apt-get install -y mft iproute2 ethtool
mlxfwmanager --version mlxconfig -v devlink -Version ethtool --version |
Sample package source, abridged:
| mft: Installed: 4.35.0.159-1 Candidate: 4.35.0.159-1 4.35.0.159-1 600 https://developer.download.nvidia.com/compute/cuda/repos/ubuntu2404/x86_64 |
MFT 4.35.0.159-1 supplies mlxfwmanager, mlxconfig, mlxlink, and the Mellanox software tools (mst) service and command. mst exposes supported devices to MFT utilities. The iproute2 package supplies devlink.
Query adapter firmware and the exact parameter set IDs (PSIDs) from the operating system. A PSID identifies the board-specific firmware package for an adapter:
| sudo mlxfwmanager --query |
Table 4. Expected firmware and PSID inventory
| Device population |
Expected count |
Check |
| ConnectX-8 C8180P |
8 |
Exact PSID and running firmware are listed |
| ConnectX-7, 2x200 Gb/s |
2 when configured |
Exact product, PSID, and running firmware are listed |
| BlueField-3 B3220, 2x200 Gb/s |
2 when configured |
Exact product, PSID, and running firmware are listed |
| BlueField-3 B3240, 2x400 Gb/s |
2 when configured |
Exact product, PSID, and running firmware are listed |
For each physical device:
1. Check mlxfwmanager --query, devlink dev info, ethtool -i, and the corresponding mlxconfig -e ... q output.
2. Obtain the firmware image from the Cisco approved bundle or the NVIDIA package explicitly approved for the C880A M8.
3. Confirm the device type, exact PSID, image PSID, current firmware, target firmware, and activation requirement.
4. Stop workloads and preserve out-of-band management.
5. Update one adapter population at a time.
6. Perform the specified adapter reset, host restart, or complete power cycle.
7. Re-query every physical device and validate the link mode, PCI enumeration, driver binding, interface mapping, and health.
Use an exact-PSID update pattern:
| sudo mlxfwmanager \ --dev <pci-bdf> \ --query
sudo mlxfwmanager \ --image-file <approved-firmware-image> \ --list-content
sudo mlxfwmanager \ --dev <pci-bdf> \ --image-file <approved-firmware-image> \ --update \ --log \ --log-file <adapter-update-log> |
Expected preflight result: The utility identifies the intended device and the image listing includes the expected device PSID. Do not run --update when the image is absent, the PSID differs, or the approved release instructions do not identify the device.
The host can also expose ConnectX-7 functions used by the internal HGX fabric path. On a ConnectX-7 north-south configuration, two additional external ConnectX-7 2x200-Gb/s cards are present. Use the product description, PSID, advertised port capability, and purchased configuration to distinguish them from the internal functions. Include the external cards in the north-south adapter update and validation workflow; leave the internal HGX functions with the HGX software and firmware stack.
6.2 Inventory and update host storage firmware
Install the NVMe and SMART management utilities:
| sudo apt-get update sudo apt-get install -y nvme-cli smartmontools nvme version smartctl --version | head -n 1 |
Expected result: APT installs or confirms both utilities and the version commands complete successfully.
Capture model, running firmware, firmware slots, SMART state, and error logs:
| sudo nvme list
for d in /dev/nvme[0-9]; do sudo nvme id-ctrl "$d" | grep -E '^(mn|fr|sn)' sudo nvme smart-log "$d" sudo nvme fw-log "$d" sudo nvme error-log "$d" --log-entries=8 done
sudo smartctl --scan sudo smartctl -a /dev/<sata-device> |
Sample NVMe result, sanitized:
| Device count: 8 Model: Micron 3.84-TB E1.S NVMe Firmware: F3MU011 Active firmware slot: 1 Critical warning: 0 Temperature: 25 to 26 C Media errors: 0 Error-log entries: 0 |
Expected result: Each selected SATA device reports SMART overall health PASSED and no reallocated, pending, or offline-uncorrectable sectors.
Use only a Cisco approved host firmware bundle or a vendor package identified for the exact model. Before an update, back up data, stop I/O, and confirm redundancy, device identity, and the active firmware slot. Follow the package instructions for download, commit, activation, and restart; do not infer a slot or activation action from another NVMe model.
When the approved package explicitly uses the standard NVMe interface, its workflow has this form:
| sudo nvme fw-download /dev/<nvme-controller> \ --fw <approved-nvme-firmware-image> \ --progress
sudo nvme fw-commit /dev/<nvme-controller> \ --slot <approved-slot> \ --action <approved-action> |
Expected result: Download reaches 100 percent and commit reports successful firmware activation or the reset/power action required to activate it. The slot and action values are model- and package-specific. Do not substitute example numbers.
After activation, repeat nvme id-ctrl, nvme fw-log, nvme smart-log, and nvme error-log. Acceptance requires the approved active firmware, zero critical warnings, no new media error, and no unexplained error log entry.
6.3 Discover the east-west and north-south adapters
Discover the first PCI function (.0) of each of the eight physical ConnectX-8 adapters and query the complete adapter inventory:
| mapfile -t CX8_DEVICES < <( lspci -Dnn | awk '/ConnectX-8|15b3:1023/ && $1 ~ /\.0$/ {print $1}' ) mapfile -t BLUEFIELD_DEVICES < <( lspci -Dnn | awk '/15b3:a2dc/ && $1 ~ /\.0$/ {print $1}' )
printf 'ConnectX-8 physical adapters: %s\n' "${#CX8_DEVICES[@]}" printf 'BlueField-3 physical devices (.0 functions): %s\n' \ "${#BLUEFIELD_DEVICES[@]}" test "${#CX8_DEVICES[@]}" -eq 8 sudo mlxfwmanager --query
for d in "${CX8_DEVICES[@]}"; do printf '\n=== ConnectX-8 %s ===\n' "$d" sudo mlxconfig -e -d "$d" q \ LINK_TYPE_P1 NUM_OF_PLANES_P1 NUM_OF_PF \ 'MODULE_SPLIT_M0[0..15]' done
if ((${#BLUEFIELD_DEVICES[@]})); then test "${#BLUEFIELD_DEVICES[@]}" -eq 2 for d in "${BLUEFIELD_DEVICES[@]}"; do printf '\n=== BlueField-3 %s ===\n' "$d" sudo mlxconfig -e -d "$d" q | grep -E \ 'INTERNAL_CPU_(MODEL|OFFLOAD_ENGINE|ESWITCH_MANAGER|PAGE_SUPPLIER|IB_VPORT0|RSHIM)|LINK_TYPE_P[12]|ROCE_CONTROL|SRIOV_EN|NUM_OF_VFS' done fi |
If the server has ConnectX-7 north-south cards, confirm that mlxfwmanager --query lists two external 2x200-Gb/s cards with the expected PSIDs. If the server has BlueField-3, the command must list two B3220 or two B3240 devices.
Sample prechange state from a BlueField-3 configuration:
| ConnectX-8 physical adapters: 8 BlueField-3 physical devices (.0 functions): 2 LINK_TYPE_P1 Current ETH(2) Next Boot ETH(2) NUM_OF_PLANES_P1 Current 0 Next Boot 0 NUM_OF_PF Current 2 Next Boot 2 |
Use the discovered arrays in the commands that follow.
6.4 Select the ConnectX-8 profile
Choose the profile required by the deployment network design before running any mlxconfig set or mlxconfig reset command.
Table 5. Choosing a procedure for the ConnectX-8 profile
| Selected profile |
Per adapter |
Server aggregate |
Section containing procedure |
| InfiniBand |
1x800 Gb/s InfiniBand |
8x800 Gb/s InfiniBand |
6.6.1 |
| Dual-port Ethernet or InfiniBand |
2x400 Gb/s |
16x400 Gb/s Ethernet or InfiniBand |
6.6.2 |
If the current and next-boot values already match the selected profile, do not stage a change. Otherwise, create the backup in the next section and run only the matching procedure below.
The 800-Gb/s InfiniBand profile is the firmware default for the NVIDIA ConnectX-8 C8180P OCP 3.0 adapter used in this server. In the 16x400-Gb/s profile, a deployment can use all sixteen interfaces as two planes or use the odd or even interfaces as one plane.
6.5 Back up ConnectX-8 NVConfig
NVConfig is the nonvolatile adapter configuration that controls settings such as link protocol, port split, and PCI functions.
Create and verify a backup immediately before the first profile change:
| backup_dir="$PWD/cx8-nvconfig-backup-$(date -u +%Y%m%dT%H%M%SZ)" install -d -m 0700 "$backup_dir"
for d in "${CX8_DEVICES[@]}"; do safe_name=${d//[:.]/_} query_file="$backup_dir/${safe_name}.query.txt" raw_file="$backup_dir/${safe_name}.raw"
sudo mlxconfig -e -d "$d" q >"$query_file" sudo mlxconfig -d "$d" -f "$raw_file" backup test -s "$query_file" test -s "$raw_file" printf '%s\t%s\t%s\n' "$d" "$query_file" "$raw_file" done
find "$backup_dir" -type f -size 0 -print test "$(find "$backup_dir" -name '*.query.txt' | wc -l)" -eq 8 test "$(find "$backup_dir" -name '*.raw' | wc -l)" -eq 8 sha256sum "$backup_dir"/* >"$backup_dir/SHA256SUMS" |
The final find command should print nothing. Both count tests must succeed, and SHA256SUMS must contain one query file and one raw backup for each physical adapter.
6.6 Apply the selected ConnectX-8 profile
Run only the profile selected above. Each change is staged in Next Boot and requires a complete power-off and power-on cycle; an operating system restart is not sufficient.
6.6.1 Keep or return to 8x800-Gb/s InfiniBand
One 800-Gb/s InfiniBand port is the C8180P firmware-default profile. NVIDIA recommends resetting NVConfig to default when leaving a nondefault split.
After creating the backup above, reset each physical adapter through its first PCI function:
| for d in "${CX8_DEVICES[@]}"; do sudo mlxconfig -y -d "$d" reset done |
Expected output for each adapter:
| Applying... Done! |
mlxconfig reset returns all NVConfig values for the selected device to firmware defaults. It is not limited to the link type or split fields. Review the Default, Current, and Next Boot columns before proceeding.
For the documented C8180P profile, the default fields are:
| LINK_TYPE_P1 IB(1) NUM_OF_PLANES_P1 4 NUM_OF_PF 1 MODULE_SPLIT_M0[0..3] 1 MODULE_SPLIT_M0[4..15] FF |
Perform a complete power-off and power-on cycle. Then verify:
| # One function per C8180P adapter; eight functions total lspci -Dnn | grep -Ei 'ConnectX-8|15b3:1023'
mapfile -t CX8_DEVICES < <( lspci -Dnn | awk '/ConnectX-8|15b3:1023/ && $1 ~ /\.0$/ {print $1}' )
for d in "${CX8_DEVICES[@]}"; do sudo mlxconfig -e -d "$d" q \ LINK_TYPE_P1 NUM_OF_PLANES_P1 NUM_OF_PF \ 'MODULE_SPLIT_M0[0..15]' done
ibstat rdma link show sudo mlxlink -d <first-pci-function-bdf> |
Expected result after the power cycle:
| ConnectX-8 PCI functions: 8 LINK_TYPE_P1: IB(1) current and next boot NUM_OF_PLANES_P1: 4 current and next boot NUM_OF_PF: 1 current and next boot |
ibstat, rdma link show, and mlxlink must show the InfiniBand link layer and the expected port state. A production fabric must report the expected negotiated speed and active state.
Confirm the InfiniBand link layer, subnet-manager integration, expected port state, and fabric counters after connecting the host to the deployment fabric.
6.6.2 Apply the 16x400-Gb/s profile
Set the link protocol to 2 for Ethernet or 1 for InfiniBand, then apply the dual-port split to the first PCI function of every C8180P adapter:
| # Ethernet: CX8_LINK_TYPE=2 # InfiniBand: CX8_LINK_TYPE=1 CX8_LINK_TYPE=<1-or-2>
for d in "${CX8_DEVICES[@]}"; do sudo mlxconfig -y -d "$d" set \ LINK_TYPE_P1="$CX8_LINK_TYPE" \ NUM_OF_PLANES_P1=0 \ 'MODULE_SPLIT_M0[0..3]=1' \ 'MODULE_SPLIT_M0[4..7]=2' \ 'MODULE_SPLIT_M0[8..15]=FF' \ NUM_OF_PF=2 done |
Sample output for each changed adapter:
| Applying... Done! |
The command stages Next Boot values. It does not activate the new profile until the required complete power-off and power-on cycle.
Perform a complete host power-off and power-on cycle. An operating system restart alone is not sufficient for this C8180P profile change. Use the BMC power controls described in Section 2.9, confirm that the host reaches the off state, and then power it on.
After the power cycle, verify all eight devices:
| mapfile -t CX8_DEVICES < <( lspci -Dnn | awk '/ConnectX-8|15b3:1023/ && $1 ~ /\.0$/ {print $1}' )
for d in "${CX8_DEVICES[@]}"; do sudo mlxconfig -e -d "$d" q \ LINK_TYPE_P1 NUM_OF_PLANES_P1 NUM_OF_PF \ 'MODULE_SPLIT_M0[0..15]' done
lspci -Dnn | grep -Ei 'ConnectX-8|15b3:1023' devlink port show rdma link show |
Generate a compact aggregate check. First count the PCI functions:
| mapfile -t CX8_FUNCTIONS < <( lspci -Dnn | awk '/ConnectX-8|15b3:1023/ {print $1}' ) mapfile -t CX8_DEVICES < <( printf '%s\n' "${CX8_FUNCTIONS[@]}" | awk '/\.0$/' )
printf 'PCI_FUNCTIONS=%s\n' "${#CX8_FUNCTIONS[@]}" printf 'FUNCTION_ZERO_DEVICES=%s\n' "$( printf '%s\n' "${CX8_FUNCTIONS[@]}" | grep -Ec '\.0$' )" printf 'FUNCTION_ONE_DEVICES=%s\n' "$( printf '%s\n' "${CX8_FUNCTIONS[@]}" | grep -Ec '\.1$' )" |
Count the advertised 400-Gb/s capability and current cable state:
| mlxlink_all=$( for d in "${CX8_FUNCTIONS[@]}"; do sudo mlxlink -d "$d" 2>&1 done )
printf 'MLXLINK_400G_CAPABLE_FUNCTIONS=%s\n' "$( grep -c '400G_4X' <<<"$mlxlink_all" )" printf 'MLXLINK_CABLE_UNPLUGGED_FUNCTIONS=%s\n' "$( grep -c 'Cable is unplugged' <<<"$mlxlink_all" )" |
Count the Current and Next Boot profile values:
| cfg_all=$( for d in "${CX8_DEVICES[@]}"; do sudo mlxconfig -e -d "$d" q \ LINK_TYPE_P1 NUM_OF_PF 'MODULE_SPLIT_M0[0..15]' done )
printf 'MLXCONFIG_ETH_CURRENT_NEXT_ADAPTERS=%s\n' "$( awk '$1 == "LINK_TYPE_P1" && $(NF-1) == "ETH(2)" && $NF == "ETH(2)" {n++} END {print n+0}' <<<"$cfg_all" )" printf 'MLXCONFIG_TWO_PF_CURRENT_NEXT_ADAPTERS=%s\n' "$( awk '$1 == "NUM_OF_PF" && $(NF-1) == "2" && $NF == "2" {n++} END {print n+0}' <<<"$cfg_all" )" printf 'MLXCONFIG_LANES_4_TO_7_SPLIT_CURRENT_NEXT_ENTRIES=%s\n' "$( awk '(index($0, "MODULE_SPLIT_M0[4]") || index($0, "MODULE_SPLIT_M0[5]") || index($0, "MODULE_SPLIT_M0[6]") || index($0, "MODULE_SPLIT_M0[7]")) && $(NF-1) == "0x2(2)" && $NF == "0x2(2)" {n++} END {print n+0}' <<<"$cfg_all" )" |
Sample aggregate result from the Ethernet profile:
| PCI_FUNCTIONS=16 FUNCTION_ZERO_DEVICES=8 FUNCTION_ONE_DEVICES=8 MLXLINK_400G_CAPABLE_FUNCTIONS=16 MLXLINK_CABLE_UNPLUGGED_FUNCTIONS=16 MLXCONFIG_ETH_CURRENT_NEXT_ADAPTERS=8 MLXCONFIG_TWO_PF_CURRENT_NEXT_ADAPTERS=8 MLXCONFIG_LANES_4_TO_7_SPLIT_CURRENT_NEXT_ENTRIES=32 |
Expected profile, abridged:
| Current Next Boot LINK_TYPE_P1 ETH(2) or IB(1), matching the selected protocol NUM_OF_PLANES_P1 0 0 NUM_OF_PF 2 2 MODULE_SPLIT_M0[0..3] 1 1 MODULE_SPLIT_M0[4..7] 2 2 MODULE_SPLIT_M0[8..15] FF FF |
The operating system should expose sixteen C8180P functions in the selected protocol. For each adapter pair, devlink port show must report one function on physical port 0 and one on physical port 1. For InfiniBand, also confirm the link layer with ibstat and rdma link show.
6.7 Conditional: Check BlueField operating mode
If the server has BlueField-3 north-south cards, use the BLUEFIELD_DEVICES array created in Section 6.3 to query link type and operating mode ownership. If the server has ConnectX-7 cards, continue to Section 6.8.
| for d in "${BLUEFIELD_DEVICES[@]}"; do printf '\n=== %s ===\n' "$d" sudo mlxconfig -e -d "$d" q | grep -E \ 'INTERNAL_CPU_(MODEL|OFFLOAD_ENGINE|ESWITCH_MANAGER|PAGE_SUPPLIER|IB_VPORT0|RSHIM)|LINK_TYPE_P[12]|ROCE_CONTROL|SRIOV_EN|NUM_OF_VFS' done |
Example output from a B3220 configuration, abridged:
| INTERNAL_CPU_MODEL EMBEDDED_CPU(1) INTERNAL_CPU_PAGE_SUPPLIER ECPF(0) INTERNAL_CPU_ESWITCH_MANAGER ECPF(0) INTERNAL_CPU_IB_VPORT0 ECPF(0) INTERNAL_CPU_OFFLOAD_ENGINE ENABLED(0) LINK_TYPE_P1 ETH(2) LINK_TYPE_P2 ETH(2) |
To configure DPU mode with both network ports set to Ethernet:
● INTERNAL_CPU_OFFLOAD_ENGINE=ENABLED(0) means DPU mode. The embedded Arm subsystem is active and owns the NIC resources through the embedded CPU function (ECPF).
● INTERNAL_CPU_OFFLOAD_ENGINE=DISABLED(1) means NIC mode on BlueField-3. The Arm cores are inactive and the device behaves as a ConnectX adapter for the external host.
● LINK_TYPE_P1 and LINK_TYPE_P2 independently select Ethernet or InfiniBand.
Leave the mode unchanged during initial bring-up unless the deployment design requires a different profile. For DPU mode, also verify the Arm-side Board Support Package (BSP) or DOCA version, management access, RShim state, service health, and port ownership.
If the deployment requires a mode change, create a raw NVConfig backup for each BlueField device as shown in Section 6.5, then stage the required mode:
| # DPU mode to NIC mode sudo mlxconfig -d <bluefield-first-pci-function> set \ INTERNAL_CPU_OFFLOAD_ENGINE=1
# NIC mode to DPU mode sudo mlxconfig -d <bluefield-first-pci-function> set \ INTERNAL_CPU_OFFLOAD_ENGINE=0 |
Set the link protocol separately:
| # Both ports in Ethernet mode sudo mlxconfig -d <bluefield-first-pci-function> set \ LINK_TYPE_P1=ETH LINK_TYPE_P2=ETH
# Both ports in InfiniBand mode sudo mlxconfig -d <bluefield-first-pci-function> set \ LINK_TYPE_P1=IB LINK_TYPE_P2=IB |
Expected output is Applying... Done!. Re-query both BlueField devices, confirm the requested Next Boot values, perform the activation action specified by MFT, and verify the runtime mode and link layer.
Verify the DPU management path
For a deployment that manages the BlueField Arm systems from the host, install RShim and verify both embedded Arm systems:
| sudo apt-get update sudo apt-get install -y rshim rdma-core screen iputils-ping sudo systemctl enable --now rshim.service
systemctl is-active rshim.service ls -1 /dev/rshim[0-9]/misc /dev/rshim[0-9]/console
for misc in /dev/rshim[0-9]/misc; do printf '\n=== %s ===\n' "$misc" sudo grep -E '^(DEV_NAME|DEV_INFO|OPN_STR|UP_TIME|BOOT_MODE)' "$misc" done |
Sample result, abridged:
| active /dev/rshim0/console /dev/rshim0/misc /dev/rshim1/console /dev/rshim1/misc BOOT_MODE 1 (eMMC) DEV_INFO BlueField-3 ... Rev 1 |
The RShim network interfaces use the same point-to-point subnet by default. Test one DPU at a time:
| for index in 0 1; do interface="tmfifo_net${index}" sudo ip link set "$interface" up sudo ip address add 192.168.100.1/30 dev "$interface"
ping -I "$interface" -c 3 -W 2 192.168.100.2 timeout 5 bash -c \ 'exec 3<>/dev/tcp/192.168.100.2/22; head -n 1 <&3'
sudo ip address del 192.168.100.1/30 dev "$interface" done |
Sample result for both DPUs:
| 3 packets transmitted, 3 received, 0% packet loss SSH-2.0-OpenSSH_8.9p1 Ubuntu-3ubuntu0.10 |
Open an Arm console when direct console access is needed:
| sudo screen /dev/rshim0/console 115200 |
Expected result: Each configured DPU console reaches its operating system login prompt. Check the BSP and DOCA versions, required services, port ownership, and health on each Arm system.
6.8 Final adapter and storage checks
Confirm that all eight ConnectX-8 physical adapters and the configured north-south cards are present, adapter and storage firmware match the approved set, every ConnectX-8 backup is nonempty, Current and Next Boot match the selected profile, and storage health reports no critical warning or new media error. If the server uses BlueField DPU mode, also confirm the RShim path and the required Arm-side software and services.
7. Install and validate the NVIDIA GPU stack
Install the NVIDIA driver, Fabric Manager, CUDA, NCCL, and DCGM, then verify that all eight GPUs and the NVLink fabric operate correctly.
7.1 Prepare the host and confirm GPU visibility
Install the build prerequisites for the running kernel:
| sudo apt-get update sudo apt-get install -y \ "linux-headers-$(uname -r)" \ build-essential \ dkms \ mokutil \ curl \ ca-certificates \ git |
Expected result: APT finishes without dependency or Dynamic Kernel Module Support (DKMS) errors. The running kernel's matching linux-headers package and the build tools are installed.
Check the operating system, kernel, Secure Boot, and GPU baseline:
| cat /etc/os-release uname -r test ! -e /var/run/reboot-required && echo 'No reboot is pending.' mokutil --sb-state lspci -Dnn | grep -i nvidia lspci -Dnn | grep -Ei 'vga|3d|display' lspci -Dnn | grep -i '3D controller' | wc -l lsmod | grep -E '^(nvidia|nouveau)' || true |
The server exposes eight NVIDIA 3D-controller functions before the driver is installed:
| SecureBoot disabled 0000:1a:00.0 3D controller: NVIDIA Corporation Device [10de:3182] 0000:3c:00.0 3D controller: NVIDIA Corporation Device [10de:3182] ... 0000:f0:00.0 3D controller: NVIDIA Corporation Device [10de:3182] 8 |
The final value is the number of matching 3D-controller functions. Resolve missing PCIe devices before installing or changing drivers. If Secure Boot is enabled, use the site's approved module-signing and Machine Owner Key workflow.
7.2 Enable the NVIDIA repositories
Install the NVIDIA CUDA repository keyring for Ubuntu 24.04:
| curl -fL -o /tmp/cuda-keyring_1.1-1_all.deb \ https://developer.download.nvidia.com/compute/cuda/repos/ubuntu2404/x86_64/cuda-keyring_1.1-1_all.deb
sudo dpkg -i /tmp/cuda-keyring_1.1-1_all.deb sudo apt-get update |
Expected output, abridged:
| Setting up cuda-keyring (1.1-1) ... Get: ... developer.download.nvidia.com ... InRelease Reading package lists... Done |
Set the approved software branches. The defaults below reproduce the tested stack:
| NVIDIA_BRANCH=${NVIDIA_BRANCH:-580} CUDA_SERIES=${CUDA_SERIES:-13-0} DCGM_CUDA_SERIES=${DCGM_CUDA_SERIES:-cuda13} NVIDIA_OPEN_PACKAGE=${NVIDIA_OPEN_PACKAGE:-nvidia-open-${NVIDIA_BRANCH}} NVLINK_PACKAGE=${NVLINK_PACKAGE:-nvlink5-${NVIDIA_BRANCH}} CUDA_TOOLKIT_PACKAGE=${CUDA_TOOLKIT_PACKAGE:-cuda-toolkit-${CUDA_SERIES}} DCGM_PACKAGE=${DCGM_PACKAGE:-datacenter-gpu-manager-4-${DCGM_CUDA_SERIES}}
apt-cache policy \ "$NVIDIA_OPEN_PACKAGE" \ "$NVLINK_PACKAGE" \ "$CUDA_TOOLKIT_PACKAGE" \ libnccl2 \ "$DCGM_PACKAGE" |
Expected output: Each package shows an APT source and a non (none) Candidate version. Confirm that the driver, Fabric Manager, CUDA, NCCL, and DCGM branches are compatible before installation.
If APT reports an unresolved UCX dependency, enable the current NVIDIA DOCA repository selected for the same supported stack, run apt-cache policy ucx, and install the candidate supplied by that repository.
7.3 Install the driver and NVLink packages
Install the branch-pinning package before the driver so that the branch-coupled packages remain aligned:
| NVIDIA_BRANCH=${NVIDIA_BRANCH:-580} NVIDIA_OPEN_PACKAGE=${NVIDIA_OPEN_PACKAGE:-nvidia-open-${NVIDIA_BRANCH}} NVLINK_PACKAGE=${NVLINK_PACKAGE:-nvlink5-${NVIDIA_BRANCH}}
sudo apt-get install -y "nvidia-driver-pinning-${NVIDIA_BRANCH}"
sudo apt-get install -y -V \ "$NVIDIA_OPEN_PACKAGE" \ "$NVLINK_PACKAGE" \ libibumad3 \ infiniband-diags |
Expected output, abridged:
| Setting up nvidia-driver-pinning-580 ... Setting up nvidia-open-580 ... Building initial module nvidia/580.173.02 for 6.8.0-136-generic Setting up nvidia-fabricmanager ... Setting up nvlink5-580 ... |
Pass is indicated when DKMS completes and all branch-coupled packages use the selected NVIDIA branch.
Before restarting, confirm that the driver module was built for the running kernel:
| dkms status modinfo -F version nvidia systemctl is-enabled \ nvidia-fabricmanager \ nvidia-persistenced |
Sample output:
| nvidia/580.173.02, 6.8.0-136-generic, x86_64: installed 580.173.02 enabled enabled |
If DKMS does not report installed for the running kernel, inspect the DKMS build log before restarting. Do not continue with a partially built driver.
Restart the host and allow the platform to complete POST:
| sudo systemctl reboot |
Expected result: The SSH session closes as the host restarts. Redfish should continue to report power On; allow the platform to finish POST before testing SSH again.
7.4 Start and validate Fabric Manager
NVIDIA Fabric Manager configures and monitors the NVSwitch and NVLink fabric. Load the InfiniBand userspace MAD (ib_umad) module before starting the service:
| printf '%s\n' ib_umad | sudo tee /etc/modules-load.d/ib_umad.conf
sudo modprobe ib_umad lsmod | grep '^ib_umad' ls -1 /dev/infiniband/umad* 2>/dev/null sudo systemctl restart nvidia-fabricmanager systemctl is-active nvidia-fabricmanager nvidia-smi -L |
Expected result: The module and UMAD device are present, Fabric Manager reports active, and nvidia-smi -L lists eight GPUs.
| ib_umad ... /dev/infiniband/umad0 active GPU 0: NVIDIA B300 ... ... GPU 7: NVIDIA B300 ... |
Validate the GPU fabric and NVLink topology:
| nvidia-smi -q | grep -A 4 -E '^ Fabric$' nvidia-smi topo -m nvidia-smi nvlink --status journalctl -u nvidia-fabricmanager -b --no-pager | grep -E 'MASTER|Successfully configured' |
Sample output, abridged:
| Fabric State : Completed Status : Success
GPU0 X NV18 NV18 NV18 NV18 NV18 NV18 NV18 GPU1 NV18 X NV18 NV18 NV18 NV18 NV18 NV18 ... GPU7 NV18 NV18 NV18 NV18 NV18 NV18 NV18 X
GPU 0, Links 0 through 17: 53.125 GB/s ... GPU 7, Links 0 through 17: 53.125 GB/s |
The Completed and Success pair must appear for all eight GPUs. NV18 between each GPU pair indicates that the topology command sees the expected bonded NVLink paths.
Check the NVIDIA IMEX service:
| systemctl is-enabled nvidia-imex.service || true systemctl is-active nvidia-imex.service || true systemctl status nvidia-imex.service --no-pager -l || true |
IMEX is used for a configured multinode NVLink domain. On a standalone server, disable an unconfigured service:
| sudo systemctl disable --now nvidia-imex.service sudo systemctl reset-failed nvidia-imex.service |
Sample single-server result:
| disabled inactive |
For a multinode NVLink domain, populate the IMEX node configuration for that domain and start the service instead. The single-server disable action leaves the package installed.
7.5 Install CUDA, NCCL, DCGM, and RDMA tools
Install the user-space packages:
| CUDA_TOOLKIT_PACKAGE=${CUDA_TOOLKIT_PACKAGE:-cuda-toolkit-13-0} CUDA_TOOLKIT_VERSION=${CUDA_TOOLKIT_VERSION:-13.0.3-1} NCCL_VERSION=${NCCL_VERSION:-2.28.9-1+cuda13.0} DCGM_PACKAGE=${DCGM_PACKAGE:-datacenter-gpu-manager-4-cuda13} NVIDIA_BRANCH=${NVIDIA_BRANCH:-580} NVIDIA_OPEN_PACKAGE=${NVIDIA_OPEN_PACKAGE:-nvidia-open-${NVIDIA_BRANCH}} NVLINK_PACKAGE=${NVLINK_PACKAGE:-nvlink5-${NVIDIA_BRANCH}}
sudo apt-get install -y -V --install-recommends \ "${CUDA_TOOLKIT_PACKAGE}=${CUDA_TOOLKIT_VERSION}" \ "libnccl2=${NCCL_VERSION}" \ "libnccl-dev=${NCCL_VERSION}" \ "$DCGM_PACKAGE" \ ibverbs-utils |
Expected result: APT resolves the pinned CUDA 13.0 and NCCL versions, installs DCGM and RDMA utilities, and exits without dependency errors. The version query later in this section is the acceptance check.
Make the selected CUDA toolkit available to login shells and enable DCGM:
| printf '%s\n' \ 'export PATH=/usr/local/cuda/bin${PATH:+:${PATH}}' | sudo tee /etc/profile.d/cuda.sh
sudo chmod 0644 /etc/profile.d/cuda.sh . /etc/profile.d/cuda.sh sudo systemctl --now enable nvidia-dcgm |
Expected output, abridged:
| export PATH=/usr/local/cuda/bin${PATH:+:${PATH}} Created symlink .../multi-user.target.wants/nvidia-dcgm.service ... |
An existing enabled service may not print the symlink line. Confirm with systemctl is-enabled nvidia-dcgm and systemctl is-active nvidia-dcgm; both must return enabled and active.
Capture the installed package versions:
| CUDA_TOOLKIT_PACKAGE=${CUDA_TOOLKIT_PACKAGE:-cuda-toolkit-13-0} DCGM_PACKAGE=${DCGM_PACKAGE:-datacenter-gpu-manager-4-cuda13} NVIDIA_BRANCH=${NVIDIA_BRANCH:-580} NVIDIA_OPEN_PACKAGE=${NVIDIA_OPEN_PACKAGE:-nvidia-open-${NVIDIA_BRANCH}} NVLINK_PACKAGE=${NVLINK_PACKAGE:-nvlink5-${NVIDIA_BRANCH}}
dpkg-query -W -f='${binary:Package}\t${Version}\n' \ "$CUDA_TOOLKIT_PACKAGE" \ libnccl2 \ libnccl-dev \ "$DCGM_PACKAGE" \ "$NVIDIA_OPEN_PACKAGE" \ nvidia-fabricmanager \ "$NVLINK_PACKAGE" \ nvlsm |
Sample output:
| cuda-toolkit-13-0 13.0.3-1 libnccl2 2.28.9-1+cuda13.0 libnccl-dev 2.28.9-1+cuda13.0 datacenter-gpu-manager-4-cuda13 1:4.6.1-1 nvidia-open-580 580.173.02-1ubuntu1 nvidia-fabricmanager 580.173.02-1ubuntu1 nvlink5-580 580.173.02-1 nvlsm 2025.10.14-1 |
Confirm the CUDA compiler and DCGM versions:
| nvcc --version dcgmi --version |
Sample output:
| Cuda compilation tools, release 13.0, V13.0.88 dcgmi version: 4.6.1 |
Run DCGM discovery, enable health watches, and run a level-1 diagnostic:
| dcgmi discovery -l dcgmi health -s a dcgmi health -c dcgmi diag -r 1 |
Sample output, abridged:
| 8 GPUs found (Active). 2 NvSwitches found. 2 ConnectX found.
Health monitor systems set successfully. Overall Health: Healthy
DCGM Version : 4.6.1 Driver Version Detected : 580.173.02 software : Pass GPU0 through GPU7 : Pass |
Health watches are runtime states. After restarting DCGM or the host, run dcgmi health -s a before dcgmi health -c. Otherwise DCGM can report that health watches are not enabled.
Level 1 is a short deployment diagnostic. For a broader GPU check, run a level 2 diagnostic during a maintenance window:
| sudo dcgmi diag -r 2 |
Sample output, abridged:
| DCGM Version : 4.6.1 Driver Version Detected : 580.173.02 software : Pass memory : Pass pcie : Pass GPU0 through GPU7 : Pass |
Compile and run a small CUDA program to validate the compiler, runtime, executable loader, and device discovery independently from NCCL:
| #include <cstdio> #include <cuda_runtime.h>
int main() { int count = 0; if (cudaGetDeviceCount(&count) != cudaSuccess) return 1;
std::printf("CUDA devices detected: %d\n", count); for (int i = 0; i < count; ++i) { cudaDeviceProp p{}; if (cudaGetDeviceProperties(&p, i) != cudaSuccess) return 2; std::printf( "GPU %d: %s, compute capability %d.%d, memory %zu MiB\n", i, p.name, p.major, p.minor, static_cast<size_t>(p.totalGlobalMem / 1024 / 1024)); } return count == 8 ? 0 : 3; } |
Save the source as cuda_device_query.cu, then run:
| nvcc -O2 cuda_device_query.cu -o cuda_device_query echo "CUDA_COMPILE_EXIT_CODE=$?" ./cuda_device_query echo "CUDA_DEVICE_QUERY_EXIT_CODE=$?" |
Sample output, abridged:
| CUDA_COMPILE_EXIT_CODE=0 CUDA devices detected: 8 GPU 0: NVIDIA B300 SXM6 AC, compute capability 10.3, memory 274113 MiB ... GPU 7: NVIDIA B300 SXM6 AC, compute capability 10.3, memory 274113 MiB CUDA_DEVICE_QUERY_EXIT_CODE=0 |
This test proves that a compiled CUDA executable can discover and query all eight GPUs. It does not replace DCGM diagnostics or a multi-GPU communication test.
Capture persistence mode, peer access, I/O Memory Management Unit (IOMMU) state, and negotiated PCIe links:
| nvidia-smi \ --query-gpu=index,persistence_mode,pcie.link.gen.current,\ pcie.link.gen.max,pcie.link.width.current,pcie.link.width.max \ --format=csv
nvidia-smi topo -p2p n cat /proc/cmdline sudo dmesg | grep -Ei 'DMAR|IOMMU.*enabled|Default domain|DMA domain' | head -n 80
sudo lspci -D -s <gpu-bdf> -vv | grep -E 'LnkCap:|LnkSta:|Kernel driver' sudo lspci -D -s <connectx-8-bdf> -vv | grep -E 'LnkCap:|LnkSta:|Kernel driver' sudo lspci -D -s <north-south-adapter-bdf> -vv | grep -E 'LnkCap:|LnkSta:|Kernel driver' |
Sample result, abridged:
| GPU0 through GPU7: persistence Enabled, PCIe generation 6, width x16 Every off-diagonal GPU peer entry: OK IOMMU: enabled Default domain type: Translated Representative ConnectX-8: 64GT/s x16, mlx5_core Representative North-South adapter: <expected-rate> x16, mlx5_core |
For every PCIe device, LnkSta should match the expected negotiated generation and width. Investigate any downgraded links before performance qualification.
7.7 Run the NCCL all-reduce test
Fetch the exact NCCL test revision used for the sample output:
| NCCL_TESTS_COMMIT=a0b82b2260cf5152b9f8c061bbf7eaf0ba096432 mkdir -p "$HOME/nccl-tests" git -C "$HOME/nccl-tests" init git -C "$HOME/nccl-tests" remote remove origin 2>/dev/null || true git -C "$HOME/nccl-tests" remote add origin https://github.com/NVIDIA/nccl-tests.git git -C "$HOME/nccl-tests" fetch --depth 1 origin "$NCCL_TESTS_COMMIT" git -C "$HOME/nccl-tests" checkout --detach FETCH_HEAD test "$(git -C "$HOME/nccl-tests" rev-parse HEAD)" = "$NCCL_TESTS_COMMIT" |
Expected result: The checkout enters detached-HEAD state and the final test returns zero. This guide used:
| NCCL tests version: 2.19.6 Source revision: a0b82b2260cf5152b9f8c061bbf7eaf0ba096432 |
Build the tests for B300 compute capability 10.3:
| make -C "$HOME/nccl-tests" -j8 \ NVCC_GENCODE='-gencode=arch=compute_103,code=sm_103' |
Expected result: The compilation finishes without an error and creates $HOME/nccl-tests/build/all_reduce_perf. Compiler progress varies with the toolchain; verify that the executable exists before running it.
Run the eight-GPU all-reduce test from 8 MiB through 8 GiB:
| NCCL_DEBUG=WARN "$HOME/nccl-tests/build/all_reduce_perf" \ -b 8M -e 8G -f 2 -g 8 -c 1 |
Sample output, abridged:
| # nccl-tests version 2.19.6 NCCL version 2.28.9+cuda13.0 ... size 8589934592, in-place algbw 478.37 GB/s, busbw 837.15 GB/s, #wrong 0 # Out of bounds values : 0 OK # Avg bus bandwidth : 580.699 # Collective test concluded: all_reduce_perf |
Retain the full output, source revision, package versions, and test arguments when the result will be used as a performance baseline.
7.8 Verify restart persistence
Confirm persistence mode before and after the restart:
| nvidia-smi \ --query-gpu=index,persistence_mode \ --format=csv |
Sample result: GPUs 0 through 7 all reported Enabled.
If the deployment requires persistence mode and a GPU reports Disabled, enable it during the approved configuration window:
| sudo nvidia-smi -pm 1 nvidia-smi \ --query-gpu=index,persistence_mode \ --format=csv |
Expected result: The configuration command reports that persistence mode is enabled for every GPU, and the query returns Enabled eight times.
Use a second controlled restart to confirm that the kernel module and services start without manual intervention:
| sudo systemctl reboot |
Expected result: The remote session closes. After the platform returns, the following checks must succeed without manually loading ib_umad or restarting NVIDIA services.
After the host returns, run:
| lsmod | grep '^ib_umad' systemctl is-enabled \ nvidia-fabricmanager \ nvidia-persistenced \ nvidia-dcgm systemctl is-active \ nvidia-fabricmanager \ nvidia-persistenced \ nvidia-dcgm nvidia-smi \ --query-gpu=index,persistence_mode \ --format=csv nvidia-smi -q | grep -A 4 -E '^ Fabric$' dcgmi health -s a dcgmi health -c |
Sample output, abridged:
| ib_umad 45056 22
enabled enabled enabled active active active
index, persistence_mode 0, Enabled ... 7, Enabled
Fabric State : Completed Status : Success ... Overall Health: Healthy |
The three enabled results and three active results correspond, in order, to Fabric Manager, NVIDIA Persistence Daemon, and DCGM. The Fabric state and status pair appeared for all eight GPUs.
Run a short eight-GPU NCCL test after the restart. Expected result: The test completes with zero validation errors. Investigate any change in GPU count, fabric state, service state, persistence mode, topology, or NCCL correctness before continuing.
Confirm that eight GPUs are visible, Fabric Manager reports Completed and Success, DCGM level 2 passes for GPU0 through GPU7, the CUDA query exits with zero, the NCCL all-reduce reports #wrong 0, and the same state returns after restart.
Complete this chapter when the external ConnectX-8 or configured north-south ports are connected to the deployment fabric. The inventory and configuration commands can still be run before the links are connected.
8.1 Conditional: Verify Ethernet and RoCE layers
RoCE validation covers the adapter, host, and fabric layers.
Table 6. What to validate for each layer
| Layer |
What to validate |
| Adapter |
Ethernet link type, RoCE capability, firmware, SR-IOV policy, PCIe state, and expected physical-port profile |
| Host |
Interface state, MTU, address, DCBX source, trust model, PFC, ECN, type of service (ToS) or traffic class, and RDMA counters |
| Fabric |
Switch Quality-of-Service (QoS) policy, peer configuration, negotiated speed, MTU, bidirectional traffic, congestion behavior, and stable error counters |
Query the persistent adapter properties:
| sudo mlxconfig -e -d <first-pci-function-bdf> q | grep -E \ 'LINK_TYPE_P[12]|ROCE_CONTROL|SRIOV_EN|NUM_OF_VFS' |
Sample Ethernet mode result, abridged:
| LINK_TYPE_P1 ETH(2) ROCE_CONTROL ROCE_ENABLE(2) SRIOV_EN True(1) NUM_OF_VFS 16 |
This result establishes adapter configuration only. It does not show that the host or fabric QoS policy is complete.
With standard Linux DCB tools, query the host state:
| ip -d link show dev <interface> ethtool <interface> | grep -E 'Speed|Auto-negotiation|Link detected' ethtool -a <interface> dcb pfc show dev <interface> dcb app show dev <interface> rdma link show ibv_devinfo -d <rdma-device> ethtool -S <interface> | grep -Ei 'roce|pfc|pause|ecn|cnp|discard|drop|crc|error' |
Sample output for an unprovisioned Ethernet configuration:
| Configured link layer: Ethernet PFC priorities 0 through 7: off DCB APP table: no entries Representative active North-South interface MTU: 1500 Global RX/TX pause: on RoCE and QoS traffic counters: 0 |
These values are observations, not recommended production defaults. Configure trust, priority mapping, Priority Flow Control (PFC), Explicit Congestion Notification (ECN), differentiated services code point (DSCP) or Priority Code Point (PCP), and Maximum Transmission Unit (MTU) according to the deployment fabric design. Lossless treatment is normally limited to the selected RoCE priorities; enabling PFC on every priority can spread congestion to unrelated traffic.
The exact tool set depends on the selected host stack. A DOCA-Host profile can also provide NVIDIA utilities such as mlnx_qos, cma_roce_tos, ibdev2netdev, or lldptool. The Ubuntu inbox path uses dcb, rdma, ibv_devices, ibv_devinfo, ibstat, ethtool, mlxconfig, and mlxfwmanager.
After applying the production policy, repeat every query and verify traffic as described in Section 8.3. Compare host and switch counters before and after the test. Traffic validation requires a connected peer.
ConnectX-7 functions whose product description identifies the internal HGX communication path are managed with the HGX stack. Do not apply the external ConnectX-8 or north-south adapter workflow to those internal functions.
Authoritative references:
● NVIDIA ConnectX-8 OCP port configurations
● NVIDIA MFT “mlxconfig” backup and reset
● NVIDIA BlueField modes of operation
8.2 Conditional: Verify link state and GPU proximity
| ip -br link rdma link nvidia-smi topo -m |
Expected result: Every deployed interface appears once, rdma link associates RDMA devices with their current netdevs, and the topology matrix shows the expected GPU-to-NIC proximity.
For each production link:
| ethtool <interface> | grep -E 'Speed|Link detected' ethtool -S <interface> | grep -Ei 'err|drop|discard|crc|pause' |
Expected output on a healthy Ethernet link:
| Speed: 400000Mb/s Link detected: yes <error-or-drop-counter>: 0 |
Counter names vary by driver. Investigate increasing error, discard, Cyclic Redundancy Check (CRC), or unexpected pause counters rather than requiring every possible counter to be present.
Correlate the port, BDF, Linux interface, RDMA device, and GPU topology before applying bonds, VLANs, addresses, or RoCE policy.
A link-down result confirms tool access and configured speed capability but does not validate physical link negotiation or traffic. Production acceptance must also verify negotiated speed, bidirectional traffic, throughput, packet and error counters, and switch-side configuration.
For each cabled Ethernet/RoCE or InfiniBand path, run the peer traffic commands in Section 8.3 and verify switch-side speed, MTU, counters, and congestion configuration.
8.3 Conditional: Run peer network and RDMA tests
Install the peer traffic tools when they are part of the deployment test plan:
| sudo apt-get update sudo apt-get install -y perftest iperf3 iputils-ping ib_write_bw --version iperf3 --version | head -n 1 ping -V |
Expected result: APT installs the utilities and all three version commands complete. Installing the tools does not configure the fabric or start a listener.
Check inventory and configured state:
| ip -brief link rdma link ibv_devices ibv_devinfo sudo mst status -v |
Expected inventory result, abridged:
| <management-interface> UP <data-interface> <state> ... <ConnectX-8 and configured North-South RDMA devices are enumerated> |
Inventory validates PCIe discovery, driver binding, RDMA-device enumeration, NVConfig, and deterministic mapping. Validate the deployment fabric separately.
For an Ethernet or RoCE profile, check the host policy before traffic:
| ip -d link show dev <interface> ethtool -a <interface> dcb pfc show dev <interface> dcb app show dev <interface> ethtool -S <interface> | grep -Ei 'roce|pfc|pause|ecn|cnp|discard|drop|crc|error' |
Expected result: MTU, pause, PFC, priority mapping, and counters match the approved fabric design.
For each Ethernet link:
| ethtool <interface> | grep -E 'Speed|Link detected' ip -s link show dev <interface> ethtool -S <interface> | grep -Ei 'crc|err|drop|discard|pause' |
Expected result:
| Speed: <configured-speed> Link detected: yes RX/TX errors and dropped packets: 0 or unchanged during the test |
For an InfiniBand link:
| ibstat <rdma-device> ibv_devinfo -d <rdma-device> sudo mlxlink -d <first-pci-function-bdf> |
Expected result:
| State: Active Physical state: LinkUp Rate: <configured-rate> |
For RoCE or InfiniBand transport validation, run an approved test between two fabric-connected hosts. Start the receiver on the peer, then run the client:
| # Peer host ib_write_bw -d <rdma-device>
# C880A M8 ib_write_bw -d <rdma-device> <peer-address> |
For RoCE, include the required GID index and address-family options, such as -x <gid-index>, according to the deployment network design.
Expected result: The client and receiver establish the RDMA connection, the test completes without transport errors, and the reported bandwidth is consistent with the deployment baseline.
Validate IP reachability, MTU, and bidirectional Ethernet throughput when the network design uses an IP data path:
| ping -c 5 -M do -s <payload-bytes> <peer-ip> iperf3 -s iperf3 -c <peer-ip> -P <parallel-streams> -t 30 |
Run the iperf3 server on one endpoint and the client on the other, then reverse the direction. Expected result: No ping loss, no MTU error, throughput consistent with the site baseline, and no increase in CRC, discard, or error counters.
Use the commands in this section with the deployment network test plan. Verify host-side and switch-side speed, link layer, MTU, counters, and test results.
For connected interfaces, confirm that every required production link negotiates the intended speed and MTU, switch and host policy agree, bidirectional traffic succeeds, transport tests complete without errors, and counters remain stable.
Run these checks after completing Chapters 2 through 8 to confirm the server-local hardware, firmware, operating system, GPU stack, and services.
Expected result: The installed inventory matches the purchased configuration, firmware and services are healthy, storage and adapters report no errors, all eight GPUs and the NVLink fabric pass their checks, and the applicable local smoke tests complete successfully. Complete deployment-network checks when the required fabric links are available.
9.1 Verify host, CPU, memory, the configured boot device, and storage
Set the expected storage population for the purchased configuration:
| # Replace this value with the count for this server. EXPECTED_E1S_CONTROLLERS=<configured-E1.S-count>
systemctl --failed timedatectl show -p NTPSynchronized test ! -e /var/run/reboot-required && echo 'No reboot is required.' lscpu | grep -E 'CPU\(s\)|Socket\(s\)|NUMA node\(s\)' free -h findmnt -T / -o TARGET,SOURCE,FSTYPE,OPTIONS findmnt -T /boot -o TARGET,SOURCE,FSTYPE,OPTIONS findmnt -T /boot/efi -o TARGET,SOURCE,FSTYPE,OPTIONS lsblk -e7 -o NAME,MODEL,SIZE,TYPE,FSTYPE,MOUNTPOINTS
mapfile -t NVME_CONTROLLERS < <( find /sys/class/nvme -maxdepth 1 -type l -name 'nvme[0-9]*' \ -exec basename {} \; | sort -V )
printf 'NVMe controllers: observed=%s expected=%s\n' \ "${#NVME_CONTROLLERS[@]}" "$EXPECTED_E1S_CONTROLLERS" test "${#NVME_CONTROLLERS[@]}" -eq "$EXPECTED_E1S_CONTROLLERS"
for d in "${NVME_CONTROLLERS[@]}"; do sudo nvme id-ctrl "/dev/$d" | grep -E '^(mn|fr|sn)' sudo nvme smart-log "/dev/$d" sudo nvme fw-log "/dev/$d" sudo nvme error-log "/dev/$d" --log-entries=8 done
SMART_SCAN=$(mktemp) trap 'rm -f "$SMART_SCAN"' EXIT
sudo smartctl --scan-open | tee "$SMART_SCAN" while IFS= read -r scan; do specification=${scan%%#*} read -r -a smartctl_args <<<"$specification" ((${#smartctl_args[@]})) || continue sudo smartctl -a "${smartctl_args[@]}" done < "$SMART_SCAN"
rm -f "$SMART_SCAN" trap - EXIT
sudo journalctl -k -b --no-pager | grep -Ei 'I/O error|medium error|uncorrect|AER:.*error|pcieport.*error' || true |
In System Inventory > Storage, confirm the logical boot device and the physical members reported by the installed boot controller. The standard redundant boot configuration reports one healthy logical boot device backed by two healthy 960-GB M.2 SATA members. If another supported boot design was selected during installation, compare the logical device and member state with that design instead.
Expected result: The E1.S count matches the purchased configuration, the operating system file systems are on the intended logical boot device, the boot controller reports the expected logical device and member state, no unexpected service is failed, time is synchronized, no restart is pending, each NVMe device reports critical warning 0 and no new media error, every device discovered by smartctl reports a healthy state, and the kernel review contains no unexplained storage or PCIe error.
9.2 Verify GPU and NVLink state
| nvidia-smi --query-gpu=index,name --format=csv,noheader nvidia-smi -q | grep -A 4 -E '^ Fabric$' nvidia-smi topo -m systemctl is-active \ nvidia-fabricmanager nvidia-persistenced nvidia-dcgm dcgmi health -s a dcgmi health -c sudo dcgmi diag -r 2 NCCL_DEBUG=WARN "$HOME/nccl-tests/build/all_reduce_perf" \ -b 8M -e 8G -f 2 -g 8 -c 1 |
Expected result: Eight GPUs are present, every fabric block reports Completed and Success, all three services are active, DCGM level 2 passes for GPU0 through GPU7, and NCCL reports #wrong 0 and Out of bounds values: 0 OK.
9.3 Verify adapter and storage firmware
| EXPECTED_CX8_ADAPTERS=8
sudo mlxfwmanager --query
mapfile -t CX8_DEVICES < <( lspci -Dnn | awk '/ConnectX-8|15b3:1023/ && $1 ~ /\.0$/ {print $1}' ) mapfile -t BLUEFIELD_DEVICES < <( lspci -Dnn | awk '/15b3:a2dc/ && $1 ~ /\.0$/ {print $1}' )
printf 'ConnectX-8 adapters: observed=%s expected=%s\n' \ "${#CX8_DEVICES[@]}" "$EXPECTED_CX8_ADAPTERS" test "${#CX8_DEVICES[@]}" -eq "$EXPECTED_CX8_ADAPTERS"
for d in "${CX8_DEVICES[@]}"; do sudo mlxconfig -e -d "$d" q \ LINK_TYPE_P1 NUM_OF_PLANES_P1 NUM_OF_PF \ 'MODULE_SPLIT_M0[0..15]' done
if ((${#BLUEFIELD_DEVICES[@]})); then test "${#BLUEFIELD_DEVICES[@]}" -eq 2 for d in "${BLUEFIELD_DEVICES[@]}"; do sudo mlxconfig -e -d "$d" q | grep -E 'INTERNAL_CPU_(MODEL|OFFLOAD_ENGINE)|LINK_TYPE_P[12]' done fi
mapfile -t NVME_CONTROLLERS < <( find /sys/class/nvme -maxdepth 1 -type l -name 'nvme[0-9]*' \ -exec basename {} \; | sort -V ) for d in "${NVME_CONTROLLERS[@]}"; do sudo nvme fw-log "/dev/$d" done |
Expected result: If the server has ConnectX-7 north-south cards, mlxfwmanager --query lists two external 2x200-Gb/s cards. If it has BlueField-3, the command lists two B3220 or two B3240 devices. The counts match, every expected device appears in the firmware inventory, versions match the approved set, and Current and Next Boot match the selected adapter profiles.
9.4 Run bounded post-configuration smoke tests
Install the validation tools when they are not already present:
| sudo apt-get update sudo apt-get install -y stress-ng fio |
Expected result: APT installs or confirms stress-ng and fio without dependency errors.
Run a 60-second CPU verification workload:
| stress-ng \ --cpu 0 \ --cpu-method matrixprod \ --verify \ --timeout 60s \ --metrics-brief |
Sample output, abridged:
| dispatching hogs: 256 cpu cpu 16845447 bogo ops 60.00 secs passed: 256: cpu (256) failed: 0 successful run completed |
--cpu 0 uses all online logical CPUs. Reduce the worker count when site policy does not permit a full CPU load.
Run a bounded memory verification workload:
| stress-ng \ --vm 8 \ --vm-bytes 4G \ --verify \ --timeout 60s \ --metrics-brief |
Sample output, abridged:
| dispatching hogs: 8 vm vm 41855532 bogo ops 60.39 secs passed: 8: vm (8) failed: 0 successful run completed |
--cpu 0 uses all online logical CPUs. Reduce the worker count when site policy does not permit a full CPU load.
Run a bounded memory verification workload:
| stress-ng \ --vm 8 \ --vm-bytes 4G \ --verify \ --timeout 60s \ --metrics-brief |
Sample output, abridged:
| dispatching hogs: 8 vm vm 41855532 bogo ops 60.39 secs passed: 8: vm (8) failed: 0 successful run completed |
The example allocates 32 GiB in total. Select a workload that leaves sufficient memory for the operating system and any active services.
Run temporary direct I/O against a file system with at least 4 GiB of free space. The subshell removes its temporary directory on completion or error:
| ( set -e testdir=$(mktemp -d /var/tmp/c880a-validation.XXXXXX) testfile="$testdir/fio.bin" trap 'rm -rf -- "$testdir"' EXIT df -h "$testdir"
fio \ --name=seq-write \ --filename="$testfile" \ --size=4G \ --rw=write \ --bs=1M \ --direct=1 \ --ioengine=libaio \ --iodepth=16 \ --numjobs=1 \ --group_reporting
fio \ --name=seq-read \ --filename="$testfile" \ --size=4G \ --rw=read \ --bs=1M \ --direct=1 \ --ioengine=libaio \ --iodepth=16 \ --numjobs=1 \ --group_reporting ) |
Sample output, abridged:
| WRITE: bw=6041MiB/s (6335MB/s), io=4096MiB, err=0 READ: bw=13.2GiB/s (14.2GB/s), io=4096MiB, err=0 |
Expected result: err=0, the expected byte count is transferred, and no new storage or kernel error appears.
9.5 Verify the deployment network when connected
If the data interfaces are connected, run the host, peer, and switch checks in Chapter 8. If they are not connected, continue with server-local validation and complete the network tests when the deployment fabric is available.
9.6 Review final firmware and BMC/HGX health
Return to the BMC after the firmware, power cycle, adapter, GPU, and smoke test work. Run the discovery command in Section 3.5 again and review the final platform, BIOS, and HGX firmware inventory. Then review Dashboard, Sensor, GPU Information, and Logs & Reports.
Expected result: The running platform, BIOS, and HGX versions match the approved firmware set, the current platform and HGX health rollups are OK, and no active Warning or Critical condition affects the validated configuration.
10. Monitor and support the server
Configure the alert and monitoring paths used at the site, and use the support procedures in this chapter when a problem requires Cisco assistance.
10.1 Optional: Configure BMC alert delivery
The BMC separates event matching from delivery:
1. Open Logs & Reports > Platform Event Filters > LAN Destinations and configure the Simple Network Management Protocol (SNMP) destination, or open Simple Mail Transfer Protocol (SMTP) and configure the email relay. Select Save and reopen the destination to confirm the values.
2. Open Event Filters, select an available slot, enable it, choose the required sensor or event class and severity, and select Save.
3. Open Alert Policies, select an available slot, enable it, associate the event filter with the intended action and destination, and select Save.
4. Reopen the filter and policy and confirm that both remain enabled and that the destination number matches.

Platform Event Filter configuration areas
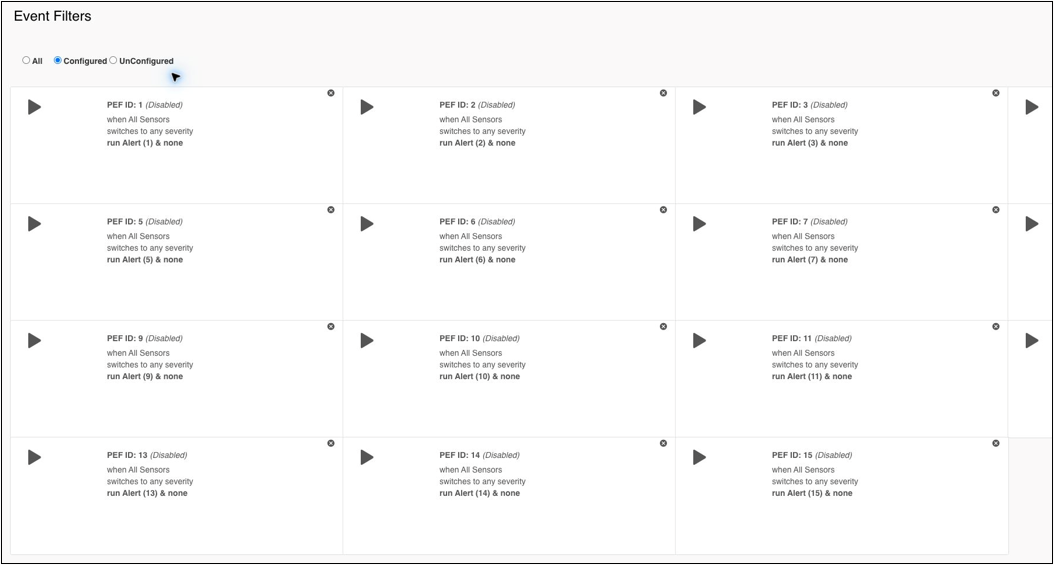
Platform event filter slots
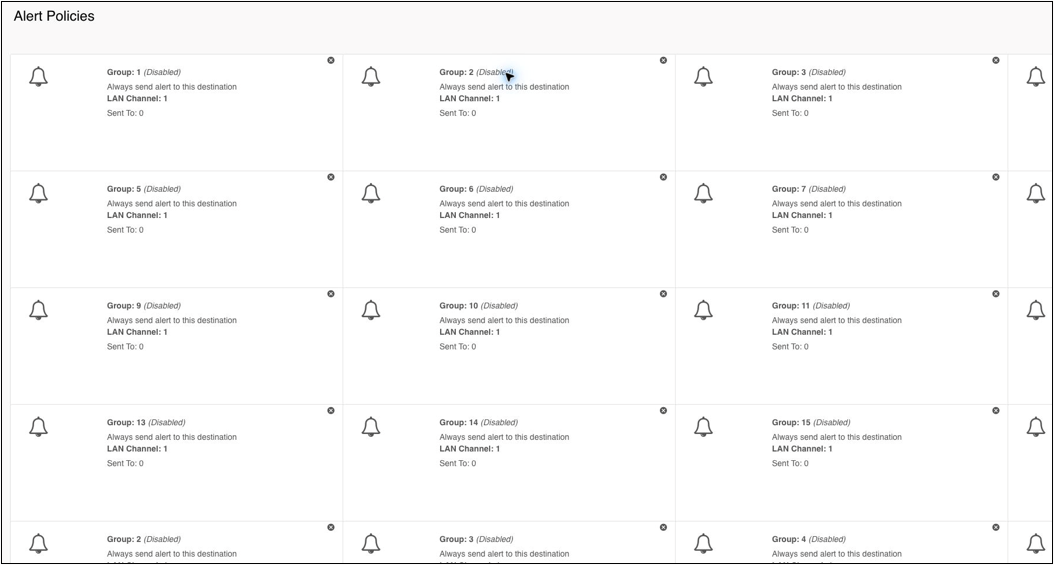
Alert policy slots
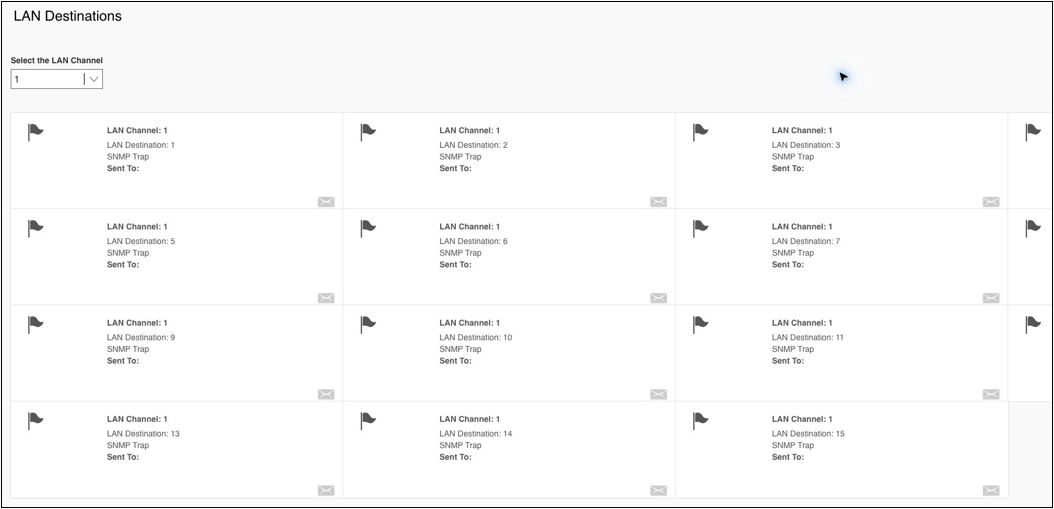
SNMP LAN destination slots
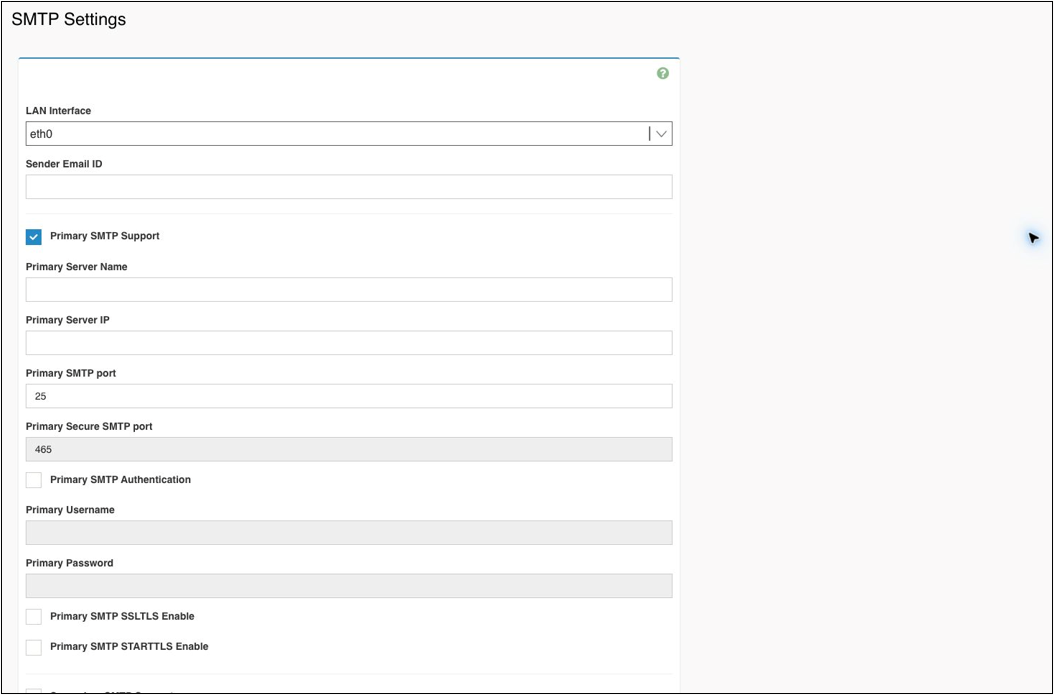
SMTP alert settings
In LAN Destinations, select the configured destination and click Send Test Alert. The selected destination type determines whether the test uses SNMP or email; SMTP must be enabled for email delivery. Confirm that the site receiver records the test.
10.2 Optional: Back up the BMC configuration
Open Maintenance to access configuration backup and restore, system diagnostics, recovery image synchronization, factory reset, and BMC restart.
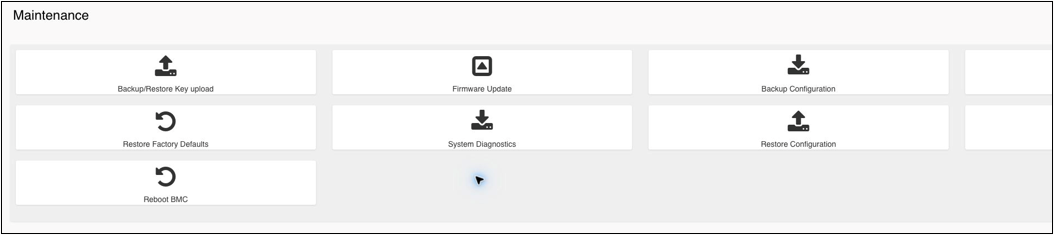
BMC maintenance tools
Open Maintenance > Configuration Backup:
1. Check the current BMC firmware version.
2. Select the configuration groups required for recovery.
3. Enter the encryption value requested by the page.
4. Generate and download the backup.
5. Calculate its checksum after download:
| sha256sum <bmc-configuration-backup> |
Expected result: One SHA-256 digest and the backup filename. A restore can replace the active management configuration; exercise it only in the planned recovery procedure.
The System Diagnostics page generates the Cisco BMC support bundle.
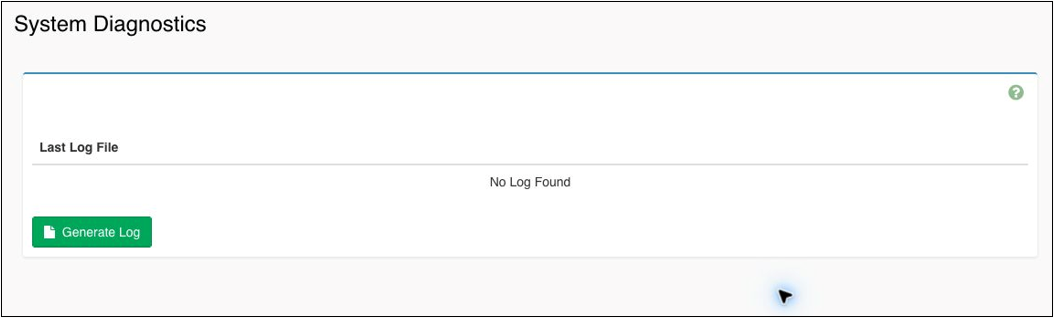
BMC diagnostic log generation
The Host System Diagnostics area shows autonomous crash-dump records when data is available.

Host autonomous crash-dump records
Generate support data after reproducing an issue and before clearing logs or restarting the BMC. Section 10.5 lists the case artifacts.
10.3 Generate Cisco BMC support data
Open Maintenance > System Diagnostics. Select Generate Log, and wait for generation to finish. The operation can take several minutes. Do not restart the BMC, clear logs, or start another diagnostic collection while it is running.
The Last Log File area shown on the page changes from No Log Found to the generated archive when the bundle is ready. Download the archive without changing its contents, and calculate a checksum.
Also collect:
● Dashboard health summary
● System, GPU, FRU, and firmware inventory
● Sensor table filtered to warning and critical states
● Event log, system log, and audit log exports
● Active media redirection state when the issue involves installation
● Autonomous crash-dump data when present
● Screenshots of the exact warning or failed task
Collect:
| uname -a cat /etc/os-release systemctl --failed journalctl -b --no-pager lspci -Dnnvv lsblk sudo nvme list nvidia-smi -q nvidia-smi topo -m dcgmi diag -r 1 ip -details link rdma link ibv_devinfo |
Expected result: Each command returns the corresponding operating system, service, PCIe, storage, GPU, network, or RDMA evidence. dcgmi diag -r 1 must finish with Pass for GPU0 through GPU7. Run the storage and networking commands that apply to the installed configuration.
Include the Cisco upgrade script log archive for firmware failures. Preserve generated support archives and their checksums for the Cisco support case.
10.5 Collect information for a Cisco support case
Include the problem time and symptom, BMC and BIOS versions, the pre-failure and current health states, relevant event and task records, the Cisco BMC support bundle and checksum, host journal and inventory, and the exact command or workload that exposed the failure.
10.6 Optional: Configure the installed OS Serial over LAN console
Use this procedure when the operating model requires a serial console for the installed Ubuntu system:
| sudo tee /etc/default/grub.d/99-c880a-sol.cfg >/dev/null <<'EOF' GRUB_TERMINAL_INPUT="console serial" GRUB_TERMINAL_OUTPUT="console serial" GRUB_SERIAL_COMMAND="serial --unit=0 --speed=115200 --word=8 --parity=no --stop=1" GRUB_CMDLINE_LINUX_DEFAULT="$GRUB_CMDLINE_LINUX_DEFAULT console=tty0 console=ttyS0,115200n8" EOF
sudo update-grub sudo systemctl enable serial-getty@ttyS0.service sudo systemctl stop serial-getty@ttyS0.service sudo stty -F /dev/ttyS0 115200 cs8 -parenb -cstopb sudo systemctl start serial-getty@ttyS0.service |
From the management workstation, open the console:
| export IPMI_PASSWORD ipmitool -I lanplus -H <bmc-address> -U <bmc-user> -E sol activate |
The channel maps to ttyS0 at 115200 baud. SOL should display the Ubuntu login prompt. Enter ~. to close the ipmitool SOL session. After the next restart, verify that /proc/cmdline contains console=ttyS0,115200n8 and that the login prompt returns.
10.7 Optional: Add the server to a monitoring system
Add the BMC to the site's HTTPS and Redfish monitoring system. Confirm that the collector can read the service root, system health, sensor resources, logs, and service conditions. The detailed collector and Redfish event examples are in Appendix D.
Test each configured SNMP or SMTP destination with the site's normal receiver. The Redfish SSE test in Appendix D validates the Redfish event stream; it does not by itself prove SNMP or SMTP delivery.
Use these focused checks when a procedure in this guide does not produce the expected result. For other faults, use the Cisco UCS C880A M8 Rack Server Troubleshooting Guide or collect the Chapter 10 artifacts for Cisco support.
11.1 HTTPS remote media does not mount
The installation in Chapter 4 uses CIFS. Use this procedure when an HTTPS repository is selected and the BMC cannot open or stream the ISO.
On the Ubuntu image server, install NGINX, OpenSSL, and the Basic Authentication utility:
| sudo apt-get update sudo apt-get install -y nginx openssl apache2-utils sudo install -d -m 0755 /srv/rmedia sudo htpasswd -c /etc/nginx/.htpasswd <image-user> |
Copy the ISO to /srv/rmedia, then create a certificate whose subject alternative name matches the exact IP address or FQDN entered in the BMC:
| IMAGE_SERVER=<image-server-ip-or-fqdn> SAN=IP:<image-server-ip> # For a DNS name, use: SAN=DNS:<image-server-fqdn>
sudo openssl req -x509 -nodes -newkey rsa:2048 -days 365 \ -keyout /etc/nginx/rmedia.key \ -out /etc/nginx/rmedia.crt \ -subj "/CN=$IMAGE_SERVER" \ -addext "subjectAltName=$SAN" |
Create /etc/nginx/sites-available/rmedia:
| server { listen 443 ssl; server_name <image-server-ip-or-fqdn>;
ssl_certificate /etc/nginx/rmedia.crt; ssl_certificate_key /etc/nginx/rmedia.key;
root /srv/rmedia; auth_basic "Remote media"; auth_basic_user_file /etc/nginx/.htpasswd;
location / { autoindex on; try_files $uri =404; } } |
Enable the site and restart NGINX:
| sudo ln -s /etc/nginx/sites-available/rmedia \ /etc/nginx/sites-enabled/rmedia sudo nginx -t sudo systemctl restart nginx sudo systemctl --no-pager --full status nginx |
Verify authentication, certificate matching, and byte-range delivery from a management workstation:
| curl --cacert rmedia.crt -u '<image-user>:<image-password>' \ -I 'https://<image-server-ip-or-fqdn>/<os-installer>.iso'
curl --cacert rmedia.crt -u '<image-user>:<image-password>' \ -H 'Range: bytes=0-1023' \ -D - -o /dev/null \ 'https://<image-server-ip-or-fqdn>/<os-installer>.iso' |
The first request returns HTTP 200 and the file length. The range request returns HTTP 206 Partial Content with Content-Range: bytes 0-1023/....
In Image Redirection > Remote Images > Media General Settings, select HTTPS and enter the same server address, port 443, ISO path, and Basic Authentication credentials. Save the settings, refresh the image list, select the ISO, and start redirection. Continue when Redirection Status shows Started.
For Redfish mounting, use the same URL and credentials in the InsertMedia request in Section D.10. A completed task must be followed by a readback that shows Inserted: true, ConnectedVia: "URI" and RedirectionStatus: "Redirection Started".
11.2 Fabric Manager does not start
If Fabric Manager reports that ib_umad is unavailable, verify the package, module, UMAD device, and service:
| dpkg-query -W libibumad3 infiniband-diags sudo modprobe ib_umad lsmod | grep '^ib_umad' ls -1 /dev/infiniband/umad* 2>/dev/null sudo systemctl restart nvidia-fabricmanager systemctl --no-pager --full status nvidia-fabricmanager journalctl -u nvidia-fabricmanager -b --no-pager | tail -n 80 |
Expected result: ib_umad is loaded, at least one UMAD device is present, and Fabric Manager reports active. If the module or device is absent, include the service journal, PCIe inventory, and Chapter 10 support files in the Cisco support case.
11.3 Restore a ConnectX-8 NVConfig backup
Use the raw file created in Section 6.5 only with the matching PCI function. Apply it with the MFT set_raw command:
| sudo mlxconfig \ -d <matching-connectx-8-bdf> \ -f <matching-nvconfig-backup.raw> \ set_raw |
Confirm the prompt, then perform the power action reported by MFT. Query the device again and verify that Current and Next Boot contain the intended values.
Appendix A. Glossary and command prerequisites
The following table lists terms used in the host and adapter procedures.
Table 7. Glossary of terms used in host and adapter procedures
| Term |
Meaning |
| BDF |
PCI bus:device:function address |
| BMC |
Baseboard Management Controller |
| C8180P |
NVIDIA ConnectX-8 OCP 3.0 adapter model used for the east-west interfaces |
| DCGM |
NVIDIA Data Center GPU Manager |
| DPU |
Data processing unit |
| MFT |
NVIDIA firmware tools |
| MST |
Mellanox software tools service and command supplied by MFT |
| NVConfig |
Nonvolatile adapter configuration |
| PSID |
Parameter set ID; the board-specific firmware identifier |
| Redfish |
DMTF management API used by the BMC |
| SOL |
Serial over LAN |
Each procedure installs its required utilities before first use. The table below lists the main package groups.
Table 8. Utilities package groups
| Procedure |
Packages or source |
| Redfish management workstation |
curl, jq, OpenSSL, Python 3, python3-venv |
| Host inventory |
pciutils, numactl, nvme-cli, smartmontools, ethtool, iproute2 |
| RDMA checks |
ibverbs-utils, infiniband-diags, perftest |
| Adapter firmware |
NVIDIA MFT package mft |
| GPU stack |
NVIDIA driver, CUDA toolkit, NCCL, DCGM, Fabric Manager, NVLink packages |
| CPU, memory, storage tests |
stress-ng, fio |
| Support archives |
file, zstd |
Appendix B. BIOS, NUMA, and IOMMU reference
Use this appendix to review the active BIOS policy and confirm its effect from the operating system. Complete Section D.1 before running the Redfish commands.
Read the current BIOS attributes and the pending settings resource before an operating system, firmware, or performance policy change:
| curl "${CURL[@]}" \ "https://$BMC/redfish/v1/Systems/DGX/Bios" | jq '{Id,Name,Attributes}'
curl "${CURL[@]}" \ "https://$BMC/redfish/v1/Systems/DGX/Bios/Settings" | jq '{Id,Name,Attributes}' |
The first response is the current state. The Settings resource contains values staged for a later BIOS apply operation. A read-only baseline must not PATCH either resource.
Check the BIOS policy areas listed in the following table.
Table 9. BIOS policy areas
| Policy area |
Factory default value |
Operational meaning |
| IOMMU |
Enabled. |
VT-d is available to the host; confirm the runtime DMA domain in Linux. |
| NUMA |
Enabled; virtual NUMA disabled. |
Preserve the physical two-socket locality model unless the workload design requires another topology. |
| CPU |
All configured cores and logical processors enabled; virtualization enabled. |
Provides the full purchased CPU inventory and hardware virtualization extensions. |
| Performance |
Turbo enabled; OS controls EPB; performance bias; latency-optimized mode enabled; workload profile I/O sensitive. |
Factory-default performance profile. |
| Idle states |
Package C0/C1; C1E disabled. |
Favors response time over deeper idle-state power savings. |
| PCIe |
Speed and width Auto; relaxed ordering and P2P relaxed ordering enabled; ARI enabled. |
Allows platform firmware to negotiate the installed GPU and adapter topology. |
| NVIDIA PCIe policy |
ACS control disabled. |
Change only when the deployment requires it. |
| Boot and security |
UEFI; TPM enabled; check Secure Boot state. |
Secure Boot affects kernel-module signing. |
Cross-check the BIOS view from the host:
| sudo apt-get update sudo apt-get install -y numactl mokutil command -v numactl mokutil |
Expected output: One executable path for each command.
| lscpu | grep -E 'CPU\(s\)|Socket|NUMA' numactl --hardware cat /proc/cmdline sudo dmesg | grep -Ei 'DMAR|IOMMU.*enabled|Default domain|DMA domain' | head -n 80 mokutil --sb-state |
Sample result, abridged:
| Socket(s): 2 NUMA node(s): 2 IOMMU: enabled Default domain type: Translated SecureBoot disabled |
Start with the factory default BIOS. Use iommu=pt only when the selected GPUDirect or application design requires IOMMU pass-through, then repeat the GPU and network checks that apply to the deployment.
Appendix C. Extended GPU qualification
Use these longer tests when the application team needs a repeatable GPU communication baseline beyond the Chapter 7 checks.
Run the CUDA peer-to-peer sample when a direct executable test is required. The CUDA toolkit and compiler must already be installed as described in Sections 7.5 and 7.6. Install CMake, download a fixed CUDA Samples release, verify its checksum, and build only the required target:
| sudo apt-get update sudo apt-get install -y cmake cmake --version | head -n 1
curl -fL -o cuda-samples-v13.0.tar.gz \ https://github.com/NVIDIA/cuda-samples/archive/refs/tags/v13.0.tar.gz sha256sum cuda-samples-v13.0.tar.gz tar -xzf cuda-samples-v13.0.tar.gz
cmake \ -S cuda-samples-13.0 \ -B cuda-samples-13.0/build-sm103 \ -DCMAKE_BUILD_TYPE=Release \ -DCMAKE_CUDA_ARCHITECTURES=103 cmake --build cuda-samples-13.0/build-sm103 \ --target p2pBandwidthLatencyTest \ -j8
cuda-samples-13.0/build-sm103/Samples/5_Domain_Specific/\ p2pBandwidthLatencyTest/p2pBandwidthLatencyTest |
Sample release and checksum:
| CUDA Samples release: v13.0 SHA-256: 63cc9d5d8280c87df3c1f4e2276234a0f42cc497c52b40dd5bdda2836607db79 |
Sample output, abridged:
| P2P Connectivity Matrix D\D 0 1 2 3 4 5 6 7 0 1 1 1 1 1 1 1 1 ... 7 1 1 1 1 1 1 1 1
Unidirectional P2P=Enabled Bandwidth Matrix (GB/s) ... Bidirectional P2P=Enabled Bandwidth Matrix (GB/s) ... P2P=Enabled Latency Matrix (us) ... |
The connectivity matrix must show peer access for every expected GPU pair. Keep the full bandwidth and latency matrices when they will be used as a site baseline. The absolute values depend on software, topology, power state, and test release; the portable acceptance criteria are complete peer visibility and a successful exit without CUDA errors.
Select additional NCCL profiles according to the question being answered.
Table 10. Validation questions for selecting NCCL profiles
| Validation question |
Test |
| Can every GPU access every peer through the expected topology? |
CUDA p2pBandwidthLatencyTest |
| Does one GPU pair exchange data correctly? |
Two-GPU sendrecv_perf |
| Do all four GPU pairs exchange concurrently? |
Eight-GPU sendrecv_perf |
| Does collective bandwidth scale across message sizes? |
Multiscale all_reduce_perf |
| Is a large collective stable over repeated iterations? |
Fixed-size sustained all_reduce_perf |
| Does a workload-specific collective path work? |
all_gather_perf or reduce_scatter_perf |
The result blocks below illustrate the output format. Bandwidth values vary by software and configuration; use successful completion, #wrong 0, and Out of bounds values: 0 OK as the portable acceptance criteria.
Run a two-GPU point-to-point profile:
| CUDA_VISIBLE_DEVICES=0,1 NCCL_DEBUG=WARN \ "$HOME/nccl-tests/build/sendrecv_perf" \ -b 1G -e 1G -g 2 -w 10 -n 50 -c 1 -z 1 |
Example result format:
| NCCL version 2.28.9+cuda13.0 1 GiB out-of-place bus bandwidth: 657.50 GB/s, #wrong 0 1 GiB in-place bus bandwidth: 652.18 GB/s Out of bounds values: 0 OK Average bus bandwidth: 654.842 GB/s |
Run four concurrent GPU pairs:
| CUDA_VISIBLE_DEVICES=0,1,2,3,4,5,6,7 NCCL_DEBUG=WARN \ "$HOME/nccl-tests/build/sendrecv_perf" \ -b 1G -e 1G -g 8 -w 10 -n 50 -c 1 -z 1 |
Example result format:
| 8 GiB out-of-place bus bandwidth: 835.90 GB/s, #wrong 0 8 GiB in-place bus bandwidth: 836.12 GB/s, #wrong 0 Out of bounds values: 0 OK Average bus bandwidth: 836.009 GB/s |
Run a fixed size sustained all reduce:
| CUDA_VISIBLE_DEVICES=0,1,2,3,4,5,6,7 NCCL_DEBUG=WARN \ "$HOME/nccl-tests/build/all_reduce_perf" \ -b 8G -e 8G -g 8 -w 10 -n 100 -c 1 -z 1 |
Example result format:
| 8 GiB out-of-place bus bandwidth: 835.90 GB/s, #wrong 0 8 GiB in-place bus bandwidth: 836.12 GB/s, #wrong 0 Out of bounds values: 0 OK Average bus bandwidth: 836.009 GB/s |
Pass is indicated when the command exits successfully, every GPU pair completes, GPU memory is released, and the kernel journal contains no new error.
Appendix D. Redfish monitoring and automation reference
Use Redfish to integrate the server with a monitoring or automation platform without relying on the BMC UI. This appendix covers authentication, resource discovery, inventory, health, sensors, logs, events, tasks, virtual media, one-time boot, PXE handoff, and support-data collection.
The examples were exercised against C880A M8 BMC firmware 4.0(1.260014). Discover member IDs and action targets on each system.
D.1 Authenticate and test the service root
On an Ubuntu management workstation, install the Redfish tools:
| sudo apt-get update sudo apt-get install -y curl jq openssl python3 python3-venv curl --version | head -n 1 jq --version openssl version python3 --version |
Expected result: APT completes without a dependency error and every version command identifies the installed utility.
Set the connection variables and reusable verified curl options:
| export BMC=<bmc-fqdn> export BMC_USER=<bmc-user> export BMC_PASS='<bmc-password>' export BMC_CA=<path-to-bmc-ca-or-chain.pem>
CURL=( --noproxy '*' --fail --silent --show-error --cacert "$BMC_CA" -u "$BMC_USER:$BMC_PASS" )
curl "${CURL[@]}" "https://$BMC/redfish/v1" | jq '{RedfishVersion, Systems, Chassis, Managers, UpdateService, EventService}' |
Sample service root result, abridged:
| { "RedfishVersion": "1.15.1", "Systems": {"@odata.id": "/redfish/v1/Systems"}, "Managers": {"@odata.id": "/redfish/v1/Managers"}, "Chassis": {"@odata.id": "/redfish/v1/Chassis"}, "UpdateService": {"@odata.id": "/redfish/v1/UpdateService"}, "EventService": {"@odata.id": "/redfish/v1/EventService"} } |
Use the CA or chain that validates the certificate installed in Section 2.5. During initial certificate bootstrap only, -k can replace --cacert; return to the verified CURL array after the certificate is installed.
D.2 Discover implementation resource IDs
Discover resource IDs from each collection and follow their @odata.id links:
| for collection in Systems Managers Chassis; do curl "${CURL[@]}" \ "https://$BMC/redfish/v1/$collection" | jq -r '.Members[]."@odata.id"' done |
Sample output, abridged:
| /redfish/v1/Systems/DGX /redfish/v1/Systems/HGX_Baseboard_0 /redfish/v1/Managers/BMC /redfish/v1/Managers/HGX_BMC_0 /redfish/v1/Managers/HGX_FabricManager_0 /redfish/v1/Chassis/Backplane /redfish/v1/Chassis/CPUBaseboard /redfish/v1/Chassis/DCSCM /redfish/v1/Chassis/DGX ... |
The examples in the table below use these discovered C880A M8 members.
Table 11. Examples of implementation resource IDs
| Area |
Resource |
| Host system |
/redfish/v1/Systems/DGX |
| HGX baseboard system |
/redfish/v1/Systems/HGX_Baseboard_0 |
| Cisco BMC |
/redfish/v1/Managers/BMC |
| HGX BMC |
/redfish/v1/Managers/HGX_BMC_0 |
| HGX Fabric Manager |
/redfish/v1/Managers/HGX_FabricManager_0 |
| Main chassis |
/redfish/v1/Chassis/DGX |
The literal resource IDs are part of this Redfish implementation and must be used as returned, including capitalization.
D.3 Capture inventory and health
The following commands collect an abridged baseline without changing the system:
| curl "${CURL[@]}" \ "https://$BMC/redfish/v1/Systems/DGX" | jq '{Model, BiosVersion, PowerState, ProcessorSummary, MemorySummary, Status}'
curl "${CURL[@]}" \ "https://$BMC/redfish/v1/Managers/BMC" | jq '{FirmwareVersion, ManagerType, DateTime, DateTimeLocalOffset, Status}'
curl "${CURL[@]}" \ "https://$BMC/redfish/v1/Systems/HGX_Baseboard_0" | jq '{Name, Model, ProcessorSummary, Status}' |
Expected output, abridged:
| {"Model":"<configured-C880A-product-id>","BiosVersion":"C880M8.4.0.1.42","PowerState":"On", "ProcessorSummary":{"Count":2,"Status":{"Health":"OK"}}, "MemorySummary":{"TotalSystemMemoryGiB":3072,"Status":{"Health":"OK"}}, "Status":{"Health":"OK","State":"Enabled"}} {"FirmwareVersion":"4.0(1.260014)","ManagerType":"BMC", "DateTime":"<current-UTC-time>","DateTimeLocalOffset":"+00:00", "Status":{"Health":"OK","State":"Enabled"}} {"Name":"HGX_Baseboard_0","Model":"NA","ProcessorSummary":null, "Status":{"Health":"OK","State":"Enabled"}} |
Counts and model strings must match the purchased configuration. Use the host system summaries for CPU and memory. Use the GPU inventory resources for accelerator count. Evaluate the HGX baseboard by its current Status and the detailed HGX resources.
Interpret the main fields as shown in the table below.
Table 12. Meanings of baseline fields
| Field |
Meaning |
| Model |
Target product or subsystem model |
| BiosVersion |
Active host BIOS |
| PowerState |
Current host power state |
| ProcessorSummary |
CPU or accelerator count and health |
| MemorySummary |
Installed host memory and health |
| Status.State |
Resource availability |
| Status.Health |
Current health |
| Status.HealthRollup |
Aggregated child-resource health |
Use the detailed sensor and log resources when a rollup reports Warning or Critical.
Collect the complete firmware inventory:
| FIRMWARE_URI=/redfish/v1/UpdateService/FirmwareInventory curl "${CURL[@]}" "https://$BMC$FIRMWARE_URI" >firmware-collection.json
jq '{ count: ."Members@odata.count", next: ."Members@odata.nextLink" }' firmware-collection.json
jq -r '.Members[]."@odata.id"' firmware-collection.json | while IFS= read -r uri; do curl "${CURL[@]}" "https://$BMC$uri" | jq -c '{ id: .Id, name: .Name, version: .Version, updateable: .Updateable, status: .Status }' done |
Sample collection and representative members:
| count: 70 next: null {"id":"BIOS","name":"BIOS","version":"4.0.1.42","updateable":true,"status":null} {"id":"BMC","name":"BMC","version":"4.0(1.260014)","updateable":true,"status":null} {"id":"HGX_FW_ConnectX_0","name":"HGX_FW_ConnectX_0","version":"40.47.2526","updateable":true,"status":null} |
Pass is indicated when each member returns a version that matches the approved firmware set. Use the current resource health endpoints for state.
Collect the storage members exposed by the host System resource:
| SYSTEM_URI=/redfish/v1/Systems/DGX STORAGE_URI=$( curl "${CURL[@]}" "https://$BMC$SYSTEM_URI" | jq -r '.Storage."@odata.id"' )
curl "${CURL[@]}" "https://$BMC$STORAGE_URI" | jq '{"count": ."Members@odata.count", "members": [.Members[]."@odata.id"]}'
curl "${CURL[@]}" "https://$BMC$STORAGE_URI" | jq -r '.Members[]."@odata.id"' | while IFS= read -r uri; do curl "${CURL[@]}" "https://$BMC$uri" | jq -c '{ id: .Id, name: .Name, status: .Status, drive_count: (if .Drives then (.Drives | length) else 0 end), controllers: .Controllers, volumes: .Volumes }' done |
Use the BMC storage inventory or host storage tools for a configured boot logical device when its controller members are not exposed by Redfish.
D.4 Collect sensors and subsystem health
Discover the sensor collection:
| curl "${CURL[@]}" \ "https://$BMC/redfish/v1/Chassis/DGX/Sensors" | jq '{"count": ."Members@odata.count", "members": [.Members[]."@odata.id"]}' |
Sample output, abridged:
| { "count": 324, "members": [ "/redfish/v1/Chassis/DGX/Sensors/<sensor-id>", "..." ] } |
Collect a compact status table from every member:
| curl "${CURL[@]}" \ "https://$BMC/redfish/v1/Chassis/DGX/Sensors" | jq -r '.Members[]."@odata.id"' | while IFS= read -r uri; do curl "${CURL[@]}" \ "https://$BMC$uri" | jq -c '{ id: .Id, name: .Name, reading: .Reading, units: .ReadingUnits, state: .Status.State, health: .Status.Health }' done |
Example abridged sensor:
| { "id": "TEMP_CPU0", "name": "CPU0 Temperature", "reading": 39, "units": "Cel", "state": "Enabled", "health": "OK" } |
Not every sensor has a numeric reading. Preserve discrete state, health, and threshold fields in monitoring software. URL-encode sensor IDs that contain spaces or reserved characters.
Review the power and thermal subsystems separately:
| curl "${CURL[@]}" \ "https://$BMC/redfish/v1/Chassis/DGX/PowerSubsystem" | jq .
curl "${CURL[@]}" \ "https://$BMC/redfish/v1/Chassis/DGX/ThermalSubsystem" | jq . |
Sample output, abridged:
| PowerSubsystem.Status.Health = OK PowerSubsystem.Status.State = Enabled Power redundancy mode = NPlusM Power supply members = 12 Thermal collection members = <member-count> |
Follow the links in PowerSupplies, Fans, and related collections for per-device readings. A healthy rollup does not replace per-member monitoring.
D.5 Collect logs and active conditions
Common Redfish log endpoints include:
| /redfish/v1/Managers/BMC/LogServices/SEL/Entries /redfish/v1/Managers/BMC/LogServices/EventLog/Entries /redfish/v1/Managers/BMC/LogServices/AuditLog/Entries /redfish/v1/Managers/BMC/LogServices/DecodedLog/Entries /redfish/v1/Systems/DGX/LogServices/BIOS/Entries /redfish/v1/Chassis/DGX/LogServices/Logs/Entries /redfish/v1/Managers/HGX_BMC_0/LogServices/EventLog/Entries /redfish/v1/Managers/HGX_BMC_0/LogServices/Journal/Entries |
Example:
| curl "${CURL[@]}" \ "https://$BMC/redfish/v1/Managers/BMC/LogServices/SEL/Entries" | jq '.Members[] | { Id, Created, Severity, Message, MessageId, SensorNumber }' |
Expected output structure, abridged:
| { "Id": "<entry-id>", "Created": "<timestamp>", "Severity": "OK", "Message": "<event-message>", "MessageId": "<registry-message-id>", "SensorNumber": "<sensor-number-or-null>" } |
An empty Members array is valid when the selected log has no entries. Severity can be OK, Warning, or Critical; retain all three.
Follow Members@odata.nextLink when present. A dashboard collector that reads only the first page can miss older or less severe events.
ServiceConditions is a Conditions array, not a member collection:
| CONDITIONS_URI=/redfish/v1/ServiceConditions curl "${CURL[@]}" "https://$BMC$CONDITIONS_URI" >service-conditions.json
jq '{ health_rollup: .HealthRollup, count: (.Conditions | length), severities: [.Conditions[].Severity] | group_by(.) | map({severity: .[0], count: length}) }' service-conditions.json
jq -c '.Conditions[] | { severity: .Severity, message_id: .MessageId, timestamp: .Timestamp, origin: .OriginOfCondition."@odata.id", log_entry: .LogEntry."@odata.id" }' service-conditions.json |
Follow every linked log and each unique origin:
| jq -r ' .Conditions[] | (.LogEntry."@odata.id" // empty) | select(type == "string" and startswith("/")) ' service-conditions.json | sort -u | while IFS= read -r uri; do curl "${CURL[@]}" "https://$BMC$uri" | jq -c '{ id: .Id, created: .Created, severity: .Severity, resolved: .Resolved, message_id: .MessageId, message: .Message }' done
jq -r ' .Conditions[] | (.OriginOfCondition."@odata.id" // empty) | select(type == "string" and startswith("/")) ' service-conditions.json | sort -u | while IFS= read -r uri; do curl "${CURL[@]}" "https://$BMC$uri" | jq -c '{id: .Id, status: .Status}' done |
Check the condition timestamp, linked log entry, and current origin-resource state. Keep current resource health and unresolved conditions as separate dashboard signals.
D.6 Monitor long-running tasks
Redfish actions can return 202 Accepted and a task URI in the Location response header. Use this bounded helper for the task examples in this appendix:
| poll_redfish_task() { local task_uri=$1 local timeout_seconds=${2:-900} local deadline=$(( $(date +%s) + timeout_seconds )) local task state status
while (( $(date +%s) < deadline )); do task=$(curl "${CURL[@]}" "https://$BMC$task_uri") || return 1 jq '{TaskState,TaskStatus,PercentComplete,Messages}' <<<"$task"
state=$(jq -r '.TaskState // empty' <<<"$task") status=$(jq -r '.TaskStatus // empty' <<<"$task")
if [[ "$state" == "Completed" ]]; then [[ "$status" == "OK" ]] && return 0 printf 'Task completed with status %s\n' "$status" >&2 return 1 fi
case "$state" in Exception|Interrupted|Suspended|Killed|Cancelled) printf 'Task ended in state %s\n' "$state" >&2 return 1 ;; esac sleep 5 done
printf 'Task did not complete within %s seconds\n' \ "$timeout_seconds" >&2 return 1 } |
Call the helper with a relative task URI and a timeout:
| poll_redfish_task "$TASK_URI" 900 |
Pass is indicated when the task reaches Completed with TaskStatus: OK. Treat a failed terminal state, a non-OK completed status, or the timeout as a failed operation.
D.7 Receive and test Redfish events
The EventService supports a Server-Sent Events stream and the SubmitTestEvent action on firmware 4.0(1.260014). Discover both from the service before use:
| curl "${CURL[@]}" "https://$BMC/redfish/v1/EventService" | jq '{ServerSentEventUri,Actions,Subscriptions}' curl "${CURL[@]}" \ "https://$BMC/redfish/v1/EventService/SubmitTestEventActionInfo" | jq . |
Start the listener in one terminal:
| curl "${CURL[@]}" --no-buffer \ "https://$BMC/redfish/v1/EventService/SSE" |
Keep this listener connected, or create an EventDestination subscription before calling SubmitTestEvent. With no active listener or subscription, the task ends in Exception with No Active Event Subscriptions.
In a second terminal, define a helper that submits one event and waits for its task:
| SUBMIT_EVENT_URI=$( curl "${CURL[@]}" "https://$BMC/redfish/v1/EventService" | jq -r '.Actions["#EventService.SubmitTestEvent"].target' )
submit_test_event() { local event_id=$1 local message_id=$2 local origin=$3 local severity=$4 local message_args=$5
jq -n \ --arg event_id "$event_id" \ --arg timestamp "$(date -u +%Y-%m-%dT%H:%M:%SZ)" \ --arg message_id "$message_id" \ --arg origin "$origin" \ --arg severity "$severity" \ --argjson message_args "$message_args" \ '{ EventId: $event_id, EventTimestamp: $timestamp, MessageArgs: $message_args, MessageId: $message_id, OriginOfCondition: $origin, Severity: $severity }' >test-event.json
curl "${CURL[@]}" \ -X POST \ -H 'Content-Type: application/json' \ -D test-event.headers \ -o test-event.body \ "https://$BMC$SUBMIT_EVENT_URI" \ --data-binary @test-event.json
head -n 5 test-event.headers jq . test-event.body
TASK_URI=$( awk 'tolower($1) == "location:" { gsub("\r", "", $2); print $2 }' test-event.headers ) test -n "$TASK_URI" poll_redfish_task "$TASK_URI" 300 } |
Submit four message shapes, one at a time:
| submit_test_event \ C880A-EVENT-STATUS \ EventLog.1.0.StatusChange \ /redfish/v1/Systems/DGX \ OK \ '["Health","/redfish/v1/Systems/DGX","Warning","OK"]'
submit_test_event \ C880A-EVENT-ALERT \ EventLog.1.0.Alert \ /redfish/v1/Chassis/DGX/Sensors/SPD_FAN_10_F \ OK \ '["Fan monitor","dashboard-warning-test"]'
submit_test_event \ C880A-EVENT-THRESHOLD \ EventLog.1.0.TriggerAlert \ /redfish/v1/Chassis/DGX/Sensors/TEMP_AMBIENT \ Critical \ '["UpperCritical","/redfish/v1/Chassis/DGX/Sensors/TEMP_AMBIENT","Reading","41"]'
submit_test_event \ C880A-EVENT-LOGIN \ Security.1.0.LoginSuccess \ /redfish/v1/AccountService \ OK \ '["redfish-monitor","Redfish"]' |
Each action returned:
| HTTP/1.1 202 Accepted Location: /redfish/v1/TaskService/Tasks/<task-id> TaskState: Completed TaskStatus: OK |
Pass is indicated when the SSE listener receives all four event IDs with their matching MessageId and MessageArgs.
For persistent delivery, run an HTTP receiver that accepts Redfish event POSTs, then create an EventDestination:
| EVENT_RECEIVER='https://<event-receiver>/redfish-events'
jq -n --arg destination "$EVENT_RECEIVER" '{ Destination: $destination, Protocol: "Redfish", Context: "c880a-monitoring", EventFormatType: "Event", RegistryPrefixes: ["EventLog", "Security"] }' >subscription-payload.json
curl "${CURL[@]}" \ -D subscription.headers \ -o subscription.json \ -H 'Content-Type: application/json' \ -X POST \ "https://$BMC/redfish/v1/EventService/Subscriptions" \ --data-binary @subscription-payload.json
SUBSCRIPTION_URI=$( awk 'tolower($1) == "location:" { gsub("\r", "", $2); print $2 }' subscription.headers )
curl "${CURL[@]}" "https://$BMC$SUBSCRIPTION_URI" | jq '{Id,Destination,Context,Protocol,RegistryPrefixes,Status}' |
Sample result:
| HTTP/1.1 201 Created Location: /redfish/v1/EventService/Subscriptions/<subscription-id>
Protocol: Redfish RegistryPrefixes: Security, EventLog Status.Health: OK Status.State: Enabled |
Use the Location header as the subscription member URI. Submit the four test events above, waiting for each task before sending the next. The receiver should record four POST requests with the configured Context and matching event IDs.
Remove the test subscription:
| curl "${CURL[@]}" \ -X DELETE \ -o /dev/null -w 'HTTP %{http_code}\n' \ "https://$BMC$SUBSCRIPTION_URI" |
Expected result:
| HTTP 204 |
Create the production EventDestination with the event receiver, registry filters, and retry policy selected for the monitoring platform.
D.8 Read and change the BMC configuration
| curl "${CURL[@]}" \ "https://$BMC/redfish/v1/Managers/BMC" | jq '{DateTime, DateTimeLocalOffset}'
curl "${CURL[@]}" \ "https://$BMC/redfish/v1/Managers/BMC/NetworkProtocol" | jq '.NTP' |
Sample output:
| { "DateTime": "<current-UTC-time>", "DateTimeLocalOffset": "+00:00" } { "ProtocolEnabled": true, "Port": 123, "NTPServers": ["<ntp-server-1>", "<ntp-server-2>"] } |
Firmware 4.0(1.260014) requires a PATCH precondition. Read the current ETag before changing either resource:
| MANAGER_ETAG=$( curl "${CURL[@]}" \ -D - -o /dev/null \ "https://$BMC/redfish/v1/Managers/BMC" | awk 'tolower($1) == "etag:" {gsub("\r", "", $2); print $2}' )
CURRENT_UTC=$(date -u '+%Y-%m-%dT%H:%M:%S+00:00')
curl "${CURL[@]}" \ -H 'Content-Type: application/json' \ -H "If-Match: $MANAGER_ETAG" \ -X PATCH \ "https://$BMC/redfish/v1/Managers/BMC" \ -d "{\"DateTime\":\"$CURRENT_UTC\"}" \ -o /dev/null -w 'HTTP %{http_code}\n' |
The expected success status is HTTP 204. A request without If-Match returns HTTP 428 on firmware 4.0(1.260014).
After confirming that both site time sources return NTP responses from the management network, enable NTP:
| NTP_ETAG=$( curl "${CURL[@]}" \ -D - -o /dev/null \ "https://$BMC/redfish/v1/Managers/BMC/NetworkProtocol" | awk 'tolower($1) == "etag:" {gsub("\r", "", $2); print $2}' )
curl "${CURL[@]}" \ -H 'Content-Type: application/json' \ -H "If-Match: $NTP_ETAG" \ -X PATCH \ "https://$BMC/redfish/v1/Managers/BMC/NetworkProtocol" \ -d '{"NTP":{"ProtocolEnabled":true,"NTPServers":["<ntp-server-1>","<ntp-server-2>"]}}' \ -o /dev/null -w 'HTTP %{http_code}\n' |
Expected output:
| HTTP 204 |
Read the resource before every change. A PATCH that repeats values already applied can return HTTP 400 with SyncAgent.1.0.PatchValueAlreadyExists.
If synchronization fails, confirm DNS resolution, routing, firewall policy, and UDP port 123 reachability from the BMC management network. Correct the time before installing a production TLS certificate. ManagerNetworkProtocol reports whether NTP is enabled and which servers are configured. It does not expose a separate synchronization status. Poll Manager.DateTime and compare it with a trusted UTC reference.
D.9 Build a monitoring collector
Organize the collected data into four layers.
Table 13. Layers for monitoring data
| Layer |
Purpose |
Primary resources |
| Inventory |
Identify the server, managers, chassis, and software state |
Service root, systems, managers, chassis, and firmware inventory |
| Rollup health |
Show immediate OK, Warning, Critical, and reachability state |
Host system, HGX baseboard, main chassis, managers, and service conditions |
| Metrics |
Show thermal, fan, voltage, current, power, and energy values |
Sensors, thermal subsystem, and power subsystem |
| Evidence |
Connect an alert to logs, tasks, and diagnostic data |
Service conditions, log services, TaskService, and HGX diagnostic data |
At each collection cycle:
1. Fetch the system, manager, and chassis rollups.
2. Fetch /redfish/v1/ServiceConditions and preserve every condition's severity, message ID, timestamp, origin, and linked log entry.
3. Fetch the sensor members and normalize numeric and discrete readings.
4. Fetch power and thermal rollups and their member collections.
5. Fetch recent log entries, following pagination links.
6. Collect firmware and software inventory on a slower schedule.
7. Publish a collection timestamp, endpoint latency, and endpoint error list with the hardware data.
The following table shows examples of starting intervals. Adjust them for fleet size, BMC response time, and the monitoring service-level objective.
Table 14. Examples of starting intervals
| Data |
Starting interval |
| System, manager, and chassis rollups |
30 to 60 seconds |
| Active service conditions |
30 to 60 seconds |
| Numeric and discrete sensors |
30 to 60 seconds |
| Recent log entries |
2 to 5 minutes |
| Service root and collection membership |
10 to 60 minutes |
| Firmware and software inventory |
10 to 60 minutes |
| Active maintenance task |
15 to 30 seconds |
Treat an unreachable endpoint, stale data, timeout, or missing required collection as Unknown, not OK. Do not treat a null sensor health value as a failure by itself, and do not assume that an empty or old task collection represents an active fault.
The BMC also exposes TelemetryService:
| curl "${CURL[@]}" \ "https://$BMC/redfish/v1/TelemetryService" | jq '{ ServiceEnabled, MaxReports, MinCollectionInterval, SupportedCollectionFunctions, MetricDefinitions, MetricReportDefinitions, MetricReports, Triggers }' |
Sample output, abridged:
| { "ServiceEnabled": true, "MaxReports": 5, "MinCollectionInterval": "PT10M", "SupportedCollectionFunctions": [ "Average", "Maximum", "Summation", "Minimum" ], "MetricDefinitions": { "@odata.id": "/redfish/v1/TelemetryService/MetricDefinitions" }, "MetricReportDefinitions": { "@odata.id": "/redfish/v1/TelemetryService/MetricReportDefinitions" } } |
Use the chassis sensor collection as the primary source for a near-real-time dashboard. Use TelemetryService only after the deployment defines and validates metric reports. Respect MinCollectionInterval; PT10M means 10 minutes and is not suitable for a 30-second metric-refresh loop.
D.10 Discover and insert virtual media
Inspect the BMC manager and action metadata:
| curl "${CURL[@]}" \ "https://$BMC/redfish/v1/Managers/BMC" | jq '.Actions'
curl "${CURL[@]}" \ "https://$BMC/redfish/v1/Managers/BMC/Oem/EnableRMediaActionInfo" | jq .
curl "${CURL[@]}" \ "https://$BMC/redfish/v1/Managers/BMC/Oem/ConfigureCDInstanceActionInfo" | jq . |
Sample action metadata, abridged:
| #AMIVirtualMedia.EnableRMedia target: /redfish/v1/Managers/BMC/Actions/Oem/AMIVirtualMedia.EnableRMedia RMediaState allowable values: Enable, Disable
#AMIVirtualMedia.ConfigureCDInstance target: /redfish/v1/Managers/BMC/Actions/Oem/AMIVirtualMedia.ConfigureCDInstance CDInstance allowable values: 0, 1, 2, 3, 4 |
The action metadata allows the parameters shown in the table below.
Table 15. Parameters for action metadata
| Action |
Parameter |
| Enable remote media |
RMediaState: Enable or Disable |
| Configure CD instances |
CDInstance: 0 through 4 |
Use the exact action targets returned by the manager:
| curl "${CURL[@]}" \ -H 'Content-Type: application/json' \ -X POST \ "https://$BMC/redfish/v1/Managers/BMC/Actions/Oem/AMIVirtualMedia.EnableRMedia" \ -d '{"RMediaState":"Enable"}'
curl "${CURL[@]}" \ -H 'Content-Type: application/json' \ -X POST \ "https://$BMC/redfish/v1/Managers/BMC/Actions/Oem/AMIVirtualMedia.ConfigureCDInstance" \ -d '{"CDInstance":1}' |
Sample result: Both actions returned HTTP 200. The response body reports Ami.1.0.DelayInActionCompletion with severity OK and instructs the client to verify the updated property after approximately 4 to 5 seconds.
| EnableRMedia action has been initiated successfully. ConfigureCDInstance action has been initiated successfully. |
Re-query the standard collection:
| curl "${CURL[@]}" \ "https://$BMC/redfish/v1/Managers/BMC/VirtualMedia" | jq -r '.Members[]."@odata.id"' |
Sample output:
| /redfish/v1/Managers/BMC/VirtualMedia/CD1 |
Confirm that /redfish/v1/Managers/BMC/VirtualMedia/CD1 is present and advertises VirtualMedia.InsertMedia.
Firmware 4.0(1.260014) requires nonempty UserName and Password fields in the insert request, including when the source URL is otherwise readable without authentication. Use a read-only repository account.
| INSERT_HTTP=$( curl "${CURL[@]}" \ -D insert.headers \ -o insert-task.json \ -w '%{http_code}' \ -H 'Content-Type: application/json' \ -X POST \ "https://$BMC/redfish/v1/Managers/BMC/VirtualMedia/CD1/Actions/VirtualMedia.InsertMedia" \ -d '{ "Image": "https://<image-repository>/<os-installer>.iso", "Inserted": true, "TransferMethod": "Stream", "TransferProtocolType": "HTTPS", "UserName": "<image-user>", "Password": "<image-password>", "WriteProtected": true }' )
printf 'HTTP %s\n' "$INSERT_HTTP" test "$INSERT_HTTP" = 202 |
Sample initial response:
| { "@odata.id": "/redfish/v1/TaskService/Tasks/<task-id>", "Description": "Task for InsertMedia Action", "Name": "InsertMedia Action", "TaskState": "New" } |
The request returns HTTP 202 and a Location header containing the same TaskService URI as the response body. Extract and poll the task:
| TASK_URI=$( awk 'tolower($1) == "location:" { gsub("\r", "", $2); print $2 }' insert.headers ) BODY_TASK_URI=$(jq -r '."@odata.id" // empty' insert-task.json)
test -n "$TASK_URI" if [[ -n "$BODY_TASK_URI" ]]; then test "$TASK_URI" = "$BODY_TASK_URI" fi
poll_redfish_task "$TASK_URI" 900 |
Expected terminal result:
| TaskState: Completed TaskStatus: OK MessageId: TaskEvent.1.0.TaskCompletedOK |
Verify the media resource:
| curl "${CURL[@]}" \ "https://$BMC/redfish/v1/Managers/BMC/VirtualMedia/CD1" | jq '{ Image, ImageName, Inserted, ConnectedVia, TransferProtocolType, RedirectionStatus: .Oem.Ami.RedirectionStatus }' |
Successful abridged state:
| { "ImageName": "<os-installer>.iso", "Inserted": true, "ConnectedVia": "URI", "TransferProtocolType": "HTTPS", "RedirectionStatus": "Redirection Started" } |
Do not proceed when the task reports success but the media resource reports Inserted: false, ConnectedVia: "NotConnected", or RedirectionStatus: "Stopped - Unable to Open".
D.11 Stage one-time boot and monitor the reset task
Discover the future-state resource and reset action from the host system:
| SYSTEM_URI=/redfish/v1/Systems/DGX curl "${CURL[@]}" "https://$BMC$SYSTEM_URI" >system.json
SETTINGS_URI=$(jq -r \ '."@Redfish.Settings".SettingsObject."@odata.id"' system.json) RESET_URI=$(jq -r \ '.Actions["#ComputerSystem.Reset"].target' system.json) RESET_INFO_URI=$(jq -r \ '.Actions["#ComputerSystem.Reset"]["@Redfish.ActionInfo"]' system.json)
printf 'settings=%s\nreset=%s\naction_info=%s\n' \ "$SETTINGS_URI" "$RESET_URI" "$RESET_INFO_URI"
curl "${CURL[@]}" "https://$BMC$RESET_INFO_URI" | jq '.Parameters[] | select(.Name == "ResetType")' |
The action values on firmware 4.0(1.260014) are ForceOff, ForceRestart, FullPowerCycle, GracefulRestart, GracefulShutdown, On, and PowerCycle.
Read the Settings resource and capture its ETag:
| curl "${CURL[@]}" \ -D settings.headers \ -o settings.json \ "https://$BMC$SETTINGS_URI"
SETTINGS_ETAG=$( awk 'tolower($1) == "etag:" { gsub("\r", "", $2); print $2 }' settings.headers )
jq '.Boot | { BootSourceOverrideEnabled, BootSourceOverrideMode, BootSourceOverrideTarget, enabled_values: ."BootSourceOverrideEnabled@Redfish.AllowableValues", target_values: ."BootSourceOverrideTarget@Redfish.AllowableValues" }' settings.json |
After the ISO is inserted, stage the one-time CD target:
| curl "${CURL[@]}" \ -H 'Content-Type: application/json' \ -H "If-Match: $SETTINGS_ETAG" \ -X PATCH \ "https://$BMC$SETTINGS_URI" \ -d '{ "Boot": { "BootSourceOverrideEnabled": "Once", "BootSourceOverrideMode": "UEFI", "BootSourceOverrideTarget": "Cd" } }' \ -o /dev/null -w 'HTTP %{http_code}\n'
curl "${CURL[@]}" "https://$BMC$SETTINGS_URI" | jq '.Boot | { BootSourceOverrideEnabled, BootSourceOverrideMode, BootSourceOverrideTarget }' |
Expected result:
| HTTP 204 { "BootSourceOverrideEnabled": "Once", "BootSourceOverrideMode": "UEFI", "BootSourceOverrideTarget": "Cd" } |
A PATCH without If-Match returns HTTP 428 on firmware 4.0(1.260014). The active System resource can continue to show Disabled and None before the restart; use the Settings resource to verify the staged values.
Read the captured power state. Use a graceful restart when the host is on, or power it on when it is off:
| POWER_STATE=$(jq -r '.PowerState' system.json) if [[ "$POWER_STATE" == "On" ]]; then RESET_TYPE=GracefulRestart else RESET_TYPE=On fi
curl "${CURL[@]}" \ -D reset.headers \ -o reset-task.json \ -H 'Content-Type: application/json' \ -X POST \ "https://$BMC$RESET_URI" \ -d "{\"ResetType\":\"$RESET_TYPE\"}"
TASK_URI=$( awk 'tolower($1) == "location:" { gsub("\r", "", $2); print $2 }' reset.headers )
if [[ -n "$TASK_URI" ]]; then poll_redfish_task "$TASK_URI" 900 fi |
Sample terminal result:
| TaskState: Completed TaskStatus: OK MessageId: TaskEvent.1.0.TaskCompletedOK |
Read the active System resource after the host returns:
| curl "${CURL[@]}" "https://$BMC$SYSTEM_URI" | jq '{ PowerState, LastResetTime, Boot: { BootSourceOverrideEnabled: .Boot.BootSourceOverrideEnabled, BootSourceOverrideTarget: .Boot.BootSourceOverrideTarget } }' |
Expected result after a normal boot:
| PowerState: On LastResetTime: <current-reset-time> BootSourceOverrideEnabled: Disabled BootSourceOverrideTarget: None |
Task completion confirms the reset action. Follow POST through KVM or the configured serial console. If the Settings resource still contains staged values after provisioning, PATCH it back to Disabled and None with its current ETag.
D.12 PXE and unattended-image handoff
Read the system, discover its Settings resource and reset action, and capture the current boot state:
| SYSTEM_URI=/redfish/v1/Systems/DGX curl "${CURL[@]}" "https://$BMC$SYSTEM_URI" >system.json
SETTINGS_URI=$(jq -r \ '."@Redfish.Settings".SettingsObject."@odata.id"' system.json) RESET_URI=$(jq -r \ '.Actions["#ComputerSystem.Reset"].target' system.json)
curl "${CURL[@]}" \ -D settings.headers \ -o settings.json \ "https://$BMC$SETTINGS_URI"
SETTINGS_ETAG=$( awk 'tolower($1) == "etag:" { gsub("\r", "", $2); print $2 }' settings.headers )
jq '.Boot | { BootSourceOverrideEnabled, BootSourceOverrideMode, BootSourceOverrideTarget, target_values: ."BootSourceOverrideTarget@Redfish.AllowableValues" }' settings.json |
Stage a one-time UEFI PXE boot and verify the Settings resource:
| curl "${CURL[@]}" \ -H 'Content-Type: application/json' \ -H "If-Match: $SETTINGS_ETAG" \ -X PATCH \ "https://$BMC$SETTINGS_URI" \ -d '{ "Boot": { "BootSourceOverrideEnabled": "Once", "BootSourceOverrideMode": "UEFI", "BootSourceOverrideTarget": "Pxe" } }' \ -o /dev/null -w 'HTTP %{http_code}\n'
curl "${CURL[@]}" "https://$BMC$SETTINGS_URI" | jq '.Boot | { BootSourceOverrideEnabled, BootSourceOverrideMode, BootSourceOverrideTarget }' |
Expected result:
| HTTP 204 BootSourceOverrideEnabled: Once BootSourceOverrideMode: UEFI BootSourceOverrideTarget: Pxe |
Use a graceful restart when the host is on, or power it on when it is off:
| POWER_STATE=$(jq -r '.PowerState' system.json) if [[ "$POWER_STATE" == "On" ]]; then RESET_TYPE=GracefulRestart else RESET_TYPE=On fi
curl "${CURL[@]}" \ -D reset.headers \ -o reset-task.json \ -H 'Content-Type: application/json' \ -X POST \ "https://$BMC$RESET_URI" \ -d "{\"ResetType\":\"$RESET_TYPE\"}"
TASK_URI=$( awk 'tolower($1) == "location:" { gsub("\r", "", $2); print $2 }' reset.headers ) if [[ -n "$TASK_URI" ]]; then poll_redfish_task "$TASK_URI" 900 fi |
Redfish stages the generic Pxe target; this request does not select a specific provisioning NIC. Configure the intended interface first in firmware boot order before using this handoff. Use the KVM boot menu when a one-time, explicitly selected NIC is required. After PXE starts, confirm that the one-time override is consumed:
| curl "${CURL[@]}" "https://$BMC$SYSTEM_URI" | jq '.Boot | { BootSourceOverrideEnabled, BootSourceOverrideTarget }' |
The active resource returns Disabled and None after the one-time override is consumed.
The PXE server, image, answer file, and completion callback are supplied by the deployment environment. Redfish provides the boot handoff, not the installer-completion signal.
After the installer no longer needs the ISO:
| curl "${CURL[@]}" \ -H 'Content-Type: application/json' \ -X POST \ "https://$BMC/redfish/v1/Managers/BMC/VirtualMedia/CD1/Actions/VirtualMedia.EjectMedia" \ -d '{}' |
Expected result: The action completes or creates a task. Re-querying CD1 must show Inserted: false, ConnectedVia: "NotConnected", and no active redirection. Ami.1.0.ActionNotExist means no redirection was active when the eject was requested.
Confirm Inserted: false, then disable remote media:
| curl "${CURL[@]}" \ -H 'Content-Type: application/json' \ -X POST \ "https://$BMC/redfish/v1/Managers/BMC/Actions/Oem/AMIVirtualMedia.EnableRMedia" \ -d '{"RMediaState":"Disable"}' |
Expected result: HTTP 200 with Ami.1.0.DelayInActionCompletion. After approximately 4 to 5 seconds, Managers/BMC must report Oem.Ami.VirtualMedia.RMediaStatus: "Disabled" and the VirtualMedia collection can become empty.
If the BMC reports ActionInProgress, wait for ejection to complete, re-query CD1, and retry the disable action.
D.14 Generate Cisco BMC support data
Install the archive identification utility on the management workstation:
| sudo apt-get update sudo apt-get install -y file |
The Cisco BMC support data workflow uses the DiagnosticLog service. Discover the action and its accepted parameters instead of assuming that they are the same on every firmware release:
| curl "${CURL[@]}" \ "https://$BMC/redfish/v1/Managers/BMC/LogServices/DiagnosticLog" | jq '.Actions["#LogService.CollectDiagnosticData"]'
curl "${CURL[@]}" \ "https://$BMC/redfish/v1/Managers/BMC/LogServices/DiagnosticLog/CollectDiagnosticDataActionInfo" | jq '.Parameters' |
On BMC firmware 4.0(1.260014), the action target and representative parameter metadata are:
| target: /redfish/v1/Managers/BMC/LogServices/DiagnosticLog/Actions/LogService.CollectDiagnosticData DiagnosticDataType: required; OEM OEMDiagnosticDataType: optional; logs, ALL, HGXFPGA, INVENTORY, FPGA, SERVICELOGS, BMCLOG, EROT, HGX, HGXFDR |
Use ALL when Cisco Support requests a complete Cisco BMC support bundle:
| ENTRIES_URI="/redfish/v1/Managers/BMC/LogServices/DiagnosticLog/Entries"
curl "${CURL[@]}" \ "https://$BMC$ENTRIES_URI" | jq -r '.Members[]."@odata.id"' | sort > bmc-entries-before.txt
curl "${CURL[@]}" \ -D bmc-support.headers \ -o bmc-support-task.json \ -H 'Content-Type: application/json' \ -X POST \ "https://$BMC/redfish/v1/Managers/BMC/LogServices/DiagnosticLog/Actions/LogService.CollectDiagnosticData" \ -d '{"DiagnosticDataType":"OEM","OEMDiagnosticDataType":"ALL"}'
cat bmc-support.headers jq '{Id, Name, TaskState}' bmc-support-task.json |
Expected response:
| HTTP/1.1 202 Accepted Location: /redfish/v1/TaskService/Tasks/<task-id>
{ "Id": "<task-id>", "Name": "Manager CollectDiagnosticData", "TaskState": "New" } |
Poll the URI in the Location header. A typical task moves through New and Running before reaching Completed:
| TASK_URI="/redfish/v1/TaskService/Tasks/<task-id>"
curl "${CURL[@]}" \ "https://$BMC$TASK_URI" | jq '{TaskState, TaskStatus, PercentComplete, StartTime, EndTime, Messages}' |
Representative running and terminal states:
| { "TaskState": "Running", "TaskStatus": "OK", "PercentComplete": <percentage> }
{ "TaskState": "Completed", "TaskStatus": "OK", "PercentComplete": 100, "StartTime": "<UTC-timestamp>", "EndTime": "<UTC-timestamp>" } |
Do not treat the initial 202 Accepted response as completion. Wait for the terminal task state.
After completion, enumerate the diagnostic entries:
| curl "${CURL[@]}" \ "https://$BMC$ENTRIES_URI" | jq -r '.Members[]."@odata.id"' | sort > bmc-entries-after.txt
comm -13 bmc-entries-before.txt bmc-entries-after.txt |
Expected result: comm prints the URI added by the current operation. Use this set comparison instead of relying only on timestamps, because controller time can be incorrect. Retrieve the new member resource and read AdditionalDataURI:
| ENTRY_URI=$(comm -13 bmc-entries-before.txt bmc-entries-after.txt | tail -n 1)
curl "${CURL[@]}" \ "https://$BMC$ENTRY_URI" | jq '{Id, Created, DiagnosticDataType, AdditionalDataSizeBytes, AdditionalDataURI}' |
Representative output:
| { "Id": "<entry-id>", "Created": "<UTC-timestamp>", "DiagnosticDataType": "Manager", "AdditionalDataSizeBytes": "<nonzero-byte-count>", "AdditionalDataURI": "<diagnostic-entry-attachment-uri>" } |
Download the attachment from the returned URI:
| umask 077
DATA_URI=$(curl "${CURL[@]}" \ "https://$BMC$ENTRY_URI" | jq -r '.AdditionalDataURI')
curl "${CURL[@]}" \ "https://$BMC$DATA_URI" \ -o c880a-bmc-support-bundle.tar.gz
file c880a-bmc-support-bundle.tar.gz sha256sum c880a-bmc-support-bundle.tar.gz |
Sample output:
| c880a-bmc-support-bundle.tar.gz: gzip compressed data, from Unix <sha256-checksum> c880a-bmc-support-bundle.tar.gz |
D.15 Generate the HGX manager dump
The HGX BMC exposes a separate manager-level diagnostic collection. Discover its action metadata:
| curl "${CURL[@]}" \ "https://$BMC/redfish/v1/Managers/HGX_BMC_0/LogServices/Dump/CollectDiagnosticDataActionInfo" | jq '.Parameters' |
Sample parameter metadata:
| DiagnosticDataType: required; Manager |
Start the collection:
| HGX_ENTRIES_URI="/redfish/v1/Managers/HGX_BMC_0/LogServices/Dump/Entries"
curl "${CURL[@]}" \ "https://$BMC$HGX_ENTRIES_URI" | jq -r '.Members[]."@odata.id"' | sort > hgx-entries-before.txt
curl "${CURL[@]}" \ -D hgx-support.headers \ -o hgx-support-task.json \ -H 'Content-Type: application/json' \ -X POST \ "https://$BMC/redfish/v1/Managers/HGX_BMC_0/LogServices/Dump/Actions/LogService.CollectDiagnosticData" \ -d '{"DiagnosticDataType":"Manager"}' |
Expected result: The service returns 202 Accepted and a task URI. Poll that task as shown in Section D.6. After it completes, enumerate the manager dump entries:
| curl "${CURL[@]}" \ "https://$BMC$HGX_ENTRIES_URI" | jq -r '.Members[]."@odata.id"' | sort > hgx-entries-after.txt
comm -13 hgx-entries-before.txt hgx-entries-after.txt |
Sample completed task:
| { "TaskState": "Completed", "TaskStatus": "OK", "PercentComplete": 100, "Messages": [ { "MessageId": "TaskEvent.1.0.TaskCompletedOK", "Severity": "OK" } ] } |
Install the archive identification and Zstandard validation utilities:
| sudo apt-get update sudo apt-get install -y file zstd file --version | head -n 1 zstd --version |
Expected result: APT installs or confirms both utilities and the version commands complete successfully.
Retrieve the new entry and download its AdditionalDataURI with authenticated curl, as shown for the Cisco BMC bundle:
| HGX_ENTRY_URI=$(comm -13 hgx-entries-before.txt hgx-entries-after.txt | tail -n 1)
curl "${CURL[@]}" \ "https://$BMC$HGX_ENTRY_URI" | jq '{Id, Created, DiagnosticDataType, AdditionalDataSizeBytes, AdditionalDataURI, Severity}'
HGX_DATA_URI=$(curl "${CURL[@]}" \ "https://$BMC$HGX_ENTRY_URI" | jq -r '.AdditionalDataURI')
curl "${CURL[@]}" \ "https://$BMC$HGX_DATA_URI" \ -o c880a-hgx-manager-dump.tar.zst
file c880a-hgx-manager-dump.tar.zst zstd -t c880a-hgx-manager-dump.tar.zst zstd -l c880a-hgx-manager-dump.tar.zst sha256sum c880a-hgx-manager-dump.tar.zst |
Representative entry metadata:
| { "Id": "<entry-id>", "Created": "<HGX-BMC-timestamp>", "DiagnosticDataType": "Manager", "AdditionalDataSizeBytes": "<nonzero-byte-count>", "AdditionalDataURI": "<HGX-manager-dump-attachment-uri>", "Severity": "OK" } |
The attachment is Zstandard-compressed data even though the service can return a generic filename and application/json content type. Determine its format with file rather than from the HTTP content type.
Pass is indicated when the task reaches Completed, the entry provides an AdditionalDataURI, and zstd -t validates the downloaded archive. If the archive does not validate, collect the Cisco BMC support bundle from Section D.14 and open a Cisco support case.
The examples in the table below use these discovered paths. Continue to discover them from parent resources so automation can detect changes.
Table 16. Endpoints and use cases
| Use case |
Endpoint |
| Service root |
/redfish/v1 |
| Host system |
/redfish/v1/Systems/DGX |
| HGX baseboard |
/redfish/v1/Systems/HGX_Baseboard_0 |
| Host BIOS |
/redfish/v1/Systems/DGX/Bios |
| Host FutureState settings |
/redfish/v1/Systems/DGX/SD |
| Boot options |
/redfish/v1/Systems/DGX/BootOptions |
| Secure Boot |
/redfish/v1/Systems/DGX/SecureBoot |
| Host storage |
/redfish/v1/Systems/DGX/Storage |
| Host processors |
/redfish/v1/Systems/DGX/Processors |
| Host memory |
/redfish/v1/Systems/DGX/Memory |
| Cisco BMC |
/redfish/v1/Managers/BMC |
| BMC network protocols |
/redfish/v1/Managers/BMC/NetworkProtocol |
| BMC Ethernet |
/redfish/v1/Managers/BMC/EthernetInterfaces/eth0 |
| BMC virtual media |
/redfish/v1/Managers/BMC/VirtualMedia |
| BMC log services |
/redfish/v1/Managers/BMC/LogServices |
| HGX BMC |
/redfish/v1/Managers/HGX_BMC_0 |
| HGX log services |
/redfish/v1/Managers/HGX_BMC_0/LogServices |
| HGX diagnostic data |
/redfish/v1/Managers/HGX_BMC_0/ManagerDiagnosticData |
| Main chassis |
/redfish/v1/Chassis/DGX |
| Chassis sensors |
/redfish/v1/Chassis/DGX/Sensors |
| Power subsystem |
/redfish/v1/Chassis/DGX/PowerSubsystem |
| Power supplies |
/redfish/v1/Chassis/DGX/PowerSubsystem/PowerSupplies |
| Thermal subsystem |
/redfish/v1/Chassis/DGX/ThermalSubsystem |
| Fans |
/redfish/v1/Chassis/DGX/ThermalSubsystem/Fans |
| Chassis logs |
/redfish/v1/Chassis/DGX/LogServices |
| Active conditions |
/redfish/v1/ServiceConditions |
| Update service |
/redfish/v1/UpdateService |
| Firmware inventory |
/redfish/v1/UpdateService/FirmwareInventory |
| Software inventory |
/redfish/v1/UpdateService/SoftwareInventory |
| Task service |
/redfish/v1/TaskService |
| Tasks |
/redfish/v1/TaskService/Tasks |
| Event service |
/redfish/v1/EventService |
| SSE stream |
/redfish/v1/EventService/SSE |
| Telemetry service |
/redfish/v1/TelemetryService |
| Fabrics |
/redfish/v1/Fabrics |
| NVLink fabric |
/redfish/v1/Fabrics/HGX_NVLinkFabric_0 |
| PCIe topology example |
/redfish/v1/Fabrics/HGX_PCIeTopology_0 |
Capture the endpoints shown in the table below.
Table 17. Endpoints to capture for monitoring
| Artifact |
Endpoint |
| Service root |
/redfish/v1 |
| Host summary |
/redfish/v1/Systems/DGX |
| HGX system summary |
/redfish/v1/Systems/HGX_Baseboard_0 |
| BMC summary |
/redfish/v1/Managers/BMC |
| HGX BMC summary |
/redfish/v1/Managers/HGX_BMC_0 |
| Active conditions |
/redfish/v1/ServiceConditions |
| Chassis sensors |
/redfish/v1/Chassis/DGX/Sensors |
| Power subsystem |
/redfish/v1/Chassis/DGX/PowerSubsystem |
| Thermal subsystem |
/redfish/v1/Chassis/DGX/ThermalSubsystem |
| Firmware inventory |
/redfish/v1/UpdateService/FirmwareInventory |
| Software inventory |
/redfish/v1/UpdateService/SoftwareInventory |
| Task history |
/redfish/v1/TaskService/Tasks |
| SEL and BMC logs |
/redfish/v1/Managers/BMC/LogServices |
| BIOS log |
/redfish/v1/Systems/DGX/LogServices/BIOS/Entries |
| Chassis log |
/redfish/v1/Chassis/DGX/LogServices |
| HGX logs |
/redfish/v1/Managers/HGX_BMC_0/LogServices |
| HGX diagnostics |
/redfish/v1/Managers/HGX_BMC_0/ManagerDiagnosticData |
Use timestamped directories and preserve HTTP status codes. Follow collection pagination and save the member resources referenced by each collection.
The common action targets in the table below are discovered from their parent resources.
Table 18. Action targets discovered from parent resources
| Action |
Discover from |
| Reset or power control |
Systems/<system-id> |
| Submit a Redfish test event |
EventService |
| Insert or eject virtual media |
Managers/<manager-id>/VirtualMedia/<member-id> |
| Collect Cisco BMC diagnostic data |
Managers/<manager-id>/LogServices/DiagnosticLog |
| Create a persistent event destination |
EventService/Subscriptions collection |
Read the action object and any linked @Redfish.ActionInfo resource before constructing the request.