Understanding ULB Metrics Monitoring

Feature Description

You can a monitor wide range of application and system statistics, and key performance indicators (KPI) within the ULB infrastructure. KPIs are useful to gain insight into the overall health of the ULB environment. Statistics offer a simplified representation of the ULB configurations and utilization-specific data.

The ULB integrates with Prometheus, a third-party monitoring and alerting solution to capture and preserve the performance data. This data is reported as statistics and can be viewed in the web-based dashboard. Grafana provides a graphical or text-based representation of statistics and counters, which the Prometheus database collects. The Grafana dashboard projects a comprehensive set of quantitative and qualitative data that encourages you to analyze ULB metrics in the reporting tool of your choice and take informed decisions.

By default, the monitoring solution is enabled, which indicates that Prometheus continually monitors your ULB environment and the Prometheus data source is associated with Grafana. You must have the administrative privileges to access Grafana. However, to view a specific dashboard, run the Prometheus queries. The queries are available in the built-in and custom format.

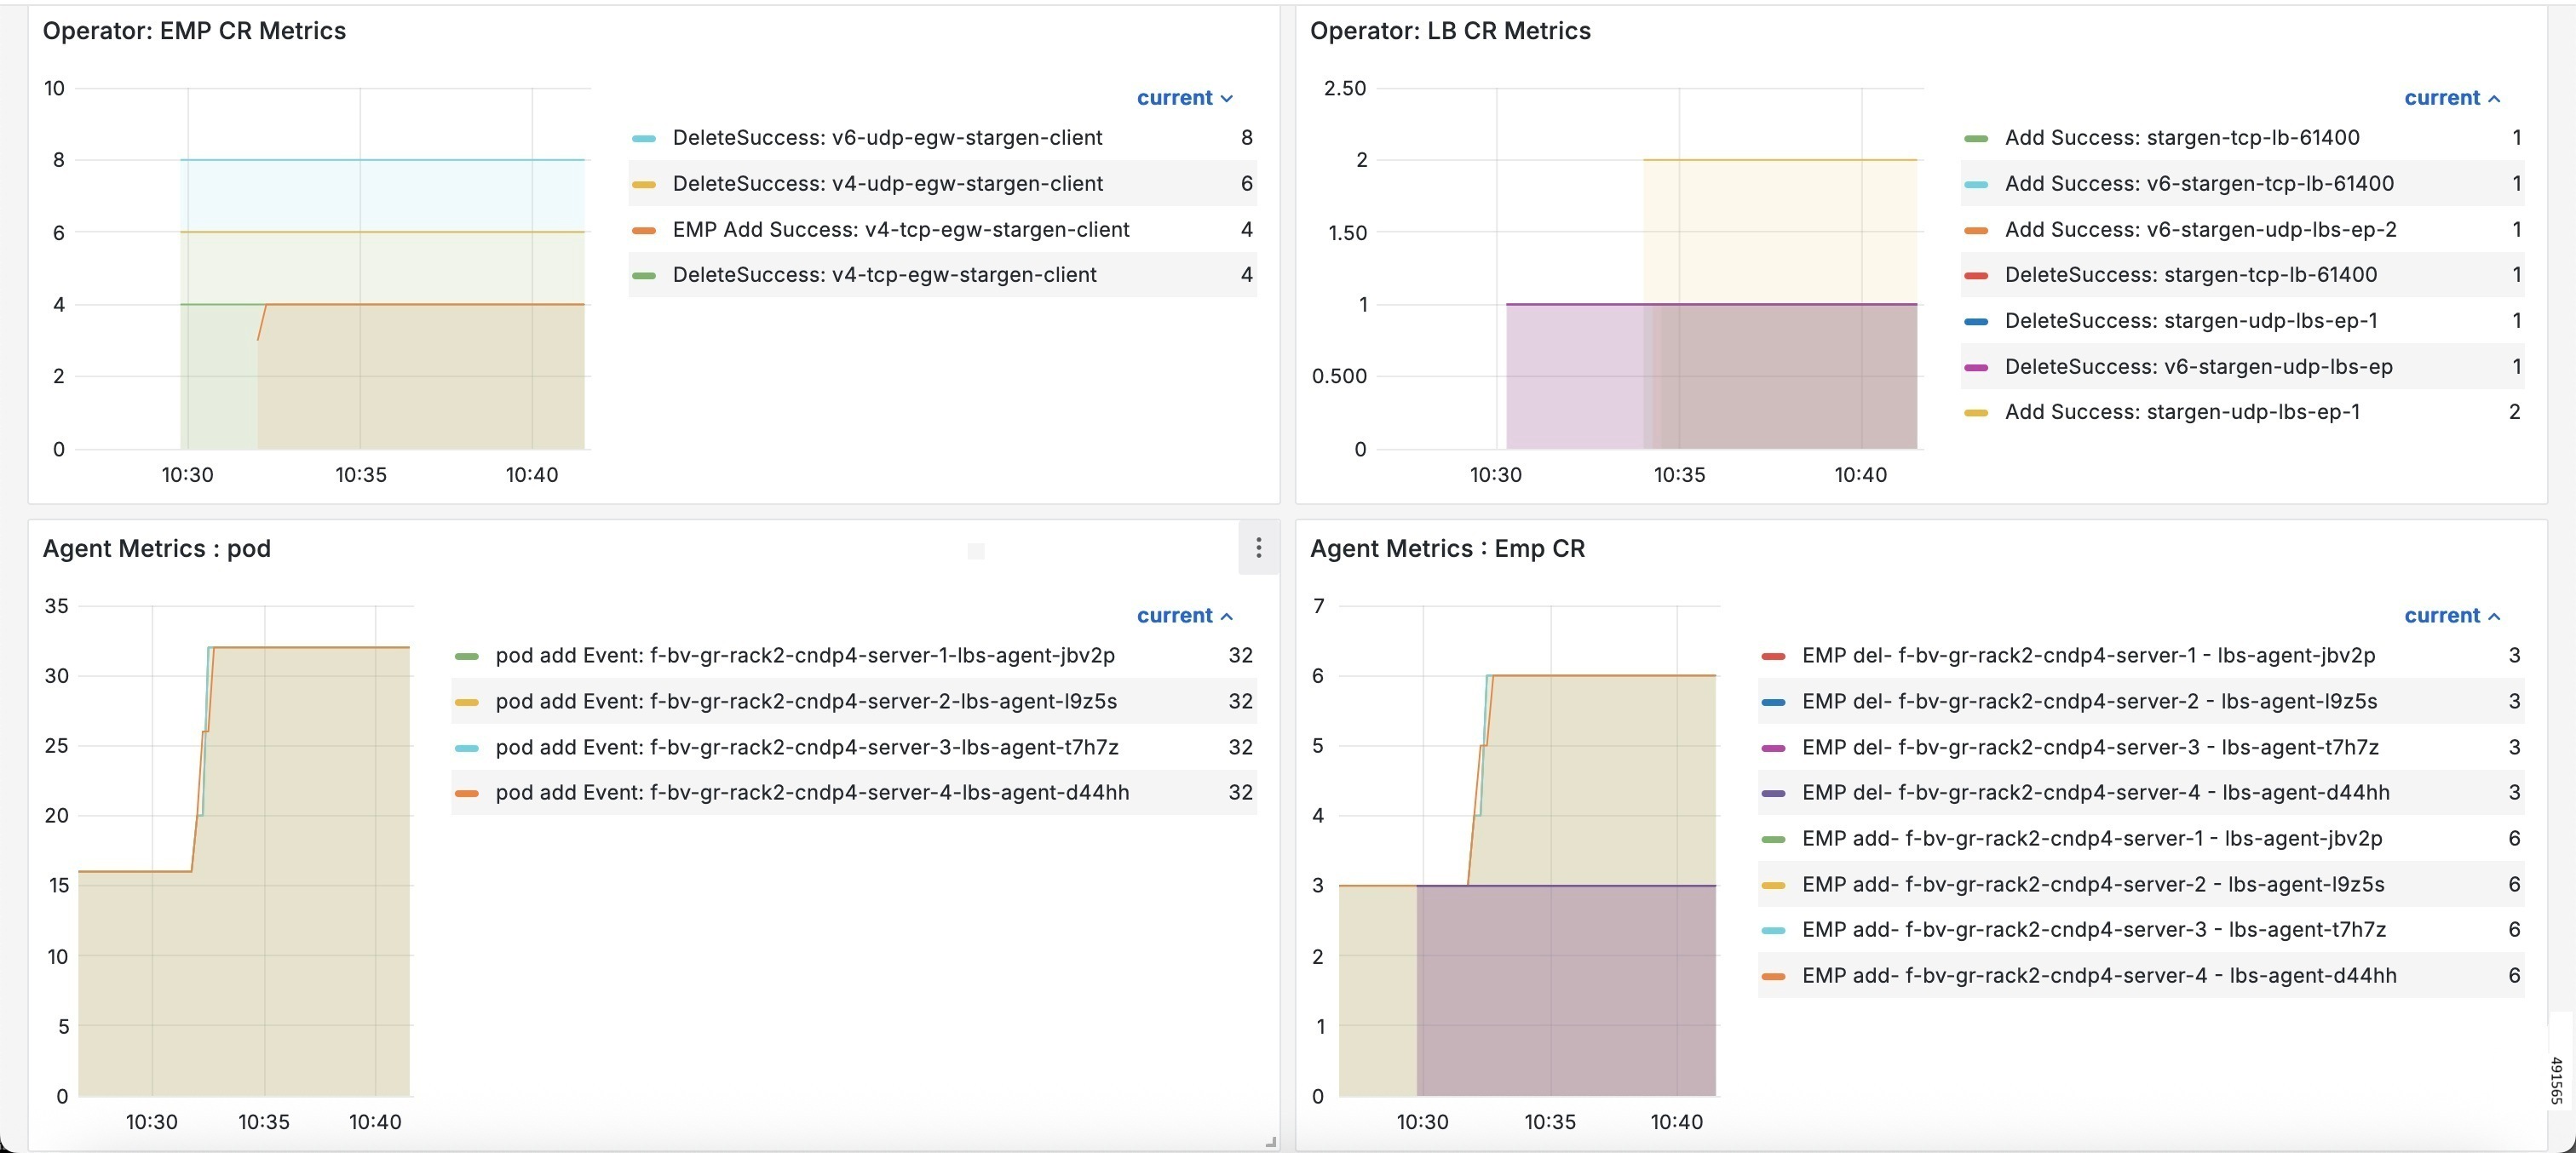
The following snapshot is a sample of the Grafana dashboard.

Figure 1. Grafana Dashboard

How it Works

KPIs constitute of metrics, such as statistics and counters. These metrics represent the performance improvement or degradation. By default, Prometheus is enabled on the system where ULB is deployed, and configured with Grafana. Prometheus dynamically starts monitoring the data sources that are available on the system. For new dashboard panels, execute queries in Prometheus.

For more information about Prometheus, consult the Prometheus documentation.

Configuring Metrics Collection

The labels of each ULB metrics are classified into these three categories:

  • Production

  • Debug

  • Trace level

The ULB data metrics are controlled through the CLI command for performance optimization.

To collect the necessary ULB data metrics use this sample configuration:

config 
   infra metrics verbose { application } [ level { debug | off | production | trace } | metrics metrics_name [ level { debug | off | production | trace }  ] ] 
   end 

NOTES:

  • infra metrics verbose { application } : Enable the metric collection. This configuration helps to collect the required application metrics and labels. By default, this command captures the trace labels of metrics.

  • level { debug | off | production | trace } : Specify the application metrics category to capture the required application metrics and labels.

    • debug : Capture all the labels that are classified as production and debug categories.

    • off : Disable the application level metrics collection.

      For example, configuring the infra metrics verbose application svc_byte_count level off command disables the svc_byte_count application metrics.

    • production : Capture the labels that are classified as production category.

    • trace : Capture all the labels that are classified as production, debug, and trace categories. This option is the default configuration.


    Note


    It is recommended to use level production for a highly scaled and production environment. You should use the debug and trace levels only in lab trials and debugging environment.

    If the level trace is enabled in production or a highly scalable environment, service metrics timeout can be observed in the Grafana dashboard.


  • If production and debug classification is empty for a metrics, then all the labels are classified as trace.

  • metrics metrics_name : Specify the metrics name to capture only the labels that correspond to the given metrics. The metric-level configuration takes precedence over the application-level configuration. If the metrics level is not configured, the labels are captured at the application level.

Data-path metrics collection

To enable or disable the collection of the data-path metrics, use this sample configuration:

This configuration is needed to enable or disable the data level ULB statistics:

config 
   [no] metrics service-stats 
   end 

NOTES:

[no] metrics service-stats : This CLI configures the flag to enable metrics collection by eBPF. This CLI is disabled by default.

Configuration Example

The following is an example configuration to enable only production level for all the application metrics.

infra metrics verbose application level production 

The following is an example configuration to enable debug level for svc_byte_count application metrics and production level for all other application metrics.

infra metrics verbose application level production metrics svc_byte_count level debug  

The following is an example configuration to enable production level for svc_byte_count application metrics.

infra metrics verbose application metrics svc_byte_count level production 

The following is an example configuration to disable svc_byte_count application metrics and debug level for all other application metrics.

infra metrics verbose application level debug metrics svc_byte_count level off