Pods and Services Reference

Feature Summary and Revision History

Summary Data

Table 1. Summary Data

Applicable Products or Functional Area

SMF

Applicable Platform(s)

SMI

Feature Default Setting

Enabled – Always-on

Related Changes in this Release

Not Applicable

Related Documentation

Not Applicable

Revision History

Table 2. Revision History
Revision Details Release
The node-monitor pod is supported to enable monitoring of all K8 pods.

2021.02.0

The grafana-dashboard-app-infra pod is removed.

2021.02.3.t3

First introduced.

Pre-2020.02.0

Feature Description

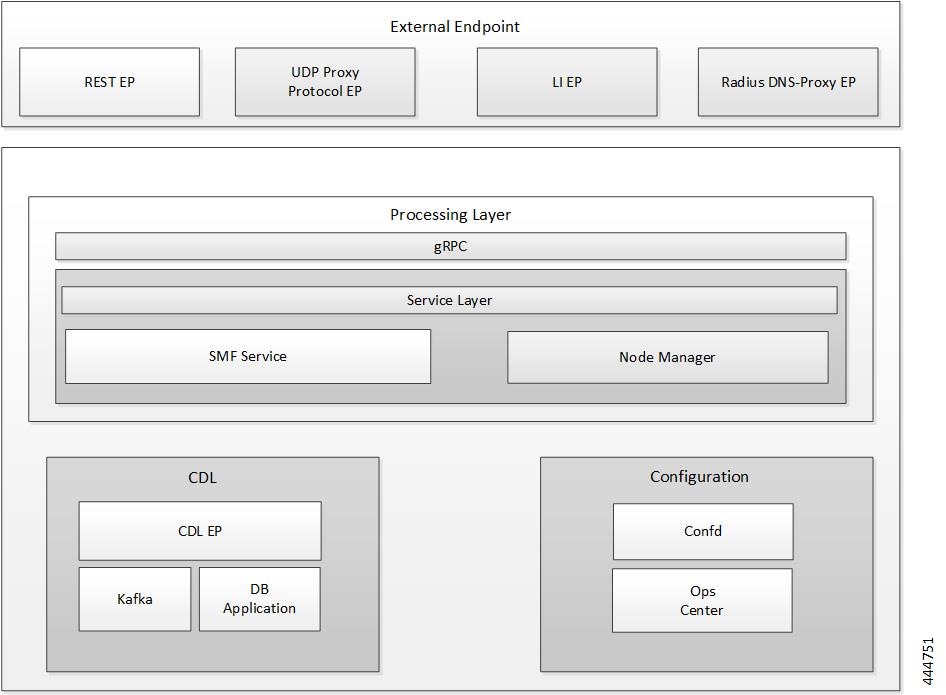
The SMF is built on the Kubernetes cluster strategy, which implies that it has adopted the native concepts of containerization, high availability, scalability, modularity, and ease of deployment. To achieve the benefits offered by Kubernetes, SMF uses the construct that includes the components, such as pods and services.

Depending on your deployment environment, the SMF deploys the pods on the virtual machines that you have configured. Pods operate through the services that are responsible for the intrapod communications. If the machine hosting the pods fails or experiences network disruption, the pods are terminated or deleted. However, this situation is transient and Kubernetes spins new pods to replace the invalid pods.

The following workflow provides a high-level visibility into the host machines, and the associated pods and services. It also represents how the pods communicate with each other. The representation may differ based on your deployment infrastructure.
Figure 1. Communication Workflow of Pods

Kubernetes deployment includes the kubectl command-line tool to manage the Kubernetes resources in the cluster. You can manage the pods, nodes, and services.

For information on the Kubernetes concepts, see the Kubernetes documentation.

For more information on the Kubernetes components in SMF, see the following:

  • Pods

  • Services

Pods

A pod is a process that runs on your Kubernetes cluster. Pod encapsulates a granular unit known as a container. A pod contains one or multiple containers.

Kubernetes deploys one or multiple pods on a single node which can be a physical or virtual machine. Each pod has a discrete identity with an internal IP address and port space. However, the containers within a pod can share the storage and network resources.

The following table lists the SMF pod names and the hosts on which they are deployed depending on the labels that you assign. For information on how to assign the labels, see Associating Pods to the Nodes.

Table 3. SMF Pods
Pod Name Description Virtual Machine Name
api-smf-ops-center Functions as the confD API pod for the SMF Ops Center. OAM
base-entitlement-smf Supports Smart Licensing feature. OAM
bgpspeaker Dynamic routing for L3 route management and BFD monitoring Protocol
cache-pod Operates as the pod to cache any sort of system information that will be used by other pods as applicable. Protocol
cdl-ep-session Provides an interface to the CDL. Session
cdl-index-session Preserves the mapping of keys to the session pods. Session
cdl-slot-session Operates as the CDL session pod to store the session data. Session
dns-proxy Operates as DNS endpoint of SMF Protocol

diameter-ep-gx-client

Operates as a Diameter endpoint to enable communication between SMFand PCRF through Gx interface

Protocol

diameter-ep-gy-client

Operates as a Diameter endpoint to enable communication between SMF and PCRF through Gy interface

Protocol

documentation Contains the documentation. OAM
edr-monitor pod Contains the EDR files that are maintained in a persistent volume. OAM
etcd-smf-etcd-cluster Hosts the etcd for the SMF application to store information, such as pod instances, leader information, NF-UUID, endpoints, and so on. OAM
georeplication Responsible for cache, etcd replication across sites, and site role management Protocol
grafana-dashboard-cdl Contains the default dashboard of CDL metrics in Grafana. OAM
grafana-dashboard-smf Contains the default dashboard of SMF service metrics in Grafana. OAM
gtpc-ep Operates as GTPC endpoint of SMF. Protocol
kafka Hosts the Kafka details for the CDL replication. Protocol
li-ep Operates as Lawful Intercept endpoint of SMF. Protocol
nodemgr Performs node level interactions, such as N4 link establishment, management (heart-beat), and so on. Also, generates unique identifiers, such as UE IP address, SEID, CHF-ID, Resource URI, and so on. Service
node-monitor pod Monitors all the K8 nodes and performs self-reboot on encountering an issue, which in turn triggers an GR to other rack. NA
oam-pod Operates as the pod to facilitate Ops Center actions like show commands, configuration commands, monitor protocol monitor subscriber, and so on. OAM
ops-center-smf-ops-center Acts as the SMF Ops Center. OAM
protocol Operates as encoder and decoder of application protocols (PFCP, GTP, RADIUS, and so on) whose underlying transport protocol is UDP. Protocol
radius-ep Operates as RADIUS endpoint of SMF Protocol
rest-ep Operates as REST endpoint of SMF for HTTP2 communication. Protocol
service Contains main business logic of SMF. Service
smart-agent-smf-ops-center Operates as the utility pod for the SMF Ops Center. OAM
udp-proxy Operates as proxy for all UDP messages. Owns UDP client and server functionalities. Protocol
swift-smf-ops-center Operates as the utility pod for the SMF Ops Center. OAM
zookeeper Assists Kafka for topology management. OAM

For details on UDP proxy, see the UDP Proxy Pod section.

These SMF pods communicate with the Common Execution Environment (CEE) pods. For the complete list of CEE pods, see the UCC CEE Configuration and Administration Guide.

Replicas

Each pod runs on a single instance of an application. To provide more resources by running more instances, you can use multiple Pods, one for each instance. This concept in Kubernetes is referred to as replication. Replicated Pods or replicas are usually created and managed as a group by a workload resource and its controller.

With multiple replicas, Kubernetes can distribute the load between them. During node failures, replicas can be used.


Note


Replicas are based on the hardware and deployed call model.


UDP Proxy Pod

Feature Description

The SMF has UDP interfaces toward the UPF (N4) and SGW (s5 or s8 for EPS interworking). With the help of the protocol layer pods (smf-protocol and gtp-ep), the messages are encoded and decoded and exchanged on these UDP interfaces.

For achieving the functionalities mentioned on the 3GPP specifications:

  • It is mandatory for the protocol layer pods to receive the original source and destination IP address and port number. But the original IP and UDP header is not preserved when the incoming packets arrive at the UDP service in the Kubernetes (K8s) cluster.

  • Similarly, for the outgoing messages, the source IP set to the external IP address of the UDP service (published to the peer node) is mandatory. But the source IP is selected as per the egress interface when different instances of protocol layer pods send outgoing messages from different nodes of the K8s cluster.

The protocol layer POD spawns on the node, which has the physical interface configured with the external IP address to achieve the conditions mentioned earlier. However, spawning the protocol layer pods has the following consequences:

  • It is not possible to achieve the node level HA (High Availability) because the protocol pods are spawned on the same node of the K8s cluster. Any failure to that node may result in loss of service.

  • The protocol pods (smf-protocol, gtp-ep, and radius-ep) must include their own UDP client and server functionalities. In addition, each protocol layer pod may require labeling of the K8s nodes with the affinity rules. This restricts the scaling requirements of the protocol layer pods.

The SMF addresses these issues with the introduction of a new K8s POD called "udp-proxy." The primary objectives of this POD are:

  • The “udp-proxy" POD acts as a proxy for all kinds of UDP messages. It also owns the UDP client and server functionalities.

  • The protocol pods perform the individual protocol (PFCP, GTP, Radius) encoding and decoding and provide the UDP payload to the "udp-proxy" POD. The "udp-proxy" POD sends the UDP payload out after it receives the payload from the protocol pods.

  • The "udp-proxy" POD opens the UDP sockets on a virtual IP (VIP) instead of a physical IP. This ensures that the "udp-proxy" POD does not have any strict affinity to a specific K8s node (VM). Thus, enabling node level HA for the UDP proxy.


Note


One instance of the "udp-proxy" POD is spawned by default in all the worker nodes in the K8s cluster.

The UDP proxy for SMF feature has functional relationship with the Virtual IP Address feature.


Architecture

The "udp-proxy" POD is placed in the worker nodes in the K8s cluster.

  1. Each of the K8s worker node contains one instance of the "udp-proxy" POD. However, only one of the K8s worker node owns the virtual IP at any time. The worker node that owns the virtual IP remains in the active mode while all the other worker nodes remain in the standby mode.

  2. The active "udp-proxy" POD binds to the virtual IP and the designated ports for listening to the UDP messages from the peer nodes (UPF and SGW).

  3. The UDP payload received from the peer nodes are forwarded to one instance of the protocol, gtp-ep, or radius-ep pods. The payload is forwarded either on the same node or different node for further processing.

  4. The response message from the protocol, gtp-ep, or radius-ep pods is forwarded back to the active instance of the "udp-proxy" POD. The "udp-proxy" POD sends the response message back to the corresponding peer nodes.

  5. The SMF-initiated messages are encoded at the protocol, gtp-ep, or radius-ep pods. In addition, the UDP payload is sent to the "udp-proxy" POD. Eventually, the "udp-proxy" POD comprises of the complete IP payload and sends the message to the peer. When the response from the peer is received, the UDP payload is sent back to the same smf-protocol, gtp-ep, or radius-ep POD from which the message originated.

Protocol Pod Selection for Peer-Initiated Messages

When the "udp-proxy" pod receives the peer node (for instance UPF) initiated messages, it is load balanced across the protocol instances to select any instance of the protocol pod. An entry of this instance number is stored along with the source IP and source port number of the peer node. This ensures that the messages form the same source IP and source port are sent to the same instance that was selected earlier.

High Availability for the UDP Proxy

The UDP proxy's HA model is based on the keepalived virtual IP concepts. A VIP is designated to the N4 interface during deployment. Also, a keepalived instance manages the VIP and ensures that the IP address of the VIP is created as the secondary address of an interface in one of the worker nodes of the K8s cluster.

The "udp-proxy" instance on this worker node binds to the VIP and assumes the role of the active "udp-proxy" POD. All "udp-proxy" instances in other worker nodes remain in the standby mode.

Node Monitoring Pod

Node monitor pod runs on all Kubernetes nodes, such as master and worker nodes to periodically check the operating state of other nodes. The nodes might become unreachable due to network issue or hardware transient issue.

Depending on the operating state of nodes, the node monitor pod switches to different modes. SMF uses nodemonitor CLI command in Global Configuration mode to switch between the modes.

The following configuration section provides more information on the command and modes.

Configure Node Monitoring Pod

The node monitoring pod switches to different modes to resolve the hardware transient issues.

To switch between the modes, use the following sample configuration:

config 
   nodemonitor mode { 0 | 1 | 2 | 3 interval wait_time } 
   end 

NOTES:

  • nodemonitor mode { 0 | 1 | 2 | 3 interval wait_time }

    • mode 0 —Disables the node monitoring functionality.

    • mode 1 —Enables the node monitoring and performs self-reboot only after reaching a hardcoded value of 2 seconds when two or more nodes are not reachable. This is the default setting.

    • mode 2 —Enables the node monitoring and performs self-reboot when two or more nodes are not reachable but not all the nodes.

    • mode 3 interval wait_time —Specify the time interval in seconds, after which the node monitoring pod is rebooted when two or more nodes are not reachable.

      wait_time must be an integer in the range of 5–300.

Configuration Example

The following is an example of node monitoring pod configuration.

config 
   nodemonitor mode 3 interval 15 
   end 

As per this example, the node monitoring pod waits for 15 seconds and then performs self-reboot when two or nodes are not reachable.

Configuration Verification

To verify the configuration, use the show running-config nodemonitor command.

The output of this show command displays the configuration related to mode of the node monitoring pod.

smf# show running-config nodemonitor 
nodemonitor mode 3 interval 15 

Services

The SMF configuration consists of several microservices that run on a set of discrete pods. Microservices are deployed during the SMF deployment. SMF uses these services to enable communication between the pods. When interacting with another pod, the service identifies the pod's IP address to initiate the transaction and acts as an endpoint for the pod.

The following table describes the SMF services and the pod on which they run.

Table 4. SMF Services and Pods
Service Name Pod Name Description
base-entitlement-smf base-entitlement-smf Supports Smart Licensing feature.
bgpspeaker-pod bgpspeaker Dynamic routing for L3 route management and BFD monitoring
datastore-ep-session cdl-ep-session Responsible for the CDL session.
datastore-notification-ep smf-rest-ep Responsible for sending the notifications from the CDL to the smf-service through smf-rest-ep.
datastore-tls-ep-session cdl-ep-session Responsible for the secure CDL connection.

diameter-ep-gx-client

diameter-ep-gx-client

Responsible for sending gRPC messages to Diameter endpoint for Credit Control messages, which are converted to Diameter CCR messages by Diameter endpoint and sent to the Gx server.

diameter-ep-gy-client

diameter-ep-gy-client

Responsible for sending gRPC messages to Diameter endpoint for Credit Control Messages, which are converted to Diameter CCR messages by Diameter endpoint and sent to the Gy server.

documentation documentation Responsible for the SMF documents.
edr-monitor edr-monitor Responsible for maintaning EDR files in persistent volume
etcd etcd-smf-etcd-cluster-0, etcd-smf-etcd-cluster-1, etcd-smf-etcd-cluster-2 Responsible for pod discovery within the namespace.
etcd-smf-etcd-cluster-0 etcd-smf-etcd-cluster-0 Responsible for synchronization of data among the etcd cluster.
etcd-smf-etcd-cluster-1 etcd-smf-etcd-cluster-1 Responsible for synchronization of data among the etcd cluster.
etcd-smf-etcd-cluster-2 etcd-smf-etcd-cluster-2 Responsible for synchronization of data among the etcd cluster.
grafana-dashboard-app-infra grafana-dashboard-app-infra Responsible for the default dashboard of app-infra metrics in Grafana.
grafana-dashboard-cdl grafana-dashboard-cdl Responsible for the default dashboard of CDL metrics in Grafana.
grafana-dashboard-smf grafana-dashboard-smf Responsible for the default dashboard of SMF-service metrics in Grafana.
gtpc-ep gtpc-ep Responsible for inter-pod communication with GTP-C pod.
helm-api-smf-ops-center api-smf-ops-center Manages the Ops Center API.
kafka kafka Processes the Kafka messages.
li-ep li-ep Responsible for lawful-intercept interactions.
local-ldap-proxy-smf-ops-center ops-center-smf-ops-center Responsible for leveraging Ops Center credentials by other applications like Grafana.
oam-pod oam-pod Responsible to facilitate Exec commands on the Ops Center.
ops-center-smf-ops-center ops-center-smf-ops-center Manages the SMF Ops Center.
ops-center-smf-ops-center-expose-cli ops-center-smf-ops-center To access SMF Ops Center with external IP address.
smart-agent-smf-ops-center smart-agent-smf-ops-center Responsible for the SMF Ops Center API.
smf-sbi-service smf-rest-ep Responsible for routing incoming HTTP2 messages to REST-EP pods.
smf-n10-service smf-rest-ep Responsible for routing incoming N10 messages to REST-EP pods.
smf-n11-service smf-rest-ep Responsible for routing incoming N11 messages to REST-EP pods.
smf-n40-service smf-rest-ep Responsible for routing incoming N40 messages to REST-EP pods.
smf-n7-service smf-rest-ep Responsible for routing incoming N7 messages to REST-EP pods.
smf-nrf-service smf-rest-ep Responsible for routing incoming NRF messages to REST-EP pod.
smf-nodemgr smf-nodemgr Responsible for inter-pod communication with smf-nodemgr pod.
smf-protocol smf-protocol Responsible for inter-pod communication with smf-protocol pod
smf-radius-dns smf-radius-dns Responsible for inter-pod communication with smf-radius-dns pod
smf-rest-ep smf-rest-ep Responsible for inter-pod communication with smf-rest-ep pod
smf-service smf-service Responsible for inter-pod communication with smf-service pod
swift-smf-ops-center swift Operates as the utility pod for the SMF Ops Center
zookeeper zookeeper Assists Kafka for topology management
zookeeper-service zookeeper Assists Kafka for topology management

Open Ports and Services

The SMF uses different ports for communication purposes. The following table describes the default open ports and the associated services.

Table 5. Open Ports and Services
Port Service Usage
9003 gRPC This is the default gRPC port for all the application pods that aren’t using the host network.
8080 TCP/HTTP This is the default prometheus server port for all the application pods that aren’t using the host network.
8090 TCP/HTTP SMF uses the HTTP2 REST endpoint for the SBI interface endpoint.
2024 SSH SMF Ops Center uses this port to provide the ConfD CLI access.
2379-2380 TCP SMF uses the etcd server client endpoint to store and retrieve system data.
8882 gRPC This is the CDL session DB endpoint used by all other application pods.
8890 gRPC Application REST endpoint uses this port to receive the call-back timer or notification from the CDL.
8883 gRPC This is the TLS - CDL session DB endpoint used by all other application pods.
2123 UDP SMF uses the 3GPP standard GTP-C port for the signaling of GTP-C protocol messages (control path).
2152 UDP SMF uses the 3GPP standard GTP-U port for the signaling of GTP-U protocol messages (data path).
8805 UDP SMF uses the 3GPP standard PFCP port for the signaling of PFCP protocol messages.
8765 TCP6 SMF uses this port as the readiness probe port for the UDP proxy pod.
7179, 7189 TCP/HTTP Pprof Server endpoint serves runtime profiling data from GTP-C endpoint interface-specific pods, such as S11 and S5.
23300, 23310 TCP/gRPC SMF uses the TLS GRPC IPC server endpoint for the GTP-C endpoint interface-specific pods.
9005, 9015 TCP/gRPC Non-TLS GRPC IPC server port for the GTP-C endpoint interface-specific pods.
27000, 27010 TCP SMF uses the KeepAliveD endpoint for GTP-C endpoint interface-specific pods.
7279, 7289 TCP This port is the admin endpoint internal port that is used in the GTP-C endpoint interface-specific pods. This port is used for liveness and readiness probe.
7079, 7089 TCP/HTTP SMF uses the prometheus server port for the GTP-C endpoint interface-specific pods.
8083 TCP/HTTP SMF uses the prometheus server port for the protocol pod.
9006 TCP/gRPC SMF uses the non-TLS GRPC IPC Server endpoint for the protocol pod.
8003 TCP/HTTP SMF uses the prometheus server port for the protocol pod.
23100 TCP/gRPC SMF uses the TLS GRPC IPC server endpoint for the protocol pod.
7679 TCP/HTTP The Pprof server endpoint serves runtime profiling data from the protocol pod.
7879 TCP This port is the admin endpoint internal port that is used in the protocol pod. This port is used for the liveness and readiness probe.
27500 TCP SMF uses this KeepAliveD endpoint for the protocol pod.
28000 TCP SMF uses this KeepAliveD endpoint for the UDP proxy pod.
23200 TCP/gRPC SMF uses the TLS GRPC IPC server endpoint for the UDP proxy pod.
9004 TCP/gRPC Non-TLS GRPC IPC server endpoint for the UDP proxy pod.
7879 TCP This port is the admin endpoint internal port that is used in the UDP proxy pod. This port is used for the liveness and readiness probe.
8850 TCP/HTTP The Pprof server endpoint serves runtime profiling data from the UDP proxy pod.

In addition to the preceding ports, SMF uses the ports that are destined for SMI for routing information between hosts. For information on SMI ports, see the Ultra Cloud Core Subscriber Microservices Infrastructure Operations Guide.

Associating Pods to the Nodes

This section describes how to associate a pod to the node based on their labels.

After you have configured a cluster, you can associate pods to the nodes through labels. This association enables the pods to get deployed on the appropriate node based on the key-value pair.

Labels are required for the pods to identify the nodes where they must get deployed and to run the services. For example, when you configure the protocol-layer label with the required key-value pair, the pods are deployed on the nodes that match the key-value pair.

To associate pods to the nodes through the labels, use the following sample configuration:

config 
   k8 label vm_group key label_key value label_value 
   end 

NOTES:

  • k8 label vm_group key label_key value label_value : Configures the K8 node affinity label parameters.

    • vm_group : Specify the VM group. It must be one of the following:

      • cdl-layer

      • oam-layer

      • protocol-layer

      • service-layer

    • key label_key : Specify the label key. label_key must be a string.

    • value label_value : Specify the label value. label_value must be a string.

  • If you choose not to configure the labels, then SMF assumes the labels with the default key-value pair.

Viewing the Pod Details and Status

If the service requires additional pods, SMF creates and deploys the pods. You can view the list of pods in your deployment through the SMF Ops Center.

You can run the kubectl command from the master node to manage the Kubernetes resources.

The pod details are available in YAML format.

Use the following sample configuration to view the comprehensive pod details:

kubectl get pods -n smf pod_name -o yaml 

The output of this command displays the following information:

  • The IP address of the host where the pod is deployed.

  • The service and application that is running on the pod.

  • The ID and name of the container within the pod.

  • The IP address of the pod.

  • The current state and phase in which the pod is.

  • The start time from when the pod is in the current state.

To view all the pods in the SMF namespace, use the following sample configuration:

kp get pods -n smf_namespace -o wide 

States

Understanding the pod's state lets you determine the current health and prevent the potential risks. The following table describes the pod's states.

Table 6. Pod States

State

Description

Running

The pod is healthy and deployed on a node.

It contains one or more containers.

Pending

The application is in the process of creating the container images for the pod.

Succeeded

Indicates that all the containers in the pod are successfully terminated. These pods cannot be restarted.

Failed

One ore more containers in the pod have failed the termination process. The failure occurred as the container either exited with non zero status or the system terminated the container.

Unknown

The state of the pod could not be determined. Typically, this could be observed because the node where the pod resides was not reachable.

GTPC Protocol Endpoint Merge with UDP Proxy Bypass

Feature Description

Bypass proxy is introduced to enable this GTP packets directly land on gtpc-ep pod. This will avoid the processing at udp-proxy and one hop will be reduced in packet forwarding.

All the features supported by existing gtpc-ep and udp-proxy are integrated in new merged path

following features are integrated from udp-proxy:

  • Transaction SLA

  • DSCP marking for GTP packets

  • Adding BGP routes for roamer subscriber on the fly

  • Supporting Dispatcher feature and incoming retransmission

  • SGW Cache integration for DDN

  • MBR cache integration

Following features are integrated from gtpc-ep:

  • Retransmissions based on n3t3 config for outbound requests

  • Monitor protocol and Monitor Subscriber

  • Echo message handling

GTPC Endpoint with GR-Split

For handling scaled GTP traffic and for the optimal use of CPU, multiple active instances of GTPC-EP are started, and traffic split is done based on GR Instances.

UDP Proxy Functionality Merge into Protocol Micro-services

Feature Description

The UDP Proxy micro-services provide UDP transport termination for protocols (PFCP, GTPC, and RADIUS) that require UDP. The UDP proxy provides user space packet forwarding and IPC communication towards protocol micro-services. It uses host networking for source IP address observability and operates in Active/Standby mode.

Multiple protocol micro-services depend on UDP proxy for UDP transport, therefore UDP proxy is a scale bottleneck and single point of failure. Merging UDP Proxy functionality into respective protocol micro-services will help mitigate the scale bottleneck and improve CPU usage by virtue of reducing one hop across micro-services in the signaling path.

How it Works

PFCP Protocol Endpoint with UDP Proxy Bypass

Protocol endpoint bypasses UDP proxy and sends N4/Sxa messages towards UPF directly. Incoming N4/Sxa messages from UPF also bypass UDP poxy and land on Protocol pod. (Subject to UPF support for Source IP Address IE in heartbeat request message). Protocol pod continues to use non-host networking mode of operation.

Kubernetes service starts to listen on the configured VIP IP address and standard port, ensuring incoming N4/Sxa UDP packets are sent to Protocol pods. A separate Kubernetes service created for N4 & Sx with separate target ports to identify the interface associated with the incoming message/packet. Kubernetes client IP address affinity is availed to ensure retransmitted packets from UPF are sent to the same Protocol pod instance to hit the retransmission cache successfully.

Current Mode (No Bypass)

In this mode of operation the message exchange for N4, Sxa, GTP-U happen through the UDP proxy. The UDP proxy is responsible for connecting to or receiving connections from UPF.

All the node related messages, or session that is related on PFCP are initiated either by the service or from the UPF and their responses pass through the UDP proxy.

Outbound Bypass Proxy Mode

This mode of operation is enabled by default for all messages that are initiated by S-GW or SMF service and sent by the system toward UPF using PFCP through Kubernetes Pod environment variable “OUTBOUND_PROXY_BYPASS”. The messages that are sent by SMF (Protocol pod) directly to UPF are session that is related and as follows:

  1. PFCP Session Establishment Request

  2. PFCP Session Modification Request

  3. PFCP Session Deletion Request

In this mode, the GTP-U messages from UPF or initiated by Service toward UPF continue to be exchanged through the UDP proxy. In this mode, only the session related messages (that is, the ones initiated by SMF Service) flow directly from Protocol towards the UPF.

Protocol pod receives the UPF IP address from the service, which is used to set up connection with UPF and subsequently use the same for session related message exchange. The node related messages continue to take the UDP proxy to protocol or Node Manager path.

Complete Bypass Mode (Inbound and Outbound)

In this mode, both inbound and outbound messages are sent and received by Protocol pod bypassing UDP Proxy. The protocol pod will listen on N4 and GTPu or Sxa ports based on the configured VIPs. Protocol pod ceases to be on a Kubernetes service network and remains in Host based networking mode. Protocol pods gets the IP of the node or VM that it is on, this condition is triggered based on an environment variable present or available for both Protocol and UDP proxy pods (UDP_PROXY_BYPASS). By default, this variable is false and UDP proxy and Protocol continue as they do today with UDP-Proxy exchanging messages with UPF.

UDP_PROXY_BYPASS is set to true only if both the following conditions are met:

  1. VIP is configured under endpoint PFCP interface N4 or interface Sxa.

  2. There is no VIP configured under endpoint protocol interface N4 or interface Sxa.

With change in value of UDP_PROXY_BYPASS variable, both UDP proxy and Protocol pods are restarted to enable this new mode of working or to fallback to earlier mode of message exchange trhough UDP proxy.

Triggering Bypass Mode using CLI

To trigger the bypass mode or protocol-proxy merged working, the VIP-IPs must be configured under endpoint PFCP as shown here:

no instance instance-id 1 endpoint protocol interface n4
no instance instance-id 1 endpoint protocol interface gtpu
instance instance-id 1 endpoint pfcp interface n4 vip-ip X.X.X.X
instance instance-id 1 endpoint pfcp interface gtpu vip-ip X.X.X.X

Important


With the preceding configuration the value of environment variable UDP_PROXY_BYPASS will change. This triggers a restart of both pods UDP proxy and Protocol.


Every feature that is present under endpoint→ protocol must be correspondingly configured under endpoint → PFCP and which include features like DSCP, SLA, and Dispatcher related configurations. The configurations for all features take effect only if internal VIP-IP is configured under endpoint → PFCP and interface N4 or interface Sxa. There should be interface N4 and VIP-IP or interface Sxa and VIP-IP present under endpoint → protocol.

Rendering CLI Values

Based on N4 and Sxa VIP configuration, the rendering logic calculates which values to publish under endpoint protocol. The configuration is rendered in pods having the key as “endpointIp”. The configuration path in each individual pod is located at /config/AppName/vip-ip/endpointIp.yaml. The affected pods are:

  1. Protocol

  2. Node Mgr

  3. SMF-Service

  4. SGW Service.

Having endpoint → pfcp configurations render under endpoint → protocol helps in avoiding changes to background configuration read logic.

Node Management

In this case Protocol starts a PFCP endpoint for peers to connect with it. At the same time, it will also establish connection with UPF as and when the app service initiates a PFCP message towards the UPF. Following messages are included:

  1. PFCP Association Setup Request/Response

  2. PFCP Association Update Request/Response

  3. PFCP Session Report Request/Response

  4. PFCP Node Report Request/Response

  5. Heartbeat Request/Response

  6. PFCP PFD Management Request/Response

Session Management

Session Management messages initiated by the service and sent directly to UPF through the Protocol pod. The protocol pod initiates connection with UPF to send these messages, this is the reason protocol pod must be in “Host networking” to take the IP address of the node on which it is on.

Standardized Port Numbers

While triggering the “Merged” mode, the protocol pod transitions into Host based networking. Protocol pod takes the IP address of the Host or the Node much like the existing UDP proxy pod. It is essential that UDP proxy, GTPC-EP, and Protocol do not share the same ports. The thumb rule for port calculation is:

Port_Value = Base_Port _Value + (Gr_Instance_Id_index *50) + (Logical_Instance_id mod 50)

Gr_Instance_id: The GR Instance ID supplied in the configurations using CLI.

Logical_Instance_id: Identifier for the logical SMF instance.

Prometheus Port:

With complete UDP proxy bypass the Prometheus port of 8080 is not used, instead the start port for Prometheus 8004 for instance 1. The "instance-Id” added with 8003 must be the port number.

Proxy Keep-Alive Port:

The proxy keepalive port starts from 27500+ “Instance-Id”.

  1. GR Instance 1 & Logical Instance Id 0 :- 27500 + (0 * 50) + (0 % 50) = 27500

  2. GR Instance 2 & Logical Instance Id 0 :- 27500 + (1 * 50) + (0 % 50) = 27550

Admin Port for Keepaive and Liveness Probe:

Admin Port will be 7879 + (Gr_Instance_Id_index *50) + (Logical_Instance_id mod 50)

Infra Diagnostics Port:

Infra Diag Port will be 7779 + (Gr_Instance_Id_index *50) + (Logical_Instance_id mod 50)

PProf port:

PProf Profiling port will be 7679 + (Gr_Instance_Id_index *50) + (Logical_Instance_id mod 50)