View Utilization Status

View Campus Utilization Reports

Procedure


Step 1

In the Space Utilization App left navigation menu, choose Campuses.

A table listing the various campuses is displayed.

Step 2

Use the calendar filters at the top to select the month and dates as needed.

Step 3

View these details:

  • Name

  • People Count (Avg)

  • Time Spent (Avg)

  • Room Utilization (% Time Occupied)

  • Location

Step 4

Use Search or click on the desired campus name to display its detailed view.
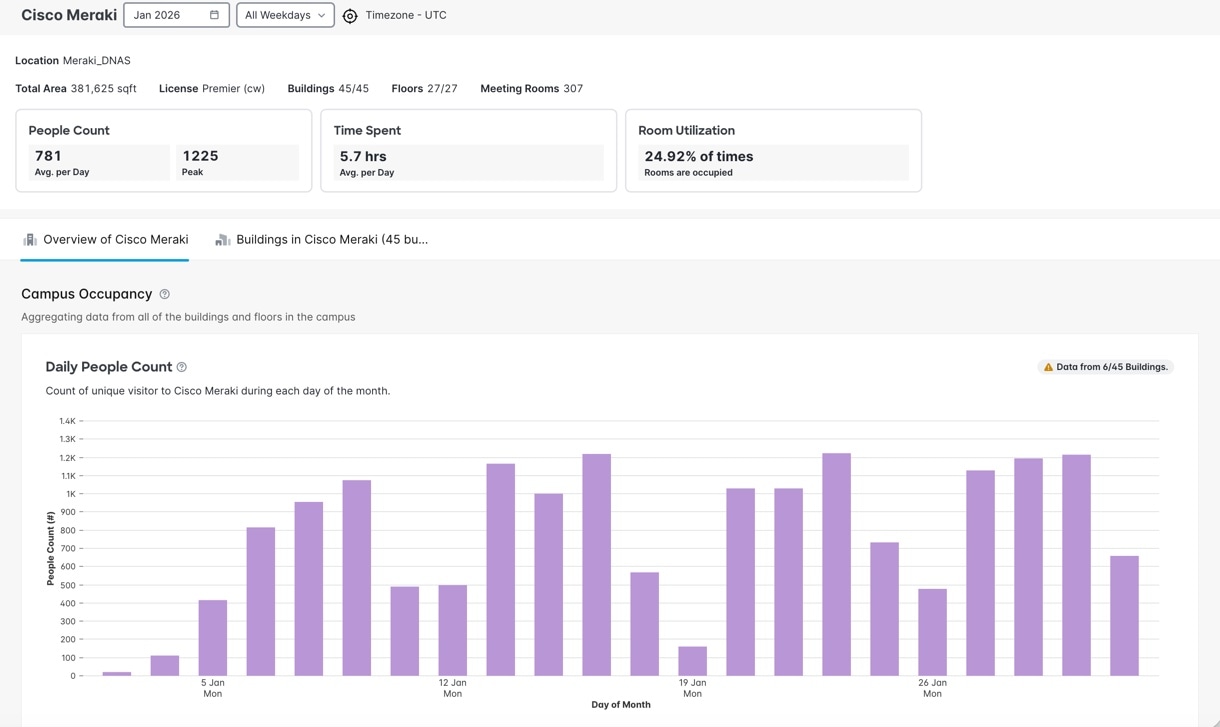
The Campus Details window is displayed. View the displayed information such as total area capacity, license details, buildings, floors, meeting rooms, time zone, people count, time spent, and room utilization.
Figure 1. Campus Reports

Step 5

Choose either the Overview tab or the View by Buildings tab to understand the space utilization at a campus or building level.

  • Overview: A summary of the People Count, Time Spent, and Room Utilization for the campus is displayed.
  • View by Buildings: Graphical charts showing trends in the utilization, people count, time spent, people hours, and density of the spaces within a building are displayed.

View Building Utilization Reports

Procedure


Step 1

In the Space Utilization App left navigation menu, choose Buildings.

A table listing the various buildings is displayed.

Step 2

Use the calendar filters at the top to select the month and dates as needed.

Step 3

View these details:

  • Name

  • Utilization (%)

  • People Count (Avg)

  • Time Spent (Avg)

  • Room Utilization (% Time Occupied)

  • Location

Step 4

Use Search or click on the desired building name to display its detailed view.

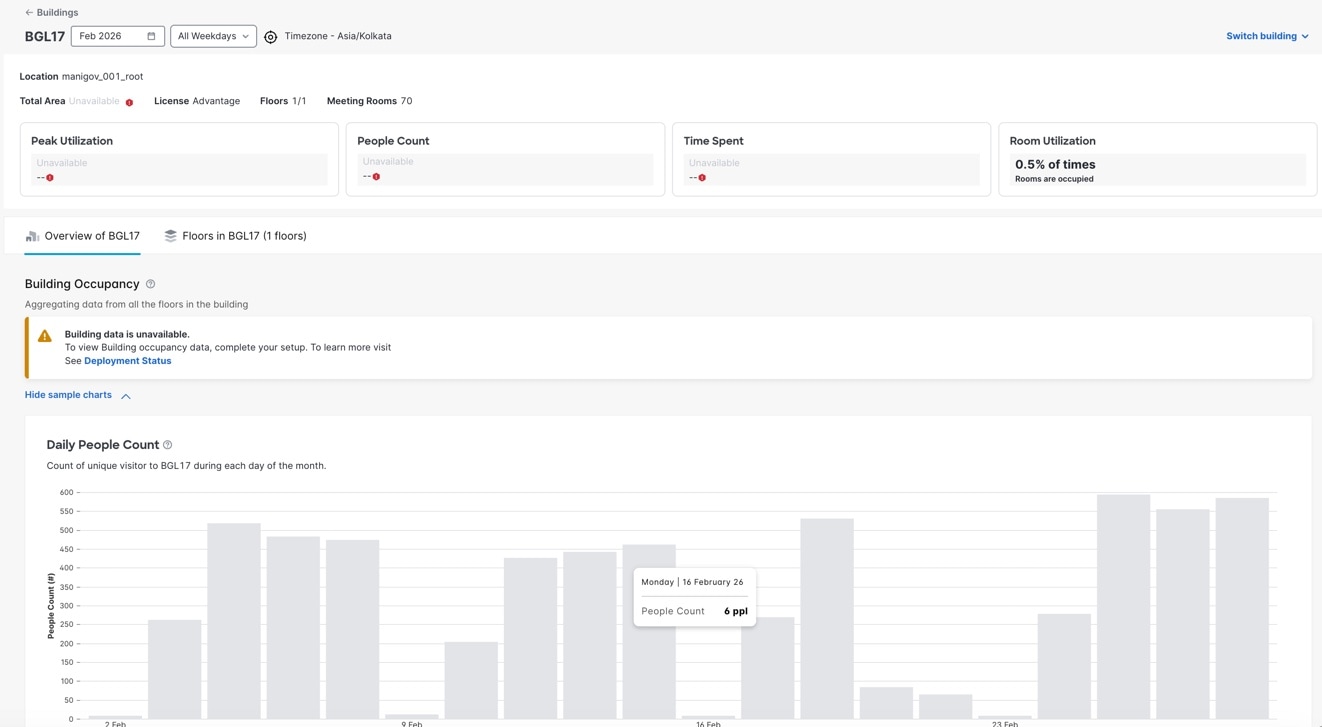
The Building Details window is displayed. View the displayed information such as total area capacity, license details, buildings, floors, meeting rooms, time zone, people count, time spent, and room utilization.
Figure 2. Building

Step 5

Choose either the Overview tab or the Floors in Building tab to understand the space utilization at a building or floor level.

  • Overview: A summary of the Peak Utilization, People Count, Time Spent, and Room Utilization for the building is displayed.
  • Floors in Building: Graphical charts showing trends in the utilization, people count, time spent, people hours, and density of the spaces on a floor are displayed.

Step 6

To view the building utilization report for a different building under the same root campus, from the Switch Building drop-down list, choose the building.


View Floor Utilization Reports

Procedure


Step 1

In the Space Utilization App left navigation menu, choose Floors.

A list of buildings and a table listing the various floors within the chosen building are displayed.

Step 2

Use the calendar filters at the top to select the month and dates as needed.

Step 3

View these details:

  • Name

  • Utilization (%)

  • People Count (Avg)

  • Time Spent (Avg)

  • Room Utilization (% Time Occupied)

Step 4

Use Search or click on the desired floor name to display its detailed view.

The Floor Details window is displayed. View the displayed information such as total area capacity, license details, buildings, floors, meeting rooms, time zone, people count, time spent, and room utilization.

Step 5

Choose the Overview tab to understand the space utilization at a floor or room level.

A summary of the Peak Utilization, People Count, Time Spent, and Room Utilization for the building is displayed.

Step 6

To view the floor utilization report for a different floor under the same root building and campus, from the Switch Building drop-down list, choose the floor.


Overview Room View Metrics

The Room Metric View in the Space Utilization app shows how meeting rooms are used across supported locations. It helps users to view utilization and occupancy metrics for individual rooms within the selected Building and Floor context.

Users can navigate from room lists, map-based room workflows, and % Utilization by Room views into Room Details for a selected room while preserving the originating Building or Floor context.

Licensing Requirements

Room View Metrics is supported for accounts with the following licenses:

  • PREMIER_W

  • PREMIER_CW

Room List View

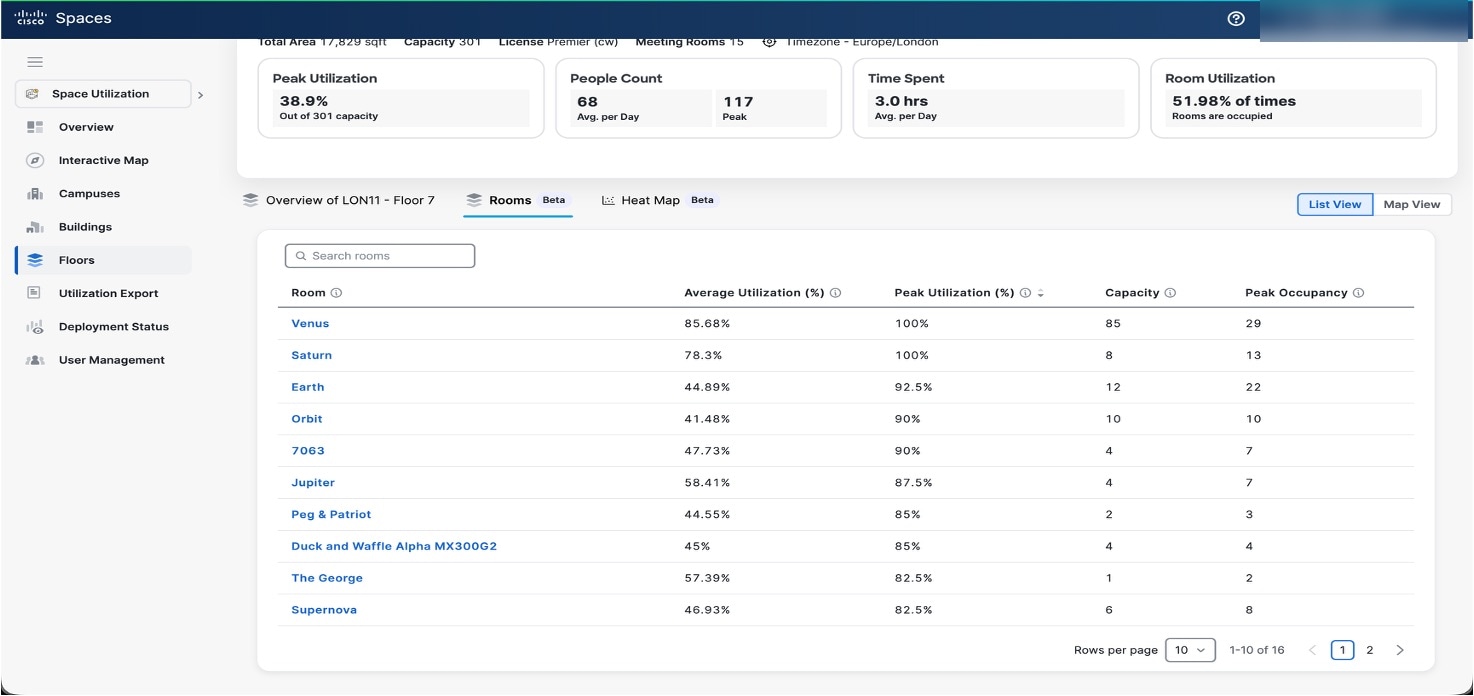
List View shows the rooms under the selected floor in a table format. It helps users quickly scan available rooms and compare utilization and occupancy values.

The list includes these columns:

  • Room

  • Average Utilization (%)

  • Peak Utilization (%)

  • Capacity

  • Peak Occupancy

Figure 3. List View

Room Map View

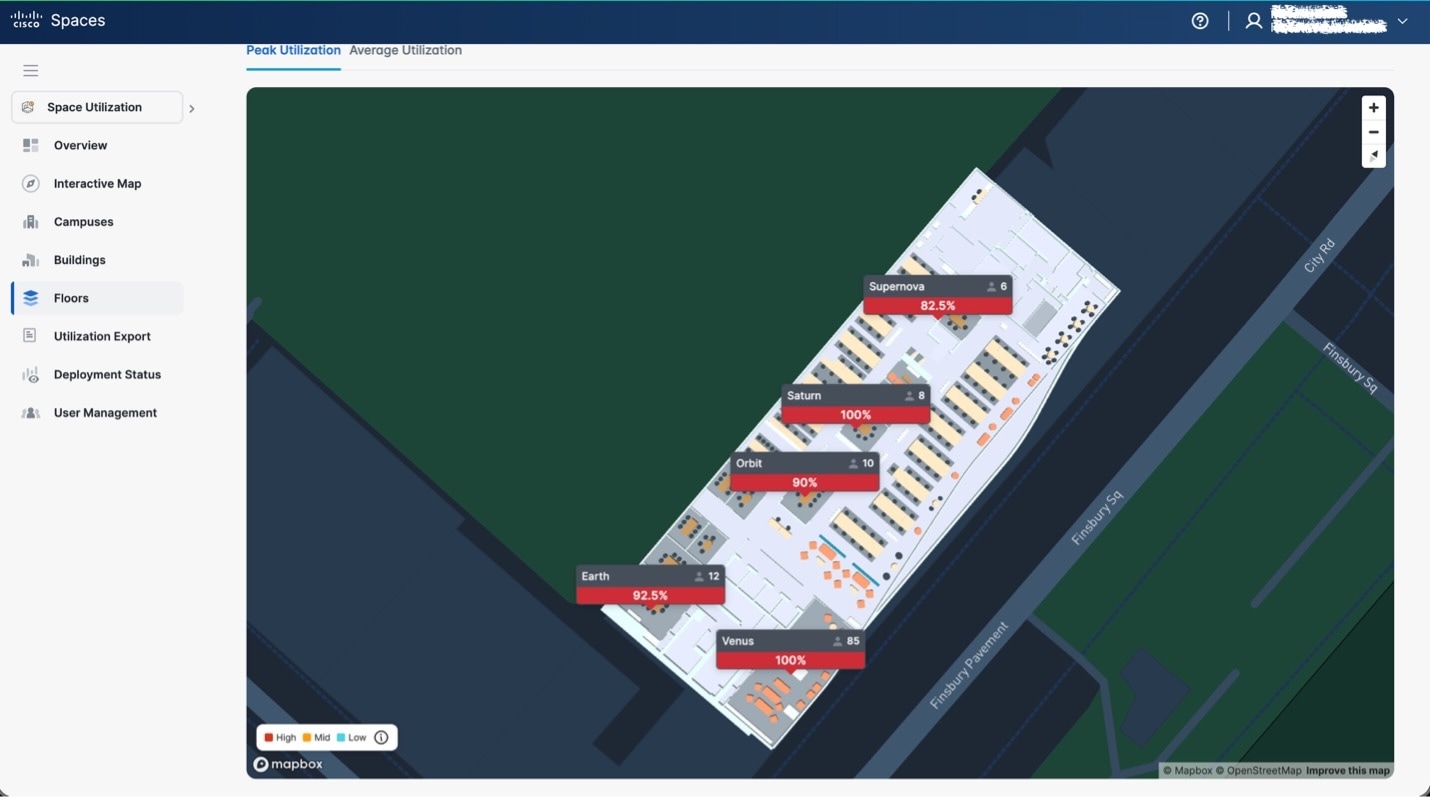
Map View shows the rooms directly on the floor map. It helps users understand room usage visually in the context of the floor layout.

Figure 4. Room Map View

Each room card on the map can show:

  • Room Name

  • Utilization Percentage

  • Capacity

Users can also switch between Peak Utilization and Average Utilization in Map View.

Room Metrics detailed view

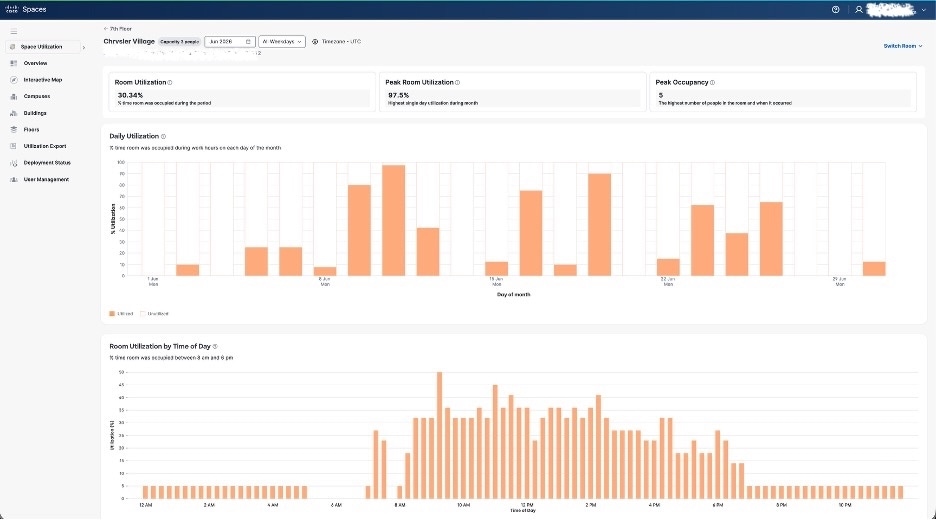
The Room View page provides a detailed view of how an individual room is being used during the selected period. After a user opens Room Details, the page shows room-level utilization and occupancy insights for that room.

The Room View includes these summary metrics:

  • Room Utilization

  • Peak Room Utilization

  • Peak Occupancy

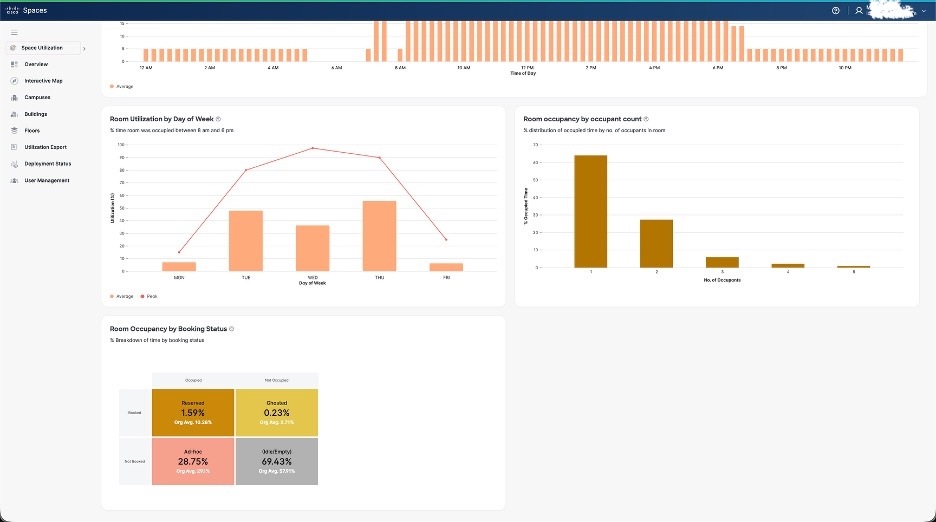
The Room View also includes detailed charts such as:

  • Daily Utilization

  • Room Utilization by Time of Day

  • Room Utilization by Day of Week

  • Room Occupancy by Occupant Count

  • Room Occupancy by Booking Status

These views help users understand how a room is used over time, identify peak usage periods, review occupancy behavior, and analyze booking-based room utilization patterns

Figure 5.
Figure 6.