Troubleshooting Using the REST API

Collecting and Exporting Technical Support Information

About Exporting Files

An administrator can configure export policies in the APIC to export statistics, technical support collections, faults and events, to process core files and debug data from the fabric (the APIC as well as the switch) to any external host. The exports can be in a variety of formats, including XML, JSON, web sockets, secure copy protocol (SCP), or HTTP. You can subscribe to exports in streaming, periodic, or on-demand formats.

An administrator can configure policy details such as the transfer protocol, compression algorithm, and frequency of transfer. Policies can be configured by users who are authenticated using AAA. A security mechanism for the actual transfer is based on a username and password. Internally, a policy element handles the triggering of data.

Sending an On-Demand Tech Support File Using the REST API

Procedure


Step 1

Set the remote destination for a technical support file using the REST API, by sending a POST with XML such as the following example:

Example:

<fileRemotePath userName="" remotePort="22" remotePath="" protocol="sftp" name="ToSupport" host="192.168.200.2" 
dn="uni/fabric/path-ToSupport" descr="">

<fileRsARemoteHostToEpg tDn="uni/tn-mgmt/mgmtp-default/oob-default"/>

</fileRemotePath>

Step 2

Generate an on-demand technical support file using the REST API by sending a POST with XML such as the following:

Example:


<dbgexpTechSupOnD upgradeLogs="no" startTime="unspecified" name="Tech_Support_9-20-16"
  exportToController="no" endTime="unspecified" dn="uni/fabric/tsod-Tech_Support_9-20-16" descr=""
  compression="gzip" category="forwarding" adminSt="untriggered">
    <dbgexpRsExportDest tDn="uni/fabric/path-ToSupport"/>
    <dbgexpRsTsSrc tDn="topology/pod-1/node-102/sys"/>
    <dbgexpRsTsSrc tDn="topology/pod-1/node-103/sys"/>
    <dbgexpRsTsSrc tDn="topology/pod-1/node-101/sys"/>
    <dbgexpRsData tDn="uni/fabric/tscont"/>
</dbgexpTechSupOnD>
<fabricFuncP>
    <fabricCtrlrPGrp name="default">
        <fabricRsApplTechSupOnDemand tnDbgexpTechSupOnDName=" Tech_Support_9-20-16"/>
    </fabricCtrlrPGrp>
</fabricFuncP>

Troubleshooting Using Atomic Counters

Atomic Counters

Atomic Counters are useful for troubleshooting connectivity between endpoints, EPGs, or an application within the fabric. A user reporting application may be experiencing slowness, or atomic counters may be needed for monitoring any traffic loss between two endpoints. One capability provided by atomic counters is the ability to place a trouble ticket into a proactive monitoring mode, for example when the problem is intermittent, and not necessarily happening at the time the operator is actively working the ticket.

Atomic counters can help detect packet loss in the fabric and allow the quick isolation of the source of connectivity issues. Atomic counters require NTP to be enabled on the fabric.

Leaf-to-leaf (TEP to TEP) atomic counters can provide the following:

  • Counts of drops, admits, and excess packets
  • Short-term data collection such as the last 30 seconds, and long-term data collection such as 5 minutes, 15 minutes, or more
  • A breakdown of per-spine traffic (available when the number of TEPs, leaf or VPC, is less than 64)
  • Ongoing monitoring

Leaf-to-leaf (TEP to TEP) atomic counters are cumulative and cannot be cleared. However, because 30 second atomic counters reset at 30 second intervals, they can be used to isolate intermittent or recurring problems.

Tenant atomic counters can provide the following:

  • Application-specific counters for traffic across the fabric, including drops, admits, and excess packets
  • Modes include the following:
  • Endpoint to endpoint MAC address, or endpoint to endpoint IP address. Note that a single target endpoint could have multiple IP addresses associated with it.
  • EPG to EPG with optional drill down
  • EPG to endpoint
  • EPG to * (any)
  • Endpoint to external IP address

Note


Atomic counters track the amount packets of between the two endpoints and use this as a measurement. They do not take into account drops or error counters in a hardware level.


Dropped packets are calculated when there are less packets received by the destination than transmitted by the source.

Excess packets are calculated when there are more packets received by the destination than transmitted by the source.

Enabling Atomic Counters

To enable using atomic counters to detect drops and misrouting in the fabric and enable quick debugging and isolation of application connectivity issues, create one or more tenant atomic counter policies, which can be one of the following types:

  • EP_to_EP—Endpoint to endpoint (dbgacEpToEp)

  • EP_to_EPG—Endpoint to endpoint group (dbgacEpToEpg)

  • EP_to_Ext—Endpoint to external IP address (dbgacEpToExt)

  • EPG_to_EP—Endpoint group to endpoint(dbgacEpgToEp)

  • EPG_to_EPG—Endpoint group to endpoing group (dbgacEpgToEpg)

  • EPG_to_IP—Endpoint group to IP address (dbgacEpgToIp)

  • Ext_to_EP—External IP address to endpoint (dbgacExtToEp)

  • IP_to_EPG—IP address to endpoint group (dbgacIpToEpg)

  • Any_to_EP—Any to endpoint (dbgacAnyToEp)

  • EP_to_Any—Endpoint to any (dbgacEpToAny)

Procedure


Step 1

To create an EP_to_EP policy using the REST API, use XML such as the following example:

Example:

<dbgacEpToEp name="EP_to_EP_Policy" ownerTag="" ownerKey="" 
dn="uni/tn-Tenant64/acEpToEp-EP_to_EP_Policy" descr="" adminSt="enabled">
<dbgacFilter name="EP_to_EP_Filter" ownerTag="" ownerKey="" descr="" 
srcPort="https" prot="tcp" dstPort="https"/>
</dbgacEpToEp>

Step 2

To create an EP_to_EPG policy using the REST API, use XML such as the following example:

Example:

<dbgacEpToEpg name="EP_to_EPG_Pol" ownerTag="" ownerKey="" 
dn="uni/tn-Tenant64/epToEpg-EP_to_EPG_Pol" descr="" adminSt="enabled">
<dbgacFilter name="EP_to_EPG_Filter" ownerTag="" ownerKey="" descr="" 
srcPort="http" prot="tcp" dstPort="http"/>
<dbgacRsToAbsEpg tDn="uni/tn-Tenant64/ap-VRF64_app_prof/epg-EPG64"/>
</dbgacEpToEpg>

About Fabric Latency

Fabric latency is a troubleshooting tool to monitor the time taken by a packet to traverse from source to destination in the fabric. It can be used to measure latency between a combination of endpoints, endpoint groups, external interfaces, and IP addresses. Latency is measured from the Arrival time in the ingress leaf switch to the Departure time in the egress leaf switch. A prerequisite for fabric latency measurement is that all the nodes shall be synchronized with uniform time. Precision Time Protocol (PTP) is used for this, due to its' sub-microsecond accuracy, compared to NTP, which has only millisecond precisions. NTP is not sufficient to measure packet flight times within an ACI fabric, which is in the order of microseconds. Hence, latency feature requires all the nodes in the fabric to be synchronized using PTP.

There are two types of latency measurement:

  • Ongoing TEP-to-TEP latency

  • On-demand Tenant latency

Ongoing latency or Leaf-to-leaf (TEP to TEP) latency is used to measure latency across Tunnel End Points in leaf switches. It provides the average and maximum latency, standard deviation, and packet count computed at the destination leaf switch. The latency data collected for the last 30 seconds as well as the cumulative latency values are provided. The TEP-to-TEP latency measurements are enabled as soon as PTP is turned on in the fabric.

Tenant latency measurements can be configured to troubleshoot issues at the level of individual applications. They can be enabled for the IP flows matching a specific Flow rule programmed in the Latency TCAM. The flow rules semantics are similar to the current Atomic counter flow rules.


Note


If latency measurement is configured for a particular IP flow, then the latency measurement simultaneously being done for this flow’s tunnel, will not account for latency of this flow.


The following flow rules are supported for latency measurement, in addition to atomic counters:

  • Measure EP to EP latency

  • Measure EP to EPG latency

  • Measure EP to External IP latency

  • Measure EPG to EP latency

  • Measure EPG to EPG latency

  • Measure EPG to External IP latency

  • Measure External IP to EP latency

  • Measure External IP to EPG latency

  • Measure Any to EP latency

  • Measure External IP to External IP latency

  • Measure EP to Any latency


Note


Both Atomic counters and Latency measurements can be independently enabled or disabled on the same IP flow rules.


Latency data can be measured in two modes; average and histogram. The mode can be specified independently for ongoing latency as well as for each flow rule in tenant latency policies.

Average Mode

Average mode enables the following measurements.
  • Average latency for last 30 seconds

  • Standard deviation for last 30 seconds

  • Packet count for last 30 second

  • Accumulated average latency

  • Accumulated Maximum latency

  • Accumulated Packet Count


Note


The latency measurement in average mode may slightly differ in the low order multiples, of 0.1 microsecond, compared to an external measurement equipment.


Histogram Mode

Histogram mode enables the visualization of the distribution of packet counts across different latency intervals. There are 16 Histogram buckets, and each bucket is configured with a measurement interval. Bucket 0's measurement interval is 0 to 5 microseconds, and Bucket 1 between 5 to 10 microseconds ending in 80 microseconds for the last bucket. Each of these buckets include a 64 bit counter to measure packets whose latency fell within the bucket’s configured latency interval.

The histogram charts are useful for understanding the latency trends, but may not reflect the exact packet count. For measuring the actual number of packets, atomic counters may be used.

The maximum number of TEP-to-TEP latency entries supported is 384. In EX-based TORs, we can have at most 256 flows in average mode and 64 flows in histogram mode. In FX-based TORS, we can have at most 640 flows in average mode and 320 flows in histogram mode.

About PTP

Precision Time Protocol (PTP) is a time synchronization protocol defined in IEEE 1588 for nodes distributed across a network. With PTP, it is possible to synchronize distributed clocks with an accuracy of less than 1 microsecond via Ethernet networks. PTP’s accuracy comes from the hardware support for PTP in the ACI fabric spines and leafs. It allows the protocol to accurately compensate for message delays and variation across the network.

PTP is a distributed protocol that specifies how real-time PTP clocks in the system synchronize with each other. These clocks are organized into a master-slave synchronization hierarchy with the grandmaster clock, which is the clock at the top of the hierarchy, determining the reference time for the entire system. Synchronization is achieved by exchanging PTP timing messages, with the members using the timing information to adjust their clocks to the time of their master in the hierarchy. PTP operates within a logical scope called a PTP domain.

The PTP process consists of two phases: establishing the master-slave hierarchy and synchronizing the clocks. Within a PTP domain, each port of an ordinary or boundary clock follows this process to determine its state:

  • Examines the contents of all received announce messages (issued by ports in the master state).

  • Compares the data sets of the foreign master (in the announce message) and the local clock for priority, clock class, accuracy, and so on.

  • Determines its own state as either master or slave.

After the master-slave hierarchy has been established, the clocks are synchronized as follows:

  • The master sends a synchronization message to the slave and notes the time it was sent.

  • The slave receives the synchronization message and notes the time that it was received. For every synchronization message, there is a follow-up message. Hence, the number of sync messages should be equal to the number of follow-up messages.

  • The slave sends a delay-request message to the master and notes the time it was sent.

  • The master receives the delay-request message and notes the time it was received.

  • The master sends a delay-response message to the slave. The number of delay request messages should be equal to the number of delay response messages.

  • The slave uses these timestamps to adjust its clock to the time of its master.

In ACI fabric, when PTP feature is globally enabled in APIC, the software automatically enables PTP on specific interfaces of all the supported spines and leafs. This auto-configuration ensures that PTP is optimally enabled on all the supported nodes. In the absence of an external grandmaster clock, one of the spine switch is chosen as the grandmaster. The master spine is given a different PTP priority as compared to the other spines and leaf switches so that they will act as PTP slaves. This way we ensure that all the leaf switches in the fabric synchronize to the PTP clock of the master spine.

If an external Grandmaster clock is connected to the spines, the spine syncs to the external GM and in turn acts as a master to the leaf nodes.

PTP Default Settings

The following table lists the default settings for PTP parameters.

Parameters

Default

PTP device type

Boundary clock

PTP clock type

Two-step clock

PTP domain

0

PTP priority 1 value when advertising the clock

255

PTP priority 2 value when advertising the clock

255

PTP announce interval

1 log second

PTP announce timeout

3 announce intervals

PTP delay-request interval

0 log seconds

PTP sync interval

-2 log seconds

PTP VLAN

1


Note


PTP operates only in boundary clock mode. Cisco recommends deployment of a Grand Master Clock (10 MHz) upstream, with servers containing clocks requiring synchronization connected to the switch.


PTP Verification

Command

Purpose

show ptp brief

Displays the PTP status.

show ptp clock

Displays the properties of the local clock, including clock identity.

show ptp clock foreign-masters record interface ethernet slot/port

Displays the state of foreign masters known to the PTP process. For each foreign master, the output displays the clock identity, basic clock properties, and whether the clock is being used as a grandmaster.

show ptp corrections

Displays the last few PTP corrections.

show ptp counters [all |interface Ethernet slot/port]

Displays the PTP packet counters for all interfaces or for a specified interface.

show ptp parent

Displays the properties of the PTP parent.

Troubleshooting Using Atomic Counters with the REST API

Procedure


Step 1

To get a list of the endpoint-to-endpoint atomic counters deployed within the fabric and the associated details such as dropped packet statistics and packet counts, use the dbgEpToEpTsIt class in XML such as the following example:

Example:

https://apic-ip-address/api/node/class/dbgEpToEpRslt.xml 

Step 2

To get a list of external IP-to-endpoint atomic counters and the associated details, use the dbgacExtToEp class in XML such as the following example:

Example:

https://apic-ip-address/api/node/class/dbgExtToEpRslt.xml 

Configuring Latency and PTP Using the REST API

To configure the flow policy parameters, follow the same steps for configuring atomic counters in Cisco APIC Troubleshooting guide: https://www.cisco.com/c/en/us/td/docs/switches/datacenter/aci/apic/sw/1-x/troubleshooting/b_APIC_Troubleshooting/b_APIC_Troubleshooting_chapter_0110.html#id_40942.

Procedure


Step 1

To enable PTP mode:

Example:

/api/node/mo/uni/fabric/ptpmode.xml
<latencyPtpMode state=”enabled”>

Step 2

Configure an EP to EP policy:

Example:

<dbgacEpToEp name="EP_to_EP_Policy" adminSt="enabled" usage=“latency-stats” latencyCollect = “histogram”>
</dbgacEpToEp>

Step 3

To enable both atomic counter and latency (average mode), here’s the XML

Example:

<dbgacEpToEp name="EP_to_EP_Policy" adminSt="enabled" usage=“latency-stats|atomic-counter” latencyCollect = “average”>
</dbgacEpToEp>

Step 4

To change the collection type for Ongoing-mode from average to histogram.

Example:

<latencyOngoingMode userMode=”histogram”>

Troubleshooting Using Faults

Understanding APIC Faults

From a management point of view we look at the Application Policy Infrastructure Controller (APIC) from two perspectives:

  • Policy Controller - Where all fabric configuration is created, managed and applied. It maintains a comprehensive, up-to-date run-time representation of the administrative or configured state.

  • Telemetry device - All devices (Fabric Switches, Virtual Switches, integrated Layer 4 to Layer 7 devices) in an Cisco Application Centric Infrastructure (ACI) fabric report faults, events and statistics to the APIC.

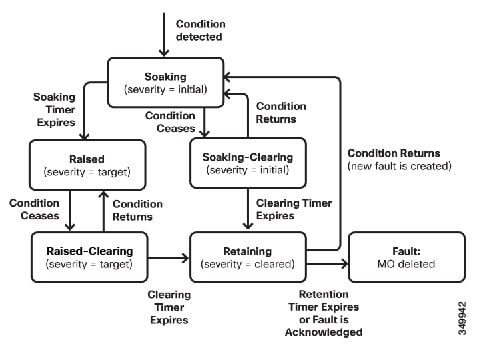
Faults, events, and statistics in the ACI fabric are represented as a collection of Managed Objects (MOs) within the overall ACI Object Model/Management Information Tree (MIT). All objects within ACI can be queried, including faults. In this model, a fault is represented as a mutable, stateful, and persistent MO.

Figure 1. Fault Lifecycle


When a specific condition occurs, such as a component failure or an alarm, the system creates a fault MO as a child object to the MO that is primarily associated with the fault. For a fault object class, the fault conditions are defined by the fault rules of the parent object class. Fault MOs appear as regular MOs in MIT; they have a parent, a DN, RN, and so on. The Fault "code" is an alphanumerical string in the form FXXX. For more information about fault codes, see the Cisco APIC Faults, Events, and System Messages Management Guide.

Troubleshooting Using Faults with the REST API

MOs can be queried by class and DN, with property filters, pagination, and so on.

In most cases, a fault MO is automatically created, escalated, de-escalated, and deleted by the system as specific conditions are detected. There can be at most one fault with a given code under an MO. If the same condition is detected multiple times while the corresponding fault MO is active, no additional instances of the fault MO are created. For example, if the same condition is detected multiple times for the same affected object, only one fault is raised while a counter for the recurrence of that fault will be incremented.

A fault MO remains in the system until the fault condition is cleared. For a fault to be removed, the condition raising the fault must be cleared, whether by configuration or a change in the run time state of the fabric. An exception to this is if the fault is in the cleared or retained state, in which case the fault can be deleted by the user by acknowledging it.

Severity provides an indication of the estimated impact of the condition on the capability of the system or component to provide service.

Possible values are:

  • Warning (possibly no impact)

  • Minor

  • Major

  • Critical (system or component completely unusable)

The creation of a fault MO can be triggered by internal processes such as:

  • Finite state machine (FSM) transitions or detected component failures

  • Conditions specified by various fault policies, some of which are user-configurable


Note


You can set fault thresholds on statistical measurements such as health scores, data traffic, or temperatures.

Procedure


Step 1

To retrieve the health score for a tenant named "3tierapp", send a REST query to the fabric such as the following:

Example:


https://apic-ip-address/api/node/mo/uni/tn-3tierapp.xml?query-target=self&rsp-subtreeinclude=
health

Step 2

To retrieve statistics for a tenant named "3tierapp", send a REST query to the fabric such as the following:

Example:


https://apic-ip-address/api/node/mo/uni/tn-3tierapp.xml?query-target=self&rsp-subtreeinclude=
stats

Step 3

To retrieve the faults for a leaf node, send a REST query to the fabric such as the following:

Example:


https://apic-ip-address/api/node/mo/topology/pod-1/node-103.xml?query-target=self&rspsubtree-
include=faults

Statistics

Configuring a Stats Monitoring Policy Using the REST API

To use statistics for monitoring and troubleshooting the fabric, you can configure a stats collection policy and a stats export policy to monitor many objects in the APIC.

Procedure


Step 1

To create a stats collection policy using the REST API, send a POST request with XML such as the following:

Example:

<monEPGPol name="MonPol1" dn="uni/tn-tenant64/monepg-MonPol1">
     <monEPGTarget name="" descr="" scope="eventSevAsnP"/>
     <monEPGTarget name="" descr="" scope="faultSevAsnP"/>
     <monEPGTarget name="" descr="" scope="fvBD">
     <statsHierColl name="" descr="" histRet="inherited" granularity="5min" adminState="inherited"/>
</monEPGTarget>
<monEPGTarget name="" descr="" scope="syslogRsDestGroup"/>
<monEPGTarget name="" descr="" scope="syslogSrc"/>
<monEPGTarget name="" descr="" scope="fvCtx"/>
<statsHierColl name="" descr="" histRet="none" granularity="1w" adminState="enabled"/>
<statsHierColl name="" descr="" histRet="none" granularity="1qtr" adminState="enabled"/>
<statsHierColl name="" descr="" histRet="1w" granularity="1h" adminState="enabled"/>
<statsHierColl name="" descr="" histRet="1d" granularity="15min" adminState="enabled"/>
<statsHierColl name="" descr="" histRet="none" granularity="1year" adminState="enabled"/>
<statsHierColl name="" descr="" histRet="none" granularity="1mo" adminState="enabled"/>
<statsHierColl name="" descr="" histRet="1h" granularity="5min" adminState="enabled"/>
<statsHierColl name="" descr="" histRet="10d" granularity="1d" adminState="enabled"/>
<syslogSrc name="VRF64_SyslogSource" descr="" minSev="warnings" incl="faults">
<syslogRsDestGroup tDn="uni/fabric/slgroup-tenant64_SyslogDest"/>
</syslogSrc>
</monEPGPol>

Step 2

To configure a stats export policy send a post with XML such as the following (you can use either JSON or XML format):

Example:

<statsExportP 
          name="" descr="" frequency="stream" format="xml" compression="gzip">
     <statsDestP name="tenant64_statsExportDest" descr="" userName="" remotePort="0" 
          remotePath="192.168.100.20" protocol="sftp" host="192.168.100.1">
        <fileRsARemoteHostToEpg tDn="uni/tn-mgmt/mgmtp-default/oob-default"/>
     </statsDestP>
</statsExportP>

Recovering a Disconnected Leaf

Recovering a Disconnected Leaf

If all fabric interfaces on a leaf are disabled (interfaces connecting a leaf to the spine) due to a configuration pushed to the leaf, connectivity to the leaf is lost forever and the leaf becomes inactive in the fabric. Trying to push a configuration to the leaf does not work because connectivity has been lost. This chapter describes how to recover a disconnected leaf.

Recovering a Disconnected Leaf Using the REST API

To recover a disconnected leaf switch, you must enable at least one of the fabric interfaces using this procedure. You can enable the remaining interfaces using the GUI, REST API, or CLI.

To enable the first interface, post a policy using the REST API to delete the policy posted and bring the fabric ports Out-of-Service. You can post a policy to the leaf switch to bring the port that is Out-of-Service to In-Service as follows:


Note


This procedure assumes that 1/49 is one of the leaf switch ports connecting to the spine switch.


Procedure


Step 1

Clear the block list policy from the Cisco APIC using the REST API.

Example:

$APIC_Address/api/policymgr/mo/.xml
<polUni>
    <fabricInst>
        <fabricOOServicePol>
            <fabricRsOosPath tDn="topology/pod-1/paths-$LEAF_Id/pathep-[eth1/49]" lc="blacklist" status ="deleted"/>
        </fabricOOServicePol>
    </fabricInst>
</polUni>

Step 2

Post a local task to the node itself to bring up the interfaces you want using l1EthIfSetInServiceLTask.

Example:

$LEAF_Address/api/node/mo/topology/pod-1/node-$LEAF_Id/sys/action.xml
<actionLSubj oDn="sys/phys-[eth1/49]">
    <l1EthIfSetInServiceLTask adminSt='start'/>
</actionLSubj>

Troubleshooting Contracts and Taboo Contracts with Permit and Deny Logging

Verifying Contracts, Taboo Contracts, and Filters Using the REST API

This topic provides the REST API XML to verify contracts, taboo contracts, and filters.

Procedure


Step 1

Verify a contract for an EPG or an external network with XML such as the following example for a provider:

Example:

QUERY https://apic-ip-address/api/node/class/fvRsProv.xml

Step 2

Verify a contract on an EPG with XML such as the following example for a consumer:

Example:

QUERY https://apic-ip-address/api/node/class/fvRsCons.xml

Step 3

Verify exported contracts using XML such as the following example:

Example:

QUERY https://apic-ip-address/api/node/class/vzCPif.xml

Step 4

Verify contracts for a VRF with XML such as the following example:

Example:

QUERY https://apic-ip-address/api/node/class/vzBrCP.xml

Step 5

Verify taboo contracts with XML such as the following example:

Example:

QUERY https://apic-ip-address/api/node/class/vzTaboo.xml

For taboo contracts for an EPG, use the same query as for contracts for EPGs.

Step 6

Verify filters using XML such as the following example:

Example:

QUERY https://apic-ip-address/api/node/class/vzFilter.xml

Viewing ACL Permit and Deny Logs Using the REST API

The following example shows how to view Layer 2 deny log data for traffic flows, using the REST API. You can send queries using the following MOs:

  • acllogDropL2Flow

  • acllogPermitL2Flow

  • acllogDropL3Flow

  • acllogPermitL3Flow

  • acllogDropL2Pkt

  • acllogPermitL2Pkt

  • acllogDropL3Pkt

  • acllogPermitL3Pkt

Before you begin

You must enable permit or deny logging, before you can view ACL contract permit and deny log data.

Procedure


To view Layer 3 drop log data, send the following query using the REST API:

GET https://apic-ip-address/api/class/acllogDropL3Flow

Example:

The following example shows sample output:

<?xml version="1.0" encoding="UTF-8"?>
<imdata totalCount="2">
    <acllogPermitL3Flow childAction="" dn="topology/pod-1/node-101/ndbgs/acllog/tn-common/ctx-inb
        /permitl3flow-spctag-333-dpctag-444-sepgname-unknown-depgname-unknown-sip-[100:c000:a00:700:b00:0:f00:0]
        -dip-[19.0.2.10]-proto-udp-sport-17459-dport-8721-smac-00:00:15:00:00:28-dmac-00:00:12:00:00:25-sintf-
        [port-channel5]-vrfencap-VXLAN: 2097153" dstEpgName="unknown" dstIp="19.0.2.10" dstMacAddr="00:00:12:00:00:25" 
        dstPcTag="444" dstPort="8721" lcOwn="local" modTs="never" monPolDn="" protocol="udp" srcEpgName="unknown" 
        srcIntf="port-channel5" srcIp="100:c000:a00:700:b00:0:f00:0" srcMacAddr="00:00:15:00:00:28" srcPcTag="333" 
        srcPort="17459" status="" vrfEncap="VXLAN: 2097153"/>
    <acllogPermitL3Flow childAction="" dn="topology/pod-1/node-102/ndbgs/acllog/tn-common/ctx-inb
        /permitl3flow-spctag-333-dpctag-444-sepgname-unknown-depgname-unknown-sip-[100:c000:a00:700:b00:0:f00:0]-dip-
        [19.0.2.10]-proto-udp-sport-17459-dport-8721-smac-00:00:15:00:00:28-dmac-00:00:12:00:00:25-sintf-
        [port-channel5]-vrfencap-VXLAN: 2097153" dstEpgName="unknown" dstIp="19.0.2.10" dstMacAddr="00:00:12:00:00:25" 
        dstPcTag="444" dstPort="8721" lcOwn="local" modTs="never" monPolDn="" protocol="udp" srcEpgName="unknown" 
        srcIntf="port-channel5" srcIp="100:c000:a00:700:b00:0:f00:0" srcMacAddr="00:00:15:00:00:28" srcPcTag="333" 
        srcPort="17459" status="" vrfEncap="VXLAN: 2097153"/>
</imdata>
    

Troubleshooting Using Digital Optical Monitoring Statistics

Troubleshooting Using Digital Optical Monitoring With the REST API

To view DOM statistics using an XML REST API query:

Before you begin

You must have previously enabled digital optical monitoring (DOM) on an interface, before you can view the DOM statistics for it.

Procedure


The following example shows how to view DOM statistics on a physical interface, eth1/25 on node-104, using a REST API query:

GET https://apic-ip-address/api/node/mo/topology/pod-1/node-104/sys/phys-[eth1/25]/phys/domstats.xml?
query-target=children&target-subtree-class=ethpmDOMRxPwrStats&subscription=yes
The following response is returned:

response : {
   "totalCount":"1",
      "subscriptionId":"72057611234705430",
          "imdata":[
{"ethpmDOMRxPwrStats":{
   "attributes":{
      "alert":"none",
      "childAction":"",
      "dn":"topology/pod-1/node-104/sys/phys[eth1/25]/phys/domstats/rxpower",
      "hiAlarm":"0.158490",
      "hiWarn":"0.079430",
      "loAlarm":"0.001050",
      "loWarn":"0.002630",
      "modTs":"never",
      "status":"",
       "value":"0.139170"}}}]}

Troubleshooting Using Port Tracking

Port Tracking Policy for Fabric Port Failure Detection

Fabric port failure detection can be enabled in the fabric access global port tracking policy. The port tracking policy monitors the status of fabric ports between leaf switches and spine switches, and ports between tier-1 leaf switches and tier-2 leaf. When an enabled port tracking policy is triggered, the leaf switches take down all access interfaces on the switch that have EPGs deployed on them.


Note


Port tracking is located under Fabric > External Access Policies > Policies > Global > Port Tracking.


The port tracking policy specifies the number of fabric port connections that trigger the policy, and a delay timer for bringing the leaf switch access ports back up after the number of specified fabric ports is exceeded.

The following example illustrates how a port tracking policy behaves:

  • The port tracking policy specifies that the threshold of active fabric port connections each leaf switch that triggers the policy is 2.

  • The port tracking policy triggers when the number of active fabric port connections from the leaf switch to the spine switches drops to 2.

  • Each leaf switch monitors its fabric port connections and triggers the port tracking policy according to the threshold specified in the policy.

  • When the fabric port connections come back up, the leaf switch waits for the delay timer to expire before bringing its access ports back up. This gives the fabric time to reconverge before allowing traffic to resume on leaf switch access ports. Large fabrics may need the delay timer to be set for a longer time.


Note


Use caution when configuring this policy. If the port tracking setting for the number of active spine ports that triggers port tracking is too high, all leaf switch access ports will be brought down.


Port Tracking Using the REST API

Before you begin

This procedure explains how to use the Port Tracking feature using the REST API.

Procedure


Step 1

Turn on the Port Tracking feature using the REST API as follows (admin state: on):

<polUni>
<infraInfra dn="uni/infra">
<infraPortTrackPol name="default" delay="5" minlinks="4" adminSt="on">

</infraPortTrackPol>
</infraInfra>
</polUni>

Step 2

Turn off the Port Tracking feature using the REST API as follows (admin state: off):

<polUni>
<infraInfra dn="uni/infra">
<infraPortTrackPol name="default" delay="5" minlinks="4" adminSt=“off">

</infraPortTrackPol>
</infraInfra>
</polUni>

Removing Unwanted _ui_ Objects

Removing Unwanted _ui_ Objects Using the REST API

If you make changes with the Cisco NX-OS-Style CLI before using the Cisco APIC GUI, and objects appear in the Cisco APIC GUI (with names prepended with _ui_), these objects can be removed by performing a REST API request to the API, containing the following:

  • The Class name, for example infraAccPortGrp

  • The Dn attribute, for example dn="uni/infra/funcprof/accportgrp-__ui_l101_eth1--31"

  • The Status attribute set to status="deleted"

Perform the POST to the API with the following steps:

Procedure


Step 1

Log on to a user account with write access to the object to be removed.

Step 2

Send a POST to the API such as the following example:

POST https://192.168.20.123/api/mo/uni.xml
Payload:<infraAccPortGrp dn="uni/infra/funcprof/accportgrp-__ui_l101_eth1--31" status="deleted"/>

Troubleshooting Using Contract Permit and Deny Logs

About ACL Contract Permit and Deny Logs

To log and/or monitor the traffic flow for a contract rule, you can enable and view the logging of packets or flows that were allowed to be sent because of contract permit rules or the logging of packets or flows that were dropped because of:

  • Taboo contract deny rules

  • ACL contract permit and deny logging in the ACI fabric is only supported on Nexus 9000 Series switches with names that end in EX or FX, and all later models. For example, N9K-C93180LC-EX or N9K-C9336C-FX.

  • Using log directive on filters in management contracts is not supported. Setting the log directive will cause zoning-rule deployment failure.

For information on standard and taboo contracts and subjects, see Cisco Application Centric Infrastructure Fundamentals and Cisco APIC Basic Configuration Guide.

Enabling ACL Contract Permit Logging Using the REST API

The following example shows you how to enable permit and deny logging using the REST API. This example configures ACL permit and deny logging for a contract with subjects that have Permit and Deny actions configured.

Procedure


For this configuration, send a post with XML similar to the following example:

Example:

<vzBrCP dn="uni/tn-Tenant64/brc-C64" name="C64" scope="context">
    <vzSubj consMatchT="AtleastOne" name="HTTPSsbj" provMatchT="AtleastOne" revFltPorts="yes" rn="subj-HTTPSsbj">
         <vzRsSubjFiltAtt action="permit" directives="log" forceResolve="yes" priorityOverride="default" 
rn="rssubjFiltAtt-PerHTTPS" tDn="uni/tn-Tenant64/flt-PerHTTPS" tRn="flt-PerHTTPS" tnVzFilterName="PerHTTPS"/>
    </vzSubj>
    <vzSubj consMatchT="AtleastOne" name="httpSbj" provMatchT="AtleastOne" revFltPorts="yes" rn="subj-httpSbj">
        <vzRsSubjFiltAtt action="deny" directives="log" forceResolve="yes" priorityOverride="default" 
rn="rssubjFiltAtt-httpFilter" tDn="uni/tn-Tenant64/flt-httpFilter" tRn="flt-httpFilter" tnVzFilterName="httpFilter"/>
    </vzSubj>
    <vzSubj consMatchT="AtleastOne" name="subj64" provMatchT="AtleastOne" revFltPorts="yes" rn="subj-subj64">
        <vzRsSubjFiltAtt action="permit" directives="log" forceResolve="yes" priorityOverride="default" 
rn="rssubjFiltAtt-icmp" tDn="uni/tn-common/flt-icmp" tRn="flt-icmp" tnVzFilterName="icmp"/>
    </vzSubj>
</vzBrCP>

Enabling Taboo Contract Deny Logging Using the REST API

The following example shows you how to enable Taboo Contract deny logging using the REST API.

Procedure


To configure taboo contract deny logging, send a post with XML similar to the following example.

Example:

<vzTaboo dn="uni/tn-Tenant64/taboo-TCtrctPrefix" name="TCtrctPrefix" scope="context">
    <vzTSubj name="PrefSubj" rn="tsubj-PrefSubj"">
        <vzRsDenyRule directives="log" forceResolve="yes" rn="rsdenyRule-default" tCl="vzFilter" 
tDn="uni/tn-common/flt-default" tRn="flt-default"/>
    </vzTSubj>
</vzTaboo>

Viewing ACL Permit and Deny Logs Using the REST API

The following example shows how to view Layer 2 deny log data for traffic flows, using the REST API. You can send queries using the following MOs:

  • acllogDropL2Flow

  • acllogPermitL2Flow

  • acllogDropL3Flow

  • acllogPermitL3Flow

  • acllogDropL2Pkt

  • acllogPermitL2Pkt

  • acllogDropL3Pkt

  • acllogPermitL3Pkt

Before you begin

You must enable permit or deny logging, before you can view ACL contract permit and deny log data.

Procedure


To view Layer 3 drop log data, send the following query using the REST API:

GET https://apic-ip-address/api/class/acllogDropL3Flow

Example:

The following example shows sample output:

<?xml version="1.0" encoding="UTF-8"?>
<imdata totalCount="2">
    <acllogPermitL3Flow childAction="" dn="topology/pod-1/node-101/ndbgs/acllog/tn-common/ctx-inb
        /permitl3flow-spctag-333-dpctag-444-sepgname-unknown-depgname-unknown-sip-[100:c000:a00:700:b00:0:f00:0]
        -dip-[19.0.2.10]-proto-udp-sport-17459-dport-8721-smac-00:00:15:00:00:28-dmac-00:00:12:00:00:25-sintf-
        [port-channel5]-vrfencap-VXLAN: 2097153" dstEpgName="unknown" dstIp="19.0.2.10" dstMacAddr="00:00:12:00:00:25" 
        dstPcTag="444" dstPort="8721" lcOwn="local" modTs="never" monPolDn="" protocol="udp" srcEpgName="unknown" 
        srcIntf="port-channel5" srcIp="100:c000:a00:700:b00:0:f00:0" srcMacAddr="00:00:15:00:00:28" srcPcTag="333" 
        srcPort="17459" status="" vrfEncap="VXLAN: 2097153"/>
    <acllogPermitL3Flow childAction="" dn="topology/pod-1/node-102/ndbgs/acllog/tn-common/ctx-inb
        /permitl3flow-spctag-333-dpctag-444-sepgname-unknown-depgname-unknown-sip-[100:c000:a00:700:b00:0:f00:0]-dip-
        [19.0.2.10]-proto-udp-sport-17459-dport-8721-smac-00:00:15:00:00:28-dmac-00:00:12:00:00:25-sintf-
        [port-channel5]-vrfencap-VXLAN: 2097153" dstEpgName="unknown" dstIp="19.0.2.10" dstMacAddr="00:00:12:00:00:25" 
        dstPcTag="444" dstPort="8721" lcOwn="local" modTs="never" monPolDn="" protocol="udp" srcEpgName="unknown" 
        srcIntf="port-channel5" srcIp="100:c000:a00:700:b00:0:f00:0" srcMacAddr="00:00:15:00:00:28" srcPcTag="333" 
        srcPort="17459" status="" vrfEncap="VXLAN: 2097153"/>
</imdata>