Using the Cisco APIC Troubleshooting Tools

This chapter introduces the tools and methodology commonly used to troubleshoot problems you may experience. These tools can assist you with monitoring traffic, debugging, and detecting issues such as traffic drops, misrouting, blocked paths, and uplink failures. See the tools listed below for a summary overview of the tools described in this chapter:

  • ACL Contract Permit and Deny Logs—Enables the logging of packets or flows that were allowed to be sent because of contract permit rules and the logging of packets or flows dropped because of taboo contract deny rules.
  • Atomic Counters—Enables you to gather statistics about traffic between flows for detecting drops and misrouting in the fabric and for enabling quick debugging and isolation of application connectivity issues.
  • Digital Optical Monitoring—Enables you to view digital optical monitoring (DOM) statistics about a physical interface.
  • Health Scores—Enables you to isolate performance issues by drilling down through the network hierarchy to isolate faults to specific managed objects (MOs).
  • Port Tracking—Enables you to monitor the status of links between leaf switches and spine switches for detecting uplink failure.
  • SNMP—Simple Network Management Protocol (SNMP) enables you to remotely monitor individual hosts (APIC or another host) and find out the state of any particular node.
  • SPAN—Switchport Analizer (SPAN) enables you to perform detailed troubleshooting or to take a sample of traffic from a particular application host for proactive monitoring and analysis.
  • Statistics—Provides real-time measures of observed objects. Viewing statistics enable you to perform trend analysis and troubleshooting.
  • Syslog—Enables you to specify the minimum severity level of messages to be sent, the items to be included in the syslog messages, and the syslog destination. The format can also be displayed in NX-OS CLI format.
  • Traceroute—Enables you to find the routes that packets actually take when traveling to their destination.
  • Troubleshooting Wizard—Enables administrators to troubleshoot issues that occur during specific time frames, which can be designated by selecting two endpoints.

This chapter contains the following sections:

Enabling and Viewing ACL Contract and Deny Logs

About ACL Contract Permit and Deny Logs

To log and/or monitor the traffic flow for a contract rule, you can enable and view the logging of packets or flows that were allowed to be sent because of contract permit rules or the logging of packets or flows that were dropped because of:

  • Taboo contract deny rules

  • ACL contract permit and deny logging in the ACI fabric is only supported on Nexus 9000 Series switches with names that end in EX or FX, and all later models. For example, N9K-C93180LC-EX or N9K-C9336C-FX.

  • Using log directive on filters in management contracts is not supported. Setting the log directive will cause zoning-rule deployment failure.

For information on standard and taboo contracts and subjects, see Cisco Application Centric Infrastructure Fundamentals and Cisco APIC Basic Configuration Guide.

Enabling ACL Contract Permit and Deny Logging Using the GUI

The following steps show how to enable contract permit and deny logging using the GUI:


Note


The tenant that contains the permit logging is the tenant that contains the VRF that the EPG is associated to. This will not necessarily be the same tenant as the EPG or its associated contracts.

Procedure


Step 1

On the menu bar, choose Tenants > <tenant name>.

Step 2

In the Navigation pane, expand Contracts, right-click Standard, and choose Create Contract.

Step 3

In the Create Contract dialog box, perform the following actions:

  1. In the Name field, type the name for the contract.

  2. In the Scope field, choose the scope for it (VRF, Tenant, or Global).

  3. Optional. Set the target DSCP or QoS class to be applied to the contract.

  4. Click the + icon to expand Subjects.

Step 4

In the Create Contract Subject dialog box, perform the following actions:

Step 5

Enter the name of the subject and an optional description.

Step 6

Optional. From the drop-down list for the target DSCP, select the DSCP to be applied to the subject.

Step 7

Leave Apply Both Directions checked, unless you want the contract to only be applied from the consumer to the provider, instead of in both directions.

Step 8

Leave Reverse Filter Ports checked if you unchecked Apply Both Directions to swap the Layer 4 source and destination ports so that the rule is applied from the provider to the consumer.

Step 9

Click the + icon to expand Filters.

Step 10

In the Name drop-down list, choose an option; for example, click arp, default, est, or icmp, or choose a previously configured filter.

Step 11

In the Directives drop-down list, click log.

Step 12

Click Update.

Step 13

Click OK.

Step 14

Click Submit.

Logging is enabled for this contract.

Enabling ACL Contract Permit Logging Using the NX-OS CLI

The following example shows how to enable Contract permit logging using the NX-OS CLI.

Procedure


Step 1

To enable logging of packets or flows that were allowed to be sent because of Contract permit rules, use the following commands:

configure
tenant <tenantName>
contract <contractName> type <permit>
subject <subject Name>
access-group <access-list> <in/out/both> log

Example:

For example:
apic1# configure
apic1(config)# tenant BDMode1 
apic1(config-tenant)# contract Logicmp type permit
apic1(config-tenant-contract)# subject icmp
apic1(config-tenant-contract-subj)# access-group arp both log

Step 2

To disable the permit logging use the no form of the access-group command; for example, use the no access-group arp both log command.


Enabling ACL Contract Permit Logging Using the REST API

The following example shows you how to enable permit and deny logging using the REST API. This example configures ACL permit and deny logging for a contract with subjects that have Permit and Deny actions configured.

Procedure


For this configuration, send a post with XML similar to the following example:

Example:

<vzBrCP dn="uni/tn-Tenant64/brc-C64" name="C64" scope="context">
    <vzSubj consMatchT="AtleastOne" name="HTTPSsbj" provMatchT="AtleastOne" revFltPorts="yes" rn="subj-HTTPSsbj">
         <vzRsSubjFiltAtt action="permit" directives="log" forceResolve="yes" priorityOverride="default" 
rn="rssubjFiltAtt-PerHTTPS" tDn="uni/tn-Tenant64/flt-PerHTTPS" tRn="flt-PerHTTPS" tnVzFilterName="PerHTTPS"/>
    </vzSubj>
    <vzSubj consMatchT="AtleastOne" name="httpSbj" provMatchT="AtleastOne" revFltPorts="yes" rn="subj-httpSbj">
        <vzRsSubjFiltAtt action="deny" directives="log" forceResolve="yes" priorityOverride="default" 
rn="rssubjFiltAtt-httpFilter" tDn="uni/tn-Tenant64/flt-httpFilter" tRn="flt-httpFilter" tnVzFilterName="httpFilter"/>
    </vzSubj>
    <vzSubj consMatchT="AtleastOne" name="subj64" provMatchT="AtleastOne" revFltPorts="yes" rn="subj-subj64">
        <vzRsSubjFiltAtt action="permit" directives="log" forceResolve="yes" priorityOverride="default" 
rn="rssubjFiltAtt-icmp" tDn="uni/tn-common/flt-icmp" tRn="flt-icmp" tnVzFilterName="icmp"/>
    </vzSubj>
</vzBrCP>

Enabling Taboo Contract Deny Logging Using the GUI

The following steps show how to enable Taboo Contract deny logging using the GUI.

Procedure


Step 1

On the menu bar, choose Tenants > <tenant name>.

Step 2

In the Navigation pane, expand Contracts.

Step 3

Right-click Taboos and choose Create Taboo Contract.

Step 4

In the Create Taboo Contract dialog box, perform the following actions to specify the Taboo contract:

  1. In the Name field, type the name for the contract.

  2. Optional. In the Description field, type a description of the Taboo contract.

  3. Click the + icon to expand Subjects.

Step 5

In the Create Taboo Contract Subject dialog box, perform the following actions:

  1. In the Specify Identity of Subject area, type a name and optional description.

  2. Click the + icon to expand Filters.

  3. From the Name drop-down list, choose one of the default values, such as<tenant_name>/arp, <tenant_name>/default, <tenant_name>/est, <tenant_name>/icmp, choose a previously created filter, orCreate Filter.

Note


If you chose Create Filter, in the Specify Filter Identity Area, perform the following actions to specify criteria for the ACL Deny rule:

  1. Type a name and optional description.

  2. Expand Entries, type a name for the rule, and choose the criteria to define the traffic you want to deny.

  3. In theDirectives drop-down list, choose log.

  4. Click Update.

  5. Click OK.

Step 6

Click Submit.

Logging is enabled for this Taboo contract.

Enabling Taboo Contract Deny Logging Using the NX-OS CLI

The following example shows how to enable Taboo Contract deny logging using the NX-OS CLI.

Procedure


Step 1

To enable logging of packets or flows dropped because of Taboo Contract deny rules, use the following commands:

configure
tenant <tenantName>
contract <contractName> type <deny>
subject <subject Name>
access-group <access-list> <both> log

Example:

For example:
apic1# configure
apic1(config)# tenant BDMode1 
apic1(config-tenant)# contract dropFTP type deny
apic1(config-tenant-contract)# subject dropftp
apic1(config-tenant-contract-subj)# access-group ftp both log

Step 2

To disable the deny logging use the no form of the access-group command; for example, use the no access-group https both log command.


Enabling Taboo Contract Deny Logging Using the REST API

The following example shows you how to enable Taboo Contract deny logging using the REST API.

Procedure


To configure taboo contract deny logging, send a post with XML similar to the following example.

Example:

<vzTaboo dn="uni/tn-Tenant64/taboo-TCtrctPrefix" name="TCtrctPrefix" scope="context">
    <vzTSubj name="PrefSubj" rn="tsubj-PrefSubj"">
        <vzRsDenyRule directives="log" forceResolve="yes" rn="rsdenyRule-default" tCl="vzFilter" 
tDn="uni/tn-common/flt-default" tRn="flt-default"/>
    </vzTSubj>
</vzTaboo>

Viewing ACL Permit and Deny Logs Using the GUI

The following steps show how to view ACL permit and deny logs (if they are enabled) for traffic flows, using the GUI:

Procedure


Step 1

On the menu bar, choose Tenants > <tenant name>.

Step 2

In the Navigation pane, click on Tenant <tenant name>.

Step 3

In the Tenants <tenant name> Work pane, click the Operational tab.

Step 4

Under the Operational tab, click the Flows tab.

Under the Flows tab, click one of the tabs to view log data for Layer 2 permit logs (L2 Permit) Layer 3 permit logs (L3 Permit, Layer 2 deny logs (L2 Drop), or Layer 3 deny logs (L3 Drop). On each tab, you can view ACL logging data, if traffic is flowing. The data points differ according to the log type and ACL rule; for example, the following data points are included for L3 Permit and L3 Deny logs:
  • VRF

  • Alias

  • Source IP address

  • Destination IP address

  • Protocol

  • Source port

  • Destination port

  • Source MAC address

  • Destination MAC address

  • Node

  • Source interface

  • VRF Encap

Note

 
You can also use the Packets tab (next to the Flows tab) to access ACL logs for groups of packets (up to 10) with the same signature, source and destination. You can see what type of packets are being sent and which are being dropped.

Viewing ACL Permit and Deny Logs Using the REST API

The following example shows how to view Layer 2 deny log data for traffic flows, using the REST API. You can send queries using the following MOs:

  • acllogDropL2Flow

  • acllogPermitL2Flow

  • acllogDropL3Flow

  • acllogPermitL3Flow

  • acllogDropL2Pkt

  • acllogPermitL2Pkt

  • acllogDropL3Pkt

  • acllogPermitL3Pkt

Before you begin

You must enable permit or deny logging, before you can view ACL contract permit and deny log data.

Procedure


To view Layer 3 drop log data, send the following query using the REST API:

GET https://apic-ip-address/api/class/acllogDropL3Flow

Example:

The following example shows sample output:

<?xml version="1.0" encoding="UTF-8"?>
<imdata totalCount="2">
    <acllogPermitL3Flow childAction="" dn="topology/pod-1/node-101/ndbgs/acllog/tn-common/ctx-inb
        /permitl3flow-spctag-333-dpctag-444-sepgname-unknown-depgname-unknown-sip-[100:c000:a00:700:b00:0:f00:0]
        -dip-[19.0.2.10]-proto-udp-sport-17459-dport-8721-smac-00:00:15:00:00:28-dmac-00:00:12:00:00:25-sintf-
        [port-channel5]-vrfencap-VXLAN: 2097153" dstEpgName="unknown" dstIp="19.0.2.10" dstMacAddr="00:00:12:00:00:25" 
        dstPcTag="444" dstPort="8721" lcOwn="local" modTs="never" monPolDn="" protocol="udp" srcEpgName="unknown" 
        srcIntf="port-channel5" srcIp="100:c000:a00:700:b00:0:f00:0" srcMacAddr="00:00:15:00:00:28" srcPcTag="333" 
        srcPort="17459" status="" vrfEncap="VXLAN: 2097153"/>
    <acllogPermitL3Flow childAction="" dn="topology/pod-1/node-102/ndbgs/acllog/tn-common/ctx-inb
        /permitl3flow-spctag-333-dpctag-444-sepgname-unknown-depgname-unknown-sip-[100:c000:a00:700:b00:0:f00:0]-dip-
        [19.0.2.10]-proto-udp-sport-17459-dport-8721-smac-00:00:15:00:00:28-dmac-00:00:12:00:00:25-sintf-
        [port-channel5]-vrfencap-VXLAN: 2097153" dstEpgName="unknown" dstIp="19.0.2.10" dstMacAddr="00:00:12:00:00:25" 
        dstPcTag="444" dstPort="8721" lcOwn="local" modTs="never" monPolDn="" protocol="udp" srcEpgName="unknown" 
        srcIntf="port-channel5" srcIp="100:c000:a00:700:b00:0:f00:0" srcMacAddr="00:00:15:00:00:28" srcPcTag="333" 
        srcPort="17459" status="" vrfEncap="VXLAN: 2097153"/>
</imdata>
    

Viewing ACL Permit and Deny Logs Using the NX-OS CLI

The following steps show how to view ACL log details using the NX-OS CLI show acllog command.

The syntax for the Layer 3 command is show acllog {permit | deny} l3 {pkt | flow} tenant <tenant_name> vrf <vrf_name> srcip <source_ip> dstip <destination_ip> srcport <source_port> dstport <destination_port> protocol <protocol> srcintf <source_interface> start-time <startTime> end-time <endTime> detail

The syntax for the Layer 2 command is show acllog {permit | deny} l2 {flow | pkt} tenant <tenant_name> vrf <VRF_name> srcintf <source_interface> vlan <VLAN_number> detail

Procedure


Step 1

The following example shows how to use the show acllog permit l3 pkt tenant <tenant name> vrf <vrf name> [detail] command to display detailed information about the common VRF ACL Layer 3 permit packets that were sent:


apic1# show acllog permit l3 pkt tenant common vrf default detail acllog permit l3 packets detail:
srcIp      : 10.2.0.19
dstIp      : 10.2.0.16
protocol   : udp
srcPort    : 13124
dstPort    : 4386
srcIntf    : port-channel5
vrfEncap   : VXLAN: 2097153
pktLen     : 112
srcMacAddr : 00:00:15:00:00:28
dstMacAddr : 00:00:12:00:00:25
timeStamp  : 2015-03-17T21:31:14.383+00:00

Step 2

The following example shows how to use the show acllog permit l2 pkt tenant <tenant name> vrf <vrf name> srcintf <s interface> command to view information about default VRF Layer 2 packets sent from interface port-channel15:


apic1# show acllog permit l2 pkt tenant common vrf default srcintf port-channel5         
acllog permit L2 Packets 
      Node          srcIntf       pktLen     timeStamp    
 --------------  --------------  --------  -------------- 
                 port-channel5      1      2015-03-17T21: 
                                           31:14.383+00:00      

Using Atomic Counter Policies for Gathering Statistics

Atomic counter policies enable you to gather statistics about your traffic between a combination of endpoints, endpoint groups, external interfaces, and IP addresses. The information gathered enables you to detect drops and misrouting in the fabric, which enables you to perform quick debugging and to isolate application connectivity issues.

Atomic Counters

Atomic Counters are useful for troubleshooting connectivity between endpoints, EPGs, or an application within the fabric. A user reporting application may be experiencing slowness, or atomic counters may be needed for monitoring any traffic loss between two endpoints. One capability provided by atomic counters is the ability to place a trouble ticket into a proactive monitoring mode, for example when the problem is intermittent, and not necessarily happening at the time the operator is actively working the ticket.

Atomic counters can help detect packet loss in the fabric and allow the quick isolation of the source of connectivity issues. Atomic counters require NTP to be enabled on the fabric.

Leaf-to-leaf (TEP to TEP) atomic counters can provide the following:

  • Counts of drops, admits, and excess packets
  • Short-term data collection such as the last 30 seconds, and long-term data collection such as 5 minutes, 15 minutes, or more
  • A breakdown of per-spine traffic (available when the number of TEPs, leaf or VPC, is less than 64)
  • Ongoing monitoring

Leaf-to-leaf (TEP to TEP) atomic counters are cumulative and cannot be cleared. However, because 30 second atomic counters reset at 30 second intervals, they can be used to isolate intermittent or recurring problems.

Tenant atomic counters can provide the following:

  • Application-specific counters for traffic across the fabric, including drops, admits, and excess packets
  • Modes include the following:
  • Endpoint to endpoint MAC address, or endpoint to endpoint IP address. Note that a single target endpoint could have multiple IP addresses associated with it.
  • EPG to EPG with optional drill down
  • EPG to endpoint
  • EPG to * (any)
  • Endpoint to external IP address

Note


Atomic counters track the amount packets of between the two endpoints and use this as a measurement. They do not take into account drops or error counters in a hardware level.


Dropped packets are calculated when there are less packets received by the destination than transmitted by the source.

Excess packets are calculated when there are more packets received by the destination than transmitted by the source.

Atomic Counters Guidelines and Restrictions

  • Use of atomic counters is not supported when the endpoints are in different tenants or in different contexts (VRFs) within the same tenant.

  • In Cisco APIC release 3.1(2m) and later, if no statistics have been generated on a path in the lifetime of the fabric, no atomic counters are generated for the path. Also, the Traffic Map in the Visualization tab (Operations > Visualization in the Cisco APIC GUI) does not show all paths, only the active paths (paths that had traffic at some point in the fabric lifetime).

  • In pure Layer 2 configurations where the IP address is not learned (the IP address is 0.0.0.0), endpoint-to-EPG and EPG-to-endpoint atomic counter policies are not supported. In these cases, endpoint-to-endpoint and EPG-to-EPG policies are supported. External policies are virtual routing and forwarding (VRF)-based, requiring learned IP addresses, and are supported.

  • When the atomic counter source or destination is an endpoint, the endpoint must be dynamic and not static. Unlike a dynamic endpoint (fv:CEp), a static endpoint (fv:StCEp) does not have a child object (fv:RsCEpToPathEp) that is required by the atomic counter.

  • In a transit topology, where leaf switches are not in full mesh with all spine switches, then leaf-to-leaf (TEP to TEP) counters do not work as expected.

  • For leaf-to-leaf (TEP to TEP) atomic counters, once the number of tunnels increases the hardware limit, the system changes the mode from trail mode to path mode and the user is no longer presented with per-spine traffic.

  • The atomic counter does not count spine proxy traffic.

  • Packets dropped before entering the fabric or before being forwarded to a leaf port are ignored by atomic counters.

  • Packets that are switched in the hypervisor (same Port Group and Host) are not counted.

  • Atomic counters require an active fabric Network Time Protocol (NTP) policy.

  • Atomic counters work for IPv6 sources and destinations, but configuring source and destination IP addresses across IPv4 and IPv6 addresses is not allowed.

  • An atomic counter policy configured with fvCEp as the source or destination counts only the traffic that is from/to the MAC and IP addresses that are present in the fvCEp managed objects. If the fvCEp managed object has an empty IP address field, then all traffic to/from that MAC address would be counted regardless of the IP address. If the Cisco APIC has learned multiple IP addresses for an fvCEp, then traffic from only the one IP address in the fvCEp managed object itself is counted as previously stated. To configure an atomic counter policy to or from a specific IP address, use the fvIp managed object as the source or destination.

  • If there is an fvIp behind an fvCEp, you must add fvIP-based policies and not fvCEp-based policies.

  • Endpoint-to-endpoint atomic counter statistics are not reported for Layer 2 bridged traffic with IPv6 headers when the endpoints belong to the same EPG.

  • For atomic counters to work for traffic flowing from an EPG or ESG to an L3Out EPG, configure the L3Out EPG with 0/1 and 128/1 to match all prefixes instead of 0/0.

  • If your Cisco APIC has the traffic map mode set to "trial" and the Cisco APIC generated the F1545 fault, the only way that you can clear this fault is by setting the traffic map mode to "path." To change the traffic map mode, go to Operations > Visualization, click Settings, choose path for Mode, then click Submit. This will give you tunnel stats per port in both ingress and egress.

    The trial mode has a greater chance of reaching the maximum scale index of tunnel logical interfaces. This mode consumes more software and hardware resources. A logical interface is the ID that is associated with the tunnel in the hardware.

    If you have a single tunnel between a tunnel endpoint (TEP) you specified the trail mode, it will consume more hardware resources as well. For example, if you have 6 fabric ports and a single tunnel, then hardware consumes a number of entries equal to the number of tunnels multiplied by the number of fabric ports.

    For software, if the number of logical interfaces allocated is greater than 2048, you will fail to have an entry in the hardware. As a result, you cannot get the stats. In the case of the atomic counter, this issue may show as drops or excesses.

    The path mode has only entries for the TEP. For a vPC, two entries will be installed. Therefore, you have a lower chance of reaching to the maximum limit.

Configuring Atomic Counters

Procedure


Step 1

In the menu bar, click Tenants.

Step 2

In the submenu bar, click the desired tenant.

Step 3

In the Navigation pane, expand the tenant and expand Policies and then expand Troubleshoot.

Step 4

Under Troubleshoot, expand Atomic Counter Policy and choose a traffic topology.

You can measure traffic between a combination of endpoints, endpoint groups, external interfaces, and IP addresses.

Step 5

Right-click the desired topology and choose Add topology Policy to open an Add Policy dialog box.

Step 6

In the Add Policy dialog box, perform the following actions:

  1. In the Name field, enter a name for the policy.

  2. choose or enter the identifying information for the traffic source.

    The required identifying information differs depending on the type of source (endpoint, endpoint group, external interface, or IP address).
  3. choose or enter the identifying information for the traffic destination.

  4. (Optional) (Optional) In the Filters table, click the + icon to specify filtering of the traffic to be counted.

    In the resulting Create Atomic Counter Filter dialog box, you can specify filtering by the IP protocol number (TCP=6, for example) and by source and destination IP port numbers.
  5. Click Submit to save the atomic counter policy.

Step 7

In the Navigation pane, under the selected topology, choose the new atomic counter policy.

The policy configuration is displayed in the Work pane.

Step 8

In the Work pane, click the Operational tab and click the Traffic subtab to view the atomic counter statistics.


Enabling Atomic Counters

To enable using atomic counters to detect drops and misrouting in the fabric and enable quick debugging and isolation of application connectivity issues, create one or more tenant atomic counter policies, which can be one of the following types:

  • EP_to_EP—Endpoint to endpoint (dbgacEpToEp)

  • EP_to_EPG—Endpoint to endpoint group (dbgacEpToEpg)

  • EP_to_Ext—Endpoint to external IP address (dbgacEpToExt)

  • EPG_to_EP—Endpoint group to endpoint(dbgacEpgToEp)

  • EPG_to_EPG—Endpoint group to endpoing group (dbgacEpgToEpg)

  • EPG_to_IP—Endpoint group to IP address (dbgacEpgToIp)

  • Ext_to_EP—External IP address to endpoint (dbgacExtToEp)

  • IP_to_EPG—IP address to endpoint group (dbgacIpToEpg)

  • Any_to_EP—Any to endpoint (dbgacAnyToEp)

  • EP_to_Any—Endpoint to any (dbgacEpToAny)

Procedure


Step 1

To create an EP_to_EP policy using the REST API, use XML such as the following example:

Example:

<dbgacEpToEp name="EP_to_EP_Policy" ownerTag="" ownerKey="" 
dn="uni/tn-Tenant64/acEpToEp-EP_to_EP_Policy" descr="" adminSt="enabled">
<dbgacFilter name="EP_to_EP_Filter" ownerTag="" ownerKey="" descr="" 
srcPort="https" prot="tcp" dstPort="https"/>
</dbgacEpToEp>

Step 2

To create an EP_to_EPG policy using the REST API, use XML such as the following example:

Example:

<dbgacEpToEpg name="EP_to_EPG_Pol" ownerTag="" ownerKey="" 
dn="uni/tn-Tenant64/epToEpg-EP_to_EPG_Pol" descr="" adminSt="enabled">
<dbgacFilter name="EP_to_EPG_Filter" ownerTag="" ownerKey="" descr="" 
srcPort="http" prot="tcp" dstPort="http"/>
<dbgacRsToAbsEpg tDn="uni/tn-Tenant64/ap-VRF64_app_prof/epg-EPG64"/>
</dbgacEpToEpg>

Troubleshooting Using Atomic Counters with the REST API

Procedure


Step 1

To get a list of the endpoint-to-endpoint atomic counters deployed within the fabric and the associated details such as dropped packet statistics and packet counts, use the dbgEpToEpTsIt class in XML such as the following example:

Example:

https://apic-ip-address/api/node/class/dbgEpToEpRslt.xml 

Step 2

To get a list of external IP-to-endpoint atomic counters and the associated details, use the dbgacExtToEp class in XML such as the following example:

Example:

https://apic-ip-address/api/node/class/dbgExtToEpRslt.xml 

Enabling and Viewing Digital Optical Monitoring Statistics

Real-time digital optical monitoring (DOM) data is collected from SFPs, SFP+, and XFPs periodically and compared with warning and alarm threshold table values. The DOM data collected are transceiver transmit bias current, transceiver transmit power, transceiver receive power, and transceiver power supply voltage.

Enabling Digital Optical Monitoring Using the GUI

Before you can view digital optical monitoring (DOM) statistics about a physical interface, enable DOM on the leaf or spine interface, using a switch policy, associated to a policy group.

To enable DOM using the GUI:

Procedure


Step 1

On the menu bar, choose Fabric > Fabric Policies.

Step 2

In the Navigation pane, expand Policies > Monitoring > Fabric Node Controls.

Step 3

Expand Fabric Node Controls to see a list of existing policies.

Step 4

In the Work pane, click the ACTIONS drop-down menu and select Create Fabric Node Control.

The Create Fabric Node Control dialog box appears.

Step 5

In the Create Fabric Node Control dialog box, perform the following actions:

  1. In the Name field, enter a name for the policy.

  2. Optional. In the Description field, enter a description of the policy.

  3. Put a check in the box next to Enable DOM.

Step 6

Click Submit to create the policy.

Now you can associate this policy to a policy group and a profile, as described in the following steps.

Step 7

In the Navigation pane, expand Switch Policies > Policy Groups.

Step 8

In the Work pane, click the ACTIONS drop-down menu and select Create Leaf Switch Policy Group (for a spine, Create Spine Switch Policy Group.

The Create Leaf Switch Policy Group or Create Spine Switch Policy Group dialog box appears.

Step 9

In the dialog box, perform the following actions:

  1. In the Name field, enter a name for the policy group.

  2. From the Node Control Policy drop-down menu, choose either an existing policy (such as the one you just created) or a new one by selecting Create Fabric Node Control.

  3. Click Submit.

Step 10

Attach the policy group you created to a switch as follows:

  1. In the Navigation pane, expand Switch Policies > Profiles.

  2. In the Work pane, click the ACTIONS drop-down menu and select Create Leaf Switch Profile or Create Spine Switch Profile, as appropriate.

  3. In the dialog box, enter a name for the profile in the Name field.

  4. Add the name of the switch you want associated with the profile under Switch Associations.

  5. From the Blocks pull-down menu, check the boxes next to the applicable switches.

  6. From the Policy Group pull-down menu, select the policy group you created earlier.

  7. Click UPDATE, then click Submit.


Enabling Digital Optical Monitoring Using the REST API

Before you can view digital optical monitoring (DOM) statistics about a physical interface, enable DOM on the interface.

To enable DOM using the REST API:

Procedure


Step 1

Create a fabric node control policy (fabricNodeControlPolicy) as in the following example:

<fabricNodeControl dn="uni/fabric/nodecontrol-testdom" name="testdom" control="1" 
rn="nodecontrol-testdom" status="created" />

Step 2

Associate a fabric node control policy to a policy group as follows:


<?xml version="1.0" encoding="UTF-8" ?>
	<fabricLeNodePGrp dn="uni/fabric/funcprof/lenodepgrp-nodegrp2" name="nodegrp2" 
rn="lenodepgrp-nodegrp2" status="created,modified" >

    <fabricRsMonInstFabricPol tnMonFabricPolName="default" status="created,modified" />
    <fabricRsNodeCtrl tnFabricNodeControlName="testdom" status="created,modified" />
    
</fabricLeNodePGrp>

Step 3

Associate a policy group to a switch (in the following example, the switch is 103) as follows:


<?xml version="1.0" encoding="UTF-8" ?>
	<fabricLeafP>
		<attributes>
			<dn>uni/fabric/leprof-leafSwitchProfile</dn>
			<name>leafSwitchProfile</name>
			<rn>leprof-leafSwitchProfile</rn>
			<status>created,modified</status>
		</attributes>
		<children>
			<fabricLeafS>
				<attributes>
					<dn>uni/fabric/leprof-leafSwitchProfile/leaves-test-typ-range</dn>
					<type>range</type>
					<name>test</name>
					<rn>leaves-test-typ-range</rn>
					<status>created,modified</status>
				</attributes>
				<children>
					<fabricNodeBlk>
						<attributes>
							<dn>uni/fabric/leprof-leafSwitchProfile/leaves-test-typ-range/nodeblk-09533c1d228097da</dn>
							<from_>103</from_>
							<to_>103</to_>
							<name>09533c1d228097da</name>
							<rn>nodeblk-09533c1d228097da</rn>
							<status>created,modified</status>
						</attributes>
					</fabricNodeBlk>
				</children>
				<children>
					<fabricRsLeNodePGrp>
						<attributes>
							<tDn>uni/fabric/funcprof/lenodepgrp-nodegrp2</tDn>
							<status>created</status>
						</attributes>
					</fabricRsLeNodePGrp>
				</children>
			</fabricLeafS>
		</children>
	</fabricLeafP>

Viewing Digital Optical Monitoring Statistics With the GUI

To view DOM statistics using the GUI:

Before you begin

You must have previously enabled digital optical monitoring (DOM) statistics for an interface, before you can view the DOM statistics for it.

Procedure


Step 1

In the Menu bar, choose Fabric and Inventory.

Step 2

In the Navigation pane, expand the Pod and Leaf node where the physical interface you are investigating is located.

Step 3

Expand Interfaces.

Step 4

Expand Physical Interfaces.

Step 5

Expand the physical interface you are investigating.

Step 6

Choose DOM Stats.

DOM statitistics are displayed for the interface.

Troubleshooting Using Digital Optical Monitoring With the REST API

To view DOM statistics using an XML REST API query:

Before you begin

You must have previously enabled digital optical monitoring (DOM) on an interface, before you can view the DOM statistics for it.

Procedure


The following example shows how to view DOM statistics on a physical interface, eth1/25 on node-104, using a REST API query:

GET https://apic-ip-address/api/node/mo/topology/pod-1/node-104/sys/phys-[eth1/25]/phys/domstats.xml?
query-target=children&target-subtree-class=ethpmDOMRxPwrStats&subscription=yes
The following response is returned:

response : {
   "totalCount":"1",
      "subscriptionId":"72057611234705430",
          "imdata":[
{"ethpmDOMRxPwrStats":{
   "attributes":{
      "alert":"none",
      "childAction":"",
      "dn":"topology/pod-1/node-104/sys/phys[eth1/25]/phys/domstats/rxpower",
      "hiAlarm":"0.158490",
      "hiWarn":"0.079430",
      "loAlarm":"0.001050",
      "loWarn":"0.002630",
      "modTs":"never",
      "status":"",
       "value":"0.139170"}}}]}

Viewing and Understanding Health Scores

The APIC uses a policy model to combine data into a health score. Health scores can be aggregated for a variety of areas such as for infrastructure, applications, or services. The health scores enable you to isolate performance issues by drilling down through the network hierarchy to isolate faults to specific managed objects (MOs). You can view network health by viewing the health of an application (by tenant) or by the health of a leaf switch (by pod).

For more information about health scores, faults, and health score calculation see the Cisco APIC Fundamentals Guide.

Health Score Types

The APIC supports the following health score types:

  • System—Summarizes the health of the entire network.

  • Leaf—Summarizes the health of leaf switches in the network. Leaf health includes hardware health of the switch including fan tray, power supply, and CPU.

  • Tenant—Summarizes the health of a tenant and the tenant’s applications.

Filtering by Health Score

You can filter health scores using the following tools:

  • Health Scroll Bar—You can use the health scroll bar to dictate which objects are visible; lowering the score allows you to see only objects with a degraded health score.
  • Displaying Degraded Health Scores—To display only the degraded health scores, click the Gear icon and choose Show only degraded health score.

Viewing Tenant Health

To view application health, click Tenants > tenant-name in the menu bar, then click the tenant name in the Navigation pane. The GUI displays a summary of the tenant's health including applications and EPGs. To drill down on the tenant configuration, double-click the health score.

For a health summary, click the Health tab in the Work pane. This view of the network displays health scores and relationships between MOs in the network so that you can isolate and resolve performance issues. For example, a common sequence of managed objects in the tenant context is Tenant> Application profile > Application EPG > EPP > Fabric location > EPG to Path Attachment > Network Path Endpoint > Aggregation Interface > Aggregated Interface > Aggregated Member Interface.

Viewing Fabric Health

To view fabric health, click Fabric in the menu bar. In the navigation pane, choose a pod. The GUI displays a summary of the pod health including nodes. To drill down on part of the fabric configuration, double-click the health score.

For a health summary, click the Health tab in the work pane. This view of the network displays health scores and relationships between MOs in the network so that you can isolate and resolve performance issues. For example, a common sequence of managed objects in the fabric context is Pod > Leaf> Chassis> Fan tray slot> Line module slot > Line module > Fabric Port > Layer 1 Physical Interface Configuration > Physical Interface Runtime State.


Note


Fabric issues, such as physical network problems, can impact tenant performance when MOs are directly related.


Viewing MO Health in Visore

To view the health of an MO in Visore, click the H icon.

Use the following MOs to display health information:

  • health:Inst

  • health:NodeInst

  • observer:Node

  • observer:Pod

For more information about Visore, see the Cisco Application Centric Infrastructure Fundamentals guide.

Debugging Health Scores Using Logs

You can use the following log files to debug health scores on the APIC:

  • svc_ifc_eventmgr.log

  • svc_ifc_observer.log

Check the following items when debugging health scores using logs:

  • Verify the source of the syslog (fault or event).

  • Check whether a syslog policy is configured on the APIC.

  • Check whether the syslog policy type and severity is set correctly.

  • You can specify a syslog destination of console, file, RemoteDest, or Prof. ForRemoteDest, ensure that the syslog server is running and reachable.

Viewing Faults

The steps below explain where to view fault information.

Procedure


Step 1

Go to a faults window:

  • System Faults—From the menu bar, click System > Faults.

  • Tenant Faults—From the menu bar:

    1. Click Tenants > tenant-name.

    2. From the Navigation pane, click the Tenants tenant name.

    3. From the Work pane, click the Faults tab.

  • Fabric Faults—From the menu bar:

    1. Click Fabric > Inventory.

    2. From the Navigation pane, click on a Pod

    3. From the Work pane, click the Faults tab.

A list of faults appears in a summary table.

Step 2

Double-click on a fault.

The fabric and system tables change to display faults that match the fault code of the fault you clicked on.

  1. From the fabric or system faults, double-click on a fault in the summary table to view more information.

The Fault Properties dialog appears displaying the following tabs:
  • General—Displays the following:

    • Properties—Contains information found in the summary table

    • Details—Contains fault information found in the summary table, the number of occurences, the change set, and the original, previous, and highest severity level for the chosen fault.

  • Troubleshooting—Displays the following:

    • Troubleshooting—Contains troubleshooting information that includes an explanation of the fault and the recommended action.

    • Audit log—A tool that enables you to view the history of user-initiated events before the fault occurred. The history is displayed in a list by a specified number of minutes. You can adjust the number of minutes by clicking the drop-down arrow.

  • History—Displays history information of the affected object


Enabling Port Tracking for Uplink Failure Detection

This section explains how to enable port tracking using the GUI, NX-OS CLI, and the REST API.

Port Tracking Policy for Fabric Port Failure Detection

Fabric port failure detection can be enabled in the fabric access global port tracking policy. The port tracking policy monitors the status of fabric ports between leaf switches and spine switches, and ports between tier-1 leaf switches and tier-2 leaf. When an enabled port tracking policy is triggered, the leaf switches take down all access interfaces on the switch that have EPGs deployed on them.


Note


Port tracking is located under Fabric > External Access Policies > Policies > Global > Port Tracking.


The port tracking policy specifies the number of fabric port connections that trigger the policy, and a delay timer for bringing the leaf switch access ports back up after the number of specified fabric ports is exceeded.

The following example illustrates how a port tracking policy behaves:

  • The port tracking policy specifies that the threshold of active fabric port connections each leaf switch that triggers the policy is 2.

  • The port tracking policy triggers when the number of active fabric port connections from the leaf switch to the spine switches drops to 2.

  • Each leaf switch monitors its fabric port connections and triggers the port tracking policy according to the threshold specified in the policy.

  • When the fabric port connections come back up, the leaf switch waits for the delay timer to expire before bringing its access ports back up. This gives the fabric time to reconverge before allowing traffic to resume on leaf switch access ports. Large fabrics may need the delay timer to be set for a longer time.


Note


Use caution when configuring this policy. If the port tracking setting for the number of active spine ports that triggers port tracking is too high, all leaf switch access ports will be brought down.


Port Tracking Using the GUI

This procedure explains how to use the Port Tracking feature using the GUI.

Procedure


Step 1

From the Fabric menu, select External Access Policies.

Step 2

In the navigation pane, expand Policies > Global Polices.

Step 3

Click Port Tracking.

Step 4

Turn on the Port Tracking feature by selecting on next to Port tracking state.

Step 5

Turn off the Port Tracking feature by selecting off next to Port tracking state under Properties.

Step 6

(Optional) Reset the Delay restore timer from the default (120 seconds).

Step 7

Enter the maximum number of active spine links (any configuration value from 0 - 12) that are up before port tracking is triggered.

Step 8

Click Submit to push your desired Port Tracking configuration to all switches on the fabric.


Port Tracking Using the NX-OS CLI

This procedure explains how to use the Port Tracking feature using the NX-OS CLI.

Procedure


Step 1

Turn on the Port Tracking feature as follows:

Example:

apic1# show porttrack 
Configuration
Admin State                  : on
Bringup Delay(s)             : 120
Bringdown # Fabric Links up  : 0

Step 2

Turn off the Port Tracking feature as follows:

Example:

apic1# show porttrack 
Configuration
Admin State                  : off
Bringup Delay(s)             : 120
Bringdown # Fabric Links up  : 0

Port Tracking Using the REST API

Before you begin

This procedure explains how to use the Port Tracking feature using the REST API.

Procedure


Step 1

Turn on the Port Tracking feature using the REST API as follows (admin state: on):

<polUni>
<infraInfra dn="uni/infra">
<infraPortTrackPol name="default" delay="5" minlinks="4" adminSt="on">

</infraPortTrackPol>
</infraInfra>
</polUni>

Step 2

Turn off the Port Tracking feature using the REST API as follows (admin state: off):

<polUni>
<infraInfra dn="uni/infra">
<infraPortTrackPol name="default" delay="5" minlinks="4" adminSt=“off">

</infraPortTrackPol>
</infraInfra>
</polUni>

Configuring SNMP for Monitoring and Managing Devices

This section explains how to configure SNMP using the GUI.

About SNMP

The Cisco Application Centric Infrastructure (ACI) provides extensive SNMPv1, v2, and v3 support, including Management Information Bases (MIBs) and notifications (traps). The SNMP standard allows any third-party applications that support the different MIBs to manage and monitor the ACI fabric.

SNMPv3 provides extended security. Each SNMPv3 device can be selectively enabled or disabled for SNMP service. In addition, each device can be configured with a method of handling SNMPv1 and v2 requests.

For more information about using SNMP, see the Cisco ACI MIB Quick Reference.

SNMP Access Support in Cisco ACI


Note


For the complete list of MIBs supported in Cisco Application Centric Infrastructure (ACI), see http://www.cisco.com/c/en/us/td/docs/switches/datacenter/aci/apic/sw/1-x/mib/list/mib-support.html.


SNMP support in Cisco ACI is as follows:

  • SNMP read queries (Get, Next, Bulk, Walk) are supported by leaf and spine switches and by the Cisco Application Policy Infrastructure Controller (APIC).

  • SNMP write commands (Set) are not supported by leaf and spine switches or by the Cisco APIC.

  • SNMP traps (v1, v2c, and v3) are supported by leaf and spine switches and by the Cisco APIC.


    Note


    Cisco ACI supports a maximum of 10 trap receivers.


  • SNMPv3 is supported by leaf and spine switches and by the Cisco APIC.

  • SNMP using a Cisco APIC IPv6 address is not supported.

Table 1. SNMP Support Changes by Cisco APIC Release
Release

Description

1.2(2)

IPv6 support is added for SNMP trap destinations.

1.2(1)

SNMP support for the Cisco APIC controller is added. Previous releases support SNMP only for leaf and spine switches.

Configuring the SNMP Policy Using the GUI

This procedure configures and enables the SNMP policy on ACI switches.

Before you begin

To allow SNMP communications, you must configure the following:

  • Configure an out-of-band contract allowing SNMP traffic. SNMP traffic typically uses UDP port 161 for SNMP requests.

  • Configure the APIC out-of-band IP addresses in the 'mgmt' tenant. Although the out-of-band addresses are configured during APIC setup, the addresses must be explicitly configured in the 'mgmt' tenant before the out-of-band contract will take effect.

Procedure


Step 1

In the menu bar, click Fabric.

Step 2

In the submenu bar, click Fabric Policies.

Step 3

In the Navigation pane, expand Pod Policies.

Step 4

Under Pod Policies, expand Policies.

Step 5

Right-click SNMP and choose Create SNMP Policy.

As an alternative to creating a new SNMP policy, you can edit the default policy fields in the same manner as described in the following steps.

Step 6

In the SNMP policy dialog box, perform the following actions:

  1. In the Name field, enter an SNMP policy name.

  2. In the Admin State field, select Enabled.

  3. (Optional) In the SNMP v3 Users table, click the + icon, enter a Name, enter the user's authentication data, and click Update.

    This step is needed only if SNMPv3 access is required.

  4. In the Community Policies table, click the + icon, enter a Name, and click Update.

    The community policy name can be a maximum of 32 characters in length. The name can contain only letters, numbers and the special characters of underscore (_), hyphen (-), or period (.). The name cannot contain the @ symbol.

  5. In the Trap Forward Servers table, click the + icon, enter the IP Address of the external server and click Update.

Step 7

To configure allowed SNMP management stations, perform the following actions in the SNMP policy dialog box:

  1. In the Client Group Policies table, click the + icon to open the Create SNMP Client Group Profile dialog box.

  2. In the Name field, enter an SNMP client group profile name.

  3. From the Associated Management EPG drop-down list, choose the management EPG.

  4. In the Client Entries table, click the + icon.

  5. Enter a client's name in the Name field, enter the client's IP address in the Address field, and click Update.

    Note


    When an SNMP management station connects with APIC using SNMPv3, APIC does not enforce the client IP address specified in the SNMP client group profile. For SNMPv3, the management station must exist in the Client Entries list, but the IP address need not match, as the SNMPv3 credentials alone are sufficient for access.

Step 8

Click OK.

Step 9

Click Submit.

Step 10

Under Pod Policies, expand Policy Groups and choose a policy group or right-click Policy Groups and choose Create POD Policy Group.

You can create a new pod policy group or you can use an existing group. The pod policy group can contain other pod policies in addition to the SNMP policy.

Step 11

In the pod policy group dialog box, perform the following actions:

  1. In the Name field, enter a pod policy group name.

  2. From the SNMP Policy drop-down list, choose the SNMP policy that you configured and click Submit.

Step 12

Under Pod Policies, expand Profiles and click default.

Step 13

In the Work pane, from the Fabric Policy Group drop-down list, choose the pod policy group that you created.

Step 14

Click Submit.

Step 15

Click OK.


Configuring an SNMP Trap Destination Using the GUI

This procedure configures the host information for an SNMP manager that will receive SNMP trap notifications.


Note


ACI supports a maximum of 10 trap receivers. If you configure more than 10, some will not receive notifications.


Procedure


Step 1

In the menu bar, click Admin.

Step 2

In the submenu bar, click External Data Collectors.

Step 3

In the Navigation pane, expand Monitoring Destinations.

Step 4

Right-click SNMP and choose Create SNMP Monitoring Destination Group.

Step 5

In the Create SNMP Monitoring Destination Group dialog box, perform the following actions:

  1. In the Name field, enter an SNMP destination name and click Next.

  2. In the Create Destinations table, click the + icon to open the Create SNMP Trap Destination dialog box.

  3. In the Host Name/IP field, enter an IPv4 or IPv6 address or a fully qualified domain name for the destination host.

  4. Choose the Port number and SNMP Version for the destination.

  5. For SNMP v1 or v2c destinations, enter one of the configured community names as the Security Name and choose noauth as v3 Security Level.

    An SNMP v1 or v2c security name can be a maximum of 32 characters in length. The name can contain only letters, numbers and the special characters of underscore (_), hyphen (-), or period (.). The name cannot contain the @ symbol.

  6. For SNMP v3 destinations, enter one of the configured SNMP v3 user names as Security Name and choose the desired v3 Security Level.

    An SNMP v3 security name can be a maximum of 32 characters in length. The name must begin with an uppercase or lowercase letter, and can contain only letters, numbers, and the special characters of underscore (_), hyphen (-), period (.), or the @ symbol.

  7. From the Management EPG drop-down list, choose the management EPG.

  8. Click OK.

  9. Click Finish.


Configuring an SNMP Trap Source Using the GUI

This procedure selects and enables a source object within the fabric to generate SNMP trap notifications.

Procedure


Step 1

In the menu bar, click Fabric.

Step 2

In the submenu bar, click Fabric Policies.

Step 3

In the Navigation pane, expand Monitoring Policies.

You can create an SNMP source in the Common Policy, the default policy, or you can create a new monitoring policy.

Step 4

Expand the desired monitoring policy and choose Callhome/SNMP/Syslog.

If you chose the Common Policy, right-click Common Policy, choose Create SNMP Source, and follow the instructions below for that dialog box.

Step 5

In the Work pane, from the Monitoring Object drop-down list, choose ALL.

Step 6

From the Source Type drop-down list, choose SNMP.

Step 7

In the table, click the + icon to open the Create SNMP Source dialog box.

Step 8

In the Create SNMP Source dialog box, perform the following actions:

  1. In the Name field, enter an SNMP policy name.

  2. From the Dest Group drop-down list, choose an existing destination for sending notifications or choose Create SNMP Monitoring Destination Group to create a new destination.

    The steps for creating an SNMP destination group are described in a separate procedure.
  3. Click Submit.


Monitoring the System Using SNMP

You can remotely monitor individual hosts (APIC or another host) and find out the state of any particular node.

You can check the system's CPU and memory usage using SNMP to find out if the CPU is spiking or not. The SNMP, a network management system, uses an SNMP client and accesses information over the APIC and retrieves information back from it.

You can remotely access the system to figure out if the information is in the context of the network management system and you can learn whether or not it is taking too much CPU or memory, or if there are any system or performance issues. Once you learn the source of the issue, you can check the system health and verify whether or not it is using too much memory or CPU.

Refer to the Cisco ACI MIB Quick Reference Manual for additional information.

Configuring SPAN for Traffic Monitoring

This section lists the SPAN guidelines and restrictions and explains how to configure SPAN sessions.

About SPAN

You can use the Switched Port Analyzer (SPAN) utility to perform detailed troubleshooting or to take a sample of traffic from a particular application host for proactive monitoring and analysis.

SPAN copies traffic from one or more ports, VLANs, or endpoint groups (EPGs) and sends the copied traffic to one or more destinations for analysis by a network analyzer. The process is nondisruptive to any connected devices and is facilitated in the hardware, which prevents any unnecessary CPU load.

You can configure SPAN sessions to monitor traffic received by the source (ingress traffic), traffic transmitted from the source (egress traffic), or both. By default, SPAN monitors all traffic, but you can configure filters to monitor only selected traffic.

Multinode SPAN

APIC traffic monitoring policies can SPAN policies at the appropriate places to track members of each application group and where they are connected. If any member moves, APIC automatically pushes the policy to the new leaf switch. For example, when an endpoint VMotions to a new leaf switch, the SPAN configuration automatically adjusts.

SPAN Guidelines and Restrictions

  • A uSeg EPG cannot be used as a SPAN source EPG because the SPAN source filter is based on the VLAN ID. Thus, even if an endpoint is classified to a uSeg EPG, traffic from the endpoint is mirrored if its VLAN is the VLAN of the SPAN source EPG.

  • You cannot specify an l3extLIfP Layer 3 subinterface as a SPAN source. You must use the entire port for monitoring traffic from external sources.

  • In local SPAN for FEX interfaces, the FEX interfaces can only be used as SPAN sources, not SPAN destinations.

    • On Generation 1 switches (Cisco Nexus 9000 Series switches without EX or FX on the switch name), Tx SPAN does not work for any Layer 3 switched traffic.

    • On Generation 2 switches (with EX or FX on the switch name), Tx SPAN does not work whether traffic is Layer 2 or Layer 3 switched.

    There are no limitations for Rx SPAN.

  • For SPAN of FEX fabric port channel (NIF), the member interfaces are supported as SPAN source interfaces on Generation 1 leaf switches (Cisco Nexus 9000 Series switches without EX or FX on the switch name).


    Note


    While it is also possible to configure FEX fabric port channel (NIF) member interfaces as SPAN source interfaces on Generation 2 switches (Cisco Nexus 9000 Series switches with EX or FX on the switch name) for releases prior to Cisco Application Policy Infrastructure Controller (APIC) release 4.1, this is not supported.


  • The type of SPAN supported varies:

    • For Generation 1 switches, tenant and access SPAN use the encapsulated remote extension of SPAN (ERSPAN) type I (Version 1 option in the Cisco APIC GUI). Generation 1 switches can be identified by the lack of "EX", "FX", or "FX2" at the end of the switch name (for example, N9K-9312TX).

    • For Generation 2 switches, tenant and access SPAN use the encapsulated remote extension of SPAN (ERSPAN) type II (Version 2 option in the Cisco APIC GUI). Generation 2 switches can be identified with "EX", "FX", or "FX2" at the end of the switch name.

    • Fabric SPAN uses ERSPAN type II.

    For information regarding ERSPAN headers, refer to the IETF Internet Draft at this URL: https://tools.ietf.org/html/draft-foschiano-erspan-00.

  • ERSPAN destination IPs must be learned in the fabric as an endpoint.

  • SPAN supports IPv6 traffic but the destination IP for the ERSPAN cannot be an IPv6 address.

  • When configuring ERSPAN session, if the SPAN source contains a destination and interfaces from a spine switch within a GOLF VRF instance, an L3Out prefix is sent to the GOLF router with the wrong BGP next-hop, breaking connectivity from GOLF to that L3Out.

  • See the Verified Scalability Guide for Cisco ACI document for SPAN-related limits, such as the maximum number of active SPAN sessions.

  • With MAC pinning configured in the LACP policy for a PC or vPC, the PC member ports will be placed in the individual port mode and the PC is operationally non-existent. Hence, a SPAN source configuration with such a PC will fail, resulting in the generation of the "No operational src/dst" fault. With the MAC pinning mode configured, SPAN can be configured only on individual ports.

  • A packet that is received on a Cisco Application Centric Infrastructure (ACI) leaf switch will be spanned only once, even if span sessions are configured on both the ingress and egress interfaces.

  • When you use a routed outside SPAN source filter, you see only unicast in the Tx direction. In the Rx direction, you can see unicast, broadcast, and multicast.

  • An L3Out filter is not supported for transmit multicast SPAN. An L3Out is represented as a combination of sclass/dclass in the ingress ACL filters and can therefore match unicast traffic only. Transmit multicast traffic can be spanned only on ports and port channels.

  • You can use a port channel interface as a SPAN destination only on -EX and later switches.

  • The local SPAN destination port of a leaf switch does not expect incoming traffic. You can ensure that the switch drops incoming SPAN destination port traffic by configuring a Layer 2 interface policy and setting the VLAN Scope property to Port Local scope instead of Global scope. Apply this policy to the SPAN destination ports. You can configure an Layer 2 interface policy by going to the following location in the GUI: Fabric > Access Policies > Policies > Interface > L2 Interface.

  • When you configure SPAN for a given packet, SPAN is supported for the packet only once. If traffic is selected by SPAN in Rx for the first SSN, the traffic will not selected by SPAN again in Tx for a second SSN. Thus, when the SPAN session ingress and egress port sits on a single switch, the SPAN session capture will be one-way only. The SPAN session cannot display two-way traffic.

  • A SPAN ACL filter configured in the filter group does not filter the broadcast, unknown-unicast and multicast (BUM) traffic that egresses the access interface. A SPAN ACL in the egress direction works only for unicast IPv4 or IPv6 traffic.

  • When configuring a SPAN destination as a local port, EPGs cannot be deployed to that interface.

  • In a leaf switch, a SPAN source with a VRF filter will match all regular bridge domains and all Layer 3 SVIs under the VRF instance.

  • In a spine switch, a SPAN source with a VRF matches only the configured VRF VNID traffic and a bridge domain filter will match only the bridge domain VNID traffic.

Configuring a SPAN Session

This procedure shows how to configure a SPAN policy to forward replicated source packets to a remote traffic analyzer.

Procedure


Step 1

In the menu bar, click Tenants.

Step 2

In the submenu bar, click the tenant that contains the source endpoint.

Step 3

In the Navigation pane, expand the tenant, expand Policies > Troubleshoot, and expand SPAN.

Step 4

Under SPAN, right-click SPAN Destination Groups and choose Create SPAN Destination Group.

The Create SPAN Destination Group dialog appears.

Step 5

Enter the appropriate values in the required fields of the Create SPAN Destination Group dialog box then click OK and Submit.

Note


For a description of a field, click the information icon (i) at the top-right corner of the dialog box to display the help file.

Step 6

Under SPAN, right-click SPAN Source Groups and choose Create SPAN Source Group.

The Create SPAN Source Group dialog appears.

Step 7

Enter the appropriate values in the required fields of the Create SPAN Source Group dialog box then click OK and Submit.

Note


For a description of a field, click the information icon (i) at the top-right corner of the dialog box to display the help file.


What to do next

Using a traffic analyzer at the SPAN destination, you can observe the data packets from the SPAN source EPG to verify the packet format, addresses, protocols, and other information.

Configuring an Layer 3 EPG SPAN Session for External Access Using the APIC GUI

This procedure shows how to configure a SPAN policy for external access.

Procedure


Step 1

In the menu bar, click on Fabric and in the submenu bar click on External Access Policies.

Step 2

In the Navigation pane, expand Policies > Troubleshooting, and expand SPAN.

Step 3

Under SPAN, right-click SPAN Source Groups and choose Create SPAN Source Group.

The Create SPAN Source Group dialog appears.

Step 4

Enter the appropriate values in the required fields of the Create SPAN Source Group dialog box.

Step 5

Expand the Create Sources table to open the Create SPAN Source dialog box and perform the following actions:

  1. Enter a Name for the source policy and Direction for the traffic flow.

  2. For external access, select the Routed Outside in the Type field and click OK and Submit.

    Note


    If Routed Outside is selected for external access, then the Name, Address, and Encap fields appear to configure the L3 Outside.


What to do next

Configure a SPAN Destination Group.

Configuring SPAN Using the NX-OS Style CLI

Configuring Local SPAN in Access Mode

This is the traditional SPAN configuration local to an Access leaf node. Traffic originating from one or more access ports or port-channels can be monitored and sent to a destination port local to the same leaf node.

Procedure

  Command or Action Purpose

Step 1

configure

Example:

apic1# configure

Enters global configuration mode.

Step 2

[no] monitor access session session-name

Example:

apic1(config)# monitor access session mySession

Creates an access monitoring session configuration.

Step 3

[no] description text

Example:

apic1(config-monitor-access)# description "This is my SPAN session"

Adds a description for this access monitoring session. If the text includes spaces, it must be enclosed in single quotes.

Step 4

[no] destination interface ethernet slot/port leaf node-id

Example:

apic1(config-monitor-access)# destination interface eth 1/2 leaf 101

Specifies the destination interface. The destination interface cannot be a FEX port or port-channel.

Step 5

[no] source interface ethernet { [fex/] slot/port | port-range} leaf node-id

Example:

apic1(config-monitor-access)# source interface eth 1/2 leaf 101

Specifies the source interface port or port range.

Step 6

[no] direction {rx | tx | both}

Example:

apic1(config-monitor-access-source)# direction tx

Specifies direction of traffic to be monitored. The direction can be configured independently for each source port range.

Step 7

[no] filter tenant tenant-name application application-name epg epg-name

Example:

apic1(config-monitor-access-source)# filter tenant t1 application app1 epg epg1

Filters traffic to be monitored. The filter can be configured independently for each source port range.

Step 8

exit

Example:

apic1(config-monitor-access-source)# exit

Returns to access monitor session configuration mode.

Step 9

[no] source interface port-channel port-channel-name-list leaf node-id [fex fex-id]

Example:

apic1(config-monitor-access)# source interface port-channel pc5 leaf 101

Specifies the source interface port channel.

(Enters the traffic direction and filter configuration, not shown here.)

Step 10

[no] shutdown

Example:

apic1(config-monitor-access)# no shut

Disables (or enables) the monitoring session.

Examples

This example shows how to configure a local access monitoring session.


apic1# configure terminal 
apic1(config)# monitor access session mySession
apic1(config-monitor-access)# description "This is my SPAN session"
apic1(config-monitor-access)# destination interface eth 1/2 leaf 101
apic1(config-monitor-access)# source interface eth 1/1 leaf 101
apic1(config-monitor-access-source)# direction tx
apic1(config-monitor-access-source)# filter tenant t1 application app1 epg epg1
apic1(config-monitor-access-source)# exit
apic1(config-monitor-access)# no shut
apic1(config-monitor-access)# show run
# Command: show running-config monitor access session mySession
# Time: Fri Nov 6 23:55:35 2015
  monitor access session mySession
    description "This is my SPAN session"
    destination interface eth 1/2 leaf 101
    source interface eth 1/1 leaf 101
      direction tx
      filter tenant t1 application app1 epg epg
      exit
    exit

Configuring ERSPAN in Access Mode

In the ACI fabric, an access mode ERSPAN configuration can be used for monitoring traffic originating from access ports, port-channels, and vPCs in one or more leaf nodes.

For an ERSPAN session, the destination is always an endpoint group (EPG) which can be deployed anywhere in the fabric. The monitored traffic is forwarded to the destination wherever the EPG is moved.

Procedure

  Command or Action Purpose

Step 1

configure

Example:

apic1# configure

Enters global configuration mode.

Step 2

[no] monitor access session session-name

Example:

apic1(config)# monitor access session mySession

Creates an access monitoring session configuration.

Step 3

[no] description text

Example:

apic1(config-monitor-access)# description "This is my access ERSPAN session"

Adds a description for this monitoring session. If the text includes spaces, it must be enclosed in single quotes.

Step 4

[no] destination tenant tenant-name application application-name epg epg-name destination-ip dest-ip-address source-ip-prefix src-ip-address

Example:

apic1(config-monitor-access)# destination tenant t1 application app1 epg epg1 destination-ip 192.0.20.123 source-ip-prefix 10.0.20.1

Specifies the destination interface as a tenant and enters destination configuration mode.

Step 5

[no] erspan-id flow-id

Example:

apic1(config-monitor-access-dest)# erspan-id 100

Configures the ERSPAN ID for the ERSPAN session. The ERSPAN range is from 1 to 1023.

Step 6

[no] ip dscp dscp-code

Example:

apic1(config-monitor-access-dest)# ip dscp 42

Configures the differentiated services code point (DSCP) value of the packets in the ERSPAN traffic. The range is from 0 to 64.

Step 7

[no] ip ttl ttl-value

Example:

apic1(config-monitor-access-dest)# ip ttl 16

Configures the IP time-to-live (TTL) value for the ERSPAN traffic. The range is from 1 to 255.

Step 8

[no] mtu mtu-value

Example:

apic1(config-monitor-access-dest)# mtu 9216

Configures the maximum transmit unit (MTU) size for the ERSPAN session. The range is 64 to 9216 bytes.

Step 9

exit

Example:

apic1(config-monitor-access-dest)# 

Returns to monitor access configuration mode.

Step 10

[no] source interface ethernet { [fex/] slot/port | port-range} leaf node-id

Example:

apic1(config-monitor-access)# source interface eth 1/2 leaf 101

Specifies the source interface port or port range.

Step 11

[no] source interface port-channel port-channel-name-list leaf node-id [fex fex-id]

Example:

apic1(config-monitor-access)# source interface port-channel pc1 leaf 101

Specifies the source interface port-channel.

Step 12

[no] source interface vpc vpc-name-list leaf node-id1 node-id2 [fex fex-id1 fex-id2]

Example:

apic1(config-monitor-access)# source interface vpc pc1 leaf 101 102

Specifies the source interface vPC.

Step 13

[no] direction {rx | tx | both}

Example:

apic1(config-monitor-access-source)# direction tx

Specifies direction of traffic to be monitored. The direction can be configured independently for each source port range.

Step 14

[no] filter tenant tenant-name application application-name epg epg-name

Example:

apic1(config-monitor-access-source)# filter tenant t1 application app1 epg epg1

Filters traffic to be monitored. The filter can be configured independently for each source port range.

Step 15

exit

Example:

apic1(config-monitor-access-source)# exit

Returns to access monitor session configuration mode.

Step 16

[no] shutdown

Example:

apic1(config-monitor-access)# no shut

Disables (or enables) the monitoring session.

Examples

This example shows how to configure an ERSPAN access monitoring session.


apic1# configure terminal 
apic1(config)# monitor access session mySession
apic1(config-monitor-access)# description "This is my access ERSPAN session"
apic1(config-monitor-access)# destination tenant t1 application app1 epg epg1 destination-ip 192.0.20.123 source-ip-prefix 10.0.20.1
apic1(config-monitor-access-dest)# erspan-id 100
apic1(config-monitor-access-dest)# ip dscp 42
apic1(config-monitor-access-dest)# ip ttl 16
apic1(config-monitor-access-dest)# mtu 9216
apic1(config-monitor-access-dest)# exit
apic1(config-monitor-access)# source interface eth 1/1 leaf 101
apic1(config-monitor-access-source)# direction tx
apic1(config-monitor-access-source)# filter tenant t1 application app1 epg epg1
apic1(config-monitor-access-source)# exit
apic1(config-monitor-access)# no shut
apic1(config-monitor-access)# show run
# Command: show running-config monitor access session mySession
# Time: Fri Nov 6 23:55:35 2015
  monitor access session mySession
    description "This is my ERSPAN session"
    source interface eth 1/1 leaf 101
      direction tx
      filter tenant t1 application app1 epg epg1
      exit
    destination tenant t1 application app1 epg epg1 destination-ip 192.0.20.123 source-ip-prefix 10.0.20.1
      ip dscp 42
      ip ttl 16
      erspan-id 9216
      mtu 9216
      exit
    exit

This example shows how to configure a port-channel as a monitoring source.


apic1(config-monitor-access)# source interface port-channel pc3 leaf 105

This example shows how to configure a one leg of a vPC as a monitoring source.


apic1(config-monitor-access)# source interface port-channel vpc3 leaf 105

This example shows how to configure a range of ports from FEX 101 as a monitoring source.


apic1(config-monitor-access)# source interface eth 101/1/1-2 leaf 105

Configuring ERSPAN in Fabric Mode

In the ACI fabric, a fabric mode ERSPAN configuration can be used for monitoring traffic originating from one or more fabric ports in leaf or spine nodes. Local SPAN is not supported in fabric mode.

For an ERSPAN session, the destination is always an endpoint group (EPG) which can be deployed anywhere in the fabric. The monitored traffic is forwarded to the destination wherever the EPG is moved. In the fabric mode, only fabric ports are allowed as source, but both leaf and spine switches are allowed.

Procedure

  Command or Action Purpose

Step 1

configure

Example:

apic1# configure

Enters global configuration mode.

Step 2

[no] monitor fabric session session-name

Example:

apic1(config)# monitor fabric session mySession

Creates a fabric monitoring session configuration.

Step 3

[no] description text

Example:

apic1(config-monitor-fabric)# description "This is my fabric ERSPAN session"

Adds a description for this monitoring session. If the text includes spaces, it must be enclosed in single quotes.

Step 4

[no] destination tenant tenant-name application application-name epg epg-name destination-ip dest-ip-address source-ip-prefix src-ip-address

Example:

apic1(config-monitor-fabric)# destination tenant t1 application app1 epg epg1 destination-ip 192.0.20.123 source-ip-prefix 10.0.20.1

Specifies the destination interface as a tenant and enters destination configuration mode.

Step 5

[no] erspan-id flow-id

Example:

apic1(config-monitor-fabric-dest)# erspan-id 100

Configures the ERSPAN ID for the ERSPAN session. The ERSPAN range is from 1 to 1023.

Step 6

[no] ip dscp dscp-code

Example:

apic1(config-monitor-fabric-dest)# ip dscp 42

Configures the differentiated services code point (DSCP) value of the packets in the ERSPAN traffic. The range is from 0 to 64.

Step 7

[no] ip ttl ttl-value

Example:

apic1(config-monitor-fabric-dest)# ip ttl 16

Configures the IP time-to-live (TTL) value for the ERSPAN traffic. The range is from 1 to 255.

Step 8

[no] mtu mtu-value

Example:

apic1(config-monitor-fabric-dest)# mtu 9216

Configures the maximum transmit unit (MTU) size for the ERSPAN session. The range is 64 to 9216 bytes.

Step 9

exit

Example:

apic1(config-monitor-fabric-dest)# 

Returns to monitor access configuration mode.

Step 10

[no] source interface ethernet {slot/port | port-range} switch node-id

Example:

apic1(config-monitor-fabric)# source interface eth 1/2 switch 101

Specifies the source interface port or port range.

Step 11

[no] direction {rx | tx | both}

Example:

apic1(config-monitor-fabric-source)# direction tx

Specifies direction of traffic to be monitored. The direction can be configured independently for each source port range.

Step 12

[no] filter tenant tenant-name bd bd-name

Example:

apic1(config-monitor-fabric-source)# filter tenant t1 bd bd1

Filters traffic by bridge domain.

Step 13

[no] filter tenant tenant-name vrf vrf-name

Example:

apic1(config-monitor-fabric-source)# filter tenant t1 vrf vrf1

Filters traffic by VRF.

Step 14

exit

Example:

apic1(config-monitor-fabric-source)# exit

Returns to access monitor session configuration mode.

Step 15

[no] shutdown

Example:

apic1(config-monitor-fabric)# no shut

Disables (or enables) the monitoring session.

Examples

This example shows how to configure an ERSPAN fabric monitoring session.


apic1# configure terminal 
apic1(config)# monitor fabric session mySession
apic1(config-monitor-fabric)# description "This is my fabric ERSPAN session"
apic1(config-monitor-fabric)# destination tenant t1 application app1 epg epg1 destination-ip 192.0.20.123 source-ip-prefix 10.0.20.1
apic1(config-monitor-fabric-dest)# erspan-id 100
apic1(config-monitor-fabric-dest)# ip dscp 42
apic1(config-monitor-fabric-dest)# ip ttl 16
apic1(config-monitor-fabric-dest)# mtu 9216
apic1(config-monitor-fabric-dest)# exit
apic1(config-monitor-fabric)# source interface eth 1/1 switch 101
apic1(config-monitor-fabric-source)# direction tx
apic1(config-monitor-fabric-source)# filter tenant t1 bd bd1
apic1(config-monitor-fabric-source)# filter tenant t1 vrf vrf1
apic1(config-monitor-fabric-source)# exit
apic1(config-monitor-fabric)# no shut

Configuring ERSPAN in Tenant Mode

In the ACI fabric, a tenant mode ERSPAN configuration can be used for monitoring traffic originating from endpoint groups within a tenant.

In the tenant mode, traffic originating from a source EPG is sent to a destination EPG within the same tenant. The monitoring of traffic is not impacted if the source or destination EPG is moved within the fabric.

Procedure

  Command or Action Purpose

Step 1

configure

Example:

apic1# configure

Enters global configuration mode.

Step 2

[no] monitor tenant tenant-name session session-name

Example:

apic1(config)# monitor tenant session mySession

Creates a tenant monitoring session configuration.

Step 3

[no] description text

Example:

apic1(config-monitor-tenant)# description "This is my tenant ERSPAN session"

Adds a description for this access monitoring session. If the text includes spaces, it must be enclosed in single quotes.

Step 4

[no] destination tenant tenant-name application application-name epg epg-name destination-ip dest-ip-address source-ip-prefix src-ip-address

Example:

apic1(config-monitor-tenant)# destination tenant t1 application app1 epg epg1 destination-ip 192.0.20.123 source-ip-prefix 10.0.20.1

Specifies the destination interface as a tenant and enters destination configuration mode.

Step 5

[no] erspan-id flow-id

Example:

apic1(config-monitor-tenant-dest)# erspan-id 100

Configures the ERSPAN ID for the ERSPAN session. The ERSPAN range is from 1 to 1023.

Step 6

[no] ip dscp dscp-code

Example:

apic1(config-monitor-tenant-dest)# ip dscp 42

Configures the differentiated services code point (DSCP) value of the packets in the ERSPAN traffic. The range is from 0 to 64.

Step 7

[no] ip ttl ttl-value

Example:

apic1(config-monitor-tenant-dest)# ip ttl 16

Configures the IP time-to-live (TTL) value for the ERSPAN traffic. The range is from 1 to 255.

Step 8

[no] mtu mtu-value

Example:

apic1(config-monitor-tenant-dest)# mtu 9216

Configures the maximum transmit unit (MTU) size for the ERSPAN session. The range is 64 to 9216 bytes.

Step 9

exit

Example:

apic1(config-monitor-tenant-dest)# 

Returns to monitor access configuration mode.

Step 10

[no] source application application-name epg epg-name

Example:

apic1(config-monitor-tenant)# source application app2 epg epg5

Specifies the source interface port or port range.

Step 11

[no] direction {rx | tx | both}

Example:

apic1(config-monitor-tenant-source)# direction tx

Specifies direction of traffic to be monitored. The direction can be configured independently for each source port range.

Step 12

exit

Example:

apic1(config-monitor-tenant-source)# exit

Returns to access monitor session configuration mode.

Step 13

[no] shutdown

Example:

apic1(config-monitor-tenant)# no shut

Disables (or enables) the monitoring session.

Examples

This example shows how to configure an ERSPAN tenant monitoring session.


apic1# configure terminal 
apic1(config)# monitor access session mySession
apic1(config-monitor-tenant)# description "This is my tenant ERSPAN session"
apic1(config-monitor-tenant)# destination tenant t1 application app1 epg epg1 destination-ip 192.0.20.123 source-ip-prefix 10.0.20.1
apic1(config-monitor-tenant-dest)# erspan-id 100
apic1(config-monitor-tenant-dest)# ip dscp 42
apic1(config-monitor-tenant-dest)# ip ttl 16
apic1(config-monitor-tenant-dest)# mtu 9216
apic1(config-monitor-tenant-dest)# exit
apic1(config-monitor-tenant)# source application app2 epg epg5
apic1(config-monitor-tenant-source)# direction tx
apic1(config-monitor-tenant-source)# exit
apic1(config-monitor-tenant)# no shut

Using Statistics

Statistics provide real-time measures of observed object and enable trend analysis and troubleshooting. Statistics gathering can be configured for ongoing or on-demand collection and can be collected in cumulative counters and gauges.

Policies define what statistics are gathered, at what intervals, and what actions to take. For example, a policy could raise a fault on an EPG if a threshold of dropped packets on an ingress VLAN is greater than 1000 per second.

Statistics data are gathered from a variety of sources, including interfaces, VLANs, EPGs, application profiles,ACL rules, tenants, or internal APIC processes. Statistics accumulate data in 5-minute, 15-minute, 1-hour, 1-day, 1-week, 1-month, 1-quarter, or 1-year sampling intervals. Shorter duration intervals feed longer intervals. A variety of statistics properties are available, including last value, cumulative, periodic, rate of change, trend, maximum, min, average. Collection and retention times are configurable. Policies can specify if the statistics are to be gathered from the current state of the system or to be accumulated historically or both. For example, a policy could specify that historical statistics be gathered for 5-minute intervals over a period of 1 hour. The 1 hour is a moving window. Once an hour has elapsed, the incoming 5 minutes of statistics are added, and the earliest 5 minutes of data are abandoned.


Note


The maximum number of 5-minute granularity sample records is limited to 12 samples (one hour of statistics). All other sample intervals are limited to 1,000 sample records. For example, hourly granularity statistics can be maintained for up to 41 days.


Viewing Statistics in the GUI

You can view statistics for many objects using the APIC GUI, including application profiles, physical interfaces, bridge domains, and fabric nodes. To view statistics in the GUI, choose the object in the navigation pane and click the STATS tab.

Follow these steps to view statistics for an interface:

Procedure


Step 1

On the menu bar, choose FABRIC > INVENTORY.

Step 2

In the Navigation pane, choose a pod.

Step 3

Expand the pod, and expand a switch.

Step 4

In the Navigation pane, expand Interfaces and choose eth1/1.

Step 5

In the Work pane, choose the STATS tab.


The APIC displays interface statistics.

Example

What to do next

You can use the following icons in the Work pane to manage how the APIC displays statistics:

  • Refresh—Manually refreshes statistics.

  • Show Table View—Toggles between table and chart views.

  • Start or Stop Stats—Enables or disables automatic refresh for statistics.

  • Select Stats—Specifies the counters and sample interval to display.

  • Download Object as XML—Downloads the object in XML format.

  • Measurement Type (Gear icon)—Specifies the statistics measurement type. Options include cumulative, periodic, average, or trend.

Switch Statistics Commands

You can use the following commands to display statistics on ACI leaf switches.

Command Purpose
Legacy Cisco Nexus show/clear commands For more information, see Cisco Nexus 9000 Series NX-OS Configuration Guides.
show platform internal counters port [port_num | detail | nz | {internal [nz | int_port_num]}] Displays spine port statistics
  • port_num—Front port number without the slot.

  • detail—Returns SNMP, class and forwarding statistics.

  • nz—Displays only non-zero values.

  • internal—Displays internal port statistics.

  • int_port_num—Internal logical port number. For example, for BCM-0/97, enter 97.

Note

 
If there is a link reset, the counters will be zeroed out on the switch. The conditions of counter reset include the following:
  • accidental link reset
  • manually enabled port (after port is disabled)
show platform internal counters vlan [hw_vlan_id] Displays VLAN statistics.
show platform internal counters tep [tunnel_id] Displays TEP statistics.
show platform internal counters flow [rule_id | {dump [asic inst] | [slice direction | index hw_index]}] Displays flow statistics.
clear platform internal counters port [port_num | {internal [ int_port_num]}] Clears port statistics.
clear platform internal counters vlan [hw_vlan_id] Clears VLAN counters.
debug platform internal stats logging level log_level Sets the debug logging level.
debug platform internal stats logging {err|trace|flow} Sets the debug logging type.

Managing Statistics Thresholds Using the GUI

Procedure


Step 1

On the menu bar, choose Fabric > Fabric Policies.

Step 2

In the Navigation pane, click + to expand Monitoring Policies.

Step 3

In the Navigation pane, expand the monitoring policy name (such as Default).

Step 4

Click Stats Collection Policies.

Step 5

In the Stats Collection Policies window, choose a Monitoring Object and Stats Type for which to set a threshold value..

Step 6

In the Work pane, Click the + icon below CONFIG THRESHOLDS.

Step 7

In the THRESHOLDS FOR COLLECTION window, click + to add a threshold.

Step 8

In the Choose a Property window, choose a statistics type.

Step 9

In the EDIT STATS THRESHOLD window, specify the following threshold values:

  • Normal Value—A valid value of the counter.

  • Threshold Direction—Indicates whether the threshold is a maximum or minimum value.

  • Rising Thresholds (Critical, Major, Minor, Warning)—Triggered when the value exceeds the threshold.

  • Falling Thresholds (Critical, Major, Minor, Warning)—Triggered when the value drops below the threshold.

Step 10

You can specify a set and reset value for rising and falling thresholds. The set value specifies when a fault is triggered; the reset value specifies when the fault is cleared.

Step 11

Click SUBMIT to save the threshold value.

Step 12

In the THRESHOLDS FOR COLLECTION window, click CLOSE.


Statistics Troubleshooting Scenarios

The following table summarizes common statistics troubleshooting scenarios for the Cisco APIC.

Problem Solution
The APIC does not enforce a configured monitoring policy The problem occurs when a monitoring policy is in place but the APIC does not perform a corresponding action, such as collecting the statistics or acting on a trigger threshold. Follow these steps to resolve the issue:
  • Verify that monPolDn points to the correct monitoring policy.

  • Ensure that the selectors are configured correctly and that there are no faults.

  • For Tenant objects, check the relation to the monitoring policy.

Some configured statistics are missing. Follow these steps to resolve the issue:
  • Review the statistics that are disabled by default within the monitoring policy and collection policy.

  • Review the collection policy to determine if the statistics are disabled by default or disabled for certain intervals.

  • Review the statistics policy to determine if the statistics are disabled by default or disabled for certain intervals.

Note


Except for fabric health statistics, 5 minute statistics are stored on the switch and are lost when the switch reboots.

Statistics or history are not maintained for the configured time period. Follow these steps to resolve the issue:
  • Review the collection settings; if configured at the top level of the monitoring policy, the statistics can be overridden for a specific object or statistics type.

  • Review the collection policy assigned to the monitoring object. Confirm that the policy is present and review the administrative state, and history retention values.

  • Verify that the statistics type is configured correctly.

Some statistics are not maintained for the full configured interval.

Review whether the configuration exceeds the maximum historical record size. The limitations are as follows:

  • Switch statistics for 5 minute granularity are limited to 12 samples (1 hour of 5 minute granular statistics).

  • There is a hard limit of 1000 samples. For example, hourly granular statistics can be maintained for up to 41 days.

An export policy is configured but the APIC does not export statistics.

Follow these steps to resolve the issue:

  • Check the status object for the destination policy.

  • On the node that is expected to export the statistics check the export status object and look at the export status and details properties. Aggregated EPG stats are exported every 15 minutes from APIC nodes. Other statistics are exported from source nodes every 5 minutes. For example, if an EPG is deployed to two leaf switches and configured to exporte EPG aggregation parts, then those parts are exported from the nodes every 5 minutes.

  • Review whether the configuration exceeds the maximum number of export policies. The maximum number of statistics export policies is approximately equal to the number of tenants.

    Note


    Each tenant can have multiple statistics export policies and multiple tenants can share the same export policy, but the total number number of policies is limited to approximately the number of tenants.

5 Minute Statistics Fluctuate The APIC system reports statistics every 5 minutes, sampled approximately every 10 seconds. The number of samples taken in 5 minutes may vary, because there are slight time variances when the data is collected. As a result, the statistics might represent a slightly longer or shorter time period. This is expected behavior.
Some historical statistics are missing. For more information, see Statistics Cleanup.

Statistics Cleanup

The APIC and switches clean up statistics as follows:

  • Switch—The switch cleans up statistics as follows:

    • 5 minute statistics on switches are purged if no counter value is reported for 5 minutes. This situation can occur when an object is deleted or statistics are disabled by a policy.

    • Statistics of larger granularity are purged if statistics are missing for more than one hour, which can occur when:
      • Statistics are disabled by a policy.

      • A switch is disconnected from an APIC for more than one hour.

    • The switch cleans up statistics for deleted objects after 5 minutes. If an object is recreated within this time, statistics counts remain unchanged.

    • Disabled object statistics are deleted after 5 minutes.

    • If the system state changes so that statistics reporting is disabled for 5 minutes, this switch cleans up statistics.

  • APIC—The APIC cleans up objects including interfaces, EPGs, temperature sensors, and health statistics after one hour.

Specifying Syslog Sources and Destinations

This section explains how to create syslog destination groups, a syslog source, and how to enable syslog to display in NX-OS CLI format using the REST API.

About Syslog

During operation, a fault or event in the Cisco Application Centric Infrastructure (ACI) system can trigger the sending of a system log (syslog) message to the console, to a local file, and to a logging server on another system. A system log message typically contains a subset of information about the fault or event. A system log message can also contain audit log and session log entries.

Note


For a list of syslog messages that the APIC and the fabric nodes can generate, see http://www.cisco.com/c/en/us/td/docs/switches/datacenter/aci/apic/sw/1-x/syslog/guide/aci_syslog/ACI_SysMsg.html.


Many system log messages are specific to the action that a user is performing or the object that a user is configuring or administering. These messages can be the following:

  • Informational messages, providing assistance and tips about the action being performed

  • Warning messages, providing information about system errors related to an object, such as a user account or service profile, that the user is configuring or administering

In order to receive and monitor system log messages, you must specify a syslog destination, which can be the console, a local file, or one or more remote hosts running a syslog server. In addition, you can specify the minimum severity level of messages to be displayed on the console or captured by the file or host. The local file for receiving syslog messages is /var/log/external/messages.

A syslog source can be any object for which an object monitoring policy can be applied. You can specify the minimum severity level of messages to be sent, the items to be included in the syslog messages, and the syslog destination.

You can change the display format for the Syslogs to NX-OS style format.

Additional details about the faults or events that generate these system messages are described in the Cisco APIC Faults, Events, and System Messages Management Guide, and system log messages are listed in the Cisco ACI System Messages Reference Guide.


Note


Not all system log messages indicate problems with your system. Some messages are purely informational, while others may help diagnose problems with communications lines, internal hardware, or the system software.


Creating a Syslog Destination and Destination Group

This procedure configures syslog data destinations for logging and evaluation. You can export syslog data to the console, to a local file, or to one or more syslog servers in a destination group.

Procedure


Step 1

In the menu bar, click Admin.

Step 2

In the submenu bar, click External Data Collectors.

Step 3

In the Navigation pane, expand Monitoring Destinations.

Step 4

Right-click Syslog and choose Create Syslog Monitoring Destination Group.

Step 5

In the Create Syslog Monitoring Destination Group dialog box, perform the following actions:

  1. In the group and profile Name field, enter a name for the monitoring destination group and profile.

  2. In the group and profile Format field, choose the format for Syslog messages.

    The default is aci, or the RFC 5424 compliant message format, but you can choose to set it to the NX-OS style format instead.

  3. In the group and profile Admin State drop-down list, choose enabled.

  4. To enable sending of syslog messages to a local file, choose enabled from the Local File Destination Admin State drop-down list and choose a minimum severity from the Local File Destination Severity drop-down list.

    The local file for receiving syslog messages is /var/log/external/messages.

  5. To enable sending of syslog messages to the console, choose enabled from the Console Destination Admin State drop-down list and choose a minimum severity from the Console Destination Severity drop-down list.

  6. Click Next.

  7. In the Create Remote Destinations area, click + to add a remote destination.

Caution


Risk of hostname resolution failure for remote Syslog destinations, if the DNS server used is configured to be reachable over in-band connectivity. To avoid the issue, configure the Syslog server using the IP address, or if you use a hostname, ensure that the DNS server is reachable over an out-of-band interface.

Step 6

In the Create Syslog Remote Destination dialog box, perform the following actions:

  1. In the Host field, enter an IP address or a fully qualified domain name for the destination host.

  2. (Optional) In the Name field, enter a name for the destination host.

  3. In the Admin State field, click the enabled radio button.

  4. (Optional) Choose a minimum severity Severity, a Port number, and a syslog Facility.

    The Facility is a number that you can optionally use to indicate which process generated the message, and can then be used to determine how the message will be handled at the receiving end.

  5. From the Management EPG drop-down list, choose the management endpoint group.

  6. Click OK.

Step 7

(Optional) To add more remote destinations to the remote destination group, click + again and repeat the steps in the Create Syslog Remote Destination dialog box

Step 8

Click Finish.


Creating a Syslog Source

A syslog source can be any object for which an object monitoring policy can be applied.

Before you begin

Create a syslog monitoring destination group.

Procedure


Step 1

From the menu bar and the navigation frame, navigate to a Monitoring Policies menu for the area of interest.

You can configure monitoring policies for tenants, fabric, and access.

Step 2

Expand Monitoring Policies, then select and expand a monitoring policy.

Under Fabric > Fabric Policies > Monitoring Policies > Common Policy is a basic monitoring policy that applies to all faults and events and is automatically deployed to all nodes and controllers in the fabric. Alternatively, you can specify an existing policy with a more limited scope.

Step 3

Under the monitoring policy, click Callhome/SNMP/Syslog.

Step 4

In the Work pane, choose Syslog from the Source Type drop-down list.

Step 5

From the Monitoring Object list, choose a managed object to be monitored.

If the desired object does not appear in the list, follow these steps:

  1. Click the Edit icon to the right of the Monitoring Object drop-down list.

  2. From the Select Monitoring Package drop-down list, choose an object class package.

  3. Select the checkbox for each object that you want to monitor.

  4. Click Submit.

Step 6

In a tenant monitoring policy, if you select a specific object instead of All, a Scope selection appears.

In the Scope field, select a radio button to specify the system log messages to send for this object:

  • all—Send all events and faults related to this object

  • specific event—Send only the specified event related to this object. From the Event drop-down list, choose the event policy.

  • specific fault—Send only the specified fault related to this object. From the Fault drop-down list, choose the fault policy.

Step 7

Click + to create a syslog source.

Step 8

In the Create Syslog Source dialog box, perform the following actions:

  1. In the Name field, enter a name for the syslog source.

  2. From the Min Severity drop-down list, choose the minimum severity of system log messages to be sent.

  3. In the Include field, check the checkboxes for the type of messages to be sent.

  4. From the Dest Group drop-down list, choose the syslog destination group to which the system log messages will be sent.

  5. Click Submit.

Step 9

(Optional) To add more syslog sources, click + again and repeat the steps in the Create Syslog Source dialog box


Enabling Syslog to Display in NX-OS CLI Format, Using the REST API

By default the Syslog format is RFC 5424 compliant. You can change the default display of Syslogs to NX-OS type format, similar to the following example:

apic1# moquery -c "syslogRemoteDest"

Total Objects shown: 1

# syslog.RemoteDest
host               : 172.23.49.77
adminState         : enabled
childAction        : 
descr              : 
dn                 : uni/fabric/slgroup-syslog-mpod/rdst-172.23.49.77
epgDn              : 
format             : nxos
forwardingFacility : local7
ip                 : 
lcOwn              : local
modTs              : 2016-05-17T16:51:57.231-07:00
monPolDn           : uni/fabric/monfab-default
name               : syslog-dest
operState          : unknown
port               : 514
rn                 : rdst-172.23.49.77
severity           : information
status             : 
uid                : 15374
vrfId              : 0
vrfName            : 

To enable the Syslogs to display in NX-OS type format, perform the following steps, using the REST API.

Procedure


Step 1

Enable the Syslogs to display in NX-OS type format, as in the following example:

POST https://192.168.20.123/api/node/mo/uni/fabric.xml  
<syslogGroup name="DestGrp77" format="nxos"> 
<syslogRemoteDest name="slRmtDest77" host="172.31.138.20" severity="debugging"/> 
</syslogGroup>

The syslogGroup is the Syslog monitoring destination group, the sysLogRemoteDest is the name you previously configured for your Syslog server, and the host is the IP address for the previously configured Syslog server.

Step 2

Set the Syslog format back to the default RFC 5424 format, as in the following example:

POST https://192.168.20.123/api/node/mo/uni/fabric.xml  
<syslogGroup name="DestGrp77" format="aci"> 
<syslogRemoteDest name="slRmtDest77" host="172.31.138.20" severity="debugging"/> 
</syslogGroup>

Discovering Paths and Testing Connectivity with Traceroute

This section lists the traceroute guidelines and restriction and explains how to perform a traceroute between endpoints.

About Traceroute

The traceroute tool is used to discover the routes that packets actually take when traveling to their destination. Traceroute identifies the path taken on a hop-by-hop basis and includes a time stamp at each hop in both directions. You can use traceroute to test the connectivity of ports along the path between the generating device and the device closest to the destination. If the destination cannot be reached, the path discovery traces the path up to the point of failure.

A traceroute that is initiated from the tenant endpoints shows the default gateway as an intermediate hop that appears at the ingress leaf switch.

Traceroute supports a variety of modes, including endpoint-to-endpoint, and leaf-to-leaf (tunnel endpoint, or TEP to TEP). Traceroute discovers all paths across the fabric, discovers point of exits for external endpoints, and helps to detect if any path is blocked.

Traceroute Guidelines and Restrictions

  • When the traceroute source or destination is an endpoint, the endpoint must be dynamic and not static. Unlike a dynamic endpoint (fv:CEp), a static endpoint (fv:StCEp) does not have a child object (fv:RsCEpToPathEp) that is required for traceroute.

  • Traceroute works for IPv6 source and destinations but configuring source and destination IP addresses across IPv4 and IPv6 addresses is not allowed.

  • See the Verified Scalability Guide for Cisco ACI document for traceroute-related limits.

  • When an endpoint moves from one ToR switch to a different ToR switch that has a new MAC address (one that is different than the MAC address that you specified while configuring the traceroute policy), the traceroute policy shows "missing-target" for the endpoint. In this scenario you must configure a new traceroute policy with the new MAC address.

  • When performing a traceroute for a flow involving the policy-based redirect feature, the IP address used by the leaf switch to source the time-to-live (TTL) expired message when the packet goes from the service device to the leaf switch may not always be the IP address of the bridge domain’s switch virtual interface (SVI) of the service device. This behavior is cosmetic and does not indicate that the traffic is not taking the expected path.

Performing a Traceroute Between Endpoints

Procedure


Step 1

In the menu bar, click Tenants.

Step 2

In the submenu bar, click the tenant that contains the source endpoint.

Step 3

In the Navigation pane, expand the tenant and expand Policies > Troubleshoot.

Step 4

Under Troubleshoot, right-click Endpoint-to-Endpoint Traceroute Policies and choose Create Endpoint-to-Endpoint Traceroute Policy.

Step 5

Enter the appropriate values in the Create Endpoint-to-Endpoint Traceroute Policy dialog box fields and click Submit.

Note


For the description of a field, click the information icon (i) in the top-right corner of the Create Endpoint-to-Endpoint Traceroute Policy dialog box.

Step 6

In the Navigation pane or the Traceroute Policies table, click the traceroute policy.

The traceroute policy is displayed in the Work pane.

Step 7

In the Work pane, click the Operational tab, click the Source End Points tab, and click the Results tab.

Step 8

In the Traceroute Results table, verify the path or paths that were used in the trace.

Note

 
  • More than one path might have been traversed from the source node to the destination node.

  • For readability, you can increase the width of one or more columns, such as the Name column.


Using the Troubleshooting Wizard

The Troubleshooting Wizard allows you understand and visualize how your network is behaving, which can ease your networking concerns should issues arise.

This wizard allows you (the Administrative user) to troubleshoot issues that occur during specific time frames, which can be designated by selecting two endpoints. For example, you may have two endpoints that are having intermittent packet loss but you don't understand why. Through the troubleshooting GUI, you can evaluate the issue so that you can effectively resolve it rather than logging onto each machine that you suspect to be causing this faulty behavior.

Since you may want to revisit the session later, you should give the session a unique name. You may also choose to use a pre-configured test. You can debug from endpoint to endpoint, or from an internal or external endpoint, or from an external to an internal endpoint.

Further, you can define a time window in which you want to perform the debug. The Troubleshooting GUI allows you to enter a source and destination endpoint for the endpoints you are looking for. You can do this with a MAC, IPv4, or IPv6 address and then select by tenant. You also have the option to generate a troubleshooting report that can be sent to TAC.

The following section describes the topology of the Troubleshooting Wizard, which is a simplified view of the fabric with only the elements that are relevant to your two endpoints under inspection.


Note


For a list of Troubleshooting Wizard CLI commands, see the Cisco APIC Command-Line Interface User Guide.


Getting Started with the Troubleshooting Wizard

Before you start using the Troubleshooting Wizard, you must be logged on as an Administrative user. Then you must designate Source and Destination endpoints (Eps) and select a time window for your troubleshooting session. The time window is used for retrieving Events, Fault Records, Deployment Records, Audit Logs, and Statistics. (The description and time window can only be edited in the first page of the wizard, before clicking on Start.)


Note


  • You cannot modify the Source and Destination endpoints once you have clicked either the GENERATE REPORT button or the START button. If you want to change the Source and Destination information after you have entered it, you have to start a new session.

  • As you navigate through the screens of the Troubleshooting Wizard, you have the option to take a screen shot at any time and send it to a printer (or save it as a PDF) by clicking the Print icon () at the top, right side of the screen. There are also Zoom In and Zoom Out icons () that you can use to modify your view of any screen.


To set up your troubleshooting session information:

Procedure


Step 1

Select OPERATIONS from the top of the screen then choose VISIBILITY & TROUBLESHOOTING.

The Visibility & Troubleshooting screen appears.

Step 2

You can choose to either use an existing troubleshooting session (using the drop-down menu) or you can create a new one. To create a new one, enter a name for it in the Session Name field.

Step 3

Enter a description in the Description field to provide additional information.

(This step is optional.)

Step 4

From the Source pull-down menu, enter a MAC, IPv4, or IPv6 address or choose an existing one.

Step 5

Click SEARCH.

A box appears (shown as follows) displaying one or multiple rows with detailed information to help you make a selection. Each row shows that the IP address (in the IP column) you entered is in a specific endpoint group (in the EPG column), which belongs to a certain application (in the Application column), which is in a particular tenant (in the Tenant column). The leaf number, fex number, and port details are shown in the Learned At column.

Step 6

From the Destination pull-down menu, enter a MAC, IPv4, or IPv6 address or choose an existing one.

Step 7

Click SEARCH.

A box appears displaying one or multiple rows to help you make a selection (as previously described for the Source endpoint search).

Step 8

Check the External IP checkbox if you are using an endpoint to external internet protocol.

Note

 
  • For more information about endpoints and external IPs, refer to the Cisco Application Centric Infrastructure Fundamentals guide.

  • Ideally, you should select the Source and Destination endpoints from the same tenant or some of the troubleshooting functionality may be impacted, as explained later in this document. Once you make selections for these endpoints, you can learn about the topology that connects the two in the Faults troubleshooting screen.

Step 9

Select a time window by making selections from the From (for session Start time) and To (for session End time) pull-down menus.

The Time Window (shown as follows) is used for debugging an issue that occurred during a specific time frame in the past, and is used for retrieving Events, All Records, Deployment Records, Audit Logs, and Statistics. There are two sets of windows; one for all records and one for individual leafs (or nodes).

Note

 
You have two options for setting the time window, which you can toggle back and forth from using the Use fixed time checkbox.
  • You can specify a rolling time window based on any number of Latest Minutes (the default is 240 minutes but this can be changed).

  • Or, you can specify a fixed time window for the session in the From and To fields by checking the Use fixed time checkbox.

Note


The default time window is based on a default of latest 240 minutes (which means that the session contains data for the past 240 minutes) preceding the time you created the session. You can also set up or modify time window information from the bottom of the left navigation pane.

Step 10

Click START at the bottom right side of the screen to begin your troubleshooting session.

The topology diagram for your troubleshooting session loads and then appears.

Note


For a list of Troubleshooting Wizard CLI commands, see the Cisco APIC Command-Line Interface User Guide.


Generating Troubleshooting Reports

You can generate a troubleshooting report in several formats, including JSON, XML, PDF, and HTML. Once you select a format, you can download the report (or schedule a download of the report) and use it for offline analysis or you can send it to TAC so that a support case can be created.

To generate a troubleshooting report:

Procedure


Step 1

From the bottom right corner of the screen, click GENERATE REPORT.

The Generate Report dialog box appears.

Step 2

Choose an output format from the Report Format drop-down menu (XML, HTML, JSON, or PDF).

Step 3

If you want to schedule the download of the report to happen immediately, click theNow > SUBMIT.

An Information box appears indicating where to obtain the report once it has been generated.

Step 4

To schedule the generation of the report for a later time, choose a schedule by clicking Use a scheduler > Scheduler drop-down menu then choose either an existing schedule or create a new one by clicking Create Scheduler. .

The CREATE TRIGGER SCHEDULE dialog appears.

Step 5

Enter information for the Name, Description (optional), and Schedule Windows fields.

Note


For more information on how to use the SCHEDULER, please refer to the online help.

Step 6

Click SUBMIT.


The reports take some time to generate (from a couple of minutes to up to ten minutes), depending on the size of the fabric and how many faults or events exist. A status message displays while the report is being generated. To retrieve and view the troubleshooting report, click SHOW GENERATED REPORTS.

Supply the credentials (User Name and Password) of the server in the Authentication Required window. The troubleshooting report is then downloaded locally to your system.

The ALL REPORTS window appears showing a list of all the reports that have been generated, including the one you just triggered. From there, you can click the link to either download or immediately view the report, depending on the output file format you chose (for example, if the file is a PDF, it may open immediately in your browser).

Topology in the Troubleshooting Wizard

This section explains the topology in the Troubleshooting Wizard. The topology shows how the Source and Destination end points (Eps) are connected to the fabric, what the network path is from the Source to the Destination, and what the intermediate switches are.

The Source end point is displayed on the left side of the topology and the Destination end point is on the right, as shown in the following wizard topology diagram.


Note


This wizard topology only shows the leafs, spines, and fexes of the devices involved in the traffic from the Source end point to the Destination end point. However, there may be many other leafs (tens or hundreds of leafs and many other spines) that exist.

This topology also shows links, ports, and devices. If you hover over the icon), you can see the tenant that the Ep belongs to, which application it belongs to, and the traffic encapsulation it is using (such as VLAN).

There is a color legend on the left side of the screen (shown as follows) that describes the severity levels associated with each color in the topology diagram (for example, critical versus minor).


Hovering over items such as boxes or ports in the topology provides more detailed information. If the port or link has a color, this means that there is a problem for you to troubleshoot. For example, if the color is red or orange, this indicates that there is a fault on a port or link. If the color is white, then there are no faults that exist. If the link has a number in a circle, it indicates how many parallel links between the same two nodes are affected by a fault of the severity given by the color of the circle. Hovering over a port allows you to see which port is connected to the Source Ep.

Right-clicking on a leaf allows you to access the console of the switch. A pop-up window appears that allows you to log into that device.


Note


  • If there are L4 though L7 services (firewall and load balancer) they will be shown in the topology as well
  • For a topology with the load balancer, the destination is expected to be the VIP (Virtual IP)
  • When the endpoint is behind an ESX server, the ESX is shown in the topology


Using the Faults Troubleshooting Screen

Click Faults in the Navigation pane to begin using the Faults troubleshooting screen.

The Faults screen shows the topology that connects the two endpoints that you previously selected as well as the faults that were found. Only faults for the designated communication are shown. Wherever there are faults, they are highlighted in a certain color to convey the severity. Refer to the color legend at the top of the screen (shown as follows) to understand the severity levels associated with each color. This topology also shows the relevant leafs, spines, and fexes to your troubleshooting session. Hovering over items such as leafs, spines, and fexes (or clicking on faults) provides more detailed information for analysis.


Note


White boxes indicate that there are no issues to troubleshoot in that particular area.


Clicking on a fault displays a dialog box with two tabs (FAULTS and RECORDS) that contain more detailed information for analysis, including Severity, Affected Object, Creation Time, Last Transaction, Lifecycle, and Description fields.

Using the Drop/Statistics Troubleshooting Screen

Click Drop/Stats in the Navigation pane to begin using the Drop/Stats troubleshooting screen.

The Drop/Stats window displays the topology with all the statistics from the drops so that you can clearly see where drops exist or not. You can click on any drop image to see more information for analysis.


Once you click a drop image, there are three tabs at the top of the Drop/Stats screen, and the statistics shown are localized to that particular leaf or switch.

The three statistics tabs are:
  • DROP STATS

    This tab shows the statistics for drop counters. The packets that are dropped at various levels are shown here.


    Note


    By default, counters with zero values are hidden but the user can choose to see all the values.
  • CONTRACT DROPS

    This tab shows a list of the contract drops that have occurred, which are individual packet logs (ACL logs), and shows information for each packet such as the Source Interface, Source IP address, Source Port, Destination IP address, Destination Port, and Protocol.

    Note


    Not every packet is displayed here.
  • TRAFFIC STATS

    This tab shows the statistics that indicate ongoing traffic. These are how many packets have been transferring.


    Note


    By default, counters with zero values are hidden but the user can choose to see all the values.

You can also view all of the statistics for all managed objects at once by clicking the All icon () located in the top, left corner of the screen.

You also have the option to pick zero or non-zero drops. Checking the box for Show stats with zero values (located in the top, left corner of the screen) allows you to see all the existing drops. The fields for Time, Affected Object, Stats, and Value become populated with data for all the zero values.

If you do not check the Show stats with zero values box, you will see results with non-zero drops.


Note


The same logic applies if you click the All icon. All three tabs (DROP STATS, CONTRACT DROPS, and TRAFFIC STATS) are also available and have the same type of information appearing.

Using the Contracts Troubleshooting Screen

Click Contracts in the Navigation pane to begin using the Contracts troubleshooting screen.

The Contracts troubleshooting screen displays the contracts that are applicable from the Source to the Destination and from the Destination to the Source.

Each one of the blue table heading rows indicates a filter. There are multiple rows under each filter that indicate multiple filter entries (Protocol, L4 Src, L4 Dest, TCP Flags, Action, Nodes, and Hits) for a particular leaf or switch.

Hovering over the certificate icon, shows you the contract name and the contract filter name. The text appearing on the right side of each blue table heading row (or filter) tells what type of contract it is, for example:

  • Epg to Epg
  • BD Allow
  • Any to Any
  • Context Deny

These contracts are categorized from the Source to the Destination and from the Destination to the Source.


Note


The hits shown for each filter are cumulative (that is, the total hits for that contract hit, contract filter, or rule are shown for each particular leaf.) Statistics are refreshed automatically every (one) minute.

You can get policy information by hovering over the Information (
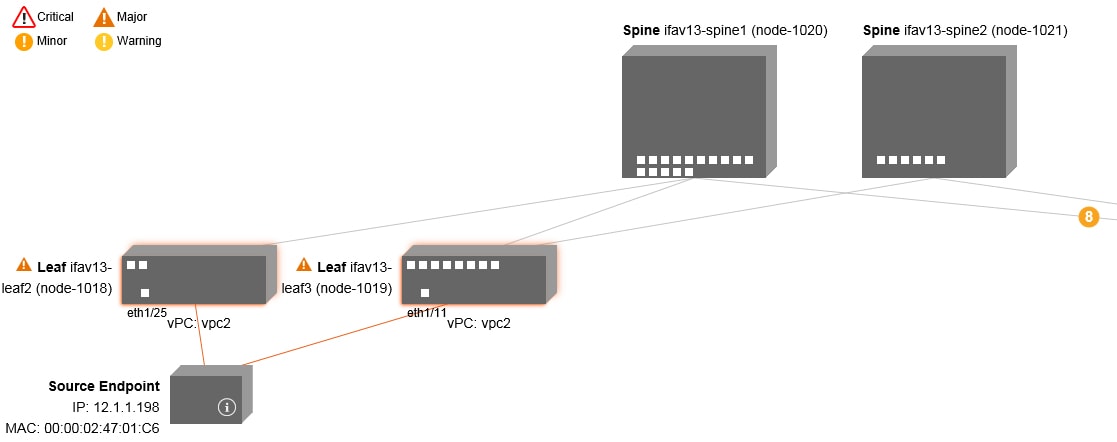
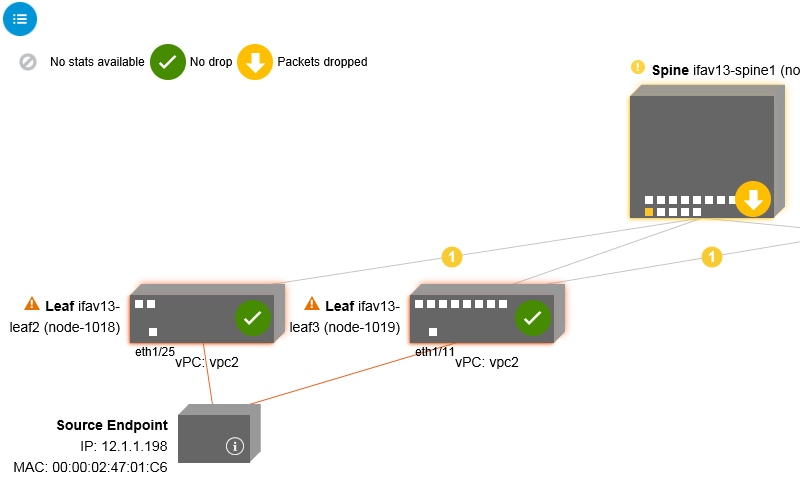
) icon. You can also see which EPGs are being referred to.


Note


If there are no contracts between the endpoints, this will be indicated with a There is no contract data pop-up.

Using the Events Troubleshooting Screen

Click Events and Audits in the Navigation pane to begin using the Events and Audits troubleshooting screen.

If you click on an individual leaf or spine switch, you can see more detailed information about that individual event.

There are two tabs available: EVENTS and DEPLOYMENT RECORDS.
  • EVENTS show event records for any changes that have occurred in systems (such as physical interfaces or VLANS, for example). There are individual events listed for each particular leaf. You can sort these events based on Severity, Affected Object, Creation Time, Cause, and Description.

  • DEPLOYMENT RECORDS show the deployment of policies on physical interfaces, VLANs, VXLANs, and L3 CTXs. These records show the time when a VLAN was placed on a leaf because of the epg.

If you click the All icon () for the All Changes screen, you can see all the events indicating any changes that have occurred during your specified time interval (or troubleshooting session).

There are three tabs in the All Changes screen, including:

  • AUDITS

    Audits do not have a leaf association, which is why they are only available in the All Changes screen.

  • EVENTS (described above)

  • DEPLOYMENT RECORDS (described above)

Using the Traceroute Troubleshooting Screen

Click Traceroute in the Navigation pane to begin using the Traceroute troubleshooting screen.

To create and run a traceroute for troubleshooting:

  1. In the TRACEROUTE dialog box, choose a destination port from the Destination Port drop-down menu.

  2. Choose a protocol from the Protocol pull-down menu. The options supported include:
    • icmp —This protocol is uni-directional, in that it does a traceroute from the Source leaf to the Destination endpoint only.
    • tcp—This protocol is also bi-directional, as described above for the udp protocol.
    • udp—This protocol is bi-directional, in that it does a traceroute from the Source leaf to the Destination endpoint, then from the Destination leaf back to the Source endpoint.

    Note


    UDP, TCP and ICMP are the only supported protocols for IPv4. For IPv6, only UDP is supported.


  3. Once you create a traceroute, click the Play (or Start) button to start the traceroute.


    Note


    When you press the Play button, the polices are created on the system and a Warning message appears.
  4. ClickOK to proceed and the traceroute starts to run.
  5. Click the Stop button to end the traceroute.


    Note


    When you press the Stop button, the policies are removed from the system.

Once the traceroute completes, you can see where it was launched and what the result was. There is a pull-down menu next to Traceroute Results that shows where the traceroute was launched (from the Source to the Destination or from the Destination to the Source).

The result is also shown in the Traceroute dialog, which includes information for Running Time, Traceroute Status, Destination Port, and Protocol.

The results are represented by green and/or red arrows. A green arrow is used to represent each node in the path that responded to the traceroute probes. The beginning of a red arrow represents where the path ends as that's the last node that responded to the traceroute probes. You don't choose which direction to launch the traceroute. Instead, the traceroute is always started for the session. If the session is:
  • EP to external IP or external IP to EP, the traceroute is always launched from EP to external IP.

  • EP to EP and protocol is ICMP, the traceroute is always launched from the source to the destination.

  • EP to EP and protocol is UDP/TCP, the traceroute is always bidirectional.


Note


  • The Traceroute Results drop-down menu can be used to expose/visualize the results for each direction for scenario #3 above. In scenarios #1 and #2, it's always greyed out.

  • If the Traceroute Status shows as incomplete, this means you are still waiting for part of the data to come back. If the Traceroute Status shows as complete, then it is actually complete.


Using the Atomic Counter Troubleshooting Screen

Click Atomic Counter in the Navigation pane to begin using the Atomic Counter troubleshooting screen.

The Atomic Counter screen is used to take source and destination information and create a counter policy based on that. You can create an atomic counter policy between two endpoints and monitor the traffic going back and forth from the Source to the Destination and from the Destination to the Source. You can determine how much traffic is going through and especially determine if any anomalies (drops or excess packets) are reported between the source and destination leaves.

There are Play (or Start) and Stop buttons at the top of the screen so that you can start and stop the atomic counter policy at any point and can count the packets that are being sent.


Note


When you press the Play button, the polices are created on the system and the packet counter starts. When you press the Stop button, the policies are removed from the system.

The results are shown in two different formats. You can view them in either a brief format, which includes a summary, or in a longer format (by clicking on the Expand button). Both brief and expanded formats show both directions. The expanded format shows the cumulative counts plus the counts for each of the latest 30s intervals, while the brief format only shows the counts for cumulative and last interval.

Using the SPAN Troubleshooting Screen

Click SPAN in the Navigation pane to begin using the SPAN troubleshooting screen.

Using this screen, you can span (or mirror) bi-directional traffic and redirect it to the analyzer. In a SPAN session, you are making a copy and sending it to the analyzer.

This copy goes to a particular host (the analyzer IP address) and then you can use a software tool such as Wireshark to view the packets. The session information has source and destination information, session type, and the timestamp range.


Note


When you press the Play button, the polices are created on the system. When you press the Stop button, the policies are removed from the system.

Note


For a list of Troubleshooting Wizard CLI commands, see the Cisco APIC Command-Line Interface User Guide.


L4 - L7 Services Validated Scenarios

The Troubleshooting Wizard allows you to provide two endpoints and see the corresponding topology between those endpoints. When L4 - L7 services exist between the two endpoints in the topology, you are able to view these as well.

This section describes the L4 - L7 scenarios that have been validated for this release. Within the L4 - L7 services, the number of topologies is very high, which means that you can have different configurations for firewalls, load balancers, and combinations of each. If a firewall exists between the two endpoints in the topology, the Troubleshooting Wizard retrieves the firewall data and connectivity from the firewall to the leafs. If a load balancer exists between the two endpoints, you can retrieve and view information up to the load balancer but not up to the server.

The following table shows the L4 - L7 service scenarios that were validated for the Troubleshooting Wizard:

Scenario

1

2

3

4

5

6

Number of Nodes

1

1

2

1

1

2

Device

GoTo FW (vrf split)

GoTo SLB

GoTo,GoTo FW,SLB

FW-GoThrough

SLB-GoTo

FW, SLB (GoThrough, GoTo)

Number of Arms

2

2

2

2

2

2

Consumer

EPG

EPG

EPG

L3Out

L3Out

L3Out

Provider

EPG

EPG

EPG

EPG

EPG

EPG

Device Type

VM

VM

VM

physical

physical

physical

Contract Scope

tenant

context

context

context

context

global

Connector Mode

L2

L2

L2, L2

L3, L2

L3

L3 / L2,L3

Service Attach

BSW

BSW

DL/PC

regular port

vPC

regular port

Client Attach

FEX

FEX

FEX

Regular Port

Regular Port

regular port

Server Attach

vPC

vPC

vPC

regular port

regular port

regular port

interactive API

To create an endpoint (ep) to endpoint interactive troubleshooting session, use the interactive API. The module name is troubleshoot.eptoeputils.topo and the function is getTopo. The required argument (req_args) for the interactive API is - session.

The following table lists the optional arguments (opt_args) and descriptions for each.

Syntax Description

Optional Arguments (opt_args) Description

- srcep

Source endpoint name

- dstep

Destination endpoint name

- srcip

Source endpoint IP address

- dstip

Destination endpoint IP address

- srcmac

Source endpoint MAC

- dstmac

Destination endpoint MAC

- srcextip

L3 external source IP address

- dstextip

L3 external destination IP address

- starttime

Start time of the troubleshooting session

- endtime

End time of the troubleshooting session

- latestmin

Time window for the troubleshooting session starting from start time (in minutes)

- description

Description about the session

- scheduler

Scheduler name for report generation

- srcepid

Obsolete

- dstepid

Obsolete

- include

Obsolete

- format

Format of report to be generated

- ui

Used internally (ignore)

- sessionurl

Location of the report

-action

Start/stop/status etc. for traceroute/atomiccounter

- mode

Used internally

- _dc

Used internally

- ctx

Used internally

createsession API

To create an endpoint (ep) to endpoint troubleshooting session, use the createsession API. The module name is troubleshoot.eptoeputils.session and the function is createSession.

The required argument (req_args) for the createsession API is - session (session name).

The following table lists the optional arguments (opt_args) and descriptions for each.

Syntax Description

Optional Arguments (opt_args) Description

- srcep

Source endpoint name

- dstep

Destination endpoint name

- srcip

Source endpoint IP address

- dstip

Destination endpoint IP address

- srcmac

Source endpoint MAC

- dstmac

Destination endpoint MAC

- srcextip

L3 external source IP address

- dstextip

L3 external destination IP address

- starttime

Start time of the troubleshooting session

- endtime

End time of the troubleshooting session

- latestmin

Time window for the troubleshooting session starting from start time (in minutes)

- description

Description about the session

- format

Format of report to be generated

- ui

Used internally (ignore)

-action

Start/stop/status etc. for traceroute/atomiccounter

- scheduler

- srctenant

Name of the tenant for the source endpoint

- srcapp

Name of the app for the source endpoint

- srcepg

Name of the endpoint group for the source endpoint

- dsttenant

Name of the tenant for the destination endpoint

- dstapp

Name of the app for the destination endpoint

- dstepg

Name of the endpoint group for the destination endpoint

- mode

Used internally

modifysession API

To modify an endpoint (ep) to endpoint troubleshooting session, use the modifysession API. The module name is troubleshoot.eptoeputils.topoand the function is modifySession.

The required arguments (req_args) for the modifysession API are - session (session name) and - mode.

The following table lists the optional arguments (opt_args) and descriptions for each.

Syntax Description

Optional Arguments (opt_args) Description

- starttime

Start time of the troubleshooting session

- endtime

End time of the troubleshooting session

- latestmin

Time window for the troubleshooting session starting from start time (in minutes)

- description

Description about the session

atomiccounter API

To create an endpoint (ep) to endpoint atomic counter session, use the atomiccounter API. The module name is troubleshoot.eptoeputils.atomiccounter and the function is manageAtomicCounterPols.

The required arguments (req_args) for the atomiccounter API include:

  • - session

  • - action

  • - mode


Note


There are no optional arguments (opt_args) for the atomiccounter API.

traceroute API

To create an endpoint (ep) to endpoint traceroute session using the API, use the traceroute API. The module name is troubleshoot.eptoeputils.traceroute and the function is manageTraceroutePols.

The required arguments (req_args) for the traceroute API include:

  • - session (session name)

  • - action (start/stop/status)

  • - mode

Syntax Description

Optional Arguments (opt_args) Description

- protocol

Protocol name

- dstport

Destination port name

span API

To create an endpoint (ep) to endpoint span troubleshooting session, use the span API. The module name is troubleshoot.eptoeputils.span and the function is monitor.

The required arguments (req_args) for the span API include:

  • - session (session name)

  • - action (start/stop/status)

The following table lists the optional arguments (opt_args) and descriptions for each.

Syntax Description

Optional Arguments (opt_args) Description

- srcep

Source endpoint name

- dstep

Destination endpoint name

- srcip

Source endpoint IP address

- dstip

Destination endpoint IP address

- srcmac

Source endpoint MAC

- dstmac

Destination endpoint MAC

- srcextip

L3 external source IP address

- dstextip

L3 external destination IP address

- starttime

Start time of the troubleshooting session

- endtime

End time of the troubleshooting session

- latestmin

Time window for the troubleshooting session starting from start time (in minutes)

- description

Description about the session

- scheduler

Scheduler name for report generation

- srcepid

Obsolete

- dstepid

Obsolete

- include

Obsolete

- format

Format of report to be generated

- ui

Used internally (ignore)

- sessionurl

Location of the report

-action

Start/stop/status etc. for traceroute/atomiccounter

- srctenant

Name of the tenant for the source endpoint

- srcapp

Name of the app for the source endpoint

- srcepg

Name of the endpoint group for the source endpoint

- dsttenant

Name of the tenant for the destination endpoint

- dstapp

Name of the app for the destination endpoint

- dstepg

Name of the endpoint group for the destination endpoint

- mode

Used internally

- _dc

Used internally

- ctx

Used internally

generatereport API

To generate a troubleshooting report using the API, use the generatereport API. The module name is troubleshoot.eptoeputils.report and the function is generateReport.

The required arguments (req_args) for the generatereport API are - session (session name) and - mode.

The following table lists the optional arguments (opt_args) and descriptions for each.

Syntax Description

Optional Arguments (opt_args) Description

- include

Obsolete

- format

Format of report to be generated

schedulereport API

To schedule the generation of a troubleshooting report using the API, use the schedulereport API. The module name is troubleshoot.eptoeputils.report and the function is scheduleReport. The required argument (req_args) for the schedulereport API is - session

The required arguments (req_args) for the schedulereport API include:

  • - session (session name)

  • - scheduler (scheduler name)

  • - mode

The following table lists the optional arguments (opt_args) and descriptions for each.

Syntax Description

Optional Arguments (opt_args) Description

- starttime

Start time of the troubleshooting session

- endtime

End time of the troubleshooting session

- latestmin

Time window for the troubleshooting session starting from start time (in minutes)

- include

Obsolete

- format

Format of report to be generated

- action

Start/stop/status etc. for traceroute/atomiccounter

getreportstatus API

To get the status of a generated report using the API, use the getreportstatus API. The module name is troubleshoot.eptoeputils.report and the function is getStatus.

The required arguments (req_args) for the getreportstatus API include:

  • - session (session name)

  • - sessionurl (session URL)

  • - mode


Note


There are no optional arguments (opt_args) for the getreportstatus API.

getreportslist API

To get a list of generated reports using the API, use the getreportslist API. The module name is troubleshoot.eptoeputils.report and the function is getReportsList.

The required arguments (req_args) for the getreportslist API are- session (session name) and - mode.


Note


There are no optional arguments (opt_args) for the getreportslist API.

getsessionslist API

To get a list of troubleshooting sessions using the API, use the getsessionslist API. The module name is troubleshoot.eptoeputils.session and the function is getSessions.

The required argument (req_args) for the getsessionlist API is - mode.


Note


There are no optional arguments (opt_args) for the getsessionlist API.

getsessiondetail API

To get specific details about a troubleshooting session using the API, use the getsessiondetail API. The module name is troubleshoot.eptoeputils.session and the function is getSessionDetail.

The required arguments (req_args) for the getsessiondetail API are - session (session name) and - mode.


Note


There are no optional arguments (opt_args) for the getsessiondetail API.

deletesession API

To delete a particular troubleshooting session using the API, use the deletesession API. The module name is troubleshoot.eptoeputils.session and the function is deleteSession.

The required argument (req_args) for the deletesession API is - session (session name).

The following table lists the optional arguments (opt_args) and descriptions for each.

Syntax Description

Optional Arguments (opt_args) Description

- srcep

Source endpoint name

- dstep

Destination endpoint name

- srcip

Source endpoint IP address

- dstip

Destination endpoint IP address

- srcmac

Source endpoint MAC

- dstmac

Destination endpoint MAC

- srcextip

L3 external source IP address

- dstextip

L3 external destination IP address

- starttime

Start time of the troubleshooting session

- endtime

End time of the troubleshooting session

- latestmin

Time window for the troubleshooting session starting from start time (in minutes)

- description

Description about the session

- scheduler

Scheduler name for report generation

- srcepid

Obsolete

- dstepid

Obsolete

- include

Obsolete

- format

Format of report to be generated

- ui

Used internally (ignore)

- sessionurl

Location of report

- action

Start/stop/status etc. for traceroute/atomiccounter

- mode

Used internally

- _dc

Used internally

- ctx

Used internally

clearreports API

To clear the list of generated reports using the API, use the clearreports API. The module name is troubleshoot.eptoeputils.report and the function is clearReports.

The required arguments (req_args) for the clearreports API are- session (session name) and - mode.

Note


There are no optional arguments (opt_args) for the clearreports API.

contracts API

To get contracts information using the API, use the contracts API. The module name is troubleshoot.eptoeputils.contracts and the function is getContracts.

The required arguments (req_args) for the contracts API are- session (session name) and -mode.

There are no optional arguments (opt_args) for the contracts API.

interactive API

To create an endpoint (ep) to Layer 3 (L3) external interactive troubleshooting session, use the interactive API. The module name is troubleshoot.epextutils.epext_topo and the function is getTopo. The required arguments (req_args) for the interactive API are - session, - include, and - mode.

The following table shows the optional argument (opt_args):

Syntax Description

Optional Arguments (opt_args) Description

- refresh

createsession API

To create an endpoint (Ep) to Layer 3 (L3) external troubleshooting session using the API, use the createsession API. The module name is troubleshoot.epextutils.epextsession and the function is createSession. The required argument (req_args) for the createsession API is - session (session name).

The following table lists the optional arguments (opt_args) and descriptions for each.

Syntax Description

Optional Arguments (opt_args) Description

- srcep

Source endpoint name

- dstep

Destination endpoint name

- srcip

Source endpoint IP address

- dstip

Destination endpoint IP address

- srcmac

Source endpoint MAC

- dstmac

Destination endpoint MAC

- srcextip

L3 external source IP address

- dstextip

L3 external destination IP address

- starttime

Start time of the troubleshooting session

- endtime

End time of the troubleshooting session

- latestmin

Time window for the troubleshooting session starting from start time (in minutes)

- description

Description about the session

- scheduler

Scheduler name for report generation

- srcepid

Obsolete

- dstepid

Obsolete

- include

Obsolete

- format

Format of report to be generated

- ui

Used internally (ignore)

- sessionurl

Location of the report

-action

Start/stop/status etc. for traceroute/atomiccounter

- mode

Used internally

- _dc

Used internally

- ctx

Used internally

modifysession API

To modify an endpoint (Ep) to Layer 3 (L3) external troubleshooting session, use the modifysession API. The module name is troubleshoot.epextutils.epextsessionand the function is modifySession. The required argument (req_args) for the modifysession API is - session (session name).

The following table lists the optional arguments (opt_args) and descriptions for each.

Syntax Description

Optional Arguments (opt_args) Description

- srcep

Source endpoint name

- dstep

Destination endpoint name

- srcip

Source endpoint IP address

- dstip

Destination endpoint IP address

- srcmac

Source endpoint MAC

- dstmac

Destination endpoint MAC

- srcextip

L3 external source IP address

- dstextip

L3 external destination IP address

- starttime

Start time of the troubleshooting session

- endtime

End time of the troubleshooting session

- latestmin

Time window for the troubleshooting session starting from start time (in minutes)

- description

Description about the session

- scheduler

Scheduler name for report generation

- srcepid

Obsolete

- dstepid

Obsolete

- include

Obsolete

- format

Format of report to be generated

- ui

Used internally (ignore)

- sessionurl

Location of the report

-action

Start/stop/status etc. for traceroute/atomiccounter

- mode

Used internally

- _dc

Used internally

- ctx

Used internally

atomiccounter API

To create an endpoint (ep) to endpoint atomic counter session, use the atomiccounter API. The module name is troubleshoot.epextutils.epext_ac and the function is manageAtomicCounterPols.

The required arguments (req_args) for the atomiccounter API include:

  • - session (session name)

  • - action (start/stop/status)

The following table lists the optional arguments (opt_args) and descriptions for each.

Syntax Description

Optional Arguments (opt_args) Description

- srcep

Source endpoint name

- dstep

Destination endpoint name

- srcip

Source endpoint IP address

- dstip

Destination endpoint IP address

- srcmac

Source endpoint MAC

- dstmac

Destination endpoint MAC

- srcextip

L3 external source IP address

- dstextip

L3 external destination IP address

- starttime

Start time of the troubleshooting session

- endtime

End time of the troubleshooting session

- latestmin

Time window for the troubleshooting session starting from start time (in minutes)

- ui

Used internally (ignore)

- mode

Used internally

- _dc

Used internally

- ctx

Used internally

traceroute API

To create an endpoint (ep) to to Layer 3 external traceroute troubleshooting session using the API, use the traceroute API. The module name is troubleshoot.epextutils.epext_traceroute and the function is manageTraceroutePols.

The required arguments (req_args) for the traceroute API include:

  • - session (session name)

  • - action (start/stop/status)

Syntax Description

Optional Arguments (opt_args) Description

- protocol

Protocol name

- dstport

Destination port name

- srcep

Source endpoint

- dstep

Destination endpoint

- srcip

Source IP address

- dstip

Destination IP address

- srcextip

Source external IP address

- dstIp

Destination external IP address

- ui

Used internally (ignore)

- mode

Used internally

- _dc

Used internally

- ctx

Used internally

span API

To create an endpoint (Ep) to Layer 3 (L3) external span troubleshooting session, use the span API. The module name is troubleshoot.epextutils.epext_span and the function is monitor.

The required arguments (req_args) for the span API include:

  • - session (session name)

  • - action (start/stop/status)

  • - mode

The following table lists the optional arguments (opt_args) and descriptions for each.

Syntax Description

Optional Arguments (opt_args) Description

- portslist

List of ports

- dstapic

Destination APIC

- srcipprefix

Source endpoint IP address prefix

- flowid

Flow ID

- dstepg

Destination endpoint group

- dstip

Destination endpoint IP address

- analyser

???

- desttype

Destination type

- spansrcports

Span source ports

generatereport API

To generate a troubleshooting report using the API, use the generatereport API. The module name is troubleshoot.eptoeputils.report and the function is generateReport.

The required argument (req_args) for the generatereport API is - session (session name).

The following table lists the optional arguments (opt_args) and descriptions for each.

Syntax Description

Optional Arguments (opt_args) Description

- srcep

Source endpoint name

- dstep

Destination endpoint name

- srcip

Source endpoint IP address

- dstip

Destination endpoint IP address

- srcmac

Source endpoint MAC

- dstmac

Destination endpoint MAC

- srcextip

L3 external source IP address

- dstextip

L3 external destination IP address

- starttime

Start time of the troubleshooting session

- endtime

End time of the troubleshooting session

- latestmin

Time window for the troubleshooting session starting from start time (in minutes)

- description

Description about the session

- scheduler

Scheduler name for report generation

- srcepid

Obsolete

- dstepid

Obsolete

- include

Obsolete

- format

Format of report to be generated

- ui

Used internally (ignore)

- sessionurl

Location of the report

-action

Start/stop/status etc. for traceroute/atomiccounter

- mode

Used internally

- _dc

Used internally

- ctx

Used internally

schedulereport API

To schedule the generation of a troubleshooting report using the API, use the schedulereport API. The module name is troubleshoot.eptoeputils.report and the function is scheduleReport. The required argument (req_args) for the schedulereport API is - session

The required arguments (req_args) for the schedulereport API include:

  • - session (session name)

  • - scheduler (scheduler name)

The following table lists the optional arguments (opt_args) and descriptions for each.

Syntax Description

Optional Arguments (opt_args) Description

- srcep

Source endpoint

- dstep

Destination endpoint

- srcip

Source endpoint IP address

- dstip

Destination endpoint IP address

- srcmac

Source endpoint MAC

- dstmac

Destination endpoint MAC

- srcextip

L3 external source IP address

- dstextip

L3 external destination IP address

- starttime

Start time of the troubleshooting session

- endtime

End time of the troubleshooting session

- latestmin

Time window for the troubleshooting session starting from start time (in minutes)

- description

Description about the session

- srcepid

Obsolete

- dstepid

Obsolete

- include

Obsolete

- format

Format of report to be generated

- ui

Used internally (ignore)

- sessionurl

Location of the report

-action

Start/stop/status etc. for traceroute/atomiccounter

- mode

Used internally

- _dc

Used internally

- ctx

Used internally

getreportstatus API

To get the status of a generated report using the API, use the getreportstatus API. The module name is troubleshoot.eptoeputils.report and the function is getStatus.

The required arguments (req_args) for the getreportstatus API include:

  • - session (session name)

  • - sessionurl (session URL)

  • - mode


Note


There are no optional arguments (opt_args) for the getreportstatus API.

getreportslist API

To get a list of generated reports using the API, use the getreportslist API. The module name is troubleshoot.eptoeputils.report and the function is getReportsList.

The required arguments (req_args) for the getreportslist API are- session (session name) and - mode.


Note


There are no optional arguments (opt_args) for the getreportslist API.

getsessionslist API

To get a list of troubleshooting sessions using the API, use the getsessionslist API. The module name is troubleshoot.epextutils.epextsession and the function is getSessions.


Note


There are no required arguments for this API.

The following table lists the optional arguments (opt_args) and descriptions for each.

Syntax Description

Optional Arguments (opt_args) Description

- session

Session name

- srcep

Source endpoint name

- dstep

Destination endpoint name

- srcip

Source endpoint IP address

- dstip

Destination endpoint IP address

- srcmac

Source endpoint MAC

- dstmac

Destination endpoint MAC

- srcextip

L3 external source IP address

- dstextip

L3 external destination IP address

- starttime

Start time of the troubleshooting session

- endtime

End time of the troubleshooting session

- latestmin

Time window for the troubleshooting session starting from start time (in minutes)

- description

Description about the session

- scheduler

Scheduler name for report generation

- srcepid

Obsolete

- dstepid

Obsolete

- include

Obsolete

- format

Format of report to be generated

- ui

Used internally (ignore)

- sessionurl

Location of report

- action

Start/stop/status etc. for traceroute/atomiccounter

- mode

Used internally

- _dc

Used internally

- ctx

Used internally

getsessiondetail API

To get specific details about a troubleshooting session using the API, use the getsessiondetail API. The module name is troubleshoot.epextutils.session and the function is getSessionDetail. The required argument (req_args) for the getsessiondetail API is - session (session name).

The following table lists the optional arguments (opt_args) and descriptions for each.

Syntax Description

Optional Arguments (opt_args) Description

- srcep

Source endpoint name

- dstep

Destination endpoint name

- srcip

Source endpoint IP address

- dstip

Destination endpoint IP address

- srcmac

Source endpoint MAC

- dstmac

Destination endpoint MAC

- srcextip

L3 external source IP address

- dstextip

L3 external destination IP address

- starttime

Start time of the troubleshooting session

- endtime

End time of the troubleshooting session

- latestmin

Time window for the troubleshooting session starting from start time (in minutes)

- description

Description about the session

- scheduler

Scheduler name for report generation

- srcepid

Obsolete

- dstepid

Obsolete

- include

Obsolete

- format

Format of report to be generated

- ui

Used internally (ignore)

- sessionurl

Location of report

- action

Start/stop/status etc. for traceroute/atomiccounter

- mode

Used internally

- _dc

Used internally

- ctx

Used internally

deletesession API

To delete a particular troubleshooting session using the API, use the deletesession API. The module name is troubleshoot.epextutils.epextsession and the function is deleteSession.

The required arguments (req_args) for the deletesession API are - session (session name) and - mode.


Note


There are no optional arguments (opt_args) for the deletesession API.

clearreports API

To clear the list of generated reports using the API, use the clearreports API. The module name is troubleshoot.eptoeputils.report and the function is clearReports.

The required arguments (req_args) for the clearreports API are- session (session name) and - mode.

Note


There are no optional arguments (opt_args) for the clearreports API.

contracts API

To get contracts information using the API, use the contracts API. The module name is troubleshoot.epextutils.epext_contracts and the function is getContracts. The required argument (req_args) for the contracts API is - session (session name).

The following table lists the optional arguments (opt_args) and descriptions for each.

Syntax Description

Optional Arguments (opt_args) Description

- srcep

Source endpoint name

- dstep

Destination endpoint name

- srcip

Source endpoint IP address

- dstip

Destination endpoint IP address

- srcmac

Source endpoint MAC

- dstmac

Destination endpoint MAC

- srcextip

L3 external source IP address

- dstextip

L3 external destination IP address

- starttime

Start time of the troubleshooting session

- endtime

End time of the troubleshooting session

- latestmin

Time window for the troubleshooting session starting from start time (in minutes)

- epext

Endpoint to external

- mode

Used internally

- _dc

Used internally

- ctx

Used internally

- ui

Used internally (ignore)

ratelimit API

This section provides information on the the ratelimit API. The module name is troubleshoot.eptoeputils.ratelimit and the function is control. The required argument (req_args) for the ratelimit API is - action (start/stop/status).

The following table lists the optional arguments (opt_args) and descriptions for each.

Syntax Description

Optional Arguments (opt_args) Description

- srcep

Source endpoint name

- dstep

Destination endpoint name

- srcip

Source endpoint IP address

- dstip

Destination endpoint IP address

- srcmac

Source endpoint MAC

- dstmac

Destination endpoint MAC

- srcextip

L3 external source IP address

- dstextip

L3 external destination IP address

- starttime

Start time of the troubleshooting session

- endtime

End time of the troubleshooting session

- latestmin

Time window for the troubleshooting session starting from start time (in minutes)

- epext

Endpoint to external

- mode

Used internally

- _dc

Used internally

- ctx

Used internally

13ext API

This section provides information on the the 13ext API. The module name is troubleshoot.epextutils.l3ext and the function is execute. The required argument (req_args) for the 13ext API is - action (start/stop/status).

The following table lists the optional arguments (opt_args) and descriptions for each.

Syntax Description

Optional Arguments (opt_args) Description

- srcep

Source endpoint name

- dstep

Destination endpoint name

- srcip

Source endpoint IP address

- dstip

Destination endpoint IP address

- srcmac

Source endpoint MAC

- dstmac

Destination endpoint MAC

- srcextip

L3 external source IP address

- dstextip

L3 external destination IP address

- starttime

Start time of the troubleshooting session

- endtime

End time of the troubleshooting session

- latestmin

Time window for the troubleshooting session starting from start time (in minutes)

- epext

Endpoint to external

- mode

Used internally