Provisioning Core Services

DHCP

Configuring a DHCP Relay Policy

A DHCP relay policy may be used when the DHCP client and server are in different subnets. If the client is on an ESX hypervisor with a deployed vShield Domain profile, then the use of a DHCP relay policy configuration is mandatory.

When a vShield controller deploys a Virtual Extensible Local Area Network (VXLAN), the hypervisor hosts create a kernel (vmkN, virtual tunnel end-point [VTEP]) interface. These interfaces need an IP address in the infrastructure tenant that uses DHCP. Therefore, you must configure a DHCP relay policy so that the Cisco Application Policy Infrastructure Controller (APIC) can act as the DHCP server and provide these IP addresses.

When a Cisco Application Centric Infrastructure (ACI) fabric acts as a DHCP relay, it inserts the DHCP Option 82 (the DHCP Relay Agent Information Option) in DHCP requests that it proxies on behalf of clients. If a response (DHCP offer) comes back from a DHCP server without Option 82, it is silently dropped by the fabric. Therefore, when the Cisco ACI fabric acts as a DHCP relay, DHCP servers providing IP addresses to compute nodes attached to the Cisco ACI fabric must support Option 82.

Create a Global DHCP Relay Policy

The global DHCP Relay policy identifies the DHCP Server for the fabric.

Procedure


Step 1

On the menu bar, click Fabric > Access Policies.

Step 2

On the navigation bar, expand Policies and Global.

Step 3

Right-click DHCP Relay and choose Create DHCP Relay Policy.

Step 4

Enter a name for the policy.

Step 5

Click the + icon on Providers.

Step 6

Choose the EPG type, and for an application EPG, choose the tenant, application profile, and the EPG to be the provider.

Step 7

In the DHCP Server Address field, enter the IP address for the server.

Step 8

Click OK.


Configuring a DHCP Server Policy for the APIC Infrastructure Using the REST API

  • This task is a prerequisite for users who want to create a vShield domain profile.

  • The port and the encapsulation used by the application endpoint group must belong to a physical or VM Manager (VMM) domain. If no such association with a domain is established, the Cisco Application Policy Infrastructure Controller (APIC) continues to deploy the EPG but raises a fault.

  • Cisco APIC supports DHCP relay for both IPv4 and IPv6 tenant subnets. DHCP server addresses can be IPv4 or IPv6. DHCPv6 relay will occur only if IPv6 is enabled on the fabric interface and one or more DHCPv6 relay servers are configured.

Before you begin

Make sure that Layer 2 or Layer 3 management connectivity is configured.

Procedure


Configure the Cisco APIC as the DHCP server policy for the infrastructure tenant.

Note


This relay policy will be pushed to all the leaf ports that are connected hypervisors using the attach entity profile configuration. For details about configuring with attach entity profile, see the examples related to creating VMM domain profiles.

Example:

DHCP Relay Policy for EPG
<!-- api/policymgr/mo/.xml -->
<polUni>

POST https://apic-ip-address/api/mo/uni.xml


  <fvTenant name="infra">

    <dhcpRelayP name="DhcpRelayP"  owner="tenant">
      <dhcpRsProv tDn="uni/tn-infra/ap-access/epg-default" addr="10.0.0.1" />
    </dhcpRelayP>

    <fvBD name="default">
      <dhcpLbl name="DhcpRelayP" owner="tenant"/>
    </fvBD>

  </fvTenant>
</polUni>

Example:

DHCP Relay Policy for Layer 3 Outside

Note


You must specify DHCP Relay label under l3extLIfP with an appropriate name and owner.

<polUni>
  <fvTenant name="dhcpTn">
    <l3extOut name="Out1" >
      <l3extLNodeP name="NodeP" >
        <l3extLIfP name="Intf1">
           <dhcpLbl name="DhcpRelayPol" owner="tenant" />
       </l3extLIfP>
     </l3extLNodeP>
   </l3extOut>
 </fvTenant>
<polUni>

POST https://apic-ip-address/api/mo/uni.xml

Layer 2 and Layer 3 DHCP Relay Sample Policies

This sample policy provides an example of a consumer tenant L3extOut DHCP relay configuration:

<polUni>
    <!-- Consumer Tenant 2 -->
	<fvTenant
		dn="uni/tn-tenant1"
		name="tenant1">
		<fvCtx name="dhcp"/>
		
        <!-- DHCP client bridge domain -->
		<fvBD name="cons2">
            <fvRsBDToOut tnL3extOutName='L3OUT'/>
			<fvRsCtx tnFvCtxName="dhcp" />
            <fvSubnet ip="20.20.20.1/24"/>
            <dhcpLbl name="DhcpRelayP" owner="tenant"/>
		</fvBD>
        <!--  L3Out EPG DHCP  -->
		<l3extOut name="L3OUT">  
        	<l3extRsEctx tnFvCtxName="dhcp"/>
        	<l3extInstP name="l3extInstP-1">
            	<!-- Allowed routes to L3out to send traffic  -->
            	<l3extSubnet ip="100.100.100.0/24" />
        	</l3extInstP>
        	<l3extLNodeP name="l3extLNodeP-pc">
        		<!-- VRF External loopback interface on node -->
            	<l3extRsNodeL3OutAtt 
                  tDn="topology/pod-1/node-1018" 
                  rtrId="10.10.10.1" />                        
           		<l3extLIfP name='l3extLIfP-pc'>
                  <l3extRsPathL3OutAtt 
                       tDn="topology/pod-1/paths-1018/pathep-[eth1/7]" 
                       encap='vlan-900' 
                       ifInstT='sub-interface' 
                       addr="100.100.100.50/24" 
                       mtu="1500"/>
            	</l3extLIfP>                    
        	</l3extLNodeP>        
    	</l3extOut>
		<!-- Static DHCP Client Configuration -->
		<fvAp name="cons2">
	       <fvAEPg name="APP">
	       	<fvRsBd tnFvBDName="cons2"/>	
            	<fvRsDomAtt tDn="uni/phys-mininet"/>
              	<fvRsPathAtt 
                    tDn="topology/pod-1/paths-1017/pathep-[eth1/3]" 
                    encap="vlan-1000" 
                    instrImedcy='immediate' 
                    mode='native'/>
        </fvAEPg>				
		</fvAp>	
        <!-- DHCP Server Configuration -->
        <dhcpRelayP 
             name="DhcpRelayP" 
             owner="tenant" 
             mode="visible">
      		     <dhcpRsProv 
                  tDn="uni/tn-tenant1/out-L3OUT/instP-l3extInstP-1" 
                  addr="100.100.100.1"/>
    	   </dhcpRelayP> 
	</fvTenant>
</polUni>

This sample policy provides an example of a consumer tenant L2extOut DHCP relay configuration:

<fvTenant
		dn="uni/tn-dhcpl2Out"
		name="dhcpl2Out">
		<fvCtx name="dhcpl2Out"/>
              <!-- bridge domain -->
        
		<fvBD name="provBD">
			<fvRsCtx tnFvCtxName="dhcpl2Out" />
                        <fvSubnet ip="100.100.100.50/24" scope="shared"/>
		</fvBD>
		
		<!-- Consumer bridge domain -->
		<fvBD name="cons2">
			<fvRsCtx tnFvCtxName="dhcpl2Out" />
                        <fvSubnet ip="20.20.20.1/24"/>
                       <dhcpLbl name="DhcpRelayP" owner="tenant"/>
		</fvBD>
        
              <vzFilter name='t0f0' >
        	     <vzEntry name='t0f0e9'></vzEntry>
              </vzFilter>  
        
              <vzBrCP name="webCtrct" scope="global">
        	      <vzSubj name="app">
            	            <vzRsSubjFiltAtt tnVzFilterName="t0f0"/>
                     </vzSubj>
              </vzBrCP>
        
	     <l2extOut name="l2Out">
      		    <l2extLNodeP name='l2ext'>
         		<l2extLIfP name='l2LifP'>
          			<l2extRsPathL2OutAtt tDn="topology/pod-1/paths-1018/pathep-[eth1/7]"/>
         		</l2extLIfP>
      		        </l2extLNodeP>
   			     <l2extInstP name='l2inst'>
                                  <fvRsProv tnVzBrCPName="webCtrct"/>
   			     </l2extInstP>
   			<l2extRsEBd tnFvBDName="provBD" encap='vlan-900'/>
   		</l2extOut>
   		
   		<fvAp name="cons2">
	       <fvAEPg name="APP">
	       	<fvRsBd tnFvBDName="cons2" />	
            	<fvRsDomAtt tDn="uni/phys-mininet" />
                <fvRsBd tnFvBDName="SolarBD2" />
                <fvRsPathAtt tDn="topology/pod-1/paths-1018/pathep-[eth1/48]" encap="vlan-1000" instrImedcy='immediate' mode='native'/>
            </fvAEPg>				
		</fvAp>	
        <dhcpRelayP name="DhcpRelayP" owner="tenant" mode="visible">
      		<dhcpRsProv tDn="uni/tn-dhcpl2Out/l2out-l2Out/instP-l2inst" addr="100.100.100.1"/>
    	</dhcpRelayP>        
</fvTenant> 

DNS

DNS

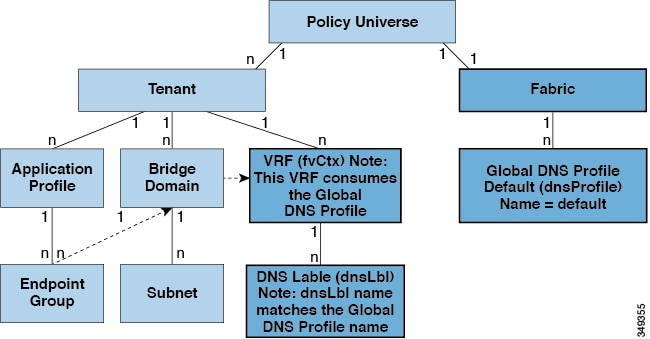
The ACI fabric DNS service is contained in the fabric managed object. The fabric global default DNS profile can be accessed throughout the fabric. The figure below shows the logical relationships of the DNS-managed objects within the fabric.

Figure 1. DNS


A VRF (context) must contain a dnsLBL object in order to use the global default DNS service. Label matching enables tenant VRFs to consume the global DNS provider. Because the name of the global DNS profile is “default,” the VRF label name is "default" (dnsLBL name = default).

Configuring a DNS Service Policy to Connect with DNS Providers Using the REST API

Before you begin

Make sure that Layer 2 or Layer 3 management connectivity is configured.

Procedure


Step 1

Configure the DNS service policy.

Example:

POST URL :
https://apic-IP-address/api/node/mo/uni/fabric.xml

<dnsProfile name="default">

    <dnsProv addr="172.21.157.5" preferred="yes"/>
    <dnsProv addr="172.21.157.6"/>

    <dnsDomain name="cisco.com" isDefault="yes"/>
    
    <dnsRsProfileToEpg tDn="uni/tn-mgmt/mgmtp-default/oob-default"/>

</dnsProfile>

Step 2

Configure the DNS label under the out-of-band management tenant.

Example:

POST URL: https://apic-IP-address/api/node/mo/uni/tn-mgmt/ctx-oob.xml
<dnsLbl name="default" tag="yellow-green"/>

DNS Policy Example

This sample policy creates a DNS profile and associates it with a tenant.


Create the DNS profile:
<!-- /api/policymgr/mo/.xml -->
<polUni>
<fabricInst>
<dnsProfile name="default">
    <dnsProv addr="172.21.157.5" preferred="yes"/>
    <dnsDomain name="insieme.local" isDefault="yes"/>
    <dnsRsProfileToEpg tDn="uni/tn-mgmt/mgmtp-default/oob-default"/>
</dnsProfile>
</fabricInst>
</polUni>

Associate the profile with the tenant that will consume it:
<!-- /api/policymgr/mo/.xml -->
<polUni>
<fvTenant name=’t1’>
  <fvCtx name=’ctx0’>
    <dnsLbl name=’default’/>
  </fvCtx>
</fvTenant>
</polUni>

NTP

Time Synchronization and NTP

Within the Cisco Application Centric Infrastructure (ACI) fabric, time synchronization is a crucial capability upon which many of the monitoring, operational, and troubleshooting tasks depend. Clock synchronization is important for proper analysis of traffic flows as well as for correlating debug and fault time stamps across multiple fabric nodes.

An offset present on one or more devices can hamper the ability to properly diagnose and resolve many common operational issues. In addition, clock synchronization allows for the full utilization of the atomic counter capability that is built into the ACI upon which the application health scores depend. Nonexistent or improper configuration of time synchronization does not necessarily trigger a fault or a low health score. You should configure time synchronization before deploying a full fabric or applications so as to enable proper usage of these features. The most widely adapted method for synchronizing a device clock is to use Network Time Protocol (NTP).

Prior to configuring NTP, consider what management IP address scheme is in place within the ACI fabric. There are two options for configuring management of all ACI nodes and Application Policy Infrastructure Controllers (APICs), in-band management and/or out-of-band management. Depending upon which management option is chosen for the fabric, configuration of NTP will vary. Another consideration in deploying time synchronization is where the time source is located. The reliability of the source must be carefully considered when determining if you will use a private internal clock or an external public clock.

Configuring NTP Using the REST API


Note


There is a risk of hostname resolution failure for hostname based NTP servers if the DNS server used is configured to be reachable over in-band or out-of-band connectivity. If you use a hostname, ensure that the DNS service policy to connect with the DNS providers is configured. Also ensure that the appropriate DNS label is configured for the in-band or out-of-band VRF instances of the management EPG that you chose when you configured the DNS profile policy.


Procedure


Step 1

Configure NTP.

Example:

POST url: https://APIC-IP/api/node/mo/uni/fabric/time-test.xml

<imdata totalCount="1">
    <datetimePol adminSt="enabled" authSt="disabled" descr="" dn="uni/fabric/time-CiscoNTPPol" name="CiscoNTPPol" ownerKey="" ownerTag="">
        <datetimeNtpProv descr="" keyId="0" maxPoll="6" minPoll="4" name="10.10.10.11" preferred="yes">
            <datetimeRsNtpProvToEpg tDn="uni/tn-mgmt/mgmtp-default/inb-default"/>
        </datetimeNtpProv>
    </datetimePol>
</imdata>

Step 2

Add the default Date Time Policy to the pod policy group.

Example:


POST url: https://APIC-IP/api/node/mo/uni/fabric/funcprof/podpgrp-calo1/rsTimePol.xml

POST payload: <imdata totalCount="1">
<fabricRsTimePol tnDatetimePolName=“CiscoNTPPol”>
</fabricRsTimePol>
</imdata>

Step 3

Add the pod policy group to the default pod profile.

Example:

POST url: https://APIC-IP/api/node/mo/uni/fabric/podprof-default/pods-default-typ-ALL/rspodPGrp.xml

payload: <imdata totalCount="1">
<fabricRsPodPGrp tDn="uni/fabric/funcprof/podpgrp-calo1" status="created">
</fabricRsPodPGrp>
</imdata>

Tetration

Overview

This article provides examples of how to configure Cisco Tetration when using the Cisco APIC. The following information applies when configuring Cisco Tetration.

  • An inband management IP address must be configured on each leaf where the Cisco Tetration agent is active.

  • Define an analytics policy and specify the destination IP address of the Cisco Tetration server.

  • Create a switch profile and include the policy group created in the previous step.

Configuring Cisco Tetration Analytics Using the REST API

Procedure


Step 1

Create the analytics policy.

Example:

<analyticsCluster name="tetration" >
<analyticsCfgSrv name="srv1" ip="10.30.30.7" >
</analyticsCfgSrv>
</analyticsCluster>

Step 2

Associate analytics with the policy group.

Example:

<fabricLeNodePGrp descr="" name="mypolicy6" ownerKey="" ownerTag="" rn="lenodepgrp-mypolicy6" status="">
   <fabricRsNodeCfgSrv rn="rsnodeProv" status="" tDn="uni/fabric/analytics/cluster-tetration/cfgsrv-srv1" />
</fabricLeNodePGrp>

Step 3

Associate the policy group with the switch.

Example:

<fabricLeafP name="leafs" rn="leprof-leafs" status="" >
    <fabricLeafS name="sw" rn="leaves-sw-typ-range" status="">
        <fabricRsLeNodePGrp rn="rsleNodePGrp" tDn="uni/fabric/funcprof/lenodepgrp-mypolicy6"/>
        <fabricNodeBlk name="switches" from_="101" to_="101" />
    </fabricLeafS>
</fabricLeafP>

NetFlow

About NetFlow

The NetFlow technology provides the metering base for a key set of applications, including network traffic accounting, usage-based network billing, network planning, as well as denial of services monitoring, network monitoring, outbound marketing, and data mining for both service providers and enterprise customers. Cisco provides a set of NetFlow applications to collect NetFlow export data, perform data volume reduction, perform post-processing, and provide end-user applications with easy access to NetFlow data. If you have enabled NetFlow monitoring of the traffic flowing through your datacenters, this feature enables you to perform the same level of monitoring of the traffic flowing through the Cisco Application Centric Infrastructure (Cisco ACI) fabric.

Instead of hardware directly exporting the records to a collector, the records are processed in the supervisor engine and are exported to standard NetFlow collectors in the required format.

For information about configuring NetFlow with virtual machine networking, see the Cisco ACI Virtualization Guide.


Note


NetFlow is only supported on EX switches. See the Cisco NX-OS Release Notes for Cisco Nexus 9000 Series ACI-Mode Switches document for the release that you have installed for a list of the supported EX switches.


Configuring a NetFlow Exporter Policy for VM Networking Using the REST API

The following example XML shows how to configure a NetFlow exporter policy for VM networking using the REST API:

<polUni>
    <infraInfra>
        <netflowVmmExporterPol name=“vmExporter1” dstAddr=“2.2.2.2” dstPort=“1234” srcAddr=“4.4.4.4”/>
    </infraInfra>
</polUni>

Configuring NetFlow Infra Selectors Using the REST API

You can use the REST API to configure NetFlow infra selectors. The infra selectors are used for attaching a Netflow monitor to a PHY, port channel, virtual port channel, fabric extender (FEX), or port channel fabric extender (FEXPC) interface.

The following example XML shows how to configure NetFlow infra selectors using the REST API:

<infraInfra>
    <!--Create Monitor Policy /-->
    <netflowMonitorPol name='monitor_policy1' descr='This is a monitor policy.'>
        <netflowRsMonitorToRecord tnNetflowRecordPolName='record_policy1' />
        <!-- A Max of 2 exporters allowed per Monitor Policy /-->
        <netflowRsMonitorToExporter tnNetflowExporterPolName='exporter_policy1' />
        <netflowRsMonitorToExporter tnNetflowExporterPolName='exporter_policy2' />
    </netflowMonitorPol>   
            
    <!--Create Record Policy /-->
    <netflowRecordPol name='record_policy1' descr='This is a record policy.' match='src-ipv4,src-port'/>

    <!--Create Exporter Policy /-->
    <netflowExporterPol name='exporter_policy1' dstAddr='10.10.1.1' srcAddr='10.10.1.10' ver='v9' descr='This is an exporter policy.'>
        <!--Exporter can be behind app EPG or external L3 EPG (InstP) /-->
        <netflowRsExporterToEPg tDn='uni/tn-t1/ap-app1/epg-epg1'/>
        <!--This Ctx needs to be the same Ctx that EPG1’s BD is part of /-->
        <netflowRsExporterToCtx tDn='uni/tn-t1/ctx-ctx1'/>
    </netflowExporterPol>

    <!--Node-level Policy for collection Interval /-->
    <netflowNodePol name='node_policy1' collectIntvl='500' />
    
    <!-- Node Selectors - usual config /-->
    <infraNodeP name="infraNodeP-17" >
        <infraLeafS name="infraLeafS-17" type="range">
            <!-- NOTE: The nodes can also be fex nodes /-->
            <infraNodeBlk name="infraNodeBlk-17" from_="101" to_="101"/>
            <infraRsAccNodePGrp tDn='uni/infra/funcprof/accnodepgrp-nodePGrp1' />
        </infraLeafS>
        <infraRsAccPortP tDn="uni/infra/accportprof-infraAccPortP"/>
    </infraNodeP>

    <!-- Port Selectors - usual config /-->
    <infraAccPortP name="infraAccPortP" >
        <infraHPortS name="infraHPortS" type="range">
            <!-- NOTE: The interfaces can also be Port-channels, fex interfaces or fex PCs /-->
            <infraPortBlk name="infraPortBlk" fromCard="1" toCard="1" fromPort="8" toPort="8"/>
            <infraRsAccBaseGrp tDn="uni/infra/funcprof/accportgrp-infraAccPortGrp"/>
        </infraHPortS>
    </infraAccPortP>

    <!-- Policy Groups - usual config /-->
    <infraFuncP>
        <!-- Node Policy Group - to setup Netflow Node Policy /-->
        <infraAccNodePGrp name='nodePGrp1' >
            <infraRsNetflowNodePol tnNetflowNodePolName='node_policy1' />
        </infraAccNodePGrp>

        <!-- Access Port Policy Group - to setup Netflow Monitor Policy /-->
        <infraAccPortGrp name="infraAccPortGrp" >
            <!--One Monitor Policy per address family (ipv4, ipv6, ce) /-->
            <infraRsNetflowMonitorPol tnNetflowMonitorPolName='monitor_policy1' fltType='ipv4'/>
            <infraRsNetflowMonitorPol tnNetflowMonitorPolName='monitor_policy2' fltType='ipv6'/>
            <infraRsNetflowMonitorPol tnNetflowMonitorPolName=‘monitor_policy2' fltType=‘ce'/>
        </infraAccPortGrp>
    </infraFuncP>
</infraInfra>

Configuring the NetFlow Tenant Hierarchy Using the REST API

You can use the REST API to configure the NetFlow tenant hierarchy. The tenant hierarchy is used for attaching a NetFlow monitor to a bridge domain, Layer 3 sub-interface, or Layer 3 switched virtual interface (SVI).

The following example XML shows how to configure the NetFlow tenant hierarchy using the REST API:

<?xml version="1.0" encoding="UTF-8"?>

<!-- api/policymgr/mo/.xml -->
<polUni>
    <fvTenant name="t1">

        <!--Create Monitor Policy /-->
        <netflowMonitorPol name='monitor_policy1' descr='This is a monitor policy.'>
            <netflowRsMonitorToRecord tnNetflowRecordPolName='record_policy1' />
            <!-- A Max of 2 exporters allowed per Monitor Policy /-->
            <netflowRsMonitorToExporter tnNetflowExporterPolName='exporter_policy1' />
            <netflowRsMonitorToExporter tnNetflowExporterPolName='exporter_policy2' />
        </netflowMonitorPol>
        <!--Create Record Policy /-->
        <netflowRecordPol name='record_policy1' descr='This is a record policy.'/>

        <!--Create Exporter Policy /→
        <netflowExporterPol name='exporter_policy1' dstAddr='10.0.0.1' srcAddr='10.0.0.4'>

            <!--Exporter can be behind app EPG or external L3 EPG (InstP) /-->
            <netflowRsExporterToEPg tDn='uni/tn-t1/ap-app1/epg-epg2'/>
            <!--netflowRsExporterToEPg tDn='uni/tn-t1/out-out1/instP-accountingInst' /-->
            <!--This Ctx needs to be the same Ctx that EPG2’s BD is part of /-->
            <netflowRsExporterToCtx tDn='uni/tn-t1/ctx-ctx1' />
        </netflowExporterPol>
        
        <!--Create 2nd Exporter Policy /-->
        <netflowExporterPol name='exporter_policy2' dstAddr='11.0.0.1' srcAddr='11.0.0.4'>
            <netflowRsExporterToEPg tDn='uni/tn-t1/ap-app1/epg-epg2'/>
            <netflowRsExporterToCtx tDn='uni/tn-t1/ctx-ctx1' />
        </netflowExporterPol>
        
        <fvCtx name="ctx1" />

        <fvBD name="bd1" unkMacUcastAct="proxy" >
            <fvSubnet descr="" ip="11.0.0.0/24"\>
            <fvRsCtx tnFvCtxName="ctx1" />

            <!--One Monitor Policy per address family (ipv4, ipv6, ce) /-->
            <fvRsBDToNetflowMonitorPol tnNetflowMonitorPolName='monitor_policy1' fltType='ipv4'/>     
            <fvRsBDToNetflowMonitorPol tnNetflowMonitorPolName='monitor_policy2' fltType='ipv6'/>       
            <fvRsBDToNetflowMonitorPol tnNetflowMonitorPolName=‘monitor_policy2' fltType='ce'/>
        </fvBD>
        
        <!--Create App EPG /-->
        <fvAp name="app1">
            <fvAEPg name="epg2" >
                <fvRsBd tnFvBDName="bd1" />
                <fvRsPathAtt encap="vlan-20" instrImedcy="lazy" mode="regular" tDn="topology/pod-1/paths-101/pathep-[eth1/20]"/>
            </fvAEPg>
        </fvAp>

        <!--L3 Netflow Config for sub-intf and SVI /-->
        <l3extOut name="out1">
            <l3extLNodeP name="lnodep1" >
                <l3extRsNodeL3OutAtt tDn="topology/pod-1/node-101" rtrId="1.2.3.4" />
                <l3extLIfP name='lifp1'>
                    <!--One Monitor Policy per address family (ipv4, ipv6, ce) /-->
                    <l3extRsLIfPToNetflowMonitorPol tnNetflowMonitorPolName='monitor_policy1' fltType='ipv4' />
                    <l3extRsLIfPToNetflowMonitorPol tnNetflowMonitorPolName='monitor_policy2' fltType='ipv6' />
                    <l3extRsLIfPToNetflowMonitorPol tnNetflowMonitorPolName=‘monitor_policy2' fltType=‘ce' />

                    <!--Sub-interface 1/40.40 on node 101 /-->
                    <l3extRsPathL3OutAtt tDn="topology/pod-1/paths-101/pathep-[eth1/40]" ifInstT='sub-interface' encap='vlan-40' />

                    <!--SVI 50 attached to eth1/25 on node 101 /-->
                    <l3extRsPathL3OutAtt tDn="topology/pod-1/paths-101/pathep-[eth1/25]" ifInstT='external-svi' encap='vlan-50' />   
                </l3extLIfP>
            </l3extLNodeP>

            <!--External L3 EPG for Exporter behind external L3 Network /-->
            <l3extInstP name="accountingInst">
                <l3extSubnet ip="11.0.0.0/24" />
            </l3extInstP>
            <l3extRsEctx tnFvCtxName="ctx1"/>
        </l3extOut>
    </fvTenant>
</polUni>

Consuming a NetFlow Exporter Policy Under a VMM Domain Using the REST API for VMware VDS

The following example XML shows how to consume a NetFlow exporter policy under a VMM domain using the REST API:

<polUni>
    <vmmProvP vendor=“VMware”>
        <vmmDomP name=“mininet”>
            <vmmVSwitchPolicyCont>
                <vmmRsVswitchExporterPol tDn=“uni/infra/vmmexporterpol-vmExporter1” activeFlowTimeOut=“62” idleFlowTimeOut=“16” samplingRate=“1”/>
            </vmmVSwitchPolicyCont>
        </vmmDomP>
    </vmmProvP>
</polUni>

Configuring the NetFlow or Tetration Analytics Priority Using the REST API

You can specify whether to use the NetFlow or Cisco Tetration Analytics feature by setting the FeatureSel attribute of the <fabricNodeControl> element. The FeatureSel attribute can have one of the following values:

  • analytics—Specifies Cisco Tetration Analytics. This is the default value.

  • netflow—Specifies NetFlow.

The following example REST API post specifies for the switch "test1" to use the NetFlow feature:

http://192.168.10.1/api/node/mo/uni/fabric.xml
<fabricNodeControl name="test1" FeatureSel="netflow" />

DOM Statistics

About Digital Optical Monitoring

Real-time digital optical monitoring (DOM) data is collected from SFPs, SFP+, and XFPs periodically and compared with warning and alarm threshold table values. The DOM data collected are transceiver transmit bias current, transceiver transmit power, transceiver receive power, and transceiver power supply voltage.

Enabling Digital Optical Monitoring Using the REST API

Before you can view digital optical monitoring (DOM) statistics about a physical interface, enable DOM on the interface.

To enable DOM using the REST API:

Procedure


Step 1

Create a fabric node control policy (fabricNodeControlPolicy) as in the following example:

<fabricNodeControl dn="uni/fabric/nodecontrol-testdom" name="testdom" control="1" 
rn="nodecontrol-testdom" status="created" />

Step 2

Associate a fabric node control policy to a policy group as follows:


<?xml version="1.0" encoding="UTF-8" ?>
	<fabricLeNodePGrp dn="uni/fabric/funcprof/lenodepgrp-nodegrp2" name="nodegrp2" 
rn="lenodepgrp-nodegrp2" status="created,modified" >

    <fabricRsMonInstFabricPol tnMonFabricPolName="default" status="created,modified" />
    <fabricRsNodeCtrl tnFabricNodeControlName="testdom" status="created,modified" />
    
</fabricLeNodePGrp>

Step 3

Associate a policy group to a switch (in the following example, the switch is 103) as follows:


<?xml version="1.0" encoding="UTF-8" ?>
	<fabricLeafP>
		<attributes>
			<dn>uni/fabric/leprof-leafSwitchProfile</dn>
			<name>leafSwitchProfile</name>
			<rn>leprof-leafSwitchProfile</rn>
			<status>created,modified</status>
		</attributes>
		<children>
			<fabricLeafS>
				<attributes>
					<dn>uni/fabric/leprof-leafSwitchProfile/leaves-test-typ-range</dn>
					<type>range</type>
					<name>test</name>
					<rn>leaves-test-typ-range</rn>
					<status>created,modified</status>
				</attributes>
				<children>
					<fabricNodeBlk>
						<attributes>
							<dn>uni/fabric/leprof-leafSwitchProfile/leaves-test-typ-range/nodeblk-09533c1d228097da</dn>
							<from_>103</from_>
							<to_>103</to_>
							<name>09533c1d228097da</name>
							<rn>nodeblk-09533c1d228097da</rn>
							<status>created,modified</status>
						</attributes>
					</fabricNodeBlk>
				</children>
				<children>
					<fabricRsLeNodePGrp>
						<attributes>
							<tDn>uni/fabric/funcprof/lenodepgrp-nodegrp2</tDn>
							<status>created</status>
						</attributes>
					</fabricRsLeNodePGrp>
				</children>
			</fabricLeafS>
		</children>
	</fabricLeafP>

Syslog

About Syslog

During operation, a fault or event in the Cisco Application Centric Infrastructure (ACI) system can trigger the sending of a system log (syslog) message to the console, to a local file, and to a logging server on another system. A system log message typically contains a subset of information about the fault or event. A system log message can also contain audit log and session log entries.

Note


For a list of syslog messages that the APIC and the fabric nodes can generate, see http://www.cisco.com/c/en/us/td/docs/switches/datacenter/aci/apic/sw/1-x/syslog/guide/aci_syslog/ACI_SysMsg.html.


Many system log messages are specific to the action that a user is performing or the object that a user is configuring or administering. These messages can be the following:

  • Informational messages, providing assistance and tips about the action being performed

  • Warning messages, providing information about system errors related to an object, such as a user account or service profile, that the user is configuring or administering

In order to receive and monitor system log messages, you must specify a syslog destination, which can be the console, a local file, or one or more remote hosts running a syslog server. In addition, you can specify the minimum severity level of messages to be displayed on the console or captured by the file or host. The local file for receiving syslog messages is /var/log/external/messages.

A syslog source can be any object for which an object monitoring policy can be applied. You can specify the minimum severity level of messages to be sent, the items to be included in the syslog messages, and the syslog destination.

You can change the display format for the Syslogs to NX-OS style format.

Additional details about the faults or events that generate these system messages are described in the Cisco APIC Faults, Events, and System Messages Management Guide, and system log messages are listed in the Cisco ACI System Messages Reference Guide.


Note


Not all system log messages indicate problems with your system. Some messages are purely informational, while others may help diagnose problems with communications lines, internal hardware, or the system software.


Configuring a Syslog Group and Destination Using the REST API

This procedure configures syslog data destinations for logging and evaluation. You can export syslog data to the console, to a local file, or to one or more syslog servers in a destination group. This example sends alerts to the console, information to a local file, and warnings to a remote syslog server.

Procedure


To create a syslog group and destination using the REST API, send a post with XML such as the following example:

Example:

<syslogGroup name name="tenant64_SyslogDest" format="aci" dn="uni/fabric/slgroup-tenant64_SyslogDest">
     <syslogConsole name="" format="aci"  severity="alerts" adminState="enabled"/>
     <syslogFile name="" format="aci"  severity="information" adminState="enabled"/>
     <syslogProf  name="syslog" adminState="enabled"/>
     <syslogRemoteDest name="Syslog_remoteDest" format="aci" severity="warnings" 
           adminState="enabled" port="514" host="192.168.100.20" forwardingFacility="local7">
        <fileRsARemoteHostToEpg tDn="uni/tn-mgmt/mgmtp-default/oob-default"/>
     </syslogRemoteDest>
</syslogGroup>

Creating a Syslog Source Using the REST API

A syslog source can be any object for which an object monitoring policy can be applied.

Before you begin

Create a syslog monitoring destination group.

Procedure


To create a syslog source, send a POST request with XML such as the following example:

Example:

<syslogSrc 
    name="VRF64_SyslogSource" minSev="warnings" incl="faults" 
    dn="uni/tn-tenant64/monepg-MonPol1/slsrc-VRF64_SyslogSource">
    <syslogRsDestGroup tDn="uni/fabric/slgroup-tenant64_SyslogDest"/>
</syslogSrc>

Enabling Syslog to Display in NX-OS CLI Format, Using the REST API

By default the Syslog format is RFC 3164 compliant. You can change the default display of Syslogs to NX-OS type format, similar to the following example:
apic1# moquery -c "syslogRemoteDest"
Total Objects shown: 1

# syslog.RemoteDest
host               : 172.23.49.77
adminState         : enabled
childAction        : 
descr              : 
dn                 : uni/fabric/slgroup-syslog-mpod/rdst-172.23.49.77
epgDn              : 
format             : nxos
forwardingFacility : local7
ip                 : 
lcOwn              : local
modTs              : 2016-05-17T16:51:57.231-07:00
monPolDn           : uni/fabric/monfab-default
name               : syslog-dest
operState          : unknown
port               : 514
rn                 : rdst-172.23.49.77
severity           : information
status             : 
uid                : 15374
vrfId              : 0
vrfName            : 

To enable the Syslogs to display in NX-OS type format, perform the following steps, using the REST API.

Procedure


Step 1

Enable the Syslogs to display in NX-OS type format, as in the following example:

POST https://192.168.20.123/api/node/mo/uni/fabric.xml  
<syslogGroup name="DestGrp77" format="nxos"> 
<syslogRemoteDest name="slRmtDest77" host="172.31.138.20" severity="debugging"/> 
</syslogGroup>

The syslogGroup is the Syslog monitoring destination group, the sysLogRemoteDest is the name you previously configured for your Syslog server, and the host is the IP address for the previously configured Syslog server.

Step 2

Set the Syslog format back to the default RFC 3164 format, as in the following example:

POST https://192.168.20.123/api/node/mo/uni/fabric.xml  
<syslogGroup name="DestGrp77" format="aci"> 
<syslogRemoteDest name="slRmtDest77" host="172.31.138.20" severity="debugging"/> 
</syslogGroup>

Data Plane Policing

Overview of Data Plane Policing

Use data plane policing (DPP) to manage bandwidth consumption on Cisco Application Centric Infrastructure (ACI) fabric access interfaces. DPP policies can apply to egress traffic, ingress traffic, or both. DPP monitors the data rates for a particular interface. When the data rate exceeds user-configured values, marking or dropping of packets occurs immediately. Policing does not buffer the traffic; therefore, the transmission delay is not affected. When traffic exceeds the data rate, the Cisco ACI fabric can either drop the packets or mark QoS fields in them.

Before the 3.2 release, the standard behavior for the policer was to be per-EPG member in the case of DPP policy being applied to the EPG, while the same policer was allocated on the leaf switch for the Layer 2 and Layer 3 case. This distinction was done because the DPP policer for Layer 2/Layer 3 case was assumed to be per-interface already, hence it was assumed different interfaces might get different ones. While the per-EPG DPP policy was introduced, it was clear that on a given leaf switch, several members could be present and therefore the policer it made sense to be per-member in order to avoid unwanted drops.

Starting with release 3.2, a clear semantic is given to the Data Plane Policer policy itself, as well as a new flag introducing the sharing-mode setting as presented in the CLI. Essentially, there is no longer an implicit behavior, which is different if the Data Plane Policer is applied to Layer 2/Layer 3 or to per-EPG case. Now the user has the control of the behavior. If the sharing-mode is set to shared, then all the entities on the leaf switch referring to the same Data Plane Policer, will share the same hardware policer. If the sharing-mode is set to dedicated then there would be a different HW policer allocated for each Layer 2 or Layer 3 or EPG member on the leaf switch. The policer is then dedicated to the entity that needs to be policed.

DPP policies can be single-rate, dual-rate, and color-aware. Single-rate policies monitor the committed information rate (CIR) of traffic. Dual-rate policers monitor both CIR and peak information rate (PIR) of traffic. In addition, the system monitors associated burst sizes. Three colors, or conditions, are determined by the policer for each packet depending on the data rate parameters supplied: conform (green), exceed (yellow), or violate (red).

Typically, DPP policies are applied to physical or virtual layer 2 connections for virtual or physical devices such as servers or hypervisors, and on layer 3 connections for routers. DPP policies applied to leaf switch access ports are configured in the fabric access (infra) portion of the Cisco ACI fabric, and must be configured by a fabric administrator. DPP policies applied to interfaces on border leaf switch access ports (l3extOut or l2extOut) are configured in the tenant (fvTenant) portion of the Cisco ACI fabric, and can be configured by a tenant administrator.

The data plane policer can also be applied on an EPG so that traffic that enters the Cisco ACI fabric from a group of endpoints are limited per member access interface of the EPG. This is useful to prevent monopolization of any single EPG where access links are shared by various EPGs.

Only one action can be configured for each condition. For example, a DPP policy can to conform to the data rate of 256000 bits per second, with up to 200 millisecond bursts. The system applies the conform action to traffic that falls within this rate, and it would apply the violate action to traffic that exceeds this rate. Color-aware policies assume that traffic has been previously marked with a color. This information is then used in the actions taken by this type of policer.

For information about traffic storm control, see the Cisco APIC Layer 2 Networking Configuration Guide.
Configuring Data Plane Policing Using the REST API

To police the L2 traffic coming in to the Leaf:


<!--  api/node/mo/uni/.xml  -->
<infraInfra>
<qosDppPol name="infradpp5" burst="2000" rate="2000" be="400" sharingMode="shared"/>
<!--
 List of nodes. Contains leaf selectors. Each leaf selector contains list of node blocks 
-->
<infraNodeP name="leaf1">
<infraLeafS name="leaf1" type="range">
<infraNodeBlk name="leaf1" from_="101" to_="101"/>
</infraLeafS>
<infraRsAccPortP tDn="uni/infra/accportprof-portselector1"/>
</infraNodeP>
<!--
 PortP contains port selectors. Each port selector contains list of ports. It
       also has association to port group policies 
-->
<infraAccPortP name="portselector1">
<infraHPortS name="pselc" type="range">
<infraPortBlk name="blk" fromCard="1" toCard="1" fromPort="48" toPort="49"></infraPortBlk>
<infraRsAccBaseGrp tDn="uni/infra/funcprof/accportgrp-portSet2"/>
</infraHPortS>
</infraAccPortP>
<!--  FuncP contains access bundle group policies  -->
<infraFuncP>
<infraAccPortGrp name="portSet2">
<infraRsQosIngressDppIfPol tnQosDppPolName="infradpp5"/>
</infraAccPortGrp>
</infraFuncP>
</infraInfra>

To police the L2 traffic going out of the Leaf:

<!--  api/node/mo/uni/.xml  -->
<infraInfra>
<qosDppPol name="infradpp2" burst="4000" rate="4000"/>
<!--
 List of nodes. Contains leaf selectors. Each leaf selector contains list of node blocks 
-->
<infraNodeP name="leaf1">
<infraLeafS name="leaf1" type="range">
<infraNodeBlk name="leaf1" from_="101" to_="101"/>
</infraLeafS>
<infraRsAccPortP tDn="uni/infra/accportprof-portselector2"/>
</infraNodeP>
<!--
 PortP contains port selectors. Each port selector contains list of ports. It
       also has association to port group policies 
-->
<infraAccPortP name="portselector2">
<infraHPortS name="pselc" type="range">
<infraPortBlk name="blk" fromCard="1" toCard="1" fromPort="37" toPort="38"></infraPortBlk>
<infraRsAccBaseGrp tDn="uni/infra/funcprof/accportgrp-portSet2"/>
</infraHPortS>
</infraAccPortP>
<!--  FuncP contains access bundle group policies  -->
<infraFuncP>
<infraAccPortGrp name="portSet2">
<infraRsQosEgressDppIfPol tnQosDppPolName="infradpp2"/>
</infraAccPortGrp>
</infraFuncP>
</infraInfra>

To police the L3 traffic coming in to the Leaf:

<!--  api/node/mo/uni/.xml  -->
<fvTenant name="dppTenant">
<qosDppPol name="gmeo" burst="2000" rate="2000"/>
<l3extOut name="Outside">
<l3extInstP name="extroute"/>
<l3extLNodeP name="borderLeaf">
<l3extRsNodeL3OutAtt tDn="topology/pod-1/node-101" rtrId="10.0.0.1">
<ipRouteP ip="0.0.0.0">
<ipNexthopP nhAddr="192.168.62.2"/>
</ipRouteP>
</l3extRsNodeL3OutAtt>
<l3extLIfP name="portProfile">
<l3extRsPathL3OutAtt addr="192.168.40.1/30" ifInstT="l3-port" tDn="topology/pod-1/paths-101/pathep-[eth1/40]"/>
<l3extRsPathL3OutAtt addr="192.168.41.1/30" ifInstT="l3-port" tDn="topology/pod-1/paths-101/pathep-[eth1/41]"/>
<l3extRsIngressQosDppPol tnQosDppPolName="gmeo"/>
</l3extLIfP>
</l3extLNodeP>
</l3extOut>
</fvTenant>

To police the L3 traffic going out of the Leaf:

<!--  api/node/mo/uni/.xml  -->
<fvTenant name="dppTenant">
<qosDppPol name="gmeo" burst="2000" rate="2000"/>
<l3extOut name="Outside">
<l3extInstP name="extroute"/>
<l3extLNodeP name="borderLeaf">
<l3extRsNodeL3OutAtt tDn="topology/pod-1/node-101" rtrId="10.0.0.1">
<ipRouteP ip="0.0.0.0">
<ipNexthopP nhAddr="192.168.62.2"/>
</ipRouteP>
</l3extRsNodeL3OutAtt>
<l3extLIfP name="portProfile">
<l3extRsPathL3OutAtt addr="192.168.40.1/30" ifInstT="l3-port" tDn="topology/pod-1/paths-101/pathep-[eth1/40]"/>
<l3extRsPathL3OutAtt addr="192.168.41.1/30" ifInstT="l3-port" tDn="topology/pod-1/paths-101/pathep-[eth1/41]"/>
<l3extRsEgressQosDppPol tnQosDppPolName="gmeo"/>
</l3extLIfP>
</l3extLNodeP>
</l3extOut>
</fvTenant>

Traffic Storm Control

About Traffic Storm Control

A traffic storm occurs when packets flood the LAN, creating excessive traffic and degrading network performance. You can use traffic storm control policies to prevent disruptions on Layer 2 ports by broadcast, unknown multicast, or unknown unicast traffic storms on physical interfaces.

By default, storm control is not enabled in the ACI fabric. ACI bridge domain (BD) Layer 2 unknown unicast flooding is enabled by default within the BD but can be disabled by an administrator. In that case, a storm control policy only applies to broadcast and unknown multicast traffic. If Layer 2 unknown unicast flooding is enabled in a BD, then a storm control policy applies to Layer 2 unknown unicast flooding in addition to broadcast and unknown multicast traffic.

Traffic storm control (also called traffic suppression) allows you to monitor the levels of incoming broadcast, multicast, and unknown unicast traffic over a one second interval. During this interval, the traffic level, which is expressed either as percentage of the total available bandwidth of the port or as the maximum packets per second allowed on the given port, is compared with the traffic storm control level that you configured. When the ingress traffic reaches the traffic storm control level that is configured on the port, traffic storm control drops the traffic until the interval ends. An administrator can configure a monitoring policy to raise a fault when a storm control threshold is exceeded.

Configuring a Traffic Storm Control Policy Using the REST API

To configure a traffic storm control policy, create a stormctrl:IfPol object with the desired properties.

To create a policy named MyStormPolicy, send this HTTP POST message:

POST https://192.0.20.123/api/mo/uni/infra/stormctrlifp-MyStormPolicy.json

In the body of the POST message, Include the following JSON payload structure to specify the policy by percentage of available bandwidth:


{"stormctrlIfPol":
    {"attributes":
        {"dn":"uni/infra/stormctrlifp-MyStormPolicy",
        "name":"MyStormPolicy",
        "rate":"75",
        "burstRate":"85",
        "rn":"stormctrlifp-MyStormPolicy",
        "status":"created"
        },
        "children":[]
    }
}

In the body of the POST message, Include the following JSON payload structure to specify the policy by packets per second:


{"stormctrlIfPol":
    {"attributes":
        {"dn":"uni/infra/stormctrlifp-MyStormPolicy",
        "name":"MyStormPolicy",
        "ratePps":"12000",
        "burstPps":"15000",
        "rn":"stormctrlifp-MyStormPolicy",
        "status":"created"
        },
        "children":[]
    }
}