Cisco Cloud Control Architecture and Operations
Available Languages
Bias-Free Language
The documentation set for this product strives to use bias-free language. For the purposes of this documentation set, bias-free is defined as language that does not imply discrimination based on age, disability, gender, racial identity, ethnic identity, sexual orientation, socioeconomic status, and intersectionality. Exceptions may be present in the documentation due to language that is hardcoded in the user interfaces of the product software, language used based on RFP documentation, or language that is used by a referenced third-party product. Learn more about how Cisco is using Inclusive Language.
- US/Canada 800-553-2447
- Worldwide Support Phone Numbers
- All Tools
 Feedback
 Feedback
Cisco Cloud Control provides a unified operating environment across Cisco product domains while connected products retain management authority and data ownership. A team establishes a tenant group, links its product tenants, and uses common views of inventory, topology, actions, identity, licensing, and artificial intelligence (AI) assisted investigation. Each observation retains its product and tenant context, allowing the operator to move from a group-wide condition to the responsible source system.
This paper explains the architecture through the Cisco Validated deployment. The deployment links Intersight, Security Cloud Control, ThousandEyes, Splunk Cloud Platform, and two Meraki organizations under a Cisco Cloud Control tenant group. One Meraki organization represents directly managed Meraki infrastructure. The other represents an on-premises Catalyst Center deployment through the Catalyst Cloud and Meraki integration path. Nexus Dashboard information is available through Intersight, and Secure Access information through Security Cloud Control. Cisco Identity Services Engine (ISE) and Duo Security extend the environment through the Identity service by different mechanisms.
The Cisco Validated implementation explains tenant linking, two-sided Catalyst Center activation, the ISE agent and pxGrid path, and read-only Duo activity collection. Its operational case follows recurring wireless authentication failures from Meraki evidence retrieved by Assistant to a matching ISE record and an expired Extensible Authentication Protocol (EAP) server certificate. The ISE owner replaced the certificate, and the original endpoint completed authentication after its operator accepted the replacement certificate prompt. ISE verified the result with Access-Accept and the employee authorization profile. Canvas retains the initial source-labelled handoff.
Cisco Cloud Control Studio extends this deployment with the Cisco Validated Service Access Investigator. The custom application combines live inventory and organization context with supplied event evidence in a read-only case workflow. An authorized replay of the completed wireless case verified chronological ordering and preservation of six historical records, connecting the application’s case-handling functions to the deployment’s own failure and recovery evidence.
Cisco Cloud Control architecture
Product role and architectural boundaries
Cisco Cloud Control sits above the connected product controllers as an operating and investigation layer. The product controller still manages its own devices, policy, and native detail. Cisco Cloud Control links the authorized tenants, receives supported data from those sources, and presents it in common views. This arrangement lets a network operator begin with a group-wide condition and then inspect the responsible product without making Cisco Cloud Control the new source of truth for every underlying configuration.
The architecture has four practical layers. The source layer contains product tenants and their managed objects. The association layer maps those tenants into a Cisco Cloud Control tenant group and enforces access. The data layer collects and normalizes supported inventory, topology, issues, and identity observations. The experience layer exposes those observations through Inventory, Topology, Actions, Identity, Assistant, Canvas, and Workflows. A request is meaningful only when its tenant context, user entitlement, source product, and observation time are known.

Tenant grouping establishes an administrative relationship without transferring ownership from the source systems. A tenant is a product-specific isolated set of data, such as an organization, account, or network. A tenant group brings at least two tenants into one logical Cisco Cloud Control environment. Administrators authenticate to the products they intend to link and accept the associations. Users select the group as their operating scope, subject to their Cisco Cloud Control role and source-product permissions.
Cisco Cloud Control applies two access checks. Its role model determines which platform pages and actions a user can reach; the integrated product's permissions determine which product assets and operations remain available. A Tenant Full Admin can administer the Cisco Cloud Control workspace, but that role does not create access to an unrelated Meraki or Intersight dashboard. A member with narrower product access can see a smaller inventory or topology slice than another user in the same group. This behavior is an architectural property to account for when comparing screenshots or asset totals.
Cisco Identity establishes a common user identity
Cisco User Identity (CUI) associates an operator's accounts across connected products through a verified email address. Existing identity providers (IdPs) continue to authenticate their users; CUI adds email verification to establish the common identity used by Cloud Control. This identity correlation supports product navigation, while Cloud Control roles and source-product permissions determine the operator's access.
The control plane and the data plane should be tested separately. A product tenant can appear in the Admin Console before its supported objects are visible in Inventory; conversely, a previously collected object can remain in a common view for a time after its source stops reporting. The association confirms that the platform knows which tenant to query. A current, source-attributed asset confirms that collection and the operator's access path also work. For operational acceptance, record both observations and the time between them rather than reducing the test to a successful sign-in.
Data collection and freshness
Inventory uses a common collector and product-specific pull or push ingestion. Its synchronization interval is five minutes for ISE through Identity, Nexus Dashboard, and Nexus HyperFabric, and 60 minutes for Meraki, Security Cloud Control, Secure Access, ThousandEyes, Catalyst Center, and several other sources. These intervals describe platform collection cadence, not an end-to-end guarantee that every upstream event appears at a fixed second. Inventory removes an asset after three days without reporting. Operators should therefore pair a count with its product source, selected group, role, and capture time.
The normalized record is the useful unit of analysis. An asset entry can identify its class, platform, status, source, site, issues, and relationships where those fields are supplied. From an asset, the operator can examine related issues, view a topology preview, or open the product record for details that remain native to the controller. The common representation makes cross-domain search possible; source attribution makes the result explainable and routable to the correct owner.
Collection cadence and source timestamp answer different questions. The cadence describes when Cisco Cloud Control checks or receives a class of source data. The source timestamp describes when the underlying product observed the condition. A delayed upstream product can therefore produce a newly collected but old event. During an incident review, the operator should compare both times and avoid treating the page-refresh time as the event time. This distinction matters especially when comparing a five-minute Identity path with hourly product inventory paths in one Canvas investigation.
Identity is a related but distinct data path. Cisco Cloud Control sign-in and tenant access use Cisco identity and role controls. The Identity service separately ingests source observations such as ISE sessions or Duo authentication activity. Connecting ISE or Duo does not create another product child tenant in the Cisco Validated group. Keeping these paths distinct prevents a user total from being confused with a count of network assets or product organizations.
Product services and operational handoff
Home provides a tenant switcher, a nine-dot Main menu, pinned product entries, Assistant, Canvas, Actions, and notifications. The operator can move from a group-wide condition to Inventory or Topology and then into a source product for deeper controller detail. Actions consolidate issues requiring attention; an action detail can carry related alerts, affected objects, recommendations, assignment, and an activity timeline. An operator can open Assistant or a shared Canvas from an action with its context retained.
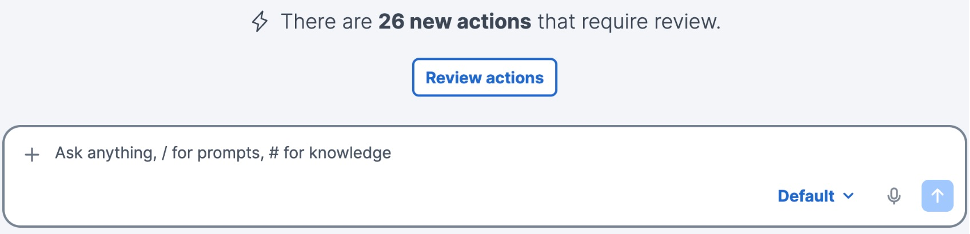
The AI services use the same access context. Assistant handles focused requests through available product agents, and Canvas supports shared, multi-step investigation. Reasoning mode proposes a plan for review before analysis. Default mode supports prompts and available workflows. Agent availability follows entitlements and integrations. Each workflow has inputs, targets, and permissions; selection opens a configuration and review sequence before execution. Studio adds custom applications and agents to this operating model, as the later deployment example demonstrates.
Architectural implications for a deployment
Three decisions shape the deployment. First, administrators must decide which product tenants belong in one operating group and who can see each. Second, they must record the actual data lineage of each visible product domain, especially when a domain is inherited through another platform or represented by a proxy organization. Third, they must define the evidence required to call an integration usable: linked tenant, source reachability, recent collection, visible source-attributed objects, and an authorized operator view. These decisions are easier to make before a team builds AI prompts or workflows around the data.
Cisco Cloud Control operating model
From attention to a source record
The Home page is an operating entry point. Its active tenant selection establishes the scope for what follows, while Actions and notifications draw attention to events that need review. Opening an action exposes the contributing alerts and affected objects; moving to Inventory tests which assets and issues are present in the authorized view. The product interface remains available for device configuration, policy changes, and native evidence. This sequence gives the operator a common starting point without hiding the source controller.
Inventory opens on Insights, which summarizes active issues, security and compliance information, lifecycle runway, and distribution by asset class or platform. Selecting an insight or Show devices moves from the summary to relevant assets. The Assets view supports filters, saved searches, export, detail, and topology preview. AI-powered inventory search translates natural-language criteria into structured filtering, keyword matching, semantic matching, and contextual ranking. A precise asset name or address still belongs in an exact search; exploratory questions benefit from the broader search mode.
Topology organizes the connected estate by sites and relationships. The site view supports health indicators, scoping, and drill-down; device topology exposes supported physical, switched, and routed relationships. A site health label gives a place to start, while the device and link records supply the evidence for a diagnosis. Inventory and Topology can hand an operator between an asset record and the surrounding graph when that asset supports the relationship view.
Actions and notifications have different jobs. Notifications inform the user about activity and can lead to an action. An action is a work item with state, ownership, and a resolution or dismissal decision. Cisco Cloud Control retains notifications and resolved or dismissed actions for 90 days, while the source product may keep its own longer history. The operator should use the action record for immediate work and the source product for history beyond the platform's retained window.
Licensing and administration complete the operating context. Licensing aggregates supported entitlement and consumption information, while the Admin Console manages tenant relationships, users, integrations, settings, and audit records. Neither surface replaces the licensing authority or administrative permissions of the connected products. For a decision such as renewal planning, the relevant license record and its source must be inspected rather than treating a dashboard total as a purchase recommendation.
From source evidence to an assisted investigation
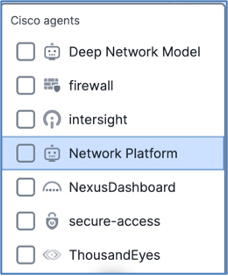
Assistant is suited to a bounded question: identify the affected site, summarize the action, or locate a product-specific asset. Canvas is suited to a question that requires multiple steps, evidence from more than one domain, or collaboration among operators. The user can select one or more available product agents with the agent picker when the relevant expertise is known or allow Assistant's normal routing to choose. The selected agent can inspect the product context available to that user; it does not bypass the source product's access boundary.
Canvas has two operating modes. Reasoning mode creates a plan and asks the user to confirm its scope, products, entities, and time range before the investigation proceeds. Its response can include evidence, processing details, limitations, and visual cards. Default mode supports direct interaction and workflow invocation; workflow invocation is not available in Reasoning mode. A team can investigate in Reasoning mode, review the result, and then use an available Default-mode workflow for a separately approved operational step.
Workflows make repeatable procedures available in the operating context. The workflow library can include Cisco-managed and user-defined workflows, depending on entitlements and integrations. A workflow can read information or modify an operational system, so the user reviews the configuration form, any prefilled values, the target resources, and the final confirmation screen. This separation between an AI recommendation and a user-reviewed execution is central to a reliable customer demonstration.
This operating model has a deliberate escalation path. The first responder establishes scope and confirms that an issue is present in a source record. A specialist then examines the product-native evidence that explains the symptom. Assistant and Canvas can organize the transition by retaining the question, selected entities, and findings, but they do not turn a possible explanation into a device change on their own. The workflow review is the point at which an operator explicitly selects a target and accepts an operational effect. In practice, the quality of this handoff depends on naming the source tenant and affected object in the shared record.
Cisco Validated deployment primer
Grouped environment with several source paths
Cisco Validated is the Cloud Control tenant group in this deployment. It contains six product child tenants: an Intersight tenant, a Security Cloud Control tenant, a ThousandEyes tenant, a Splunk Cloud Platform stack, and two Meraki organizations. The group gives the operator one selected scope, while the child records preserve the originating product context. The Admin Console hierarchy identifies child names and membership; a selected group in the operating UI establishes the scope of the inventory and investigation.
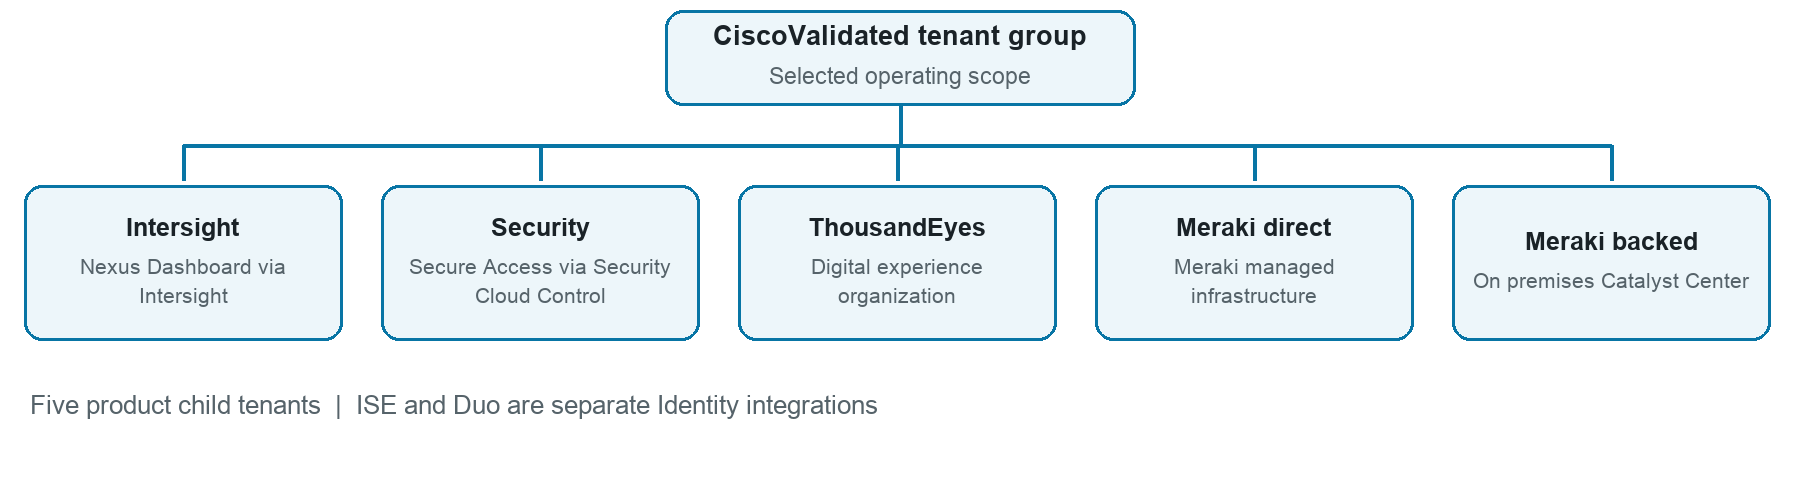
The visible domains extend beyond direct integrations. Nexus Dashboard reaches the group through Intersight, and Secure Access through Security Cloud Control. Cisco Validated 01 is the organization for directly managed Meraki infrastructure. The separate nyc-catc-01.ciscovalidated.com organization represents the on-premises Catalyst Center through the Catalyst Cloud and Meraki path. These are the deployment names shown by the source interfaces. ISE and Duo feed the Identity service through their own integrations rather than appearing as additional product child tenants.
Table 1. Product domains and source paths in Cisco Validated
| Visible domain |
Cisco Cloud Control relationship |
Source to check |
| Intersight |
Linked product tenant |
Intersight tenant and source asset |
| Nexus Dashboard |
Inherited through Intersight |
Intersight claim and Nexus Dashboard cluster |
| Security Cloud Control |
Linked product tenant |
Security tenant and source asset |
| Secure Access |
Inherited through Security Cloud Control |
Security Cloud Control relationship |
| ThousandEyes |
Linked product tenant |
ThousandEyes organization |
| Meraki network |
Direct Meraki organization |
Direct organization's asset record |
| Catalyst Center |
Second Meraki organization representing on premises Catalyst Center |
Catalyst Cloud activation and Meraki backed child |
| Splunk Cloud Platform |
Linked product tenant |
Splunk stack and authorized product query |
Identity adds two other paths. The ISE integration has a deployed agent that communicates with the ISE services and forwards supported observations to the Identity service. The Duo integration uses a dedicated Admin API application and credentials for read-only collection. Both are visible under Identity Integrations, but neither adds a product child tenant. The architecture diagram separates product-source linking from these Identity-source connections for that reason.
Current operating view
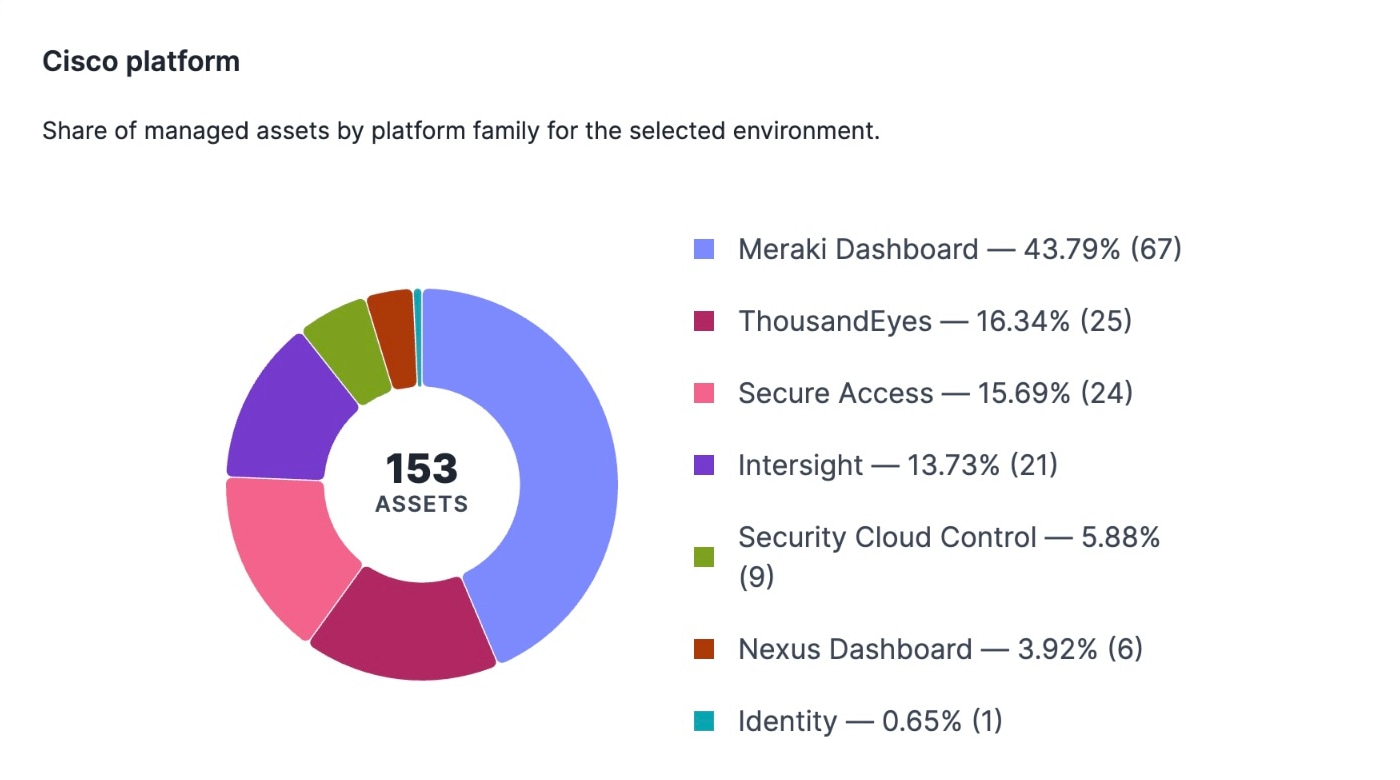
The Cisco Validated inventory baseline contains 153 assets. Its platform distribution includes 67 Meraki, 25 ThousandEyes, 24 Secure Access, 21 Intersight, nine Security Cloud Control, six Nexus Dashboard, and one Identity asset. These are records in the selected common inventory, not a census of every object in every controller. Platform labels describe the visible source domain; the tenant map explains its connection path. Counts describe their captured scope and change as sources report.
The same inventory baseline includes 57 Network Devices, 25 Observability Agents, 24 Network Firewalls, 14 Compute Servers, 13 Application Resources, and 11 Network Tunnels, with the remaining assets in smaller classes. Each Assets row retains its source and Cisco Cloud Control update time. The aggregate establishes scope, while a source-attributed row identifies the owner and the record to inspect.
ISE and Duo use different collection paths, so each requires its own health check. For ISE, confirm the agent heartbeat and a recent source-attributed session. For Duo, inspect the provider's collection log and a representative source-filtered activity record. These checks establish the current data path; integration tiles alone establish only configuration visibility.
Onboarding tenants and product domains
Establishing the operating group
The first onboarding step is organizational rather than visual. The administrator identifies the product tenants that should share an operating context and verifies access to each product. Initial linking requires at least one common administrative user whose email matches across the products. The administrator signs in, accepts the terms, links product tenants, and creates a group containing at least two tenants. Once the group exists, the Admin Console exposes its child relationships for ongoing management.
For Cisco Validated, the product relationship is the architecture record. Intersight, Security Cloud Control, ThousandEyes, Splunk Cloud Platform, and both Meraki organizations were included in one group. Verify the association in Admin Console and the active group in the tenant switcher. For sources that contribute inventory records, inspect a current source-attributed object in Inventory after the relevant sync interval. For Splunk, verify authorized query access to the connected stack. These checks establish both product association and the intended data path.
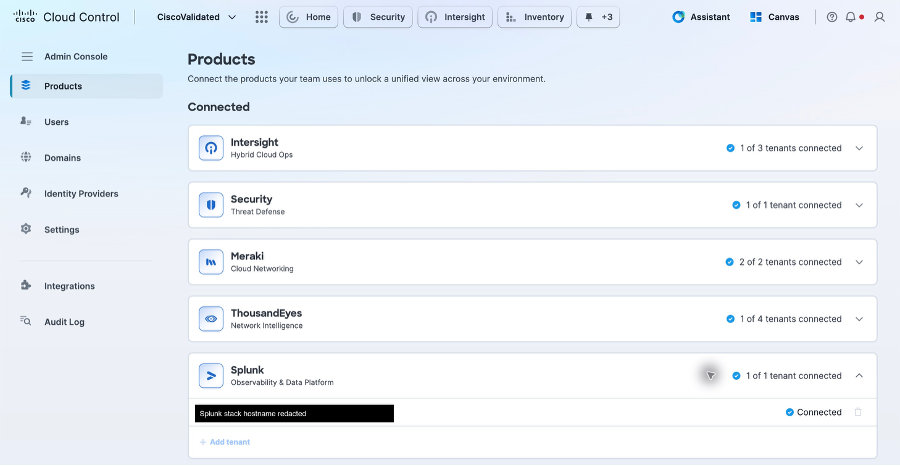
Product permissions remain part of validation. A link that works for a Tenant Full Admin can yield a smaller view for a member who lacks access to a particular child tenant. Role-based access control checks both platform role and source-product permission. A deployment acceptance test should therefore use an administrative account and a representative operational account. This verifies the intended audience for the common view, not just the success of the linking wizard.
Table 2. Illustrative platform and source permission checks
| Cisco Cloud Control role |
Source-product context |
Expected boundary to validate |
| Tenant Full Admin |
No access to a particular Meraki dashboard |
Workspace administration does not grant access to an unassigned product dashboard. |
| Tenant Read-only Admin |
Administrative access in a source product |
Cisco Cloud Control tenant settings remain read-only; Actions and workflows remain unavailable. |
| Integration Admin alone |
Integration ownership |
Integration management does not confer platform administration or Actions execution. |
| Member |
Access to Cisco Validated 01 only |
Authorized product data is visible; the Catalyst-backed organization remains outside the source grant. |
| Member |
Access to both Meraki organizations |
Both authorized views retain distinct source attribution; Member does not confer configuration rights. |
This matrix describes role boundaries for deployment acceptance, not a second-account test result from Cisco Validated. Tenant Full Admin workspace visibility and source-dashboard access are distinct permissions. Combined roles require validation against the resulting permissions.
The acceptance record should identify which product administrator authorized each link and which operating team owns it afterward. This is more than documentation hygiene. When an administrator leaves, a product organization changes ownership, or a new role limits visibility, the record tells the team whether to examine Cisco Cloud Control membership, the source product's permissions, or the collection service. A simple source-path register with tenant identifier, owner, permission model, and last verified object is enough to make a future access complaint actionable.
Connecting the product domains
Intersight provides the compute and data-center entry point in this deployment. Nexus Dashboard connects to Cisco Cloud Control through Intersight; an instance already connected to Intersight does not need to be linked again. The inventory baseline labels six assets as Nexus Dashboard, while the tenant association is through Intersight. Visible source product and linking product tenant describe different parts of the same path. An authorized agent lookup is an additional acceptance check, addressed in the source-access lesson later in this paper.
Security Cloud Control provides the security management tenant. Secure Access assets appear through that connection, so the source-path inventory names both the visible domain and the linking product. The inventory baseline contains 24 Secure Access assets and nine Security Cloud Control assets under separate platform labels. ThousandEyes contributes digital experience observations from its linked organization. A Main menu entry identifies an available destination; the tenant relationship and source record establish its data path.
Each product path needs a representative acceptance object. For Intersight, that can be a current compute or data-center record and, where the relationship is configured, a Nexus Dashboard asset attributed through the Intersight path. For Security Cloud Control, it is a security record and an inherited Secure Access record that can be traced back to the security tenant. For ThousandEyes, it is a current digital-experience object from the intended organization. Recording one example per path prevents a connected-tile view from being mistaken for proof that every expected data class has populated. It also gives an operator a concrete starting point when a subsequent sync changes a count.
The two Meraki organizations deserve separate labels. The direct organization contains Meraki-managed network infrastructure. The second is the Catalyst Center representation created through the Catalyst Cloud integration path. Both are under the Meraki product family in Cisco Cloud Control, but they have different source ownership. A deployment diagram, inventory export, or demonstration should retain the organization identifier so that a Meraki aggregate is not mistaken for a Meraki-only hardware census.
Catalyst Center onboarding in the deployed path
The on-premises Catalyst Center path begins with readiness in both Cisco Cloud Control and Catalyst Center. The linking user needs NETWORK-ADMIN-ROLE or SUPER-ADMIN-ROLE and a Catalyst Center username that matches the Cisco Cloud Control email identity. The controller requires a supported software release and outbound TCP 443 access to the specified Cisco and Meraki service hostnames. A username mismatch prevents reliable account correlation, while blocked outbound access prevents product-side activation.
The administrator opens Admin Console, creates a Catalyst Center integration, and provides a display label, management IP address or fully qualified domain name, and Member ID. If the operator does not yet have a matching Meraki account, the wizard guides account creation and email verification. This step prepares the Cisco Cloud Control side; registration and activation follow in Catalyst Center under System, Settings, External Services, Cisco Catalyst Cloud. The operator activates the Cisco Cloud Control and Meraki tile there, returns to Cisco Cloud Control, refreshes, and confirms the integration is Activated. The new Catalyst Center tenant then appears under Meraki in the correct group.

The onboarding recording shows both sides of activation. Catalyst Center reports the Cisco Cloud Control and Meraki application as Activated, and the Cisco Cloud Control wizard then confirms that Catalyst Center is connected. The steady-state acceptance record should retain the controller Member ID, integration state, Meraki-backed child identifier, and one current Catalyst-sourced asset. These records make the connection testable after an upgrade or account change.
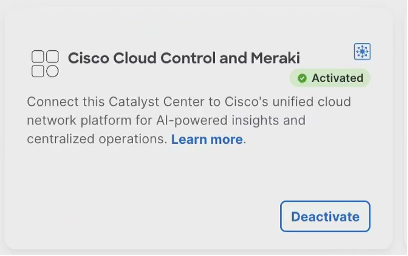
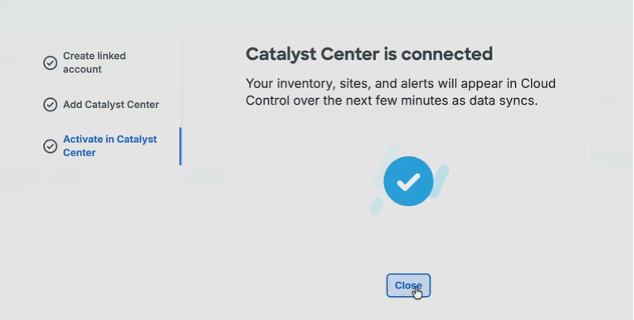
Catalyst Center remains the authority for controller-specific configuration and lifecycle detail. Cisco Cloud Control represents the supported subset used for cross-product discovery and investigation. The Catalyst-backed Meraki organization identifies that source path; it does not convert the on-premises estate into a Meraki-managed network. Operators retain the child identifier when comparing the common view with a controller record.
After a controller upgrade, account change, or outbound-access change, verify activation, child membership, and a current Catalyst-sourced asset. If activation fails, inspect both sides of the wizard. If the child is missing, inspect the Meraki association and group membership. If assets are missing after the collection interval, inspect source reporting and user entitlement. This sequence localizes the failed boundary without recreating onboarding.
Splunk Cloud Platform onboarding
Splunk Cloud Platform connects to Cisco Cloud Control through Cisco User Identity. An administrator with the admin role completes product onboarding and links the stack to the intended Cisco Cloud Control environment. Users verify the email associated with their Cisco identity. The Set up Cloud Control prompt on Splunk Home starts onboarding. The recorded welcome dialog provides Go to Cloud Control, as shown below. In Cisco Validated, the Products page identifies the connected stack, and the product launcher opens its workspace through the shared navigation. Splunk retains its data and product permissions.
Assistant and Canvas access supported Splunk data and capabilities through the Splunk Model Context Protocol (MCP) Server. Preparation includes installing Splunk MCP Server and Splunk AI Assistant and assigning mcp_tool_execute to the roles that require tool access. Data inputs remain configured in Splunk; linking the tenant does not automatically ingest Meraki, ISE, or Duo telemetry.
Identity integrations in operating environment
Identity as an additional source of operational context
Network state and identity state answer related questions. Inventory and Topology describe the connected infrastructure and its relationships; the Identity service can describe users, authentication activity, and ISE sessions. In Cisco Validated, ISE and Duo were integrated after the product tenant group existed. They contributed Identity observations through separate integration mechanisms, with their own administrators, credentials, health indicators, and collection logs. Their installation expands the evidence available to an investigation without adding product child tenants.
The distinction between Cisco Cloud Control sign-in and Identity ingestion is also important. A federated sign-in configuration determines how an operator authenticates to the platform. An ISE or Duo integration determines which source identity records are collected and analyzed. One can function while the other requires attention. Cisco Cloud Control role-based access control and the source product's permissions then govern what the signed-in operator can see and do.
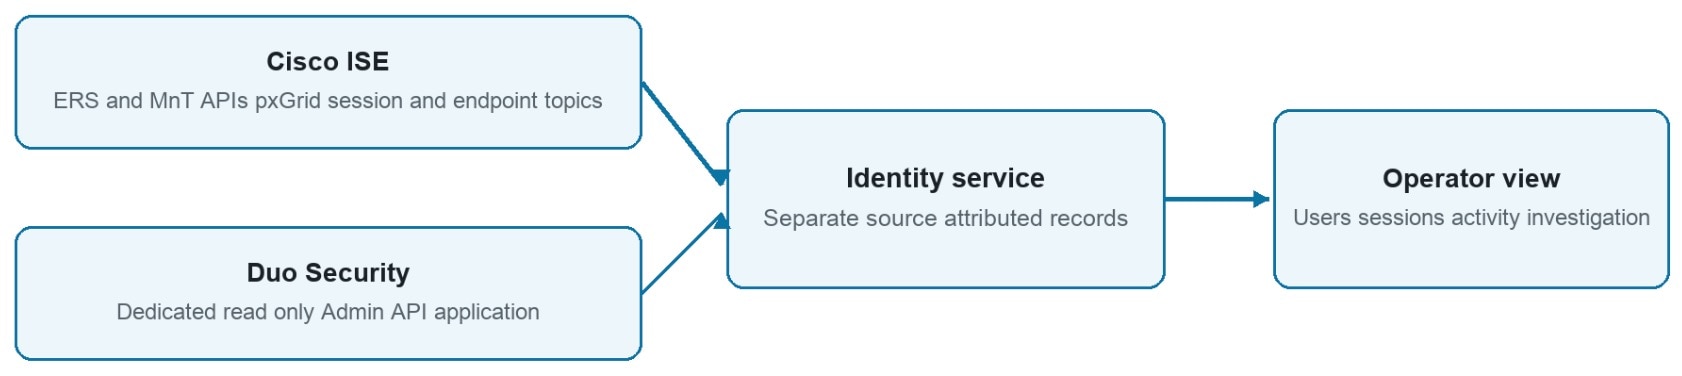
Cisco ISE agent integration
The ISE path uses a deployed agent close enough to reach the ISE administrative and monitoring services. ISE-side preparation enables the required API and pxGrid services before agent installation and registration in the Identity integration. In Cisco Validated, the agent verified access to the External RESTful Services API, endpoint API, and Monitoring and Troubleshooting service, registered a pxGrid client, and subscribed to session and endpoint topics. It then maintained a cloud heartbeat and made the resulting ISE observations available in Identity.
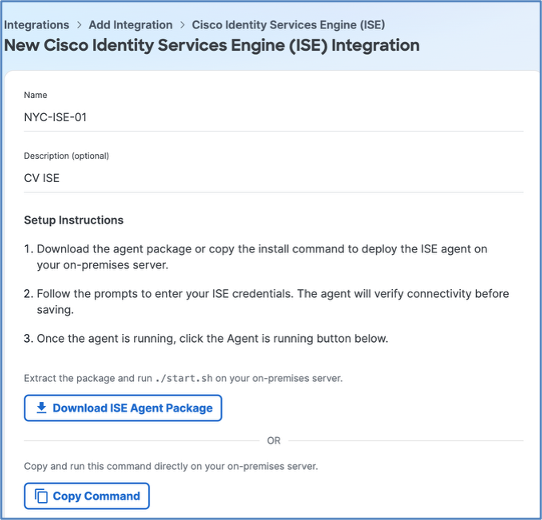
The implementation demonstrates why an agent integration is more than an API key. The initial installer could download its launcher, but the shell process running it lacked permission to use the Docker socket. Granting the installation account the required Docker group access and starting a shell with that membership allowed the image pull and container launch. That repair was local to the agent host; it did not require a change to the Cisco Cloud Control tenant group or ISE data model. A deployment plan should assign an owner to the container runtime, installation directory, updates, and host access before the integration is declared operational.
After the APIs and pxGrid client were working, the remaining failure sat in name resolution. ISE advertised the pxGrid publish-subscribe endpoint by fully qualified domain name. The container could reach the node's IP address but could not resolve the advertised name through its configured DNS servers, so the WebSocket subscription did not complete. A temporary container host mapping allowed subscription to the session and endpoint topics. The durable design is an internal DNS record resolvable from the container network namespace, followed by removal of the temporary mapping. This is a concrete reason to test the exact name supplied by service discovery from the agent container, rather than relying on a successful ping to the management IP from the host.
At commissioning, the agent showed Connected, ISE Reachable, and ISE-sourced node, session, and user records. This established the end-to-end data path at that time. Steady-state hardening requires a dedicated service account in place of the temporary privileged API account, an internal DNS record in place of the container host mapping, and review of the blank Primary Admin IP field. Confirm those items and a current source-attributed session during the next operating review.
An engineer reproducing the integration can verify ISE service permissions and API responses, approve the pxGrid client, and test the advertised pubsub name and port from the agent container. Topic subscriptions and the cloud heartbeat then establish transport, while a source-attributed node, session, or user record establishes delivery into Identity. Checking these stages localizes a failed boundary before a controller restart or permission change.
These acceptance checks verify the collection path. Endpoint authentication uses additional ISE services and certificate bindings. The wireless investigation later in this paper illustrates the distinction: the Identity integration remained connected while a selected endpoint failed authentication, and the EAP service certificate was expired. Collection health and authentication health therefore require separate operating checks.
Duo Admin API integration
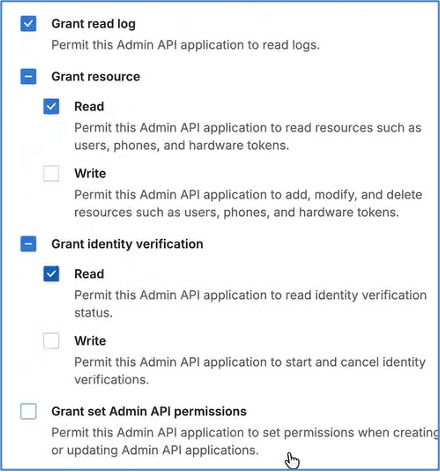
The Duo path uses a dedicated Admin API application. The Duo administrator creates the application and assigns the read permissions required for collection. The Identity administrator enters that application's API hostname, integration key, and matching secret key in the Duo integration form. The hostname is entered without a URL scheme or path. The Cisco Validated application was configured with read access to administrators, information, resources, and logs, plus Identity Verification Read; no write scopes were selected. Support Push Verification remained off.
This permission baseline separates data collection from operational actions. Read-only Admin API access supports ingestion and analysis; Duo write permissions enable separate remediation capabilities. Support Push Verification requires an Auth API application and credential pair. Event streaming applies to the initial Duo-provisioned connection, not to additional connections entered through the Identity form. Cisco Validated used the manually entered Admin API collection path. The recording does not establish its lineage relative to an auto-provisioned Duo connection, so streaming remains outside the verified deployment path.
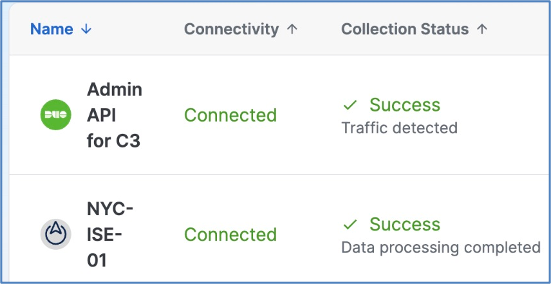
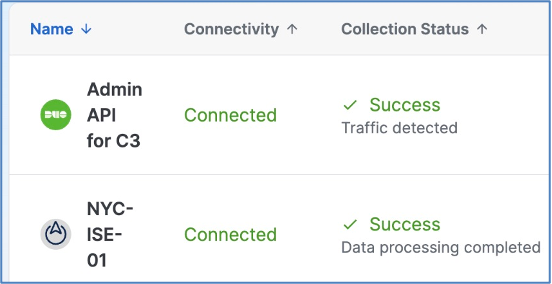
Cisco Cloud Control successfully collected and uploaded Duo sign-in, activity, event, and telephony logs through the dedicated Admin API connection. System Logs recorded successful collection and upload operations for these data types. In the Identity Integrations view, the provider named “Admin API for C3” (Cisco Cloud Control) showed Connected and Success — Traffic detected, together with a populated Last Collected timestamp. These observations verified API connectivity and the Duo collection path in Cisco Validated using both the collection logs and the provider status.
Deployment acceptance checks connectivity, collection status, and collection time separately. Operators verify a completed collection cycle, then inspect source-attributed records for the data types required by the use case. Successful collection into Identity does not automatically expose those events to a custom Studio application; application-level event access requires a supported interface and separate validation.
Source attribution determines how Identity observations are interpreted. A source filter and representative identifier distinguish ISE sessions from Duo-derived activity; an unfiltered user total cannot establish that distinction. Event streaming, help-desk push verification, and write-capable remediation are separate capabilities with their own provisioning paths, credentials, permissions, and acceptance tests. The manually configured Admin API connection in this deployment establishes the collection path.
An API integration also has a security lifecycle. The Duo administrator should record the application owner, its intended read scopes, the permitted source addresses if restrictions are used, and the rotation process for the integration and secret keys. A rotation test should verify both the immediate connection test and a later collection cycle; the first confirms that credentials authenticate, while the second confirms that the expected log types still arrive. The same evidence can support a least-privilege review: if the deployed application only collects logs, expanding it to write scopes should require a distinct use case and approval.
What the two identity paths teach
ISE and Duo enter the same Identity experience through different mechanisms. ISE depends on an agent host and pxGrid; Duo depends on an Admin API application and successful collection cycles. In either path, a useful operating record identifies the source, subject and observation time. The Meraki and ISE case uses that discipline to connect an access-network symptom to the relevant authentication decision.
Table 3. Identity collection mechanisms and acceptance evidence.
| Path |
Collection mechanism |
Acceptance evidence |
| Cisco ISE |
Deployed agent reads ISE APIs and subscribes to pxGrid topics |
API response, approved client, subscription, heartbeat, and source attributed session |
| Duo Security |
Dedicated Admin API application with read permissions |
Connection test, collection and upload log, traffic count, and expected source filtered record |
Unified visibility across the deployment
Inventory and source attribution
The Cisco Validated group illustrates the central inventory benefit: a single Assets view can include compute, data-center networking, security, digital experience, direct Meraki networking, and Catalyst Center represented through Meraki. The view's common filters and asset classes reduce the need to remember each controller's navigation. The source field retains the product lineage needed to interpret the record. An operator can start with a platform distribution, filter to a class or product, open one asset, review its issues, and move to a topology preview or source product when a controller-specific detail is required.
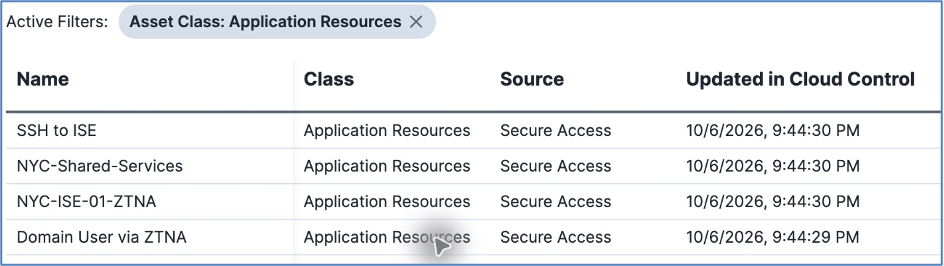
Application Resources illustrates the operational importance of source attribution. All 13 records in this class identify Secure Access as their source in the Cisco Validated view. Names include SSH to ISE and NYC-ISE-01-ZTNA: these are Secure Access application-resource records exposed through the Security Cloud Control path, not objects created by the ISE integration. The class count therefore describes collected resources rather than 13 distinct business applications or successful authentication sessions. The source column determines which product owns their configuration and status.
Inventory's collection cadence helps set the operational expectation. A recent ISE observation can enter the supported inventory path on a five-minute cadence, while Meraki, Security Cloud Control, Secure Access, ThousandEyes, and Catalyst Center are on documented 60-minute intervals. If the source has changed but the common view has not, the operator first checks the expected interval, then the integration and source timestamps. The platform's three-day inactive-asset removal also means that a falling count can indicate a silent upstream source rather than a deliberate asset deletion.
Topology and actions in one investigation
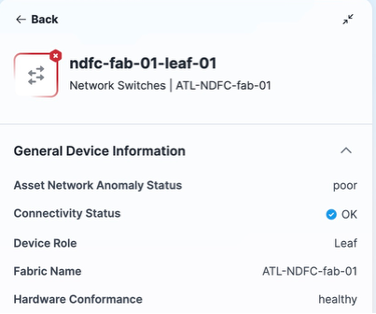
In the investigation snapshot, Active network anomalies need investigation filters 23 assets across the selected group. Five Nexus Dashboard switches at ATL-NDFC-fab-01 show Critical health and Reachable connectivity. The leaf Topology view separately shows poor network-anomaly status, OK connectivity, and healthy hardware and software conformance, together with relationships to a peer leaf and two spines. These views establish affected objects and relationships; the source-native anomaly supplies the collection symptom.
Topology links the leaf to its peer through Ethernet and port-channel connections and to both spines through Ethernet links. The Nexus Dashboard review then identifies an active Node Login Failure anomaly affecting the five ATL switches. Reachability, configuration conformance, and anomaly status describe different conditions. The Cisco Cloud Control asset update time remains a synchronization field, not the anomaly onset or a measurement of end-to-end ingestion delay.
Actions provides a second entry to the same work. If a related action exists, its alert group, affected objects, recommendation, and activity timeline can be reviewed before assignment. Assistant can receive that action context, and Canvas can preserve it for a shared investigation. This handoff is useful because the team can start from either topology or an attention item and still converge on a source-attributed record. A notification can point to the action, but clearing a notification is not the same operation as resolving the underlying action.
Licensing provides another cross-product view with different decision criteria. For a renewal or capacity decision, the operator must inspect the product, entitlement, balance, expiration, and source record and compare them with the organization's purchasing system. Cisco Cloud Control supplies the common view; the decision uses the relevant license-level detail.
Scope and freshness in operational views
The selected group, source product, filters, and operator permissions determine the scope of an operating view. A summary total describes that scope; the detailed record identifies the source object and its observation or collection time. Comparing views requires the same scope and a compatible time window, especially when two operators hold different source-product permissions.
Collection status and record freshness must be read together. A successful integration check establishes connectivity, while a source-attributed record and its timestamp establish what data reached the common view. After an integration or permission change, the operator checks both before interpreting a changed count as an infrastructure change.
AI assisted operations with Cisco Validated
Investigating and recovering wireless authentication
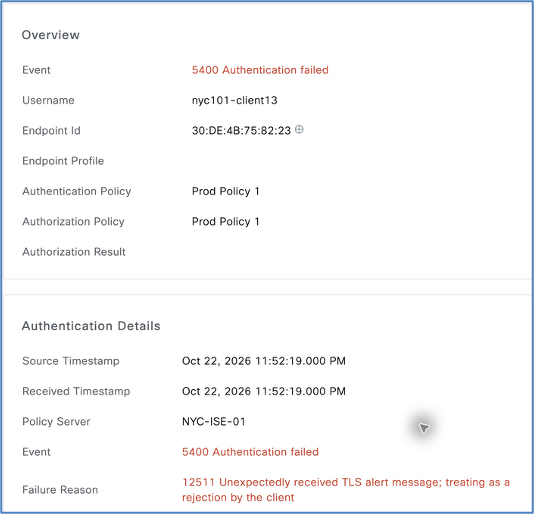
The Windows virtual machine NYC101-Client13 repeatedly failed to authenticate to the CVF-NYC101-Employee service set identifier (SSID) through access point (AP) NYC-AP01 in CV-101-NYC Hub Site1. It runs Windows 10 Enterprise 22H2 and uses a TP-Link wireless USB adapter. The investigation selected the direct Meraki organization, Cisco Validated 01, within the Cisco Validated group, rather than the separate organization representing Catalyst Center. The endpoint media access control (MAC) address, 30:de:4b:75:82:23, supplied a consistent identifier across the access-network, authentication and endpoint records.
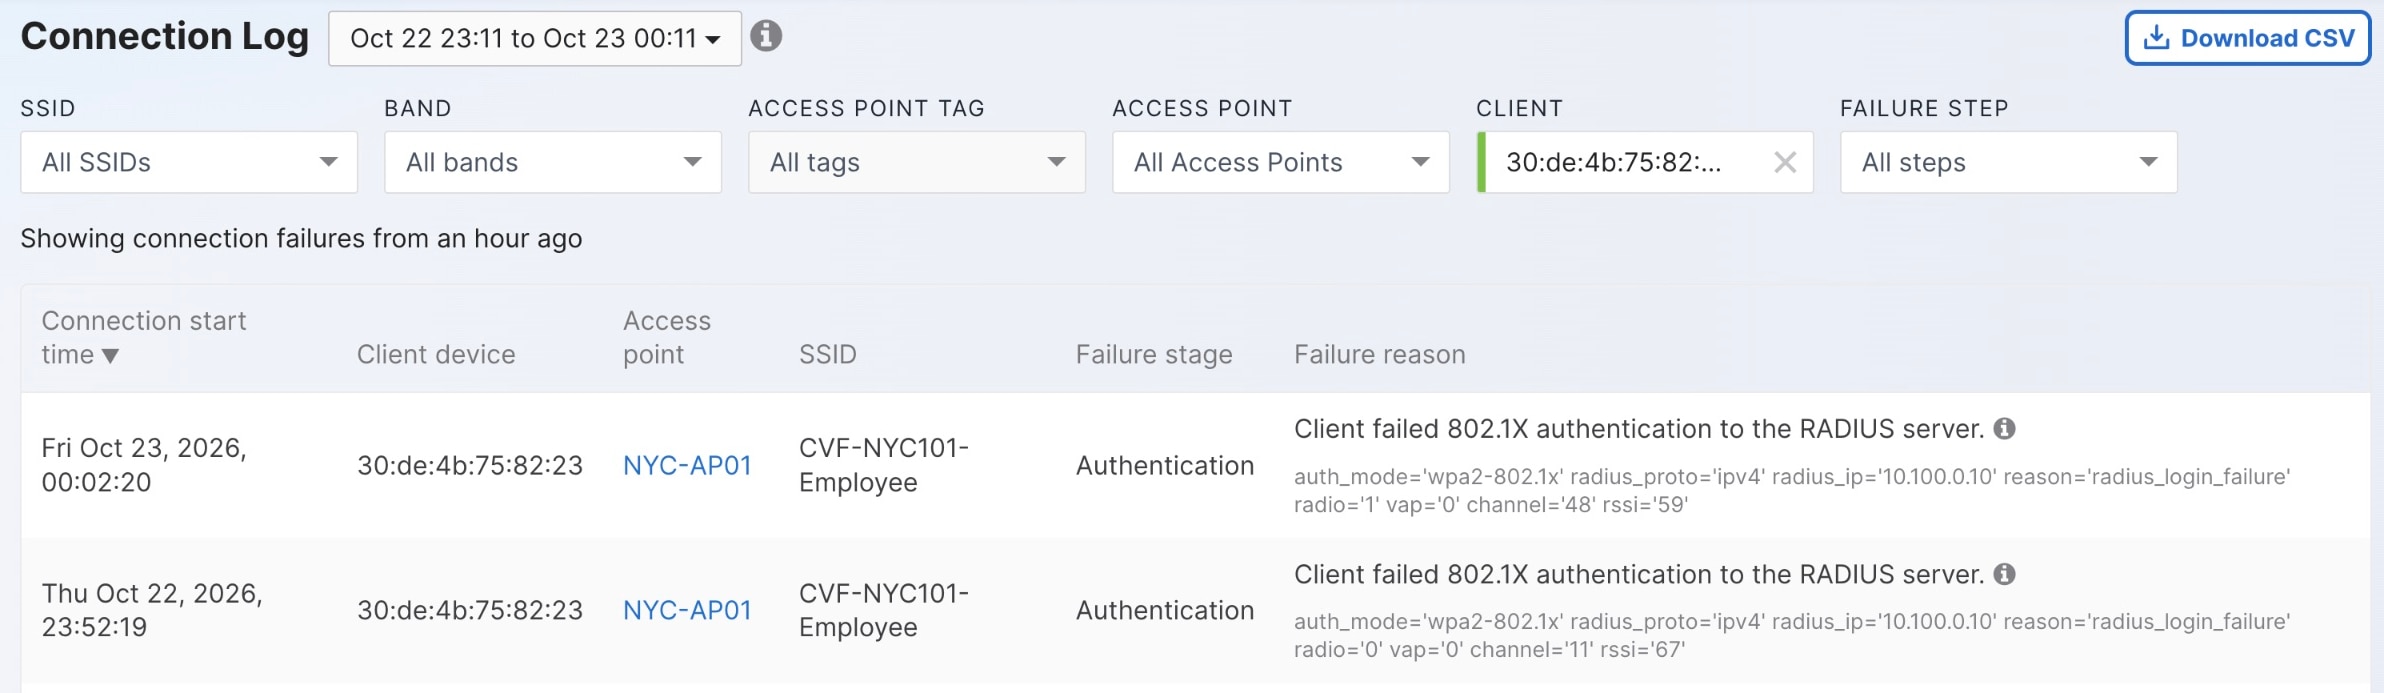
The Meraki connection log placed the failure at the Authentication stage and recorded radius_login_failure against Remote Authentication Dial-In User Service (RADIUS) server 10.100.0.10. The SSID configuration independently identified that address as its authentication server. This narrowed the investigation to the authentication exchange rather than treating a generic connection failure as a radio, addressing or application symptom.
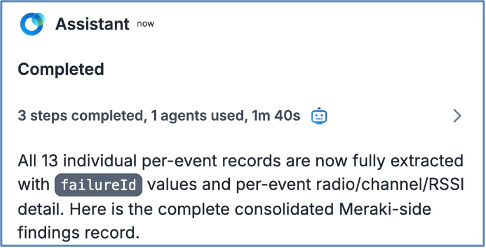
Assistant used the Network Platform Agent to retrieve the Meraki findings. Its fixed two-hour summary reported 13 failures and zero successful authentications for this endpoint. The expanded query supplied AP identity, failure records and timestamps; it identified NYC-AP01 as an MR36 with LAN address 10.101.255.11. The detailed query used a shifted time window, so its count was retained separately rather than combined with the fixed-window summary.
Matching the access network and ISE records
The operator opened ISE Live Logs directly and supplied the record as operator evidence; a per-authentication ISE query was not exposed by the available Assistant tools in this session. Client, AP, SSID, network access server (NAS) address and time matched the authentication decision on NYC-ISE-01, running ISE 3.5.0.527 Patch 4. Times were normalized to Coordinated Universal Time (UTC).
Table 4. Correlation of Meraki and ISE observations
| Field |
Meraki observation |
ISE observation |
| Client MAC |
30:de:4b:75:82:23 |
30:DE:4B:75:82:23 |
| Access point |
NYC-AP01; MAC a8:46:9d:2a:6d:45 |
NAS-Identifier begins A8-46-9D-2A-6D-45 |
| SSID |
CVF-NYC101-Employee |
Same SSID in Called-Station-ID |
| AP / NAS address |
AP LAN IP 10.101.255.11 |
NAS IPv4 10.101.255.11 |
| Matched time in UTC |
03:52:19.890 and 03:52:19.895 |
03:52:19.000 on 23 October 2026 |
ISE displayed 23:52:19 Eastern Daylight Time (EDT, UTC−04:00) on 22 October, equivalent to 03:52:19 UTC on 23 October. The two nearby Meraki records have distinct failure identifiers. Their same-second alignment is not a unique failure-ID-to-session join; the original timestamps and identifiers remain in the evidence register.
Identifying the expired EAP certificate
Protected Extensible Authentication Protocol (PEAP) uses a Transport Layer Security (TLS) tunnel to protect its authentication exchange. ISE presents a server certificate through its EAP Authentication binding. The endpoint evaluates that server identity as part of the exchange, so the certificate is an operational dependency even when the access point can reach the RADIUS server.
The matched ISE event reported a client TLS alert and returned Access-Reject. Its detailed trace included local-certificate validity diagnostic 12832. That diagnostic identifies a server certificate outside its validity period; the certificate inventory then determines whether the relevant certificate is not yet valid or expired. The sequence also retained initial TLS and PEAP handshake-completion messages. Those intermediate messages did not constitute successful endpoint authentication.
Table 5. Selected steps in the matched ISE authentication
| Step |
Observed result |
| 12816 / 12310 |
Initial TLS and PEAP handshake completion logged |
| 12832 |
Local server certificate outside its validity period |
| 12511 |
TLS alert received from the client |
| 11504 / 11003 |
EAP-Failure prepared and RADIUS Access-Reject returned |
The independent System Certificates view marked the certificate assigned to EAP Authentication as Expired. It expired at 11:45:37 EDT on 1 October 2026, before the matched failure. The same certificate listed RADIUS DTLS and Portal bindings. Those bindings identify services to review before replacement; they do not establish that either service participated in this PEAP event.

The matched Access-Reject, certificate-validity diagnostic and expired EAP binding identified the failed certificate dependency. Endpoint inspection subsequently confirmed that the saved wireless profile enables 802.1X and uses PEAP with inner EAP-MSCHAPv2 in user-authentication mode. The successful retest used the same endpoint identity, MAC, SSID and AP/NAS path, allowing the certificate change and endpoint trust decision to be evaluated against the original failure.
From diagnosis to an operational handoff
Cisco Cloud Control Identity showed the ISE agent and ISE reachability as Connected during the investigation. The ISE inventory separately showed active Admin and pxGrid/ISE Messaging certificates alongside the expired EAP certificate. This is the architectural distinction in an operating example: collection connectivity and the endpoint authentication service are separate health questions. A connected integration does not validate every ISE service certificate.
The operator retained the source-labelled findings in the Canvas named NYC Employee Wi-Fi — EAP Certificate Investigation. The captured handoff identifies the affected endpoint, matched observations, supported diagnosis and ISE/certificate owner. It was saved before the certificate change, so its displayed pending status describes that handoff stage. The completed authentication recovery and its direct ISE evidence are recorded below and in the companion case record.
Restoring authentication on the original endpoint
The ISE owner created and activated a replacement self-signed certificate on NYC-ISE-01. It is valid for 365 days and retains the EAP Authentication, RADIUS DTLS and Portal assignments. Its validity begins at 10:27 EDT, corresponding to 14:27 UTC in the evidence record. The replacement addressed the expired service certificate while the separately assigned Admin and pxGrid certificates remained outside the change scope.
The first post-change check still showed an incomplete authentication. ISE recorded event 5440, indicating that the endpoint abandoned an EAP session and started another. The endpoint then became the next inspection point. Its exported wireless profile confirmed PEAP with EAP-MSCHAPv2, user authentication and enabled server-certificate validation. Automatic use of Windows logon credentials was disabled; that setting alone did not establish a missing or incorrect network password.
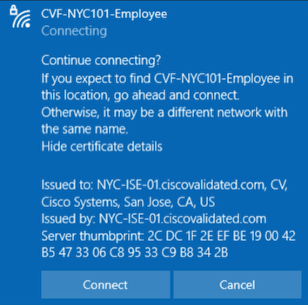
During an interactive connection attempt, Windows displayed the replacement ISE certificate and asked whether to continue. The operator selected Connect without entering a new username or password. The endpoint then completed authentication. The final observed step was acceptance of the certificate prompt, not a credential reset or disabling server-certificate validation. This deployment used interactive certificate acceptance; a managed rollout should provision the approved trust chain and permitted server identity in advance.
Verifying the successful authentication
At 11:27:28 EDT, or 15:27:28 UTC, ISE recorded event 5200 Authentication succeeded for nyc101-client13 and endpoint 30:DE:4B:75:82:23. The detail identifies PEAP with EAP-MSCHAPv2, TLS 1.2, the Internal Users identity store, NAS 10.101.255.11 and the employee SSID in Called-Station-ID. The selected authorization profile is dot1x-employee-wireless-Meraki. The trace ends with EAP-Success and RADIUS Access-Accept. These are direct ISE observations for the original endpoint, rather than an inferred result from a connected integration.
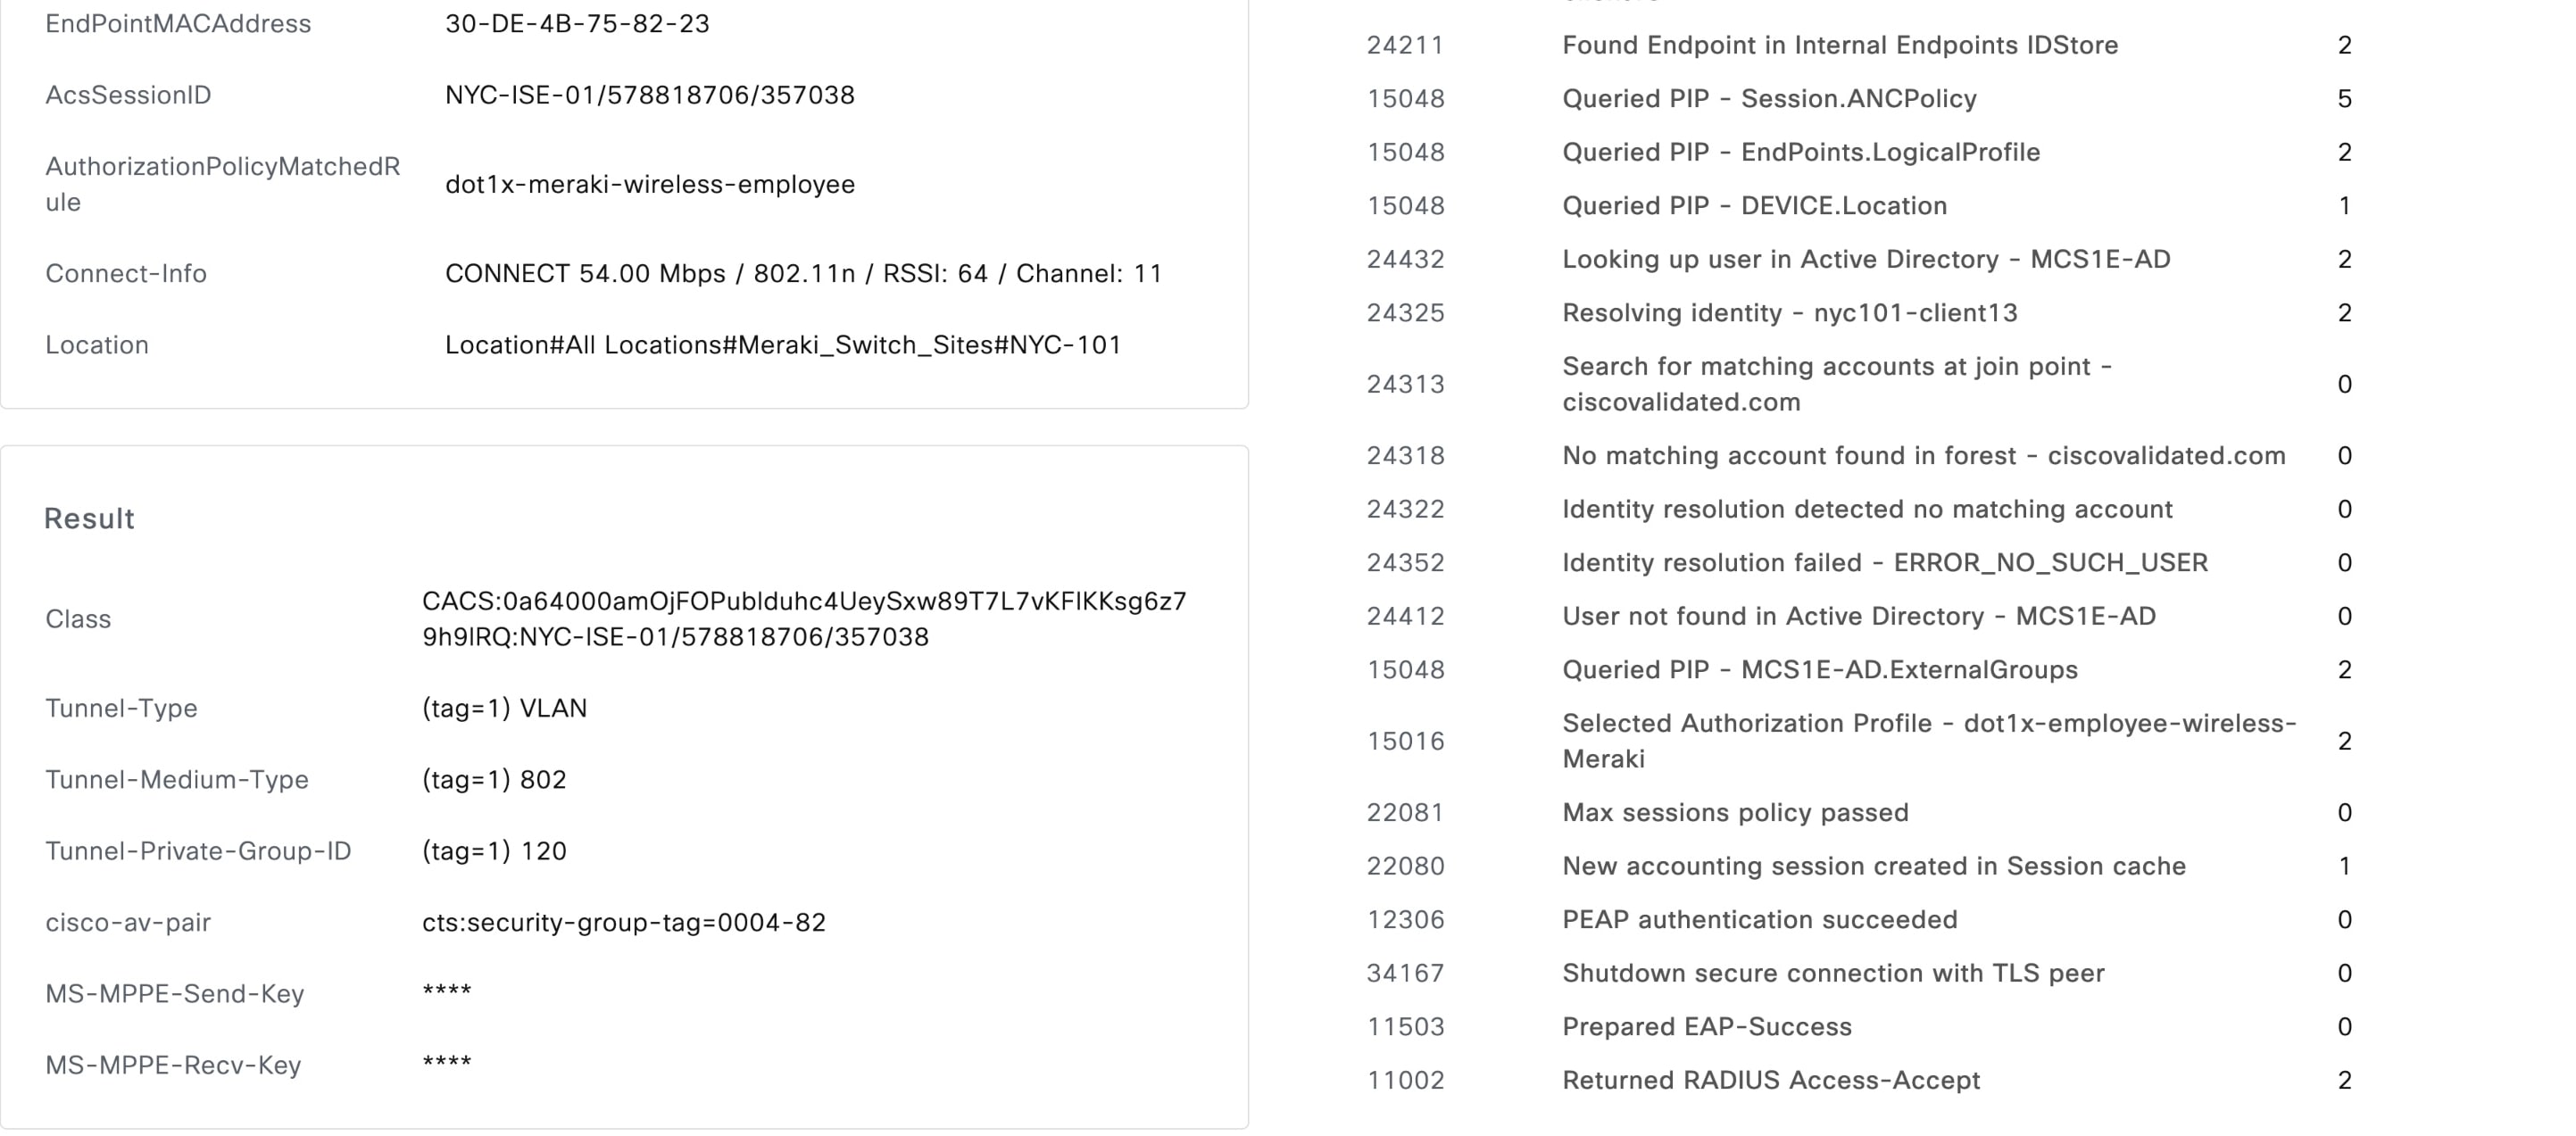
Table 6. Before and after evidence for the original endpoint
| Validation point |
Before recovery |
Verified recovery result |
| EAP service certificate |
Expired certificate bound to EAP Authentication |
Active replacement; 365-day validity; same intended service assignments |
| Endpoint authentication |
Client TLS alert and RADIUS Access-Reject |
PEAP–EAP-MSCHAPv2 succeeds; RADIUS Access-Accept |
| Identity and authorization |
Identity nyc101-client13 appears in the failed exchange |
ISE Internal Users authentication; employee authorization profile selected |
| Endpoint observation |
Wireless interface disconnected or authenticating |
Connection completes; IPv4 10.101.255.41/24 and gateway 10.101.255.1 are present |
The verified Access-Accept closes the original endpoint’s 802.1X authentication investigation. The Windows address observation corroborates the client-side transition. Network policy, DNS, DHCP, intended VLAN enforcement and application-service validation remain outside this case’s completion scope. The recovery was operator performed, not executed by a Cisco Cloud Control agent, Studio application or automated workflow; the result does not establish recovery for every client on the SSID.
Cisco Cloud Control Studio and custom operational applications
Cisco Cloud Control Studio extends the operating environment with applications and agents tailored to a team’s procedures. It complements the common Inventory, Topology, Identity, and AI experiences with a place to implement a specific operational interaction. In Cisco Validated, Studio appears under Platform Services in the Main menu and provides Build and Manage views. The installed application’s Manage preview is the running surface validated in this implementation.
Studio separates extension management, application construction, runtime data access, agent configuration, and investigation. Cisco Cloud Control supplies Cisco identity, registration, and hosting for the application. The component map distinguishes these responsibilities and identifies how each component participates in the Cisco Validated implementation.
Table 7. Studio components and responsibilities in Cisco Validated
| Component |
Role in this implementation |
| Cisco Cloud Control Studio |
Provides the Build workspace and Manage view for extensions. In Cisco Validated, these views support app construction, installation, and review of availability scope. |
| App Builder |
Converts requirements into application code, a sandbox preview, and revisions. It integrates OpenAI Codex through the Codex software development kit (SDK). Operator acceptance checks the generated app before installation. |
| Hosted app and product interface |
Runs the case interface and keeps case state in page memory. In this build, the productJson helper retrieves Cisco Cloud Control inventory and Meraki organization context. These reads establish source coverage; incident events require separate adapters or operator-supplied evidence. |
| Agent Builder |
Defines agent instructions, tools, knowledge, and reusable skills. It is distinct from App Builder; this implementation did not create a diagnostic agent for the Service Access Investigator. |
| AI Canvas |
Retains the plan, findings, and evidence for a collaborative investigation. It provides the investigation workspace beyond the app; a direct app-to-Canvas handoff was not implemented in this build. |
Application architecture and lifecycle
An application specification defines the operator task, required inputs, available data, permitted actions, and expected output. The builder inspects the interfaces exposed to its workspace and implements the interaction against those interfaces. A draft preview then lets the operator test behavior with the intended tenant context before installation. This sequence makes source access and failure handling part of acceptance, rather than assuming that every domain in the product launcher exposes the same application interface.
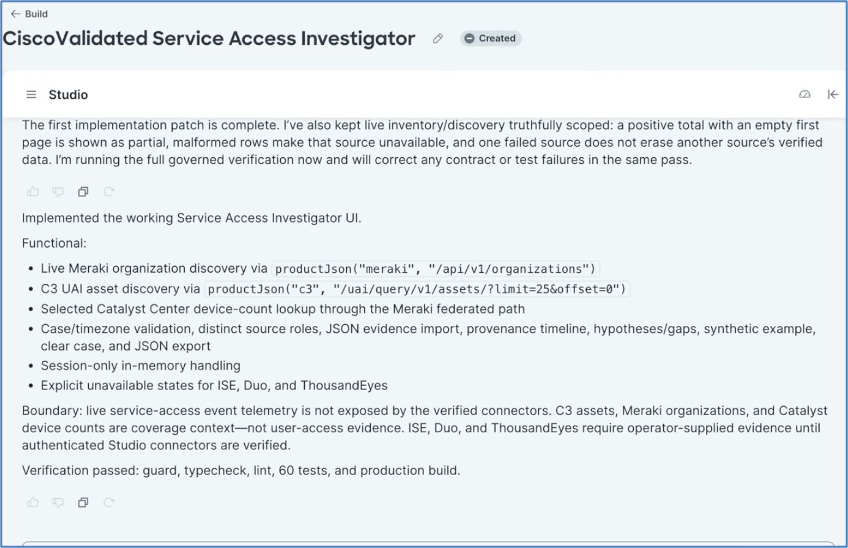
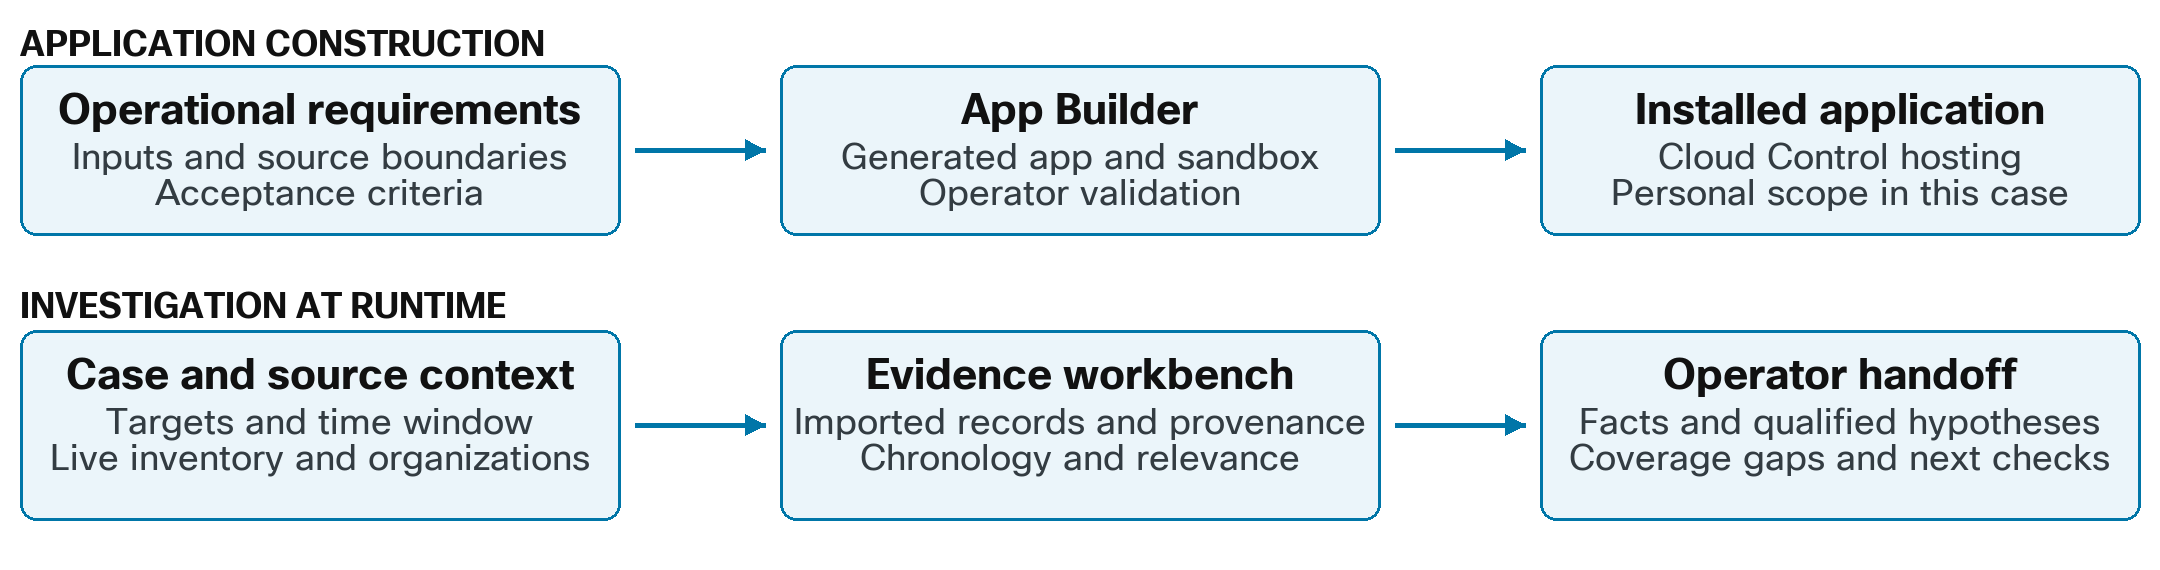
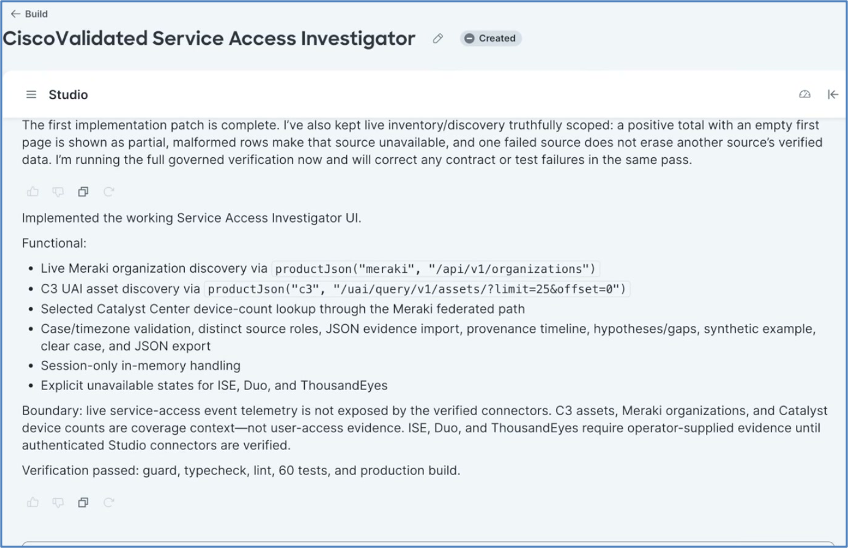
App Builder generates and revises software; the installed app executes case-handling logic and product requests. Here, AI assisted construction of an evidence workbench. The running app did not invoke a diagnostic agent or execute remediation. Operator acceptance therefore tests the app's behavior separately from its build process.
Cisco Validated Service Access Investigator
The Cisco Validated Service Access Investigator supports the handoff from a network operator to an identity or application specialist. For a reported access problem, it establishes the affected subject and interval, records which sources were checked, and identifies the evidence the receiving engineer should retrieve. These requirements define the case before observations are compared.
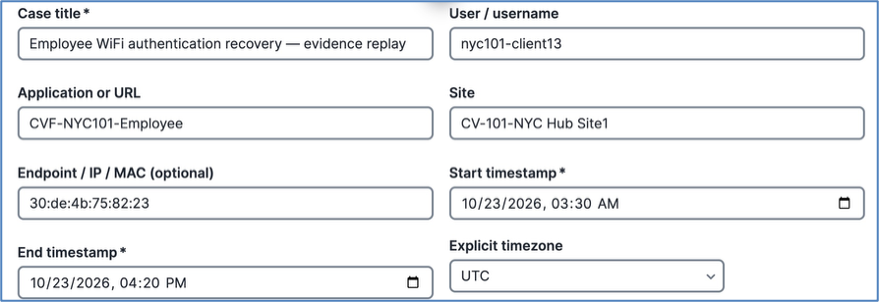
The case includes a title, user, application or URL, site, optional endpoint identifier, and bounded start and end times. A title and at least one target are required. An explicit Internet Assigned Numbers Authority (IANA) time zone determines the interpretation of local time, and the interface also displays canonical Coordinated Universal Time (UTC). Ambiguous or nonexistent daylight-saving times are rejected. These checks keep the investigation window reproducible when different teams use different local clocks.
Source coverage and tenant lineage
The installed app retrieves Cisco Cloud Control inventory context and discovers authorized Meraki organizations through the Studio product interface. Its inventory read returned a page of 25 assets with a pagination total of 153. This is a scoped inventory result, not a completed enumeration or evidence that a particular authentication succeeded. Organization discovery and inventory coverage remain separate from the incident timeline.
The app discovers Cisco Validated 01 and nyc-catc-01.ciscovalidated.com as distinct Meraki organizations. Separate source-role selectors preserve their direct Meraki and on-premises Catalyst Center paths. The application retains the actual discovered organization identifiers and rejects duplicate assignment of one organization to both roles. The wireless evidence replay selects Cisco Validated 01 as its direct Meraki source.
Table 8. Verified source coverage in the Service Access Investigator
| Source surface |
App result |
Interpretation |
| Cisco Cloud Control inventory |
25 returned against a pagination total of 153 |
Live context from one page; not a full enumeration or event history |
| Meraki organizations |
Two organizations discovered; Cisco Validated 01 selected |
Direct Meraki organization supplies the wireless case context |
| ISE and Duo events |
Provider collection successful; no verified live event adapter in this app |
Authorized operator JSON import supplies evidence for the case |
| ThousandEyes events |
No verified live event adapter in this app |
Operator-supplied evidence remains explicitly labeled |
Inventory and organization discovery provide source context. Identity provider collection and application-level event access remain separate checks: the installed workbench uses authorized evidence import for ISE, Duo and ThousandEyes incident records until supported event adapters are verified.
Evidence handling and operational handoff
Where a live event adapter has not been verified, an authorized operator can import JavaScript Object Notation (JSON) evidence. Each record retains a source system, organization or controller, source record identifier, subject identifiers, event timestamp, collection timestamp, query interval, summary, and fact or hypothesis classification. Optional source links provide a route back to the originating record. Imported records remain marked as operator supplied; a valid schema does not establish their authenticity.
The app orders records by their event instants and evaluates their relevance to the selected case. It flags an observation outside the interval and identifies records whose supplied subject identifiers do not match the case. A matching identifier supports comparison, but independent systems still require an authoritative session association before a causal conclusion follows. Facts, qualified hypotheses, and missing evidence therefore remain separate in the displayed case and its report.
The generated handoff retains targets, local and UTC intervals, source assignments, coverage, chronological records, gaps and recommended checks. Initial synthetic acceptance retrieved a complete serialized report through the read-only field. The later real-case replay verified every input field in the complete displayed evidence timeline; this check did not retrieve the full report tail. These results establish separate retrieval scopes. The operator must protect user and endpoint identifiers when sharing the handoff.
Case state remains in the running page's memory. Clear case removes the inputs, assignments, and evidence, and reloading the preview returns an empty case. A report must therefore be retrieved before ending a case that needs a durable handoff. This application-state behavior does not define the retention policy of platform logs.
Validation and Personal installation
The implementation followed a requirements, preview, correction, and installation cycle. Browser acceptance tested required inputs, time conversion, distinct organization roles, malformed evidence, chronology, relevance warnings, report retrieval, and reset behavior. Corrections to the generated app aligned its local-time conversion, timeline order, and error messages with the specified behavior. The acceptance checks establish those runtime functions independently of the builder's reported software tests.
Initial evidence acceptance used three imported synthetic fixtures and one separately labelled built-in example. These four test records exercised case behavior while inventory and organization discovery supplied real context. A subsequent authorized replay used six historical records from the completed employee Wi-Fi incident, validating the workbench against known failure and recovery evidence. Synthetic acceptance and historical-case replay are distinct test stages.
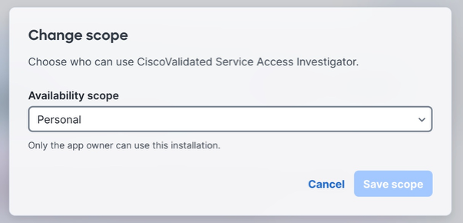
The revised application is Installed with Personal scope. The scope dialog explicitly limits use of this installation to its owner, and the installation form did not request new product credentials or permission grants. The visible app contains no source-product configuration, deletion, ticket submission, or remediation controls. App administration remains a separate responsibility because a permitted editor can change application behavior.
Replaying the completed wireless case
After the endpoint recovered, the operator replayed its retained evidence in the installed Service Access Investigator. The case targeted nyc101-client13, endpoint 30:de:4b:75:82:23, CVF-NYC101-Employee and CV-101-NYC Hub Site1 within 03:30–16:20 UTC. The original investigation used Assistant, direct ISE inspection, Windows and Canvas. The subsequent Studio run organized those records without performing a new authentication or changing either source product.
Six summaries were deliberately imported out of order. Five were classified as facts and one as an operator-authored explanation of the expired EAP certificate. The app retained these classifications, ordered all six by event time and marked each as operator supplied and nonsynthetic. Every record fell inside the interval and matched an exact supplied case identifier. This association checks the imported case context; it does not independently resolve identity or infer root cause.
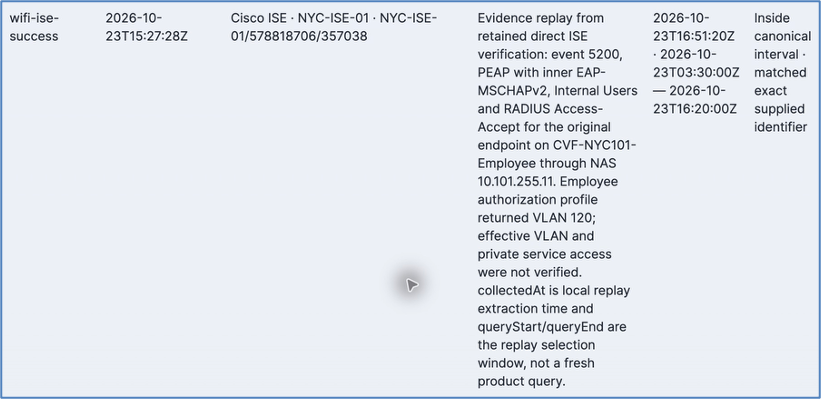
The timeline preserves the unsuccessful intermediate ISE event 5440 before the verified Access-Accept at 15:27:28 UTC. The certificate record identifies its timestamp as valid-from time rather than measured activation. Collection and query fields describe preparation and selection of the retained evidence for replay, not fresh source queries. These distinctions allow the receiving engineer to interpret the sequence without changing the meaning of the original observations.

Field-by-field comparison of the report’s complete displayed evidenceTimeline confirmed that every supplied value survived the replay and that the records remained chronological. The generated handoff therefore retains the failed exchange, certificate action, intermediate result and successful retest with their source identifiers. Report generation occurred at 17:14:09.802 UTC; this is distinct from the incident and source-event times.
Operational value and the next integration stage
The completed replay demonstrates an evidence-preserving handoff using the deployment’s own incident. Network and identity engineers can review the same targets, source records and outcome while keeping the operator’s explanation separate from observations. Authentication recovery remains the result verified in ISE; the app makes that result and its supporting progression reviewable. No automated remediation or measured reduction in investigation time is claimed.
The next stage is to verify supported ISE, Duo and ThousandEyes event adapters, provide reliable report retention and test application-management rights before widening availability. The retained case supplies known identifiers, timestamps and expected results for those checks. Direct transfer from the app to Canvas remains a separate implementation task. Operational changes continue to require separately approved procedures or workflows.
Operating and sustaining the deployment
Ownership and routine checks
Cisco Cloud Control provides a common operating environment while service ownership remains distributed. The platform administrator manages group membership, roles, integrations and audit settings. Product administrators maintain their tenant relationships. The ISE owner maintains the agent host, service account, pxGrid client, DNS path and service certificate bindings. The Duo owner maintains its Admin API application, key rotation, permissions and source-network policy. Routine review records the owner, integration state, latest source observation and a representative object for each path.
Custom applications add an application owner to this model. A release review checks source access, input validation, failure behavior, report content and availability scope. Product-agent acceptance includes a successful authorized source lookup, in addition to inventory visibility. The wireless case adds a service-health check: certificate usage and expiry must be reviewed independently of connected collection. Wider app availability still requires a role review and a second-user test.
Table 9. Recurring owner and health checks
| Path |
Accountable owner |
Routine check |
| Tenant group |
Cisco Cloud Control administrator |
Child mapping, operator entitlement, audit changes |
| Catalyst Center |
Catalyst and Meraki administrators |
Activated state, child visibility, current source asset |
| ISE |
ISE and agent operators |
Container, DNS, pxGrid, heartbeat, current session, and service certificate usage and expiry |
| Duo |
Duo and Identity administrators |
Admin API scopes, collection log, source filtered object |
| Splunk Cloud Platform |
Splunk administrator |
Product access, MCP tool availability, and a bounded authorization query |
| AI and workflows |
Cisco Cloud Control and workflow owners |
Agent availability, saved evidence, approved targets |
| Studio application |
Application owner and platform administrators |
Source access, release behavior, case reset, report retrieval, and installation scope |
Changes should be tested at the boundary they affect. A Catalyst Center update calls for activation, Meraki-backed child visibility and a current asset. An ISE agent update calls for container health, advertised-name resolution, pxGrid subscription and a recent session. An EAP certificate replacement calls for valid service bindings, supplicant trust and successful endpoint authentication. A Duo key rotation calls for a connection test and a successful collection cycle. A role change calls for a check by an operator with the affected entitlement.
The operating review can be brief if every path has a named owner and a test object. The administrator reviews the group hierarchy and integration state; the product owner verifies one current source record; the operations user confirms that the same record is visible under the intended role. For Identity, the owner adds the latest collection or heartbeat and a record carrying the correct source label. This small test set is more informative than a single platform-wide count because it separates link, transport, collection, normalization, and authorization failures. It also makes a post-change review comparable with the original onboarding acceptance record.
Administrative governance applies to AI use as well. Data Preferences controls whether tenant interactions with Assistant and Canvas are used to train and improve Cisco Cloud Control AI models. The setting is enabled by default and only a Tenant Full Admin can change it. Admin Console also provides audit logs for system changes and events. The deployment owner should review the preference under the organization's data-handling policy and decide what can be placed in prompts, attachments, and shared screenshots.
The evidence set should be refreshed after material changes, not only before a demonstration. A new product child tenant changes the scope of the group. A role update changes which data an operator can see. A controller upgrade can alter an activation or collection path. An agent update can change the runtime environment that reaches ISE. A key rotation can interrupt Duo collection even while the prior records remain visible. The owner can use the same register and representative-object checks established during onboarding to distinguish a stale observation from a current integration failure.
Conclusions and operational validation
Cisco Validated applies the common Cisco Cloud Control operating model to direct product tenants, inherited product domains, an on-premises Catalyst Center source and two Identity integrations. Its wireless case demonstrates a completed endpoint-authentication investigation: Assistant retrieves the Meraki symptom, direct ISE validation identifies an expired EAP certificate, Canvas retains the owner handoff, and operator-performed recovery produces a verified Access-Accept for the original endpoint. The result connects cross-product investigation to a specific, attributable operational outcome.
The Studio workbench has now replayed the retained wireless failure and recovery evidence while preserving the boundary between operator-performed remediation and application case handling. The next development stage is supported event collection and durable handoff, with centrally provisioned certificate trust and separate network-service acceptance for broader deployment. Measurements of coverage, handoff completeness and elapsed investigation time require comparable runs and a recorded method; no automated remediation or measured time saving is claimed.

