Incident Investigation and Mitigation
Available Languages
Table Of Contents
Incident Investigation and Mitigation
To Search for a Session ID or Incident ID
To Tune an Unconfirmed False Positive to False Positive
To Tune an Unconfirmed False Positive to True Positive
To Activate False Positive Drop Rules
Prerequisites for Mitigation with 802.1X Network Mapping
Procedure for Mitigation with 802.1X Network Mapping
Display Dynamic Device Information
Virtual Private Network Considerations
Layer 2 Path and Mitigation Configuration Example
Prerequisites for Layer 2 Path and Mitigation
Procedures for Layer 2 Path and Mitigation
Add the Cisco Catalyst 5000 with SNMP as the Access Type.
Add the Cisco Catalyst 6500 with SNMP as Access Type (Layer 2 only).
Add the Cisco 7500 Router with TELNET as the Access Type
Verify the Connectivity Paths for Layer 3 and Layer 2
Incident Investigation and Mitigation
An incident is a chain of events that are correlated by a rule to signal an attack upon your network. MARS simplifies and expedites the detection, mitigation, reporting, and analysis of the incident. The Network Summary dashboard and the Incident pages help to detect recent incidents and show the rules and the events that compose them. Mitigation refers to the ability of the MARS to isolate the attacking and compromised network devices by identifying and configuring enforcing devices that act as choke points in the network. Queries and reports reveal the scope of a problem and gather data for analysis and regulatory compliance. All this information can be captured in a case report with Case Management and escalated to the relevant personnel.
Incidents Overview
An attack can consist of a reconnaissance activity (for instance, a port scan), followed by a penetration attempt (such as, a buffer overflow), and followed by malicious activity on the target host (for example, a local privilege escalation attack or the installation of backdoors).
An incident, which is generated by a Local Controller, collects the interesting events that constitute an attack scenario and uses rules to describe them. MARS provides you with pre-defined, system rules—which you can fine tune—and gives you the ability to create your own rules.
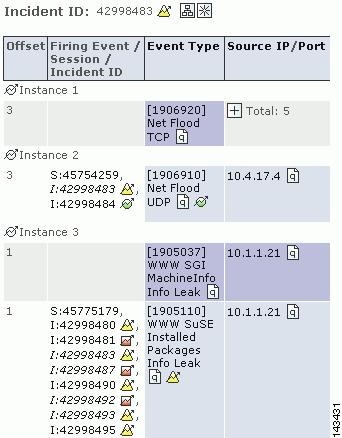
Incidents are sub-divided into instances to make it easier for you to investigate the attack scenario. Each instance alone is a full attack scenario.
For example, if your network is probed for a DoS attack and then attacked, a rule fires when it sees the follow up attack. The incident displays the instances of this attack.
Figure 20-1 A DoS probe followed by a DoS attack
The Incidents Page
Click the Incidents tab to navigate to the Incidents page. The Incidents page displays recent incidents.
Incidents are collections of events and sessions that meet the criteria for a rule, each having helped to cause the rule to fire. An incident's duration only includes the events that contributed to the incident firing.
Figure 20-2 Incidents Navigation
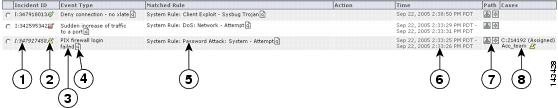
The Incident page's table:
•
Incident ID
An incident's unique ID.
•
Low (green), medium (yellow), and high (red) icons.
•
The normalized signature sent from the reporting devices.
•
The rule whose criteria were met.
•
The description of the notification taken when this rule fires (epage, email, etc.)
•
A single time or a time range (see Time ranges for Incidents for more information)
•
The icon that takes you to the incident's path diagram.
•
The icon that takes you to the source, event type, and destination diagram.
Time ranges for Incidents
The time column displays both single entries for time (Sep 6, 2003 12:09:54 PM PDT), and time ranges (Sep 6, 2003 12:06:43 PM PDT - Sep 6, 2003 12:06:47 PM PDT).
A single time tells you that all of the firing events were received in the same second. The duration of the incident includes only events that have fired that incident.
Incident Details Page
Clicking the Incident ID takes you to its Incident Details page. The Incident Details page is rich in information and information gathering tools. This page answers questions, such as who did it, what event types happened, when it happened, and to whom it happened.
Figure 20-3 The Incident Details Page
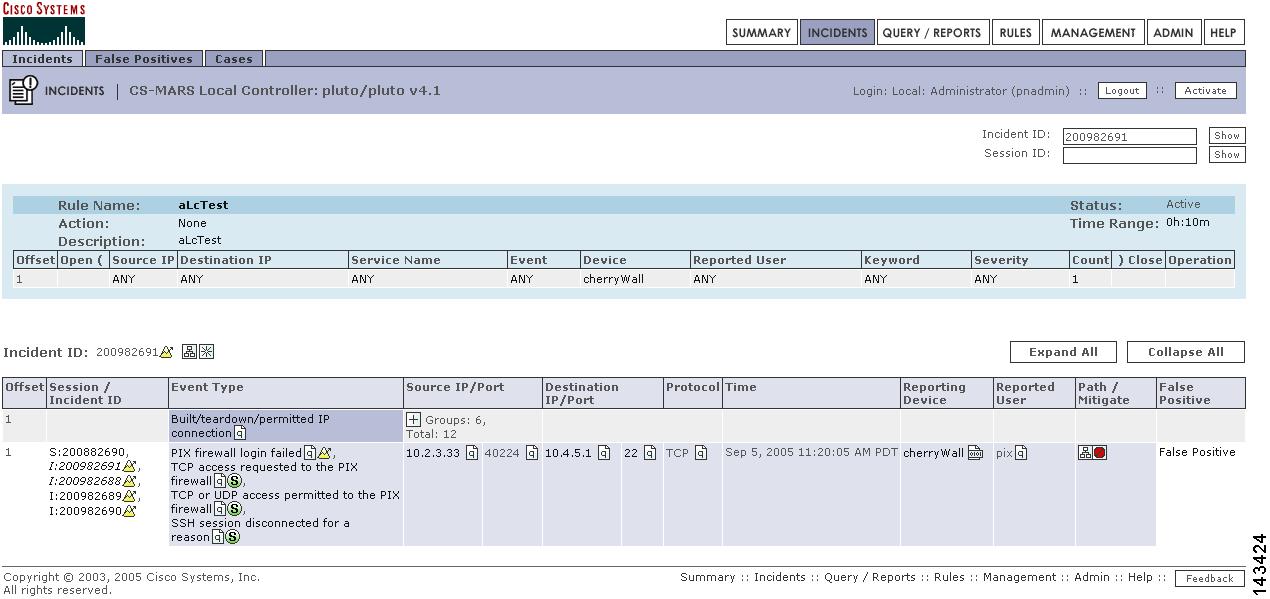
On the top of this page are the tools that let you search for Incident and Session ID and view the Matched Rule.
To Search for a Session ID or Incident ID
Step 1
Step 2
To view a partially hidden rule
Click the Show button next to the Rule Description.
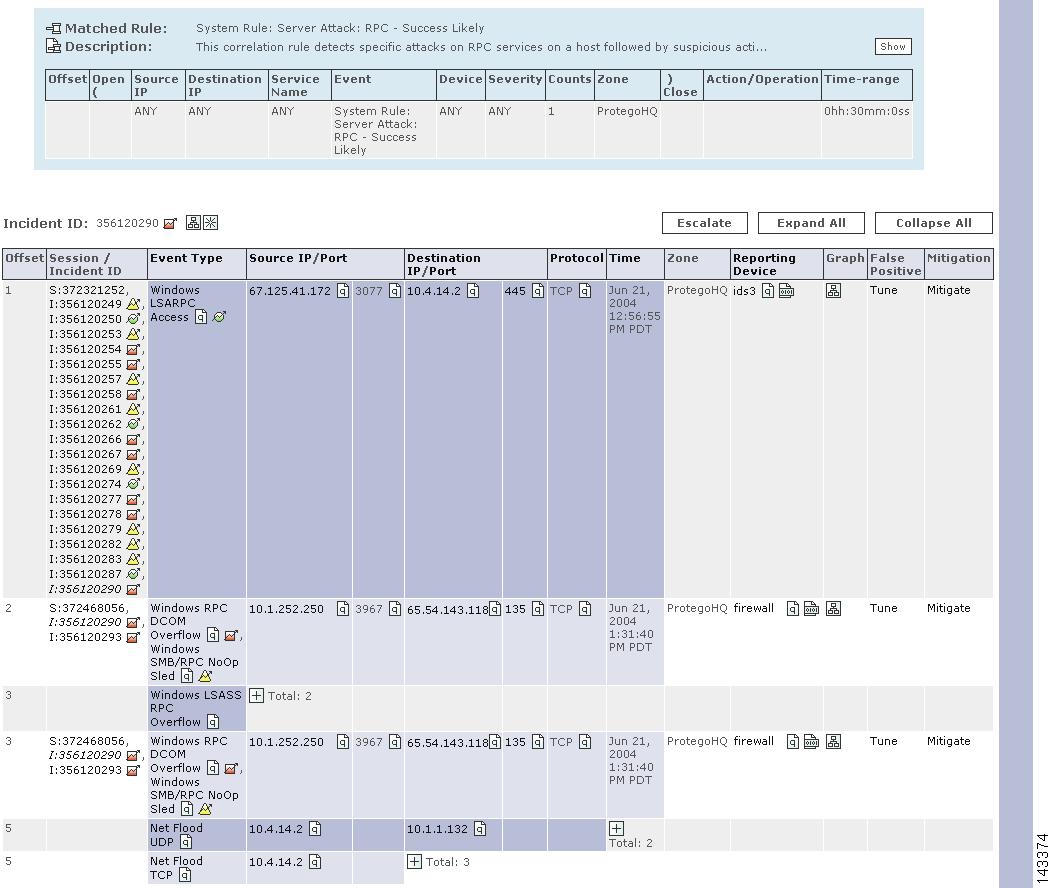
Incident Details Table
Each row of the Incident Details table represents either a session or the information common to a group of sessions. You can see all of the collapsed session information by clicking the plus signs to expand the group. You can expand or collapse all of the incident's information by clicking the Expand All or Collapse All buttons.
Figure 20-4 Expanding a Row in a Table'
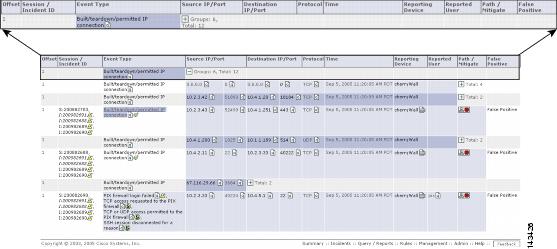
This high-density information table lets you drill deep into incidents. Click the Query
icon anywhere on this page to query on a particular criteria. Click the Raw Events
icon for raw events for a particular session. You can click the Tune link to tune incidents for False Positives, see The False Positive Page or click the Mitigate link to mitigate an attack.
Figure 20-5 Incident Table
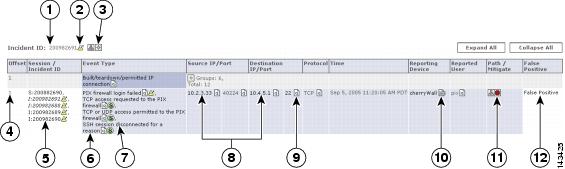
The following information describes some of the fine points of this table.
•
Sometimes rows are split into instances. The only relationship among the different instances is that they fired the same rule in the same time frame.
•
This column shows the sessions that contributed to the incident, and the other incidents those sessions belong to.
•
The Events column shows types of the firing events. Multiple firing events of the same types are shown once per session.
•
An incident's duration only includes the events that contributed to the incident firing.
False Positive Confirmation
When investigating incidents, you will invariably come across false positive events. In some cases, firing events are classified automatically by MARS as system-confirmed false positives and unconfirmed false positives. Vulnerability scanning often identifies the false positive events, but at times you must investigate events to determine their validity.
To understand the false positive nomenclature and what tasks you are expected to perform within the user interface, we must study the possibilities among three variables surrounding possible attacks: legitimate attack, valid target, and attack detected. We examine these differences in Table 20-1.
Based on the valid cases in Table 20-1, we can clearly distinguish the false positive terminology:
•
•
•
•
•
•
•
•
•
•
When a Local Controller receives an event, it is evaluated against the conditions of the defined rules. If the event satisfies the conditions of a rule, then the incident triggers. When an event triggers an incident, we refer to that event as a firing event. False positive analysis is performed for such firing events to reduce the number of false alarms.
Using built-in event vulnerability data, learned topology paths, sessionized event data, ACL analysis of layer 2 and 3 reporting devices, supporting data from 3rd-party vulnerability analysis (VA) software (such as Foundstone and eEye), and information that you provide about hosts, MARS analyzes the firing events reported to it determine whether the they hold up to a higher-level review.
In the case of MARS, a system-confirmed false positive is where, after further analysis, a firing event is determined to be invalid. Example system-confirmed false positives include:
•
•
An unconfirmed false positive is where, after further analysis, the firing event is believed to be invalid primarily due to the attack being against an invalid target. Example unconfirmed false positives include
•
•
•
For unconfirmed false positives, you must manually investigate the alarm and specify in Local Controller whether it is an actual false positive. For actual false positives, you should define a drop rule for the event. Defining a drop rule does not mean that the event is not stored in the database, you have the option of dropping the event from incident evaluation and either shoring it in the database or not. Whether you store the event in the database or not, events matching the event type and target host can no longer act as firing events. By refining the event processing in this fashion, MARS frees up your time to focus on actual incidents by more accurately correlating events into incidents and reducing noise.
As part of your operational strategy, you should strive to refine event generation and processing to tune out the possibility for false positives. You can perform such tuning at the device level, by refining what traffic or action can generate an event, and at the Local Controller level by providing more information about your network, such as identifying the operating system of hosts attached to the network segments monitored by that Local Controller.
The False Positive Page
To navigate to the False Positives page, click Incidents, and click the False Positives sub-tab.
The False Positives page is where you can see groupings of False Positives.
You can filter categories by clicking on the Select False Positive drop-down list. Your choices are:
•
For this type, the MARS needs user confirmation to determine if the target host is vulnerable to the event type in question.
•
For this type, a user has provided confirmation that a firing event is a false positive.
•
For this type, a user has provided confirmation that a firing event is a true attack.
•
For this type, the system has determined that a firing event is a false positive.
In the False Positives table, you can see how many sessions the false positive has appeared in, the event type, the false positive status confirmation icons, the event type information icon, the destination IP and its port, the destination IP information icon, its protocol, zone, and you can see the sessions that are related to the false positive.
Figure 20-6 False Positive Table
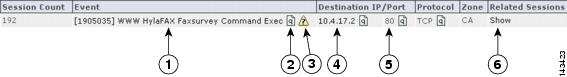
The following table shows false positive status confirmation and severity icons:Tuning False Positives
From the Incidents page or the False Positives page, you can tune false positives - to verify if they are true or false.
To Tune a False Positive
Step 1


Step 2
Step 3
Step 4
To Tune an Unconfirmed False Positive to False Positive
Step 1
Step 2
–
–
Step 3
Step 4
Step 5
To Tune an Unconfirmed False Positive to True Positive
Step 1
Step 2
To Activate False Positive Drop Rules
After you have completed tuning false positives, click Activate to immediately implement the changes.
Mitigation
Mitigation refers to the action of limiting an attacking network element's access to the network by modifying the configuration of an enforcement device, usually a switch, router, or firewall. CS-MARS can perform the following actions related to mitigation:
•
•
•
•
With Telnet, SSH, or SNMP access to switches and routers, CS-MARS can recommend and push mitigation configurations to enforcement devices, as well as generate interactive topology and incident path diagrams. Without Telnet, SSH, or SNMP access, some mitigation information can still be obtained from Cisco switches running specific IEEE 802.1X Port Based Network Access Control protocol configurations, but recommended mitigation commands must be configured manually on the enforcement devices. See Layer 2 Path and Mitigation Configuration Example for further information and procedures for configuring Layer 2 devices to receive CS-MARS mitigation commands. Static and Dynamic Network Information
Topology information obtained from access to relatively permanent Layer 2 and Layer 3 devices is called Static Information in the HTML interface. Dynamic Information refers to frequently changing information such as host names, or DHCP-leased IP addresses obtained through devices or agents that report dynamic events, such as 802.1X access control configurations, the Cisco Security Agent, or other security suite software. The CS-MARS can determine a mitigation point and an enforcement device if a Cisco 802.1X-enabled switch is running DHCP-snooping with RADIUS authentication through a Cisco Access Control Server (ACS). When a DHCP-snooping transaction is completed, the switch sends a log message to the ACS. The ACS logs are sent to the CS-MARS to report the Source IP address, user name, connection start and stop times, physical interface, and MAC address of each 802.1X client. Because 802.1X clients are often mobile, remember that 802.1X mitigation actions can occur only when the attacking host is currently connected to the network.

Note
No mitigation possible. Enforcement device exists but interface names conflict. Determine appropriate interface and mitigate manually.
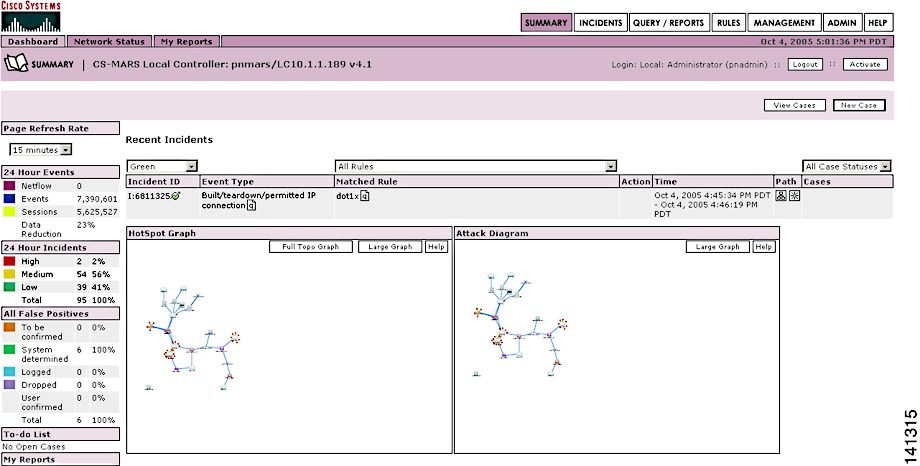
802.1X Mitigation Example
In this procedure, an incident is observed on the Network Summary page, as shown in Figure 20-7, and mitigated through 802.1X network mapping.
Prerequisites for Mitigation with 802.1X Network Mapping
To perform mitigation with 802.1X network mapping with CS-MARS, the following prerequisites are required:
•
•
•
•
•
•
Figure 20-7 Summary Page Displaying Incident to Mitigate
Procedure for Mitigation with 802.1X Network Mapping
Step 1
Step 2
Figure 20-8 Incident Detail Page Displaying Red Mitigation Icon
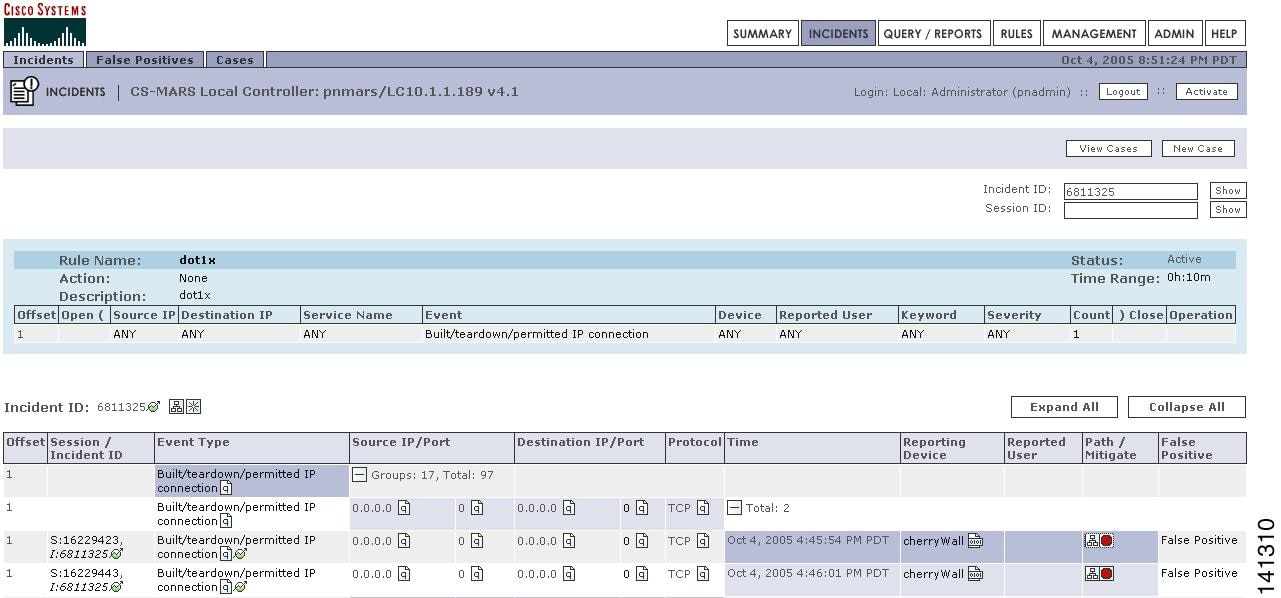
Step 3
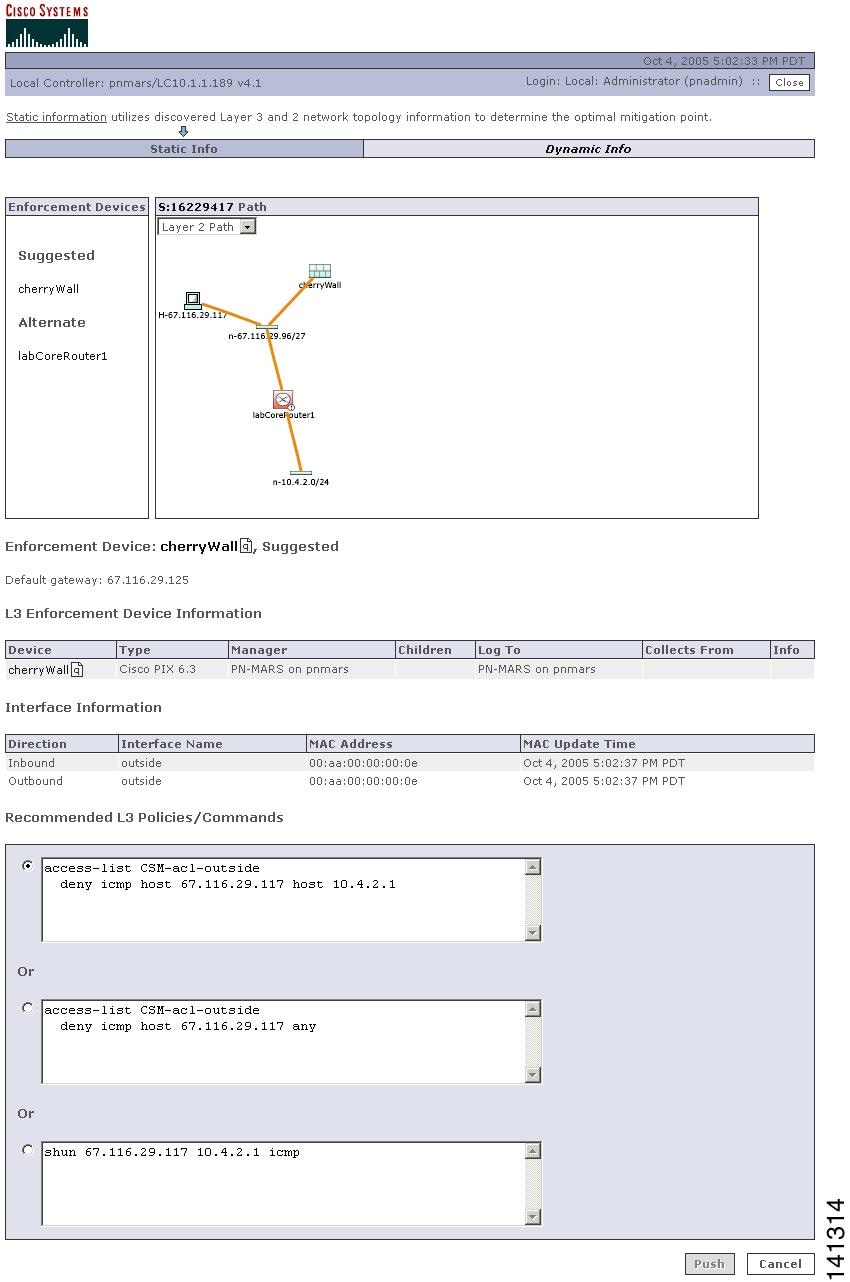
The Mitigation pop-up window appears, with any possible Static topology and mitigation information, as shown in Figure 20-9.CS-MARS recommends enforcement devices and mitigation commands. For static information, if the network is entirely discovered and CS-MARS has command level access to a Layer 2 enforcing device, the Push button appears red, otherwise it is gray. In Figure 20-9, CS-MARS does not have sufficient static information to identify a Layer 2 enforcement device, but can suggest mitigation commands for discovered Layer 3 devices (Cisco PIX firewall, and a Cisco router). Layer 3 mitigation commands must be configured manually on the Layer 3 devices.
Figure 20-9 Path Information Pop-up Window
Step 4
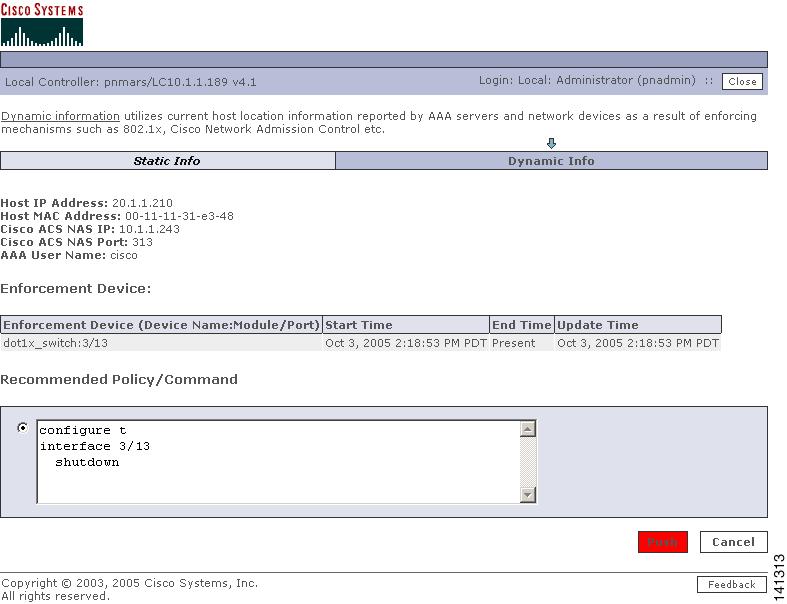
The Dynamic Mitigation window appears with host name, IP address, MAC address, and connection status as shown in Figure 20-10.Figure 20-10 Dynamic Mitigation Information
Step 5
Step 6
Step 7
If the Push button is gray, the mitigation command must be manually configured on the enforcement device.
Note
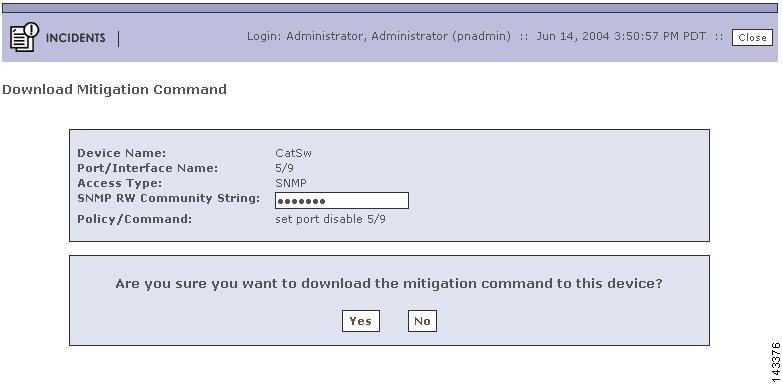
Figure 20-11 Mitigation Confirmation Dialog
Step 8
Display Dynamic Device Information
To display current, session, and all historical information for an IP address on an 802.1X connection, follow these steps:
Step 1
Step 2
When examining an attacking host, the Source IP address is more relevant.Step 3
Step 4
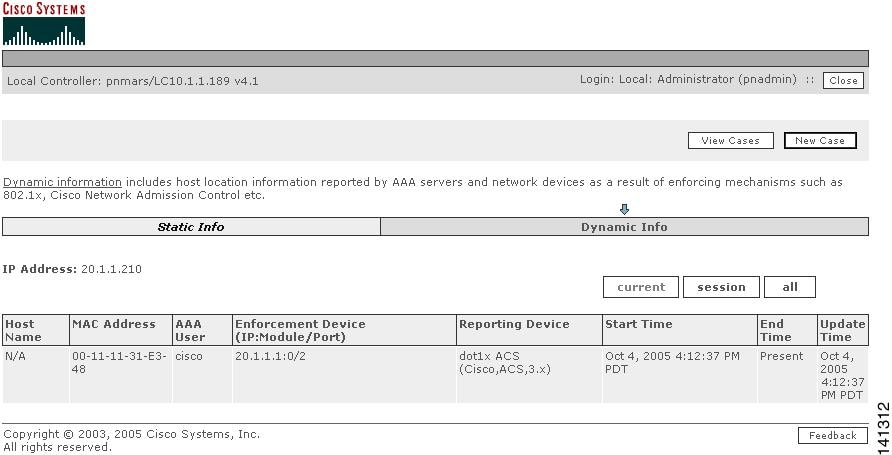
Dynamic information can be derived from 802.1X configurations, Cisco Security Agents, or from other security software suites. The current connection information is the most recent network information available for the selected IP address.Step 5
Figure 20-12 Dynamic Information—Current Connection Status
Step 6
Figure 20-13 Dynamic Information History of a Specified IP Address
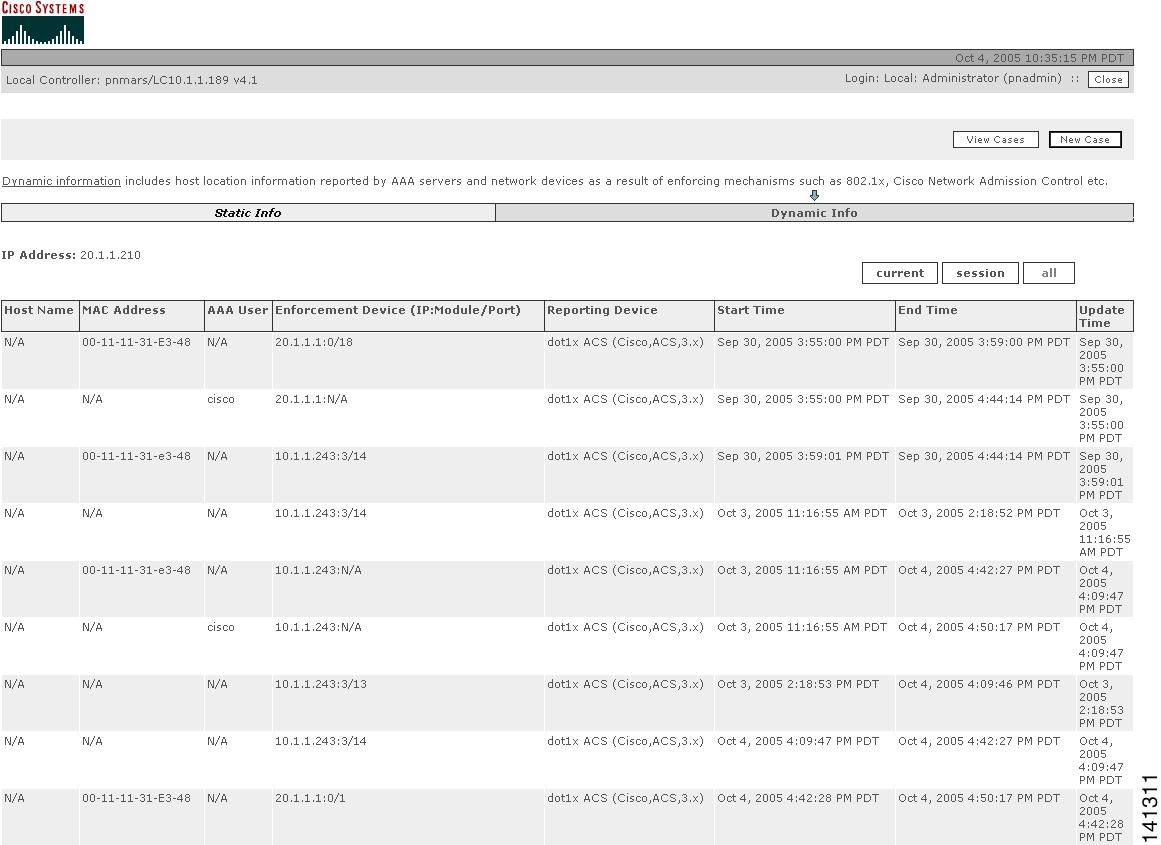
Step 7
Note
Click the Yes button to confirm the mitigation command and have it take effect.
Virtual Private Network Considerations
Currently, MARS cannot display accurate Path/Mitigation information or compute the complete route of an attack originated by a host with a source IP address on a virtual private network (VPN). MARS can identify the attacking host if the VPN IP address of the host was supplied by a Cisco 3000 Series VPN Concentrator configured as a MARS reporting device.
Note
To identify a host attacking from a VPN, perform a query of "Cisco VPN User connected/disconnected" events for the Cisco VPN Concentrator device. The attacking host name or next network element is disclosed in the raw messages of the events.
Layer 2 Path and Mitigation Configuration Example
This section provides a starting point for configuring MARS to perform Layer 2 (L2) path analysis and mitigation using a Cisco switch. It contains the following sections:
–
–
–
–
–
Prerequisites for Layer 2 Path and Mitigation
•
•
Components Used
•
•
•
•
Network Diagram
This section uses the network setup shown in the Figure 20-14.
Figure 20-14 Network Setup
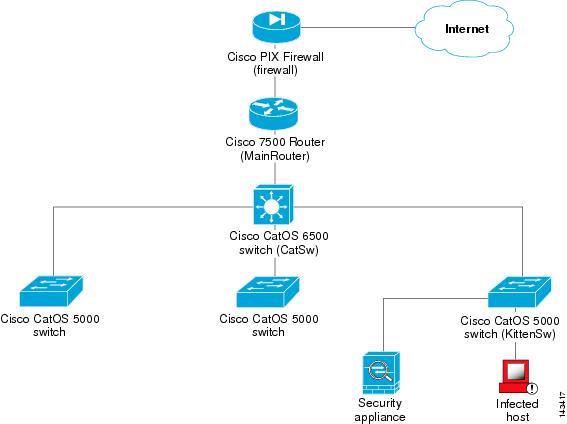
Mitigation uses the Layer 2 path data obtained via SNMP or Telnet protocol to download a mitigation command from the MARS to the device. The Layer 2 path is based on MAC addresses, the Layer 2 forwarding table, and the Layer 3 path. MAC addresses and the Layer 2 forwarding table are obtained using SNMP.
To make the Layer 2 path and mitigation work correctly:
•
•
Note
•
For example, given a topology such as the one in the preceding figure, follow these instructions to discover these devices.
Procedures for Layer 2 Path and Mitigation
Add the Cisco Catalyst 5000 with SNMP as the Access Type.
Step 1
Figure 20-15 Configure Cisco Switch CatOS
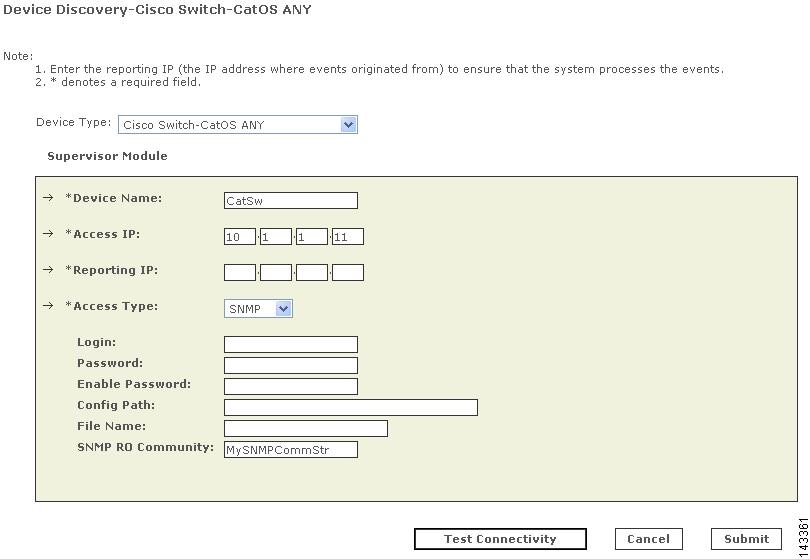
Step 2
Step 3
Step 4
Step 5
SNMP:
–
–
–
TELNET:
–
–
–
Step 6
Step 7
Add the Cisco Catalyst 6500 with SNMP as Access Type (Layer 2 only).
Step 1
Figure 20-16 Configure Cisco Switch CatOS
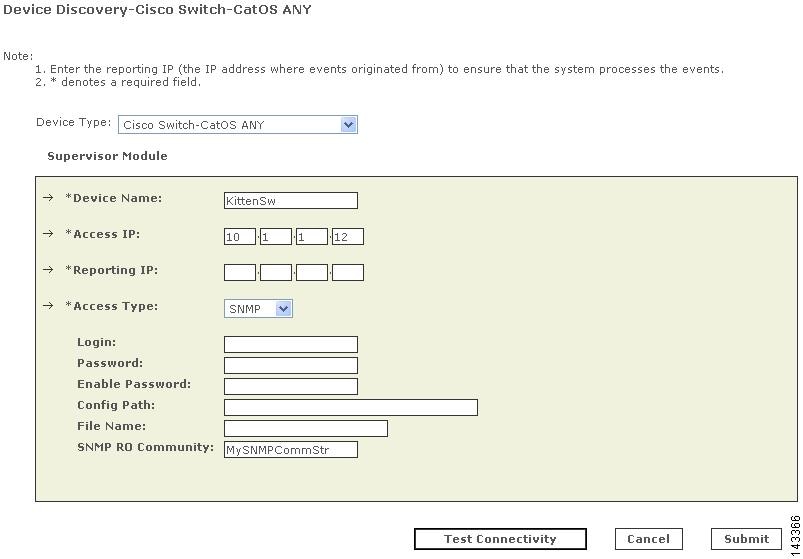
Step 2
Step 3
Step 4
SNMP:
–
–
–
TELNET:
–
–
–
Step 5
Step 6
Add the Cisco 7500 Router with TELNET as the Access Type
Step 1
Figure 20-17 Configure Cisco IOS 12.2
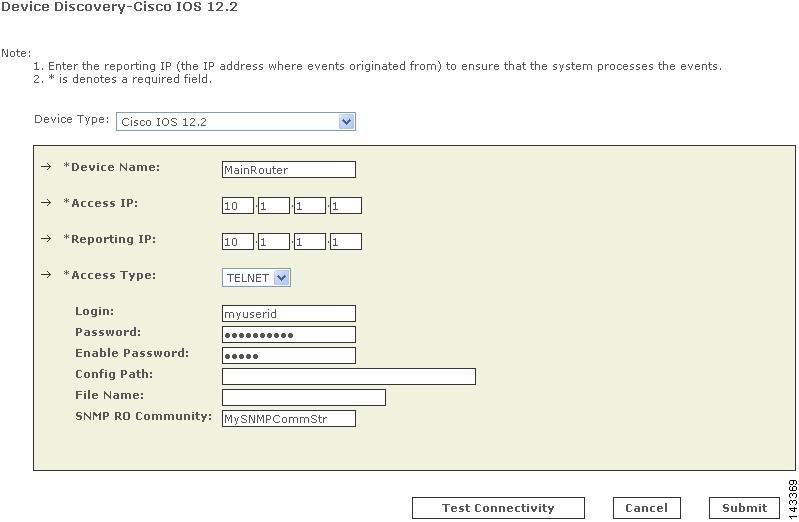
Step 2
Step 3
Step 4
If you have entered an Access IP address, from the Access Type pull-down menu, select FTP:
FTP:
–
–
–
–
SNMP:
–
–
–
SSH:
–
–
–
TELNET:
–
–
–
Step 5
Step 6
Verify the Connectivity Paths for Layer 3 and Layer 2
Once you have a session, you can view the Layer 3 and Layer 2 topology paths. There are several ways to obtain a session.
•
Step 1
Figure 20-18 Incident Details screen
Step 2
•
Step 1
Figure 20-19 Query Event Data screen
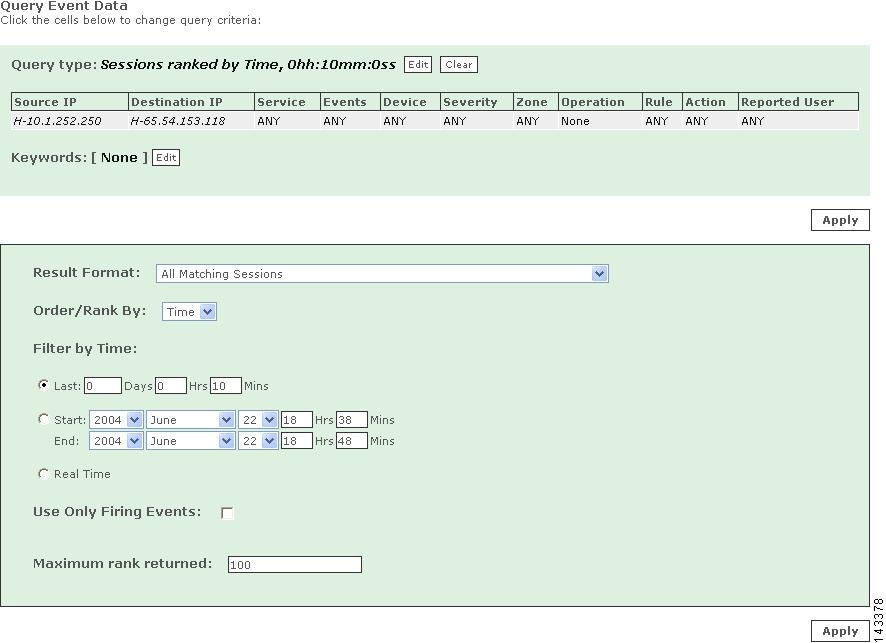
Step 2
Figure 20-20 Query Results screen
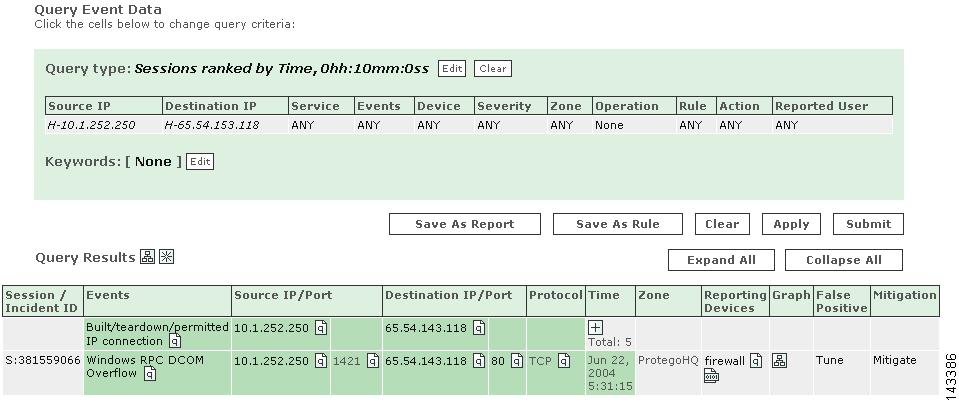
Step 3
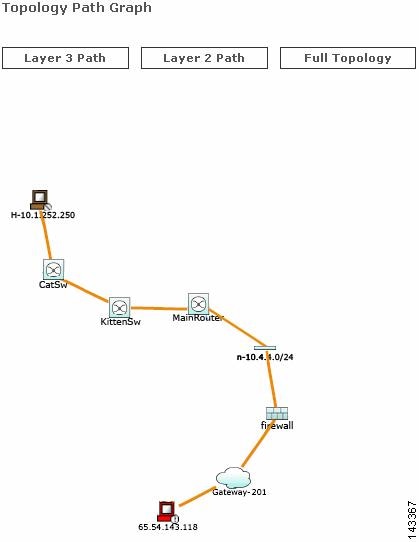
The first topology path to appear is the Layer 3 topology graph:
Figure 20-21 Layer 3 topology graph
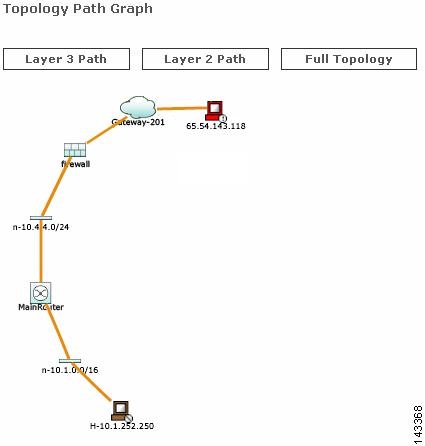
Under Topology Path Graph, click the Layer 2 Path button to view the Layer 2 topology graph:
Figure 20-22 Layer 2 topology graph
Perform Mitigation
Once you identify the compromised host (in this example, 10.1.252.250 connected to CatSw), it is critical to prevent it from attacking other hosts in the same subnet or other parts of the network. The MARS provides one-click mitigation that lets you isolate the compromised host from the rest of the network.
To perform mitigation, perform these steps:
Step 1
Figure 20-23 Mitigation Information screen
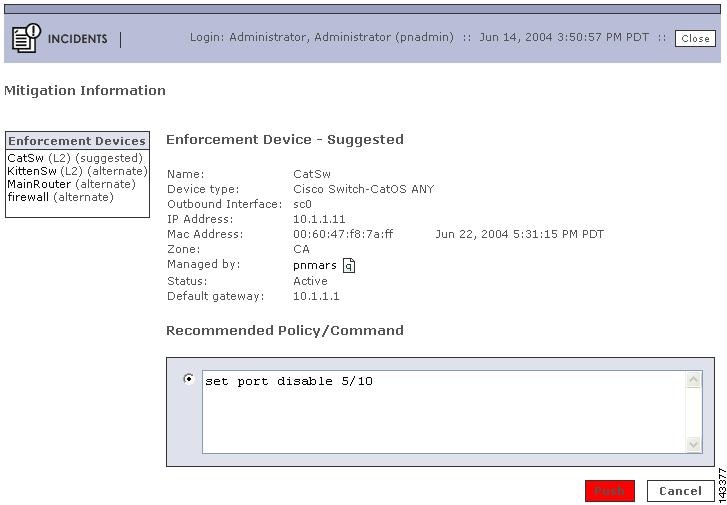
This screen contains information about the device, along with recommended policies or commands for mitigating the compromised host (in the example, 10.1.252.250).
Step 2
Note
Figure 20-24 Mitigation Confirmation screen
Note
Step 3


 Feedback
Contact Cisco
- Open a Support Case

- (Requires a Cisco Service Contract)
This Document Applies to These Products
- Collaboration Endpoints - Retired Products
- Conferencing - Retired Products
- Contact Center - Retired Products
- Optical Networking - Retired Products
- Routers - Retired Products
- Security - Retired Products
- Servers - Unified Computing (UCS) Retired Products
- Storage Networking Retired Products
- Switches - Retired Products
- Video - Retired Products
- Wireless - Retired Products