
Dashboards
The dashboards in the Cisco Identity platform provide high-level views into different insights and focus areas with associated key metrics based on your connected identity platforms.
This article provides definitions and information about functionality that exists across all of the various dashboard sections and tabs including:
- What is a widget?
- Customizing Dashboards
- Sharing and exporting dashboard data
For specific information about each dashboard section or page, such as particular widgets, refer to the relevant documentation links listed below for particular dashboard you are interested in.
How the different Dashboards are organized
Select Dashboards in the left hand menu to navigate to the Dashboards landing page. Once on the Dashboards page, you will notice that the Dashboard is organized in sections for each themed area, with some sections containing tabs with dashboards on more granular themes.
Select the Dashboard header (as seen in the screenshot below) to navigate between the different themed areas:
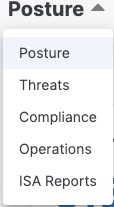
Dashboards include:
- Posture Dashboards surface hygiene gaps across different entities within your environment that increase your org's exposure to risk. The Posture Dashboard section has various tabs that each represent a dashboard that highlights posture issues across a more granular topic including:
- Identities provides some high level metrics about your organization's identities and their overall posture
- Non-Human Identities is similar to Identities, but focuses solely on non-human identities such as service accounts, mailboxes, break glass accounts, MCP Servers, etc.
- MFA provides detailed metrics about your organization's adoption of multi-factor authentication methods and passwordless factors
- Devices surfaces insights into the health and posture of the devices that have been discovered in your organization's environment
- Applications gives you high level visibility into the Apps that exist within your org and their utilization, or lack thereof
- Threats highlights risks or concerning user behavior that should be prioritized for investigation and remediation to keep your organization secure
- Compliance shares consolidated info about your organization's progress with check failures
- Operations contains status info for your connected Sources, data on admin actions taken, and a quick launch into the Onboarding Checklists that will walk you through how to quickly get up and running with Cisco Identity
- ISA Reports
What is a widget?
When reading about the different Dashboard elements, and even other Cisco Identity pages, you will see that our documentation often refers to "Widgets". A widget refers to a specific element on a page that contains information and can be an individual piece of info or a group of related info. Examples of a widget include data visualizations (ex: bar graph, pie graph or other graphical element), numerical data with only one or multiple numbers, or other text.
Every widget is in a box and will have a slight outline around the information, regardless of the type or amount of information present (as seen in the screenshot below taken from the User 360)
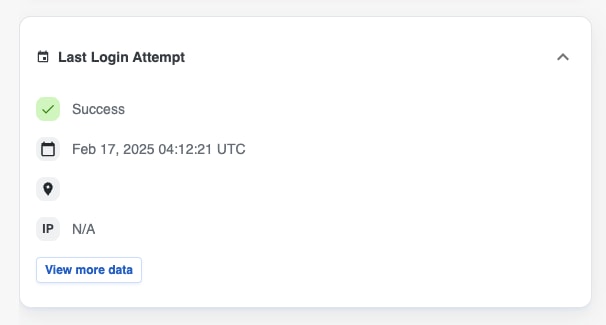
Every widget within a Dashboard page can be customized to better align with your particular interests or active projects. Any changes made to a Dashboard page will only be reflected in your environment - other Cisco Identity users will not see changes that you made. For more information on customizing the dashboard, please refer to the Tailoring your Dashboards section below.
Dashboard Functionality
The functionality described in this section of the article can be found on all of the Dashboard pages within Cisco Identity.
Tailoring your Dashboard
There are several ways that the Dashboards can be customized to meet your needs and highlight the data that is most relevant to your organization. Any customizations made will be respected within the PDF Report Export.
Note: Customizations made to any Dashboard tab are specific to the user and are only visible to the user who made the changes. We currently do not support customizations that are visible to all users tenant-wide.
To customize a given Dashboard page, navigate to the desired Dashboard and select the Configure button in the top right corner of the dashboard page. Once you select Configure, the available customization options (which are described in more detail below) will appear and can be used.
After you have finished making your customizations, be sure to select Save Changes. If you do not wish to retain the changes made, select Cancel.
Create Custom Counter Widgets
You can add a custom counter widget based on Saved Filters that you have created on the Users or Applications pages.
After selecting Configure, select the + Add counter button on the upper right corner of the page and select the saved filter you would like to add to the ISA Report Dashboard. The custom counter will be added to the dashboard page (often at the bottom) and you can then move it to the desired location on the page.
If your organization's tenant does not have any saved filters available, you will be prompted to create one. Please refer to our Saved Filters documentation if you would like to learn more about using saved filters.

Add or Remove Default Widgets
You can select or deselect from a library of default widgets (visualizations and counters) to customize the data that is shown within your ISA Report.
You can add or remove default items by selecting the Configure button in the top right corner of the dashboard page and then pressing Select Widgets.

You can also remove any widget by selecting the X in the right corner of any existing widget.
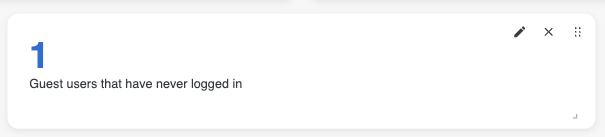
Rearrange Widgets
To reposition a widget or section header, click the six dot button located at the top right corner of each widget to drag and drop it to the desired location, allowing your dashboard to emphasize the most important or urgent information.
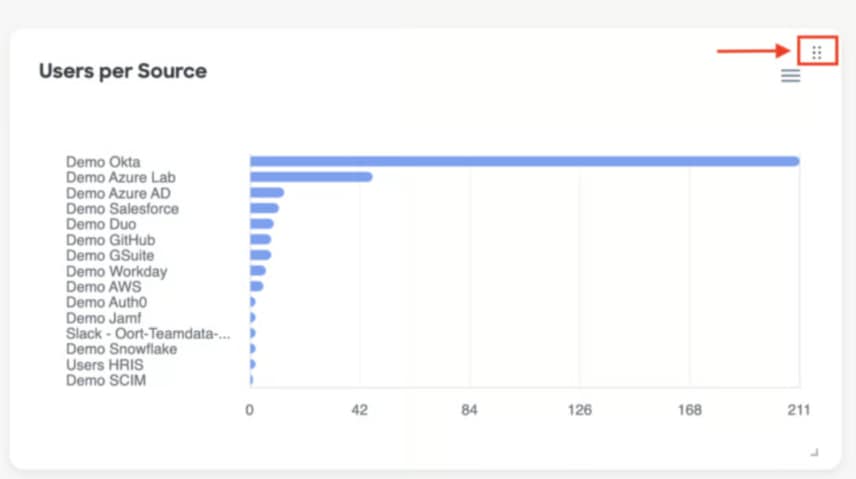
Resize Widgets
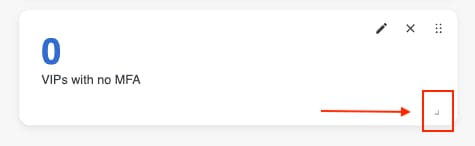
You can also make any widget bigger or smaller depending on your needs and preferences. Select the arrow button in the bottom right corner of any widget, then drag the corner until your widget reaches the desired size.
Sharing and Exporting
Each Dashboard has 2 options to easily share the data presented - Share and Download to PDF. The buttons to complete both of these actions are located on the upper right side of the page.
Select the Share icon button found at the top right corner to copy a link to that exact page that can be easily pasted, bookmarked or shared with anyone who has the appropriate access to your Cisco Identity tenant so that they can quickly get to the same page in the platform.

Select the Download PDF Report button, which is next to the Share icon button, to generate a PDF export of that full dashboard page, including any customizations or annotations made, to share with other members of your organization who do not have access to the platform.
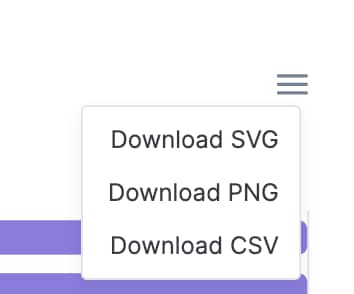
Additionally, across the different Dashboard tabs, many of the visualizations seen in a widget can be exported into different formats by selecting the 3 line button in the top right corner of a specific widget. If the widget does not have this button, it means it cannot be exported; however, you can still screenshot the visualizations if you'd like to use them in presentations, etc.
Downloading as a SVG or PNG will export an image, whereas downloading as a CSV will export the raw data for you in CSV format.
Onboarding Checklists

This functionality is not currently available in Cloud Control.
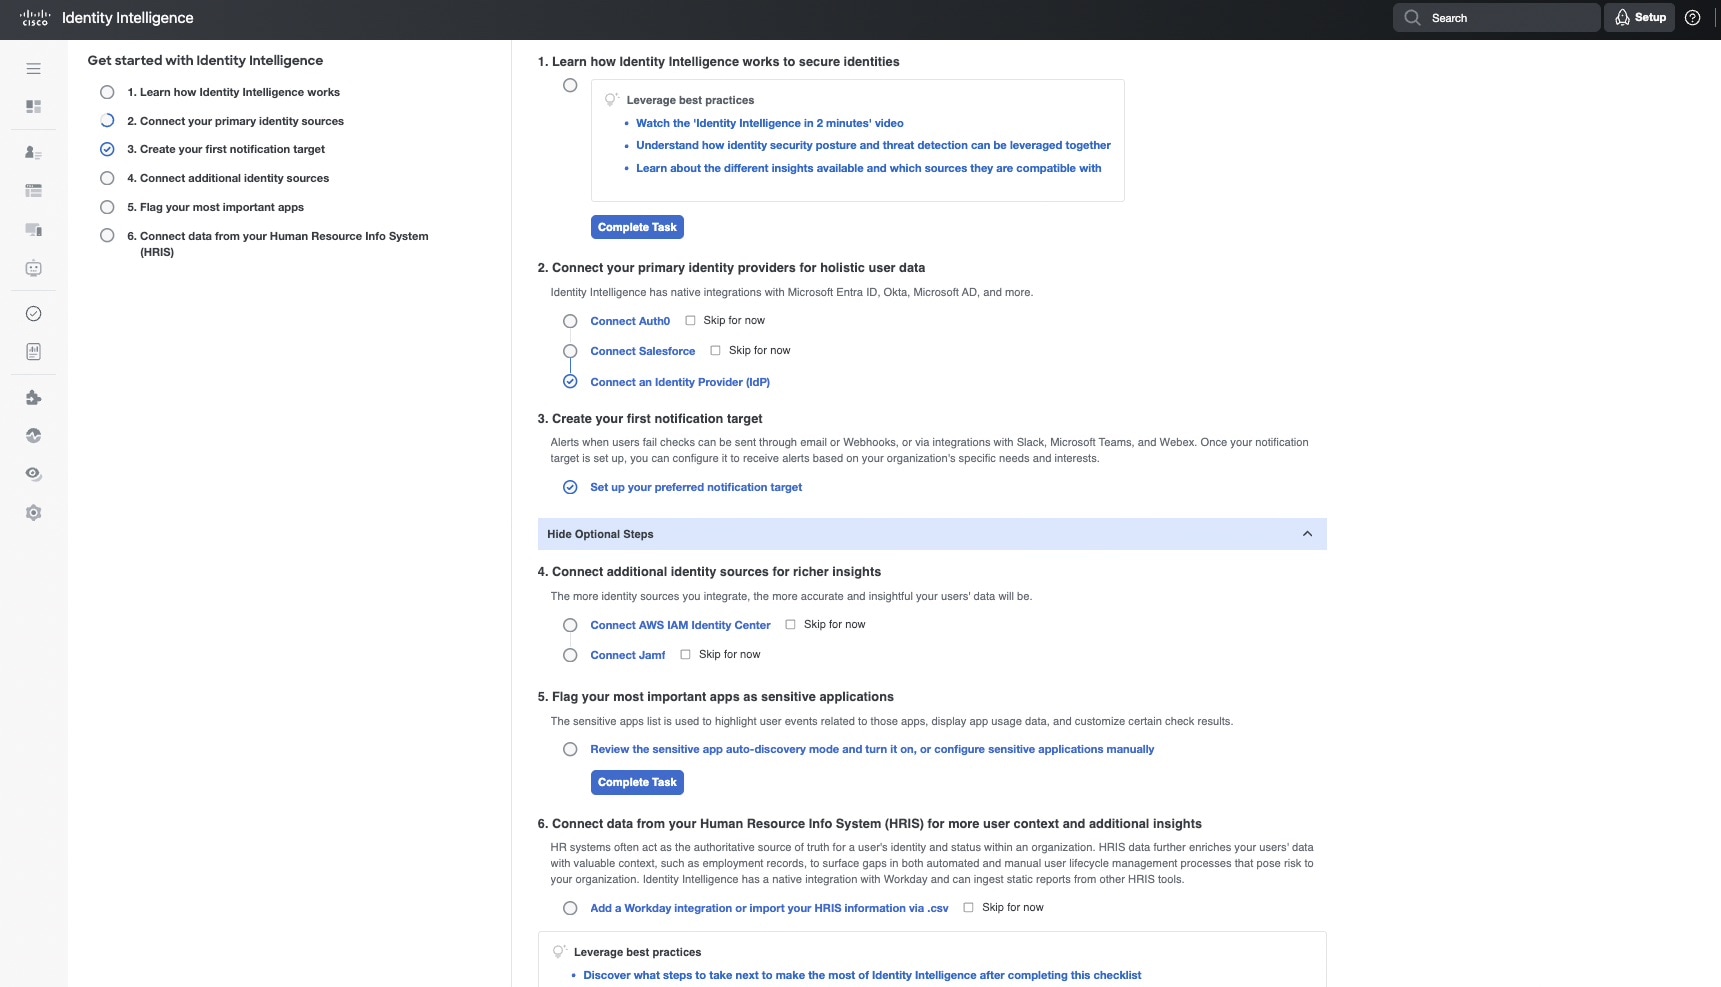
The Onboarding Checklist provides a short list of easy to follow steps to help you set up your Cisco Identity tenant, while also explaining critical features and functionality available in the platform, so that you can get the value from the platform as soon as possible.
How to access the Onboarding Journeys
The onboarding journeys can be accessed from a couples places within Cisco Identity.
The simplest way is using the Setup button in the top menu bar, to the right of the search bar. Select Setup to immediately navigate to the Checklist.

The second way is via the Setup Progress widget within the Operations Dashboard. Select Resume to navigate to the Checklist.

Who can access the Onboarding Journeys?
Currently, only Admins can access the Cisco Identity Onboarding Journeys.
Users with lower permissions are not able to complete the actions in the checklist and therefore, the Setup button and Dashboard widget are not visible to them at this time. This may change in the future when additional checklists are added.
How to use the Onboarding Journeys
Each Onboarding Journey has multiple steps that should be completed. Some steps may be dependent on or build upon previous steps in the journey, so it is typically best to follow the steps as written to ensure everything runs smoothly.
Note: Today there is only one journey available (Get Started) but others will be added in the future!
Each step has at least one task associated to it. Select the task text to get taken to the relevant page within Cisco Identity to complete the task.
When a task is not complete, you will see a blank circle next to the task. When a task is complete, the blank circle will either turn into a checked circle for you automatically, or will need to be manually completed using the "Mark as Complete" button.
What should we do after we complete the Get Started journey?
Today there is only one Onboarding Journey available - the "Get Started" journey - but in the future we will be adding more journeys for specific product areas.
In the meantime, once you have completed all the steps in the Get Started journey, we highly recommend reading this documentation that details next steps to help you understand where to start with the data, how to leverage other features to help with different tasks, and how to start operationalizing the data Cisco Identity provides to make it part of your team's day to day processes.
Threats
Cisco Identity has built a Threats Dashboard to help you easily identify and monitor potential risky behavior occurring within your organization so that they can be prioritized for investigation and remediated before becoming a bigger issue.
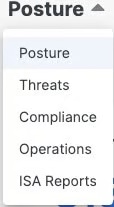
To access the Threats Dashboard, navigate to the Dashboards landing page via the left hand menu item. Once on the Dashboards page, select the Dashboard header on the page (Default is Posture) as shown in the screenshot below to open a drop down with the different available Dashboards and then select Threats.
The Threats dashboard enables you to visualize a variety of potential threats, including:
- Non-Human Identities Risks
- Service Account Authentications by NIST Assurance Level
- Factor Usage by NIST Assurance Levels
- MFA Threats
- Users per Trust Level
- Risky Users Distribution Over Time
- Risky Users Accessing Sensitive Applications
- Sensitive Applications Activity
- Sensitive App Authentication
- Sign-In Attempts by Location Over the Past 30 Days
- Sign-In Attempts by Country
- Insights & Unusual Activity
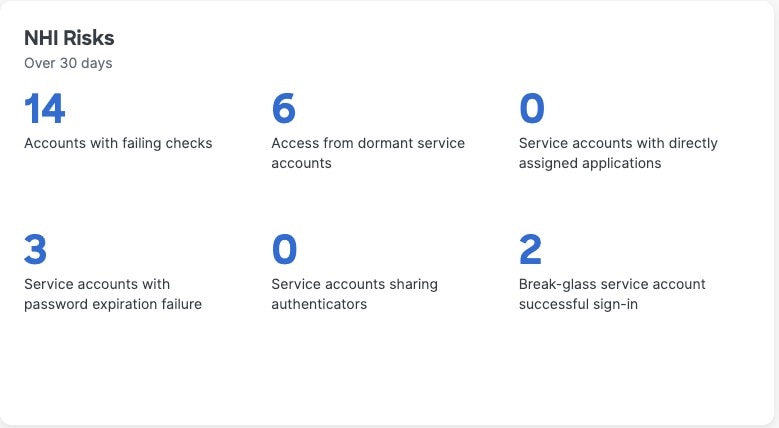
NHI Risks (Over 30 days)
Non-Human Identities (NHIs) are identities that do not represent humans within your organization, rather they are "digital" identities used, for example, to manage services, infrastructure, and IT entities. NHI risks include privilege elevation, data leakage, unsecure authentication, and others.
This section highlights potential security vulnerabilities and risky behaviors associated with NHIs. Refer to our NHI Posture Dashboard documentation for more detailed descriptions on each counter in this widget.
Selecting any of the numbers within this widget will take you to the relevant page, pre-filtered on the selection you made.
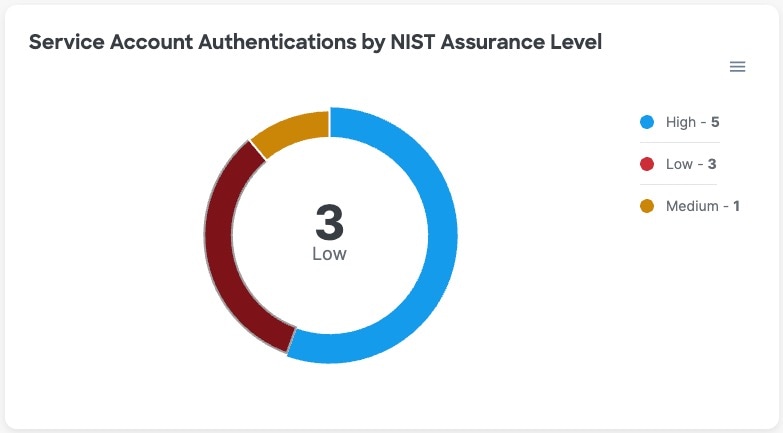
Service Account Authentications by NIST Assurance Level
This pie chart displays breakdown of all multi-factor authentication usage per Service Account over the last 30 days, categorized by National Institute for Standards and Technology (NIST) assurance level. You can use this data to track how safely service accounts in your organization are used log in to work systems over time. Accounts that regularly use weak forms of MFA to access resources are more susceptible to getting hacked because those low assurance methods are easier to breach using simple techniques like MFA or push harassment, Adversary in the Middle (AitM) phishing attacks, social engineering, and so on.
Hovering over a segment in the pie chart will display a small tooltip with the given assurance level and the count of service accounts making up that segment.
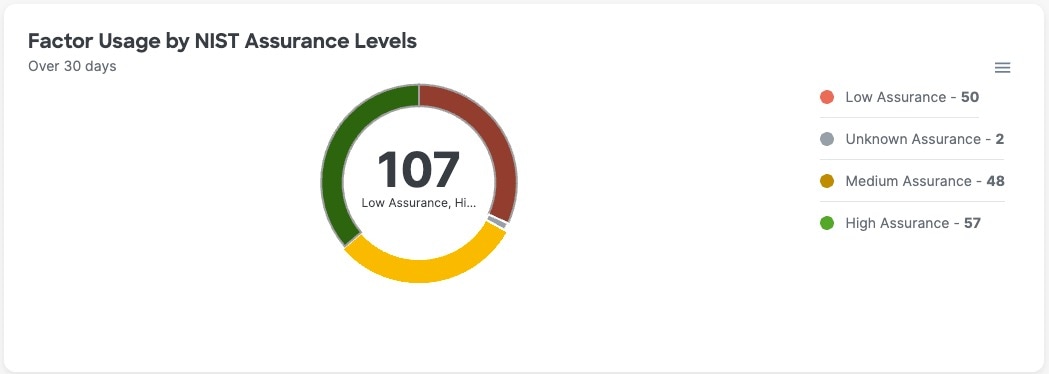
Factor Usage by NIST Assurance Levels
Pie chart that displays a breakdown of all multi-factor authentication usage per user over the last 30 days, categorized by National Institute for Standards and Technology (NIST) assurance level. As you roll out more secure MFA, use this data to track trends over time. Users with weak forms of MFA are more susceptible to getting hacked because those low assurance methods are definitely very easy to breach using simple techniques like MFA or push harassment, adversary in the middle phishing attacks, social engineering, and so on.
Hovering over a segment in the pie chart will display a tooltip with the given assurance level and the count of users making up that segment.
For example, in the screenshot below, we can see that 48 users have used a Medium assurance factor at least 1 time over the last 30 days.
MFA Threats
This widget surfaces risky behavior related to MFA adoption that should be investigated and remediated. Selecting any of the numbers within this widget will take you to the relevant page, pre-filtered on the selection you made.
Refer to our MFA Posture Dashboard documentation for more detailed descriptions on each counter in this widget.
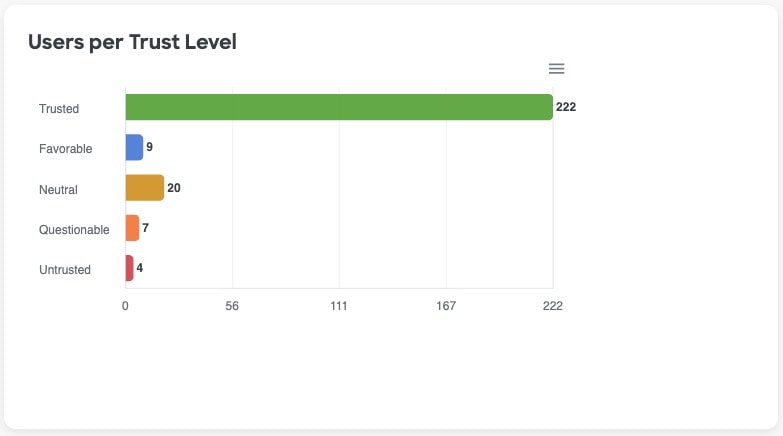
Users per Trust Level
The Users Per Trust Level widget displays the current breakdown of the number of identities in each Trust Levels across your organization.
Not only does this graph give you a sense of where your users are at today, but it is also a quick and easy way to find users that should be prioritized for investigations.
Selecting one of the bars in this visualization will take you to the Users page, pre-filtered for the Trust Levels selected, so you can see all users who currently have a particular Trust Level.
To learn more about User Trust Levels, what factors are included in the calculation, how it is calculated, and more, see our general documentation about User Trust Levels.
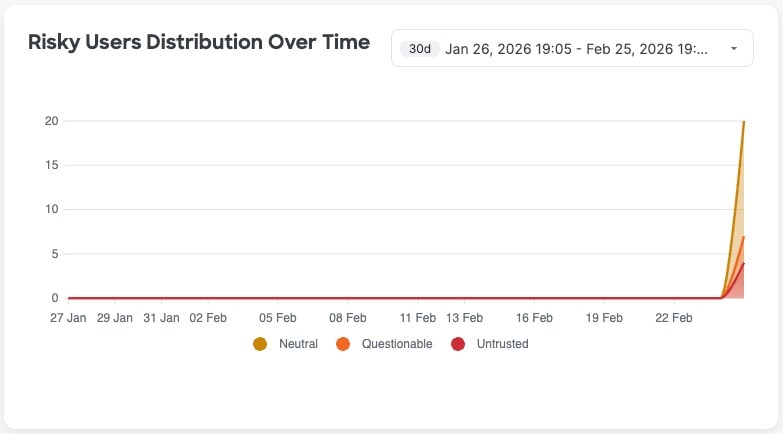
Risky Users Distribution Over Time
Risky Users Distribution Over Time depicts fluctuations to the trust levels of the users in your organization over time. This widget can be useful to identify sudden spikes in User Trust Levels.
By default, this widget looks at the last 30 days; however, you can use the timeframe filter in the top right-hand corner of the widget to change the widget's timeframe to be longer or shorter depending on your needs.
If you hover over a data point in this widget, which are marked by a dot on the trend line, you will see a tooltip with the count of users, segmented by Trust Level, for that given date. Selecting a value in the legend below the graph will remove the corresponding data points from the visualization.
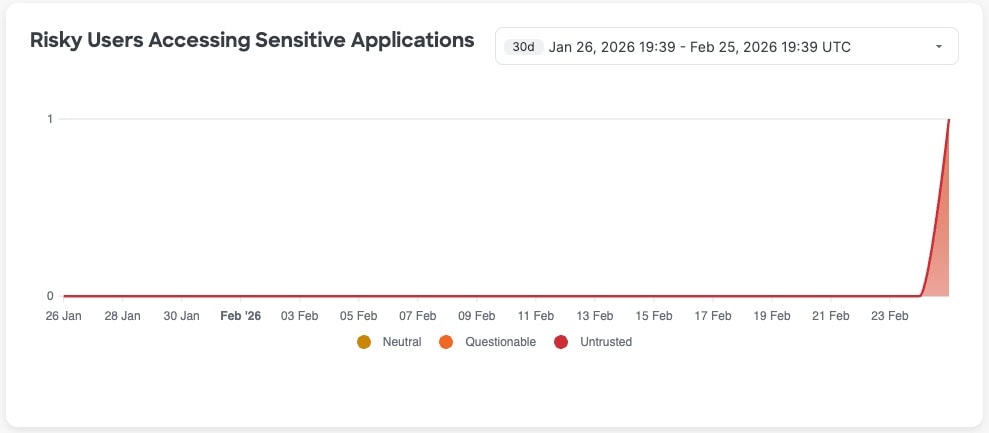
Risky Users Accessing Sensitive Applications
This widget depicts the number of users with neutral, questionable, and untrusted trust level that are accessing sensitive applications over time.
Users with lower trust levels should not be allowed to access sensitive applications. For example, an untrusted user might have a compromised account. This user, in turn, might be leaking customer data, employee personally identifiable information (PII), or sensitive company info like financial records or intellectual property,
By default, this widget looks at the last 30 days; however, you can use the timeframe filter in the top right-hand corner of the widget to change the widget's timeframe to be longer or shorter depending on your needs.
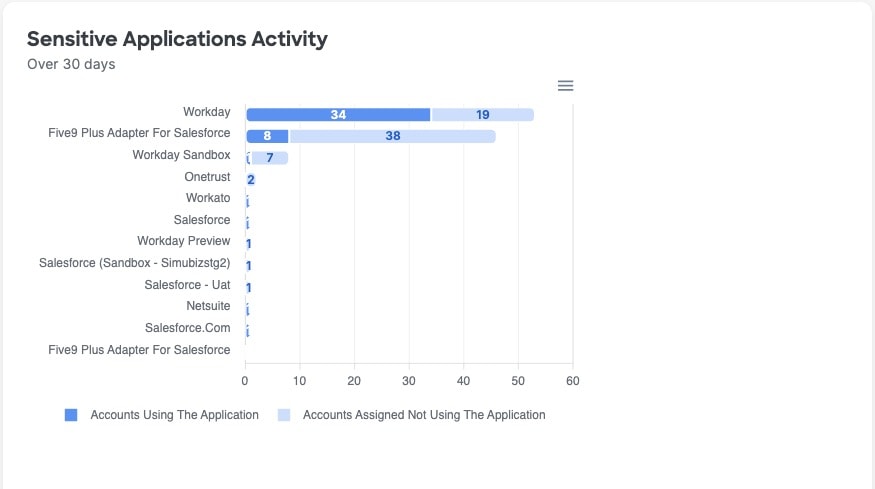
Sensitive Applications Activity
Bar graph that displays the number of accounts using a sensitive application and assigned but not using the application. Click any bar on the graph to go to the Users page, filtered by that application.
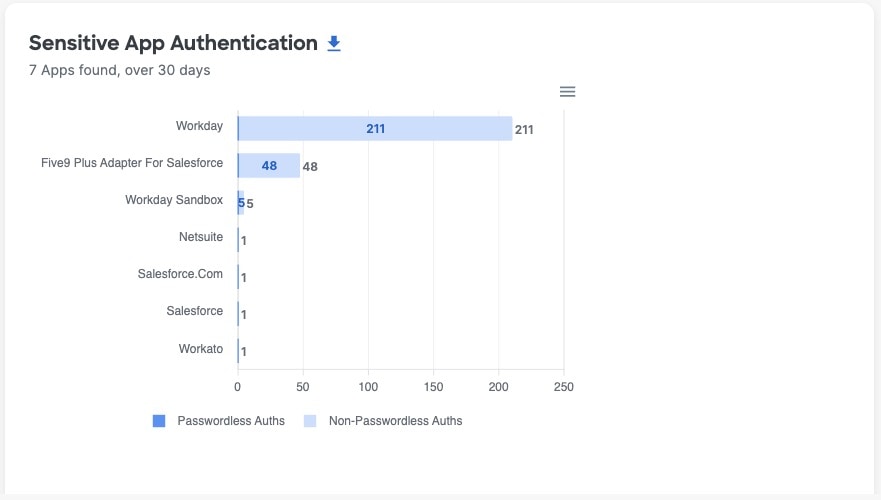
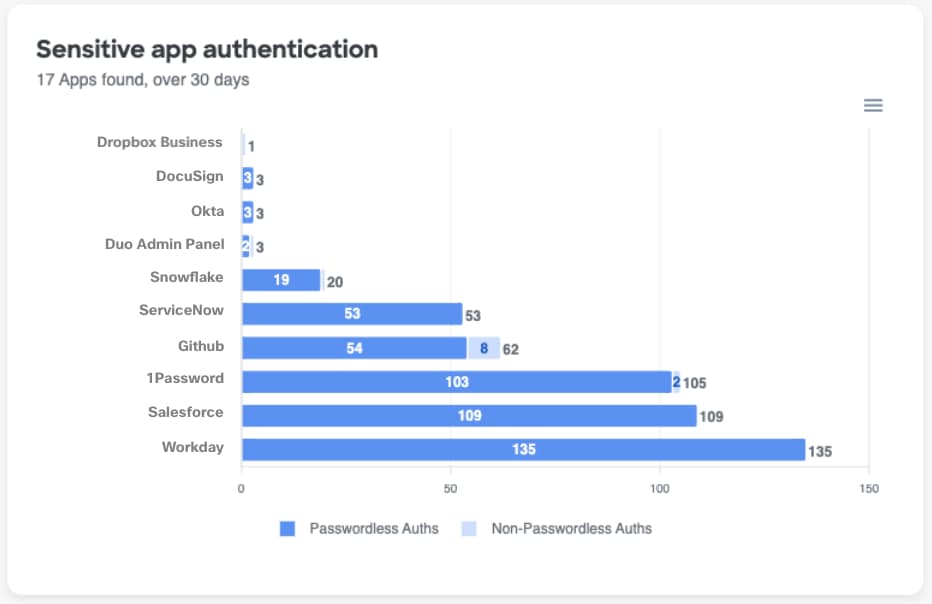
Sensitive App Authentication
Bar graph that displays the number of password-using and passwordless authentications for sensitive application.
Refer to our MFA Dashboard documentation to learn more about how to use this widget.
Sign-In Attempts by Location Over the Past 30 Days
This map displays the number of sign-in attempts per country over the past 30 days, which can help you verify recent sign-in attempts and or quickly identify and pivot to unusual or unexpected sign-in attempts using the map data only, or in conjunction with the Sign-In Attempts per Country widget.
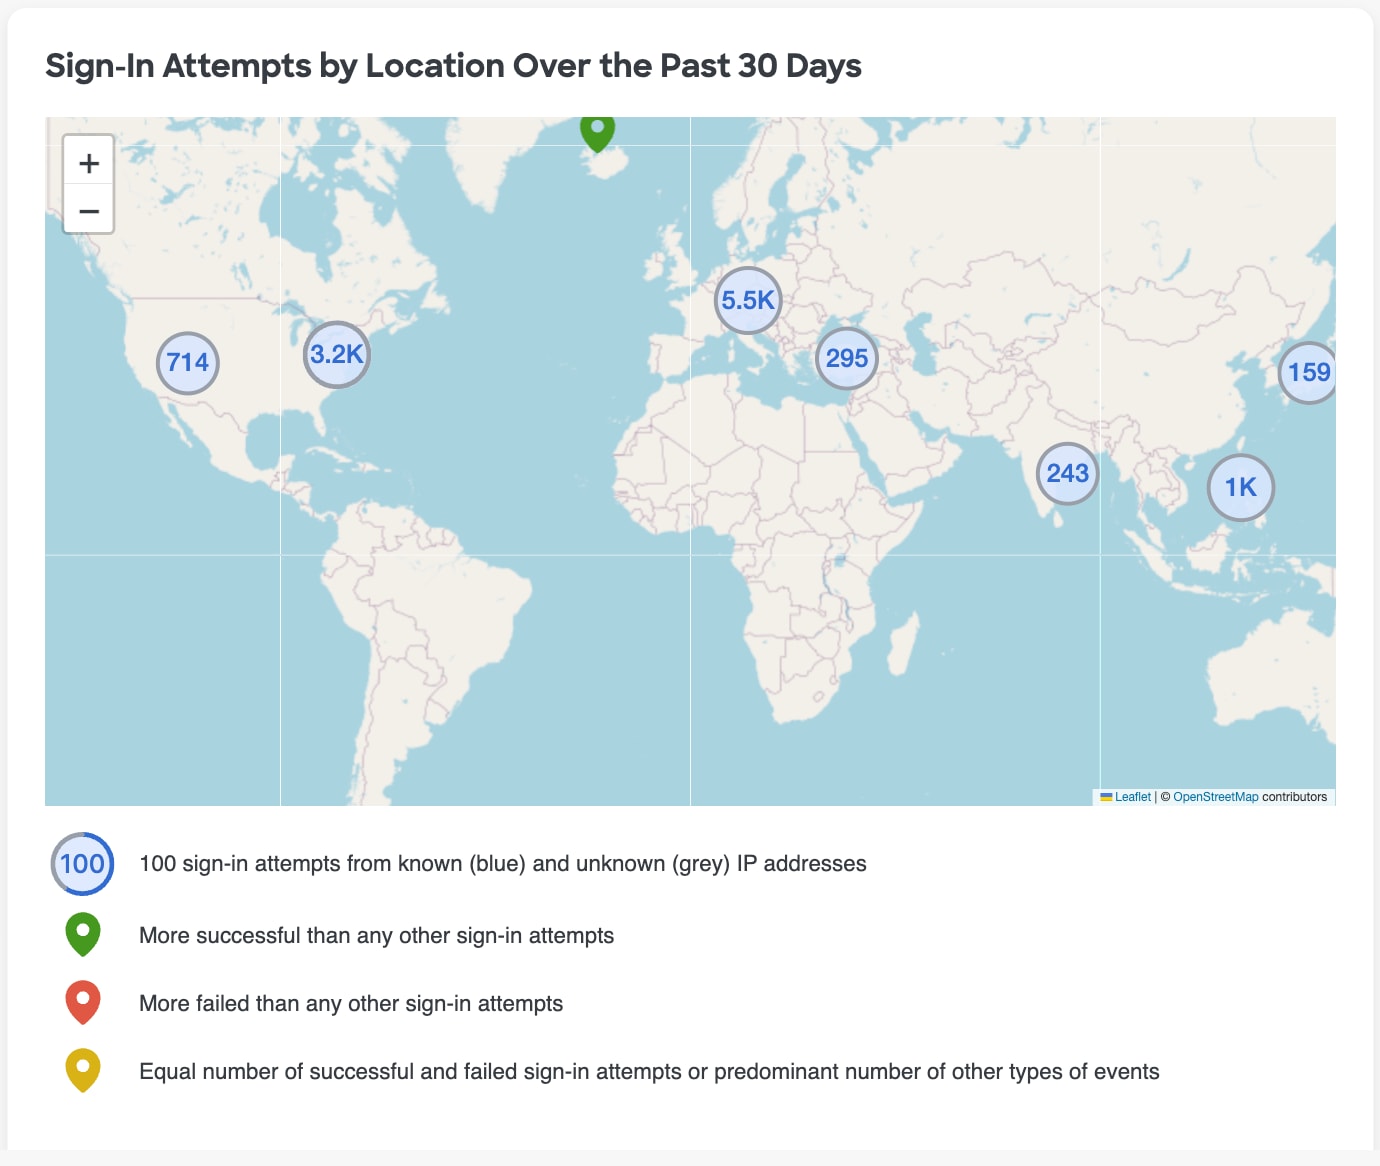
The Circles on the map represent the number of sign in attempts from a given location, while the outline of the circle also signifies if the sign in attempts were predominantly from known (blue) or unknown IP addresses. In the example screenshot below, this circle indicates a location has had 100 sign-in attempts, and more than half of them were from known IP addresses.

- If you select a particular circle on the map, it will drill in more closely so you can see the specific locations that make up the sign in attempts from that circle
- Circles may turn to pins as the map automatically zooms in, with the color of the pin indicating if the majority of sign ins attempts were successful or if they failed, as defined in the key below the map
- You can also use the + or - buttons to manually zoom in or out on the map to see more detailed locations and pins. You may notice that the numbers in a location pin change as you zoom in or out as the aggregated data points within the circle turn to their own items
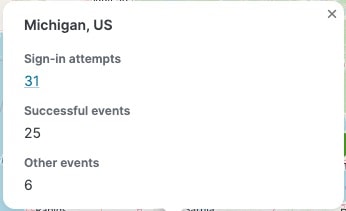
- Selecting or hovering over a given pin to see a breakdown of sign in attempts with the associated count of users for each sign in result type
- Select the count to drill to the Users page, filtered for those users with that sign in attempt result for that location
Example: View the number of logins from a city
In the Sign-In Attempts by Location map, select a circle within a country to get more detail on it, then zoom the map to a particular a city by selecting the + or scrolling the mouse wheel
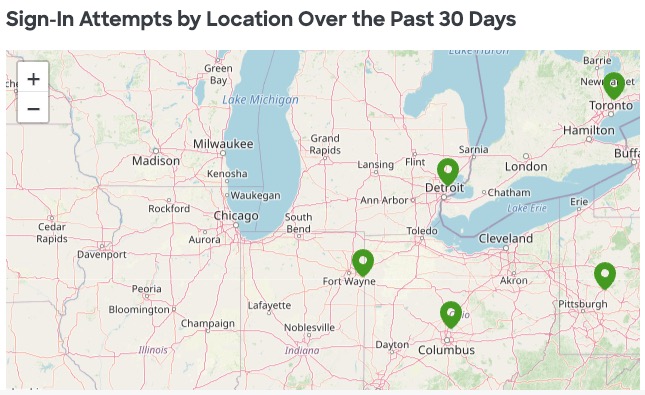
Select or hover over a pin in the map to see more details about the login attempts for that particular location.
Sign-in Attempts per Country
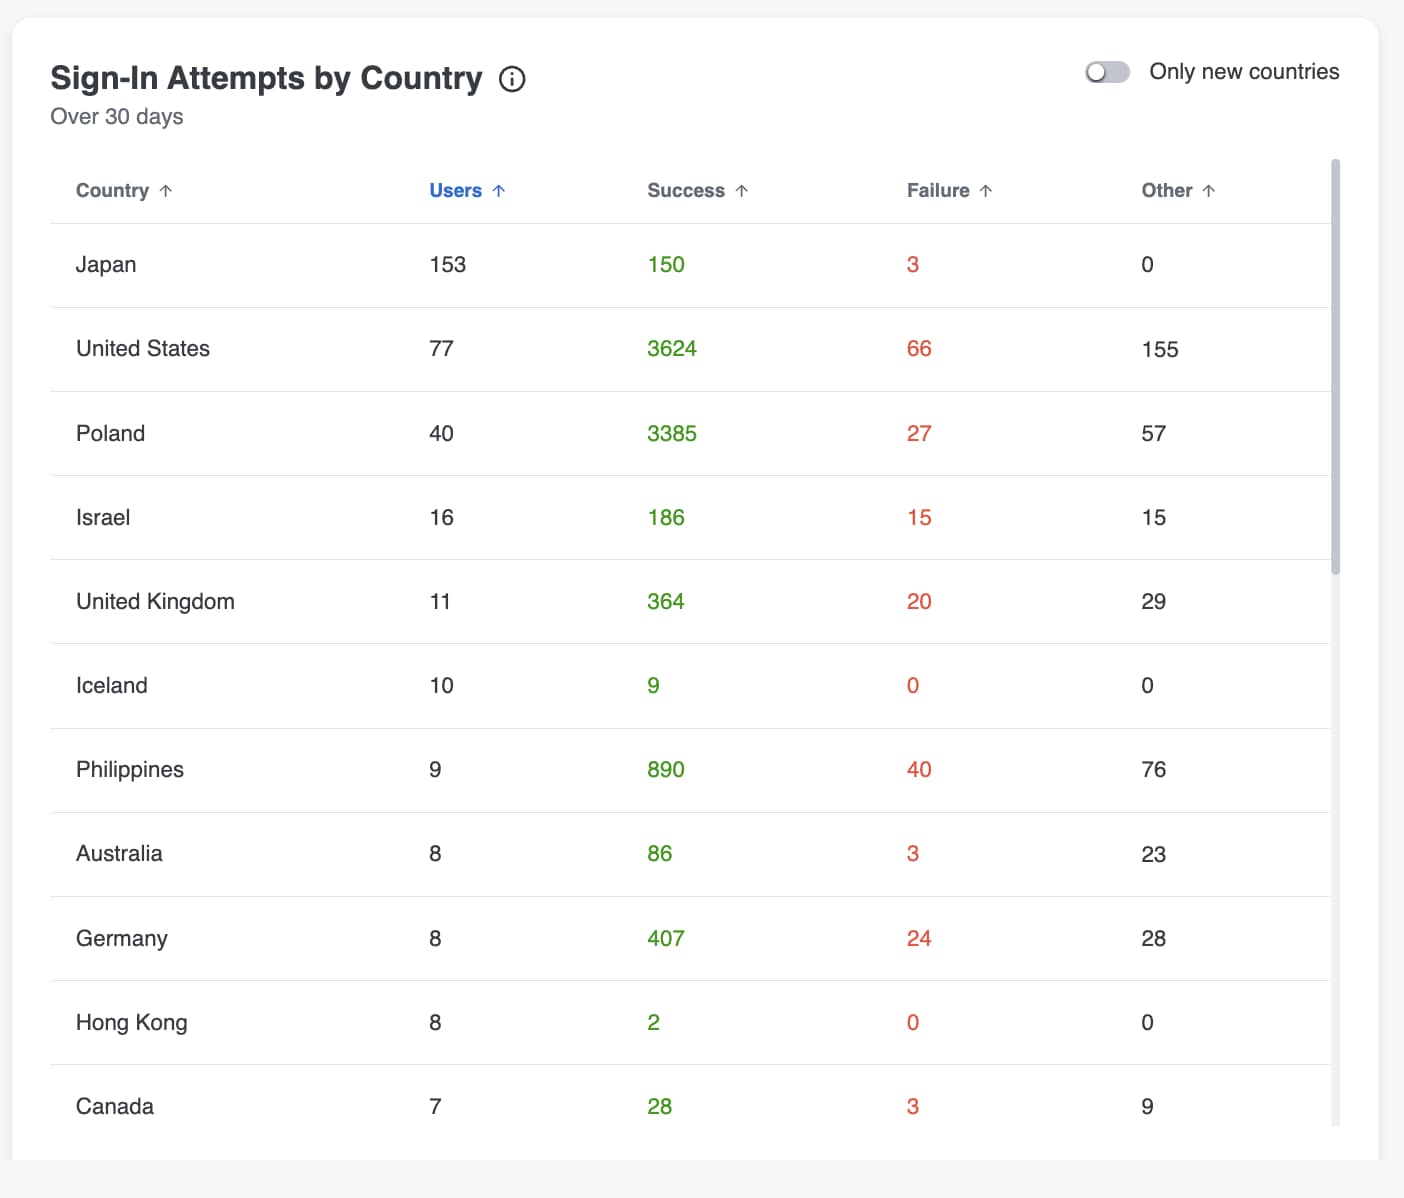
This widget provides the number of sign in attempts for each country over the last 30 days, broken down by the number of users who have attempted to sign in to each country, as well as the number of users per sign in result. Select a value from the row in the table to go to the Users page, filtered on your selection.
- Click a column header to sort data in the table in ascending or descending order by that column.
- Toggle Only new countries in the top right corner to limit the table to countries that are newly seen in the last 7 days (meaning that it is the first access attempt for that location within the last 7 days, but not the first time this location has ever been seen before)
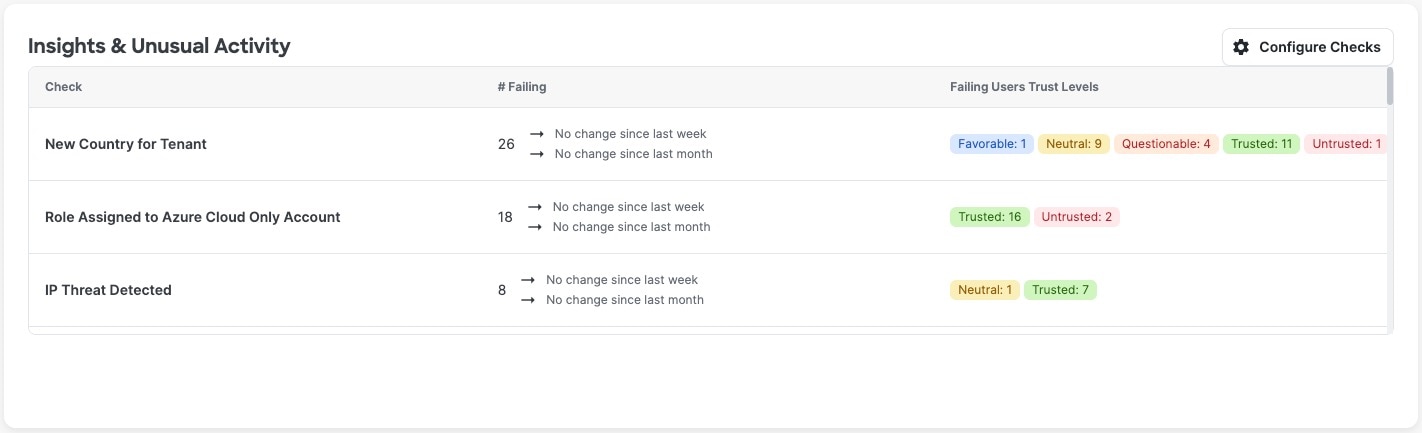
Insights & Unusual Activity
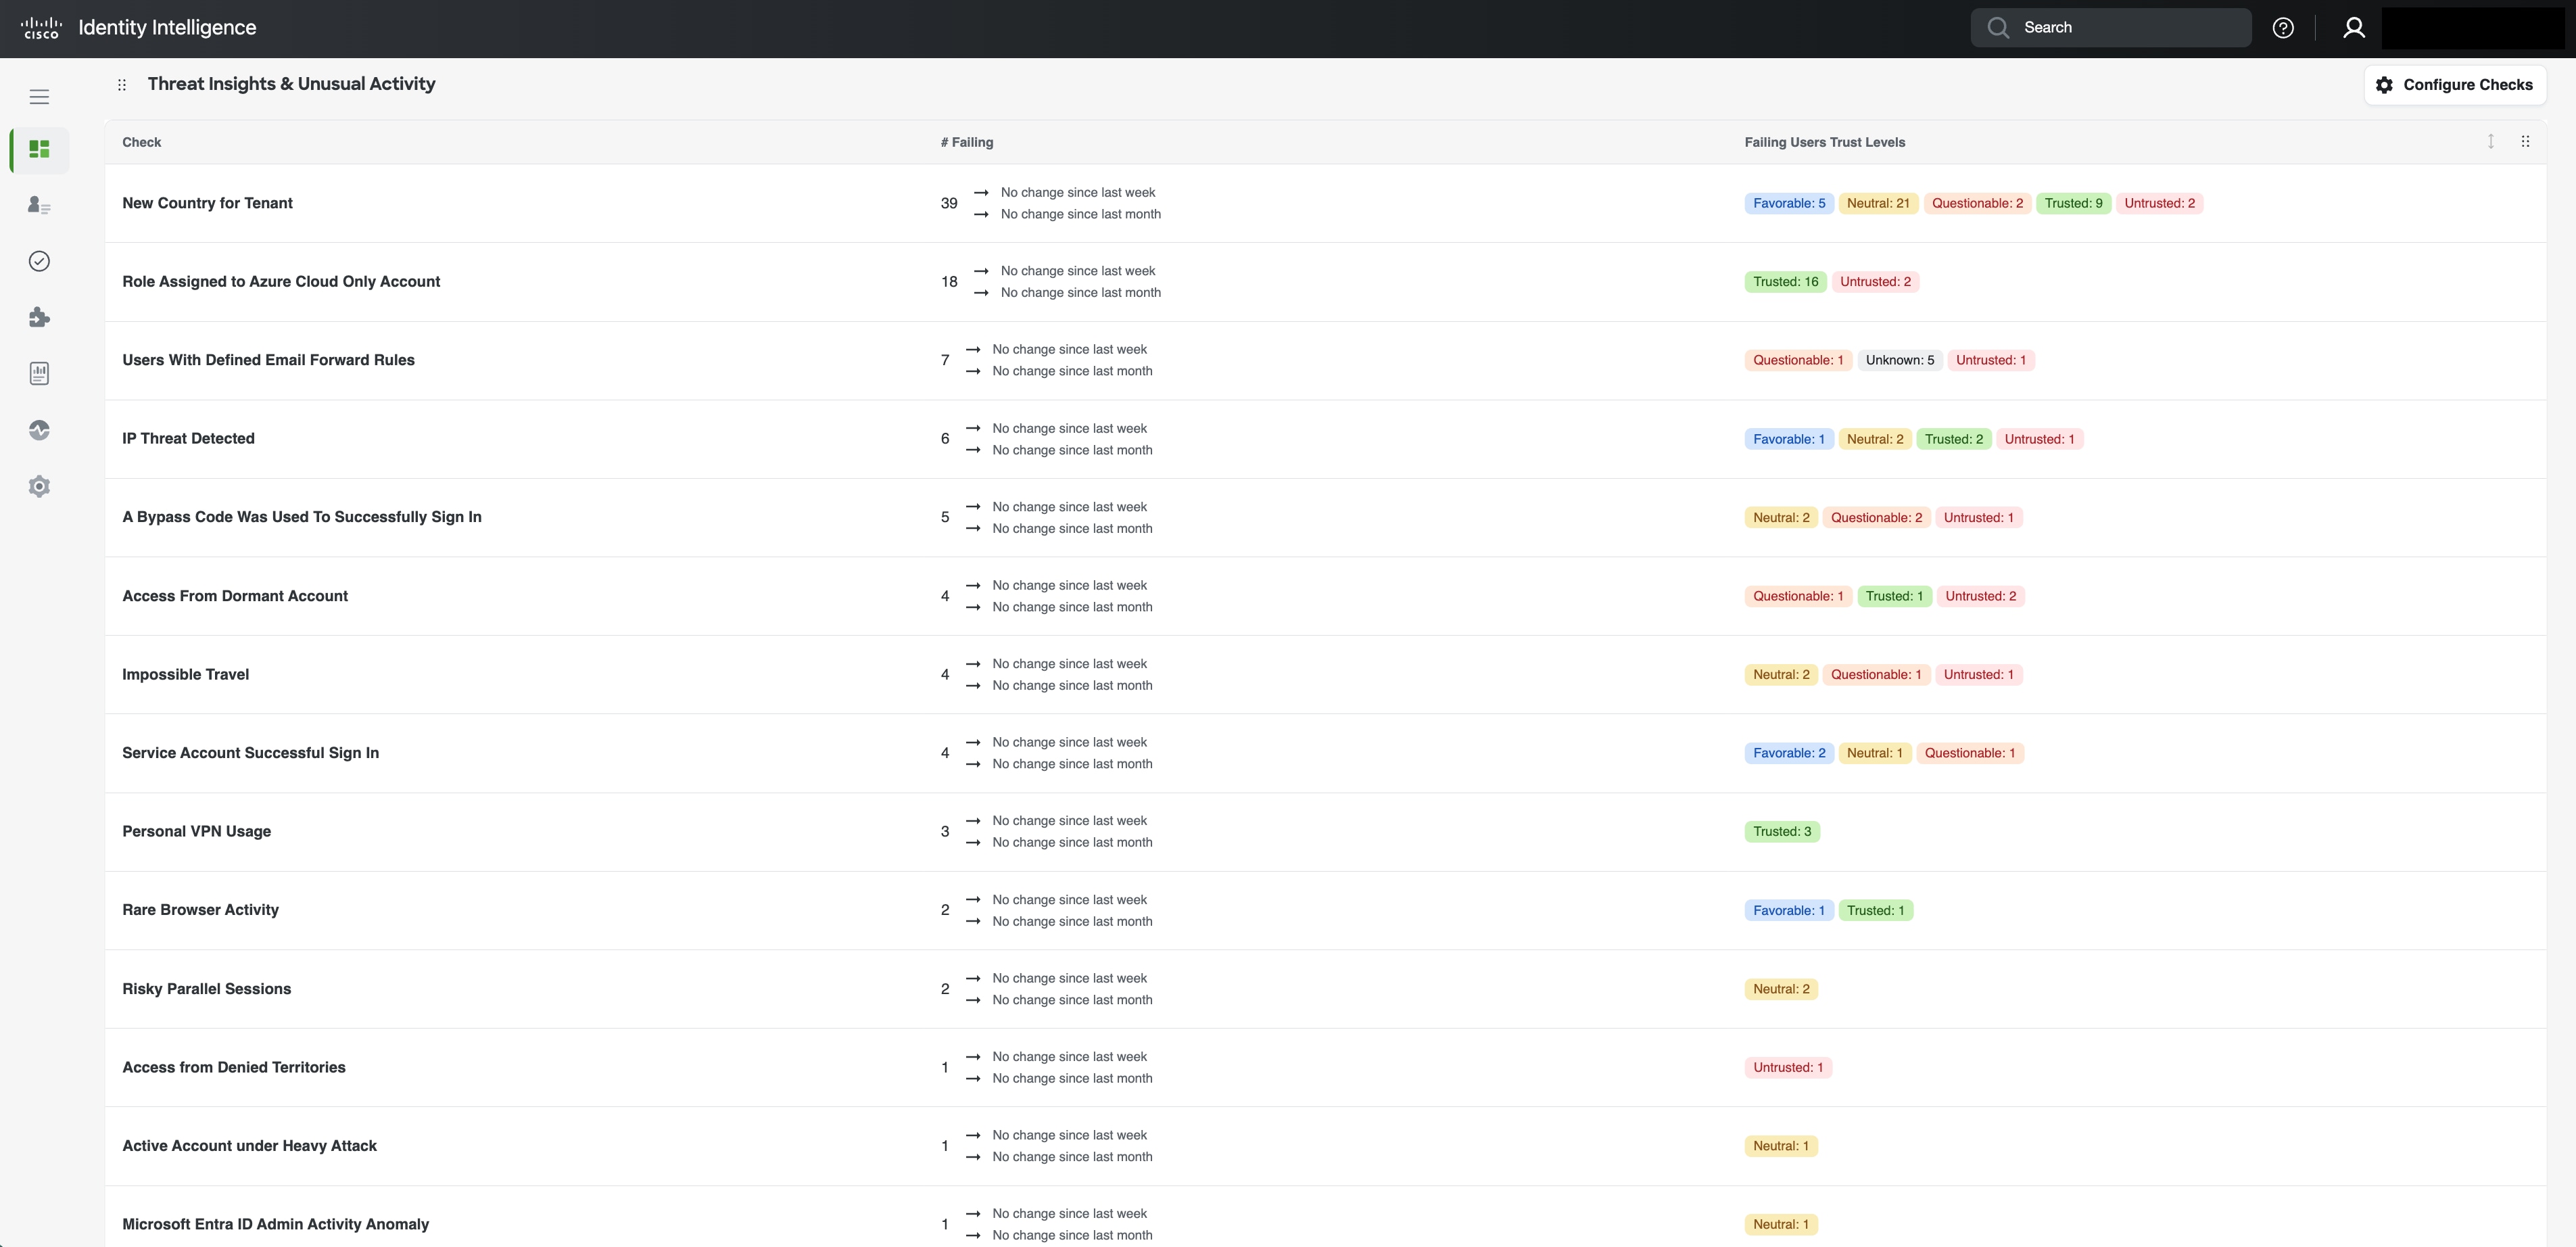
This section of the dashboard centers on identifying suspicious activities associated with user trust levels. Each check can be explored in detail to review failure criteria, recommended remediation steps, affected users, and additional context.
By associating these checks with user trust levels, this data provides meaningful insight into active security risks, and the related security gaps, enabling you to prioritize and focus your efforts effectively. This approach helps clarify where vulnerabilities exist and guides targeted actions to proactively enhance the organization's identity security.
Select the check name or blank space of a row in the table to view detailed information about that check, such as detection logic, recommended remediation actions, failing users, etc, or select a particular trust level tag in a row to go to the Users page, pre-filtered for that trust level.
Select Configure Checks to add checks to the table or remove checks from the table.
Explanation of the Insights & Unusual Activity Table
Data displayed in the table:
- Check column: Name of the check that caused the users to be displayed in the table.
- # Failing column: Number of users failing the check and the percent change in the value over the last week and last month.
- Failing Users Trust Levels column: Number of users failing the given check per trust level.
Compliance
Top Failing Checks
List of prioritized failing checks. Example:
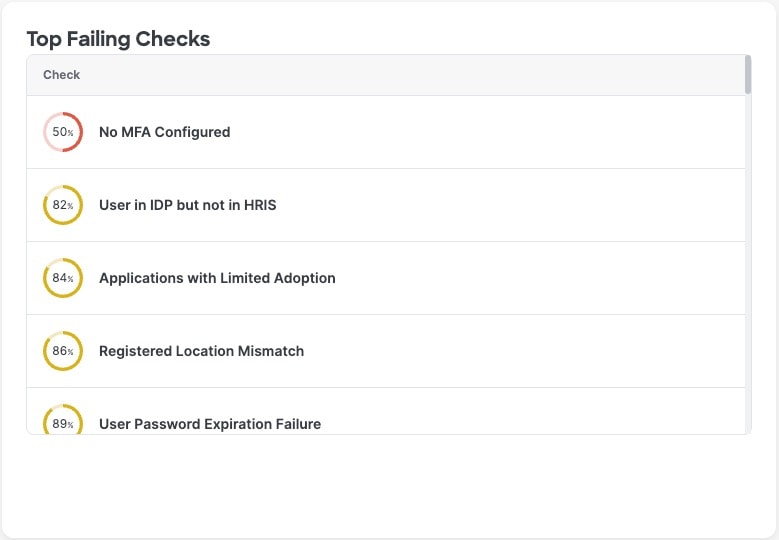
Failing checks are listed in order of severity. The graphic next to the name of the failing check means:
Clicking any check provides ore information about it. Example:

The percentage of users passing the check is displayed as a number.
The colored semicircle indicates the severity:
- Red: 50% or fewer users passing.
- Amber: 50% or more users passing.
- Green: No users are failing the check.
Compliance Reports Available for Download
Click the download button to download check-compliance-report-<todays-date>.csv for analysis.
Operations
Setup Progress
Easily access the onboarding checklists and monitor your team's completion progress for each checklist.
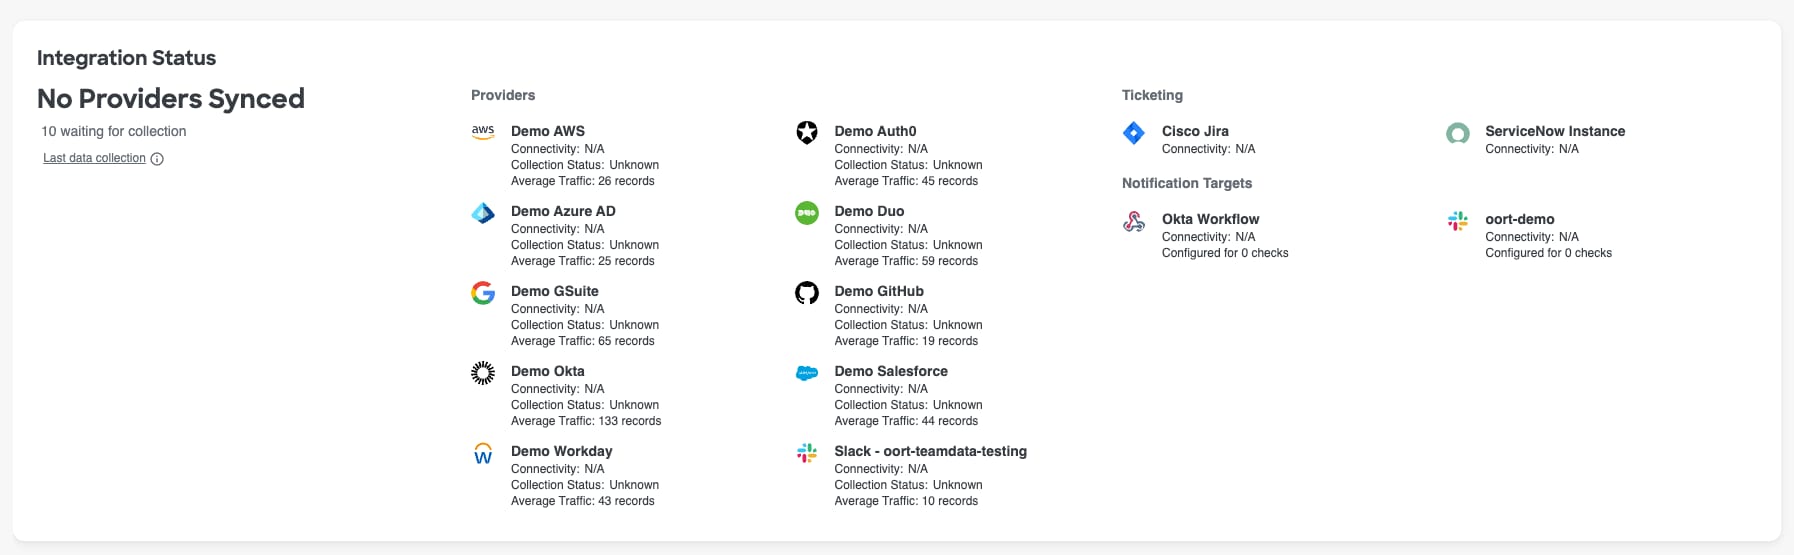
Integration Status
Purpose & Benefit: Quickly see the status and approximate traffic from each integrationconfigured in your Cisco Identity tenant.
The connected integrations are grouped by type, including Providers, Ticketing systems, Notification targets, SIEM platforms, etc
For identity sources like Azure AD, Okta, Duo, etc, the last collection status (ex: "Success") and average traffic metric is shown. Hover over the tool tip next to "Last Data Collection" on the left side of the widget to see the data and time of the last data collection for each connected identity source.
Note: Full admins in Cisco Identity can also get more details on the integration status from the Integrations page in the left hand menu bar
Check actions taken over last 30 days
The Check Actions widget was developed to provide Cisco Identity platform admins and other users insights into the different actions that other colleagues are taking in the platform on user check failures over the last 30 days. The metrics displayed in this widget include:
- User activity marked as normal behavior
- User activity marked as interesting
- Users excluded or re-included in a check
Selecting any of the metrics in this widget will take you to the System Logs, pre-filtered on the action selected, where you can see more detailed information on the date the action was taken, who took the action, and which user account and check failure the action was taken on.

Identity Security Assessment (ISA)
Cisco Identity's Identity Security Assessment (ISA) rapidly delivers unmatched visibility across all identities within your organization. The ISA is designed to quickly identify identity risks across critical infrastructure and consolidate key areas of focus into an easy to consume export. The assessment leverages API-based integrations with selected providers from your identity stack to ensure there is no impact on production systems and requires no agent deployment.
The pre-defined ISA Dashboard information is incredibly useful as you begin your journey with Cisco Identity, but also serves as a valuable point of reference to compare progress as you continue to leverage the platform and take action on the various insights presented.
Note: Collecting and analyzing historical data may take some time depending on the size of your identity environment. After successful integration, Cisco Identity may need up to 14 days to fully stabilize the data.
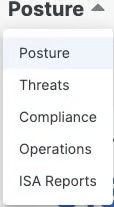
To access the ISA Reports Dashboard, navigate to the Dashboards landing page via the left hand menu item. Once on the Dashboards page, select the Dashboard header on the page (Default is Posture) as shown in the screenshot below to open a drop down with the different available Dashboards and then select ISA Reports.
The ISA Reports Dashboard aggregates data from all the connected sources in your tenant and organizes it by focus area into 3 sections:
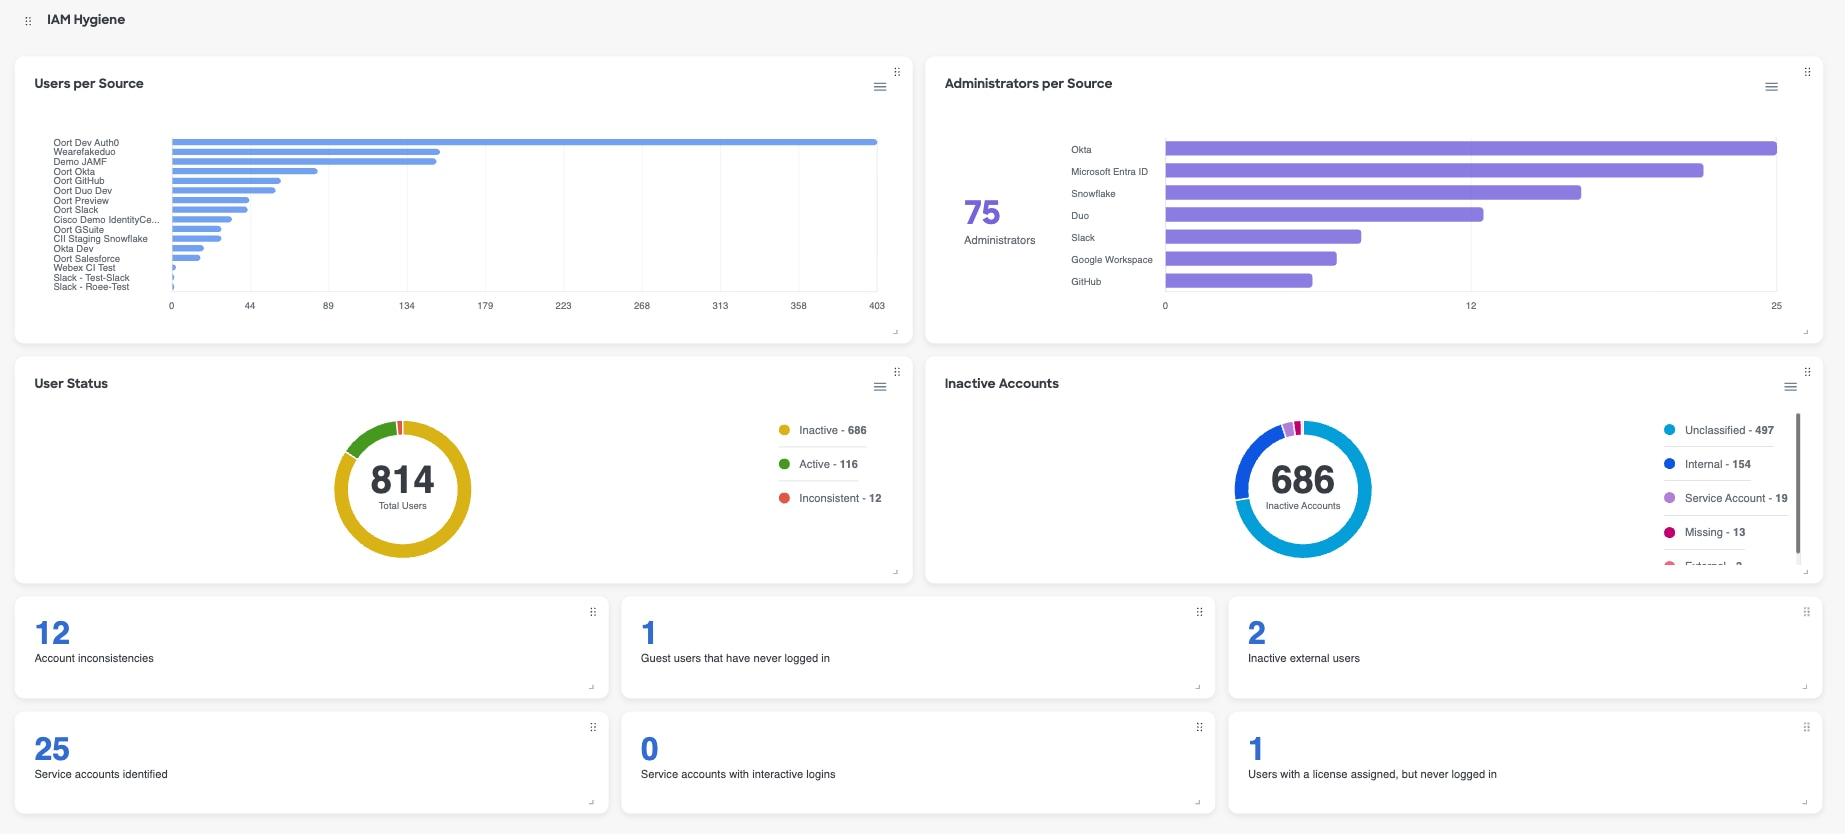
- Identity and Access Management (IAM) Hygiene
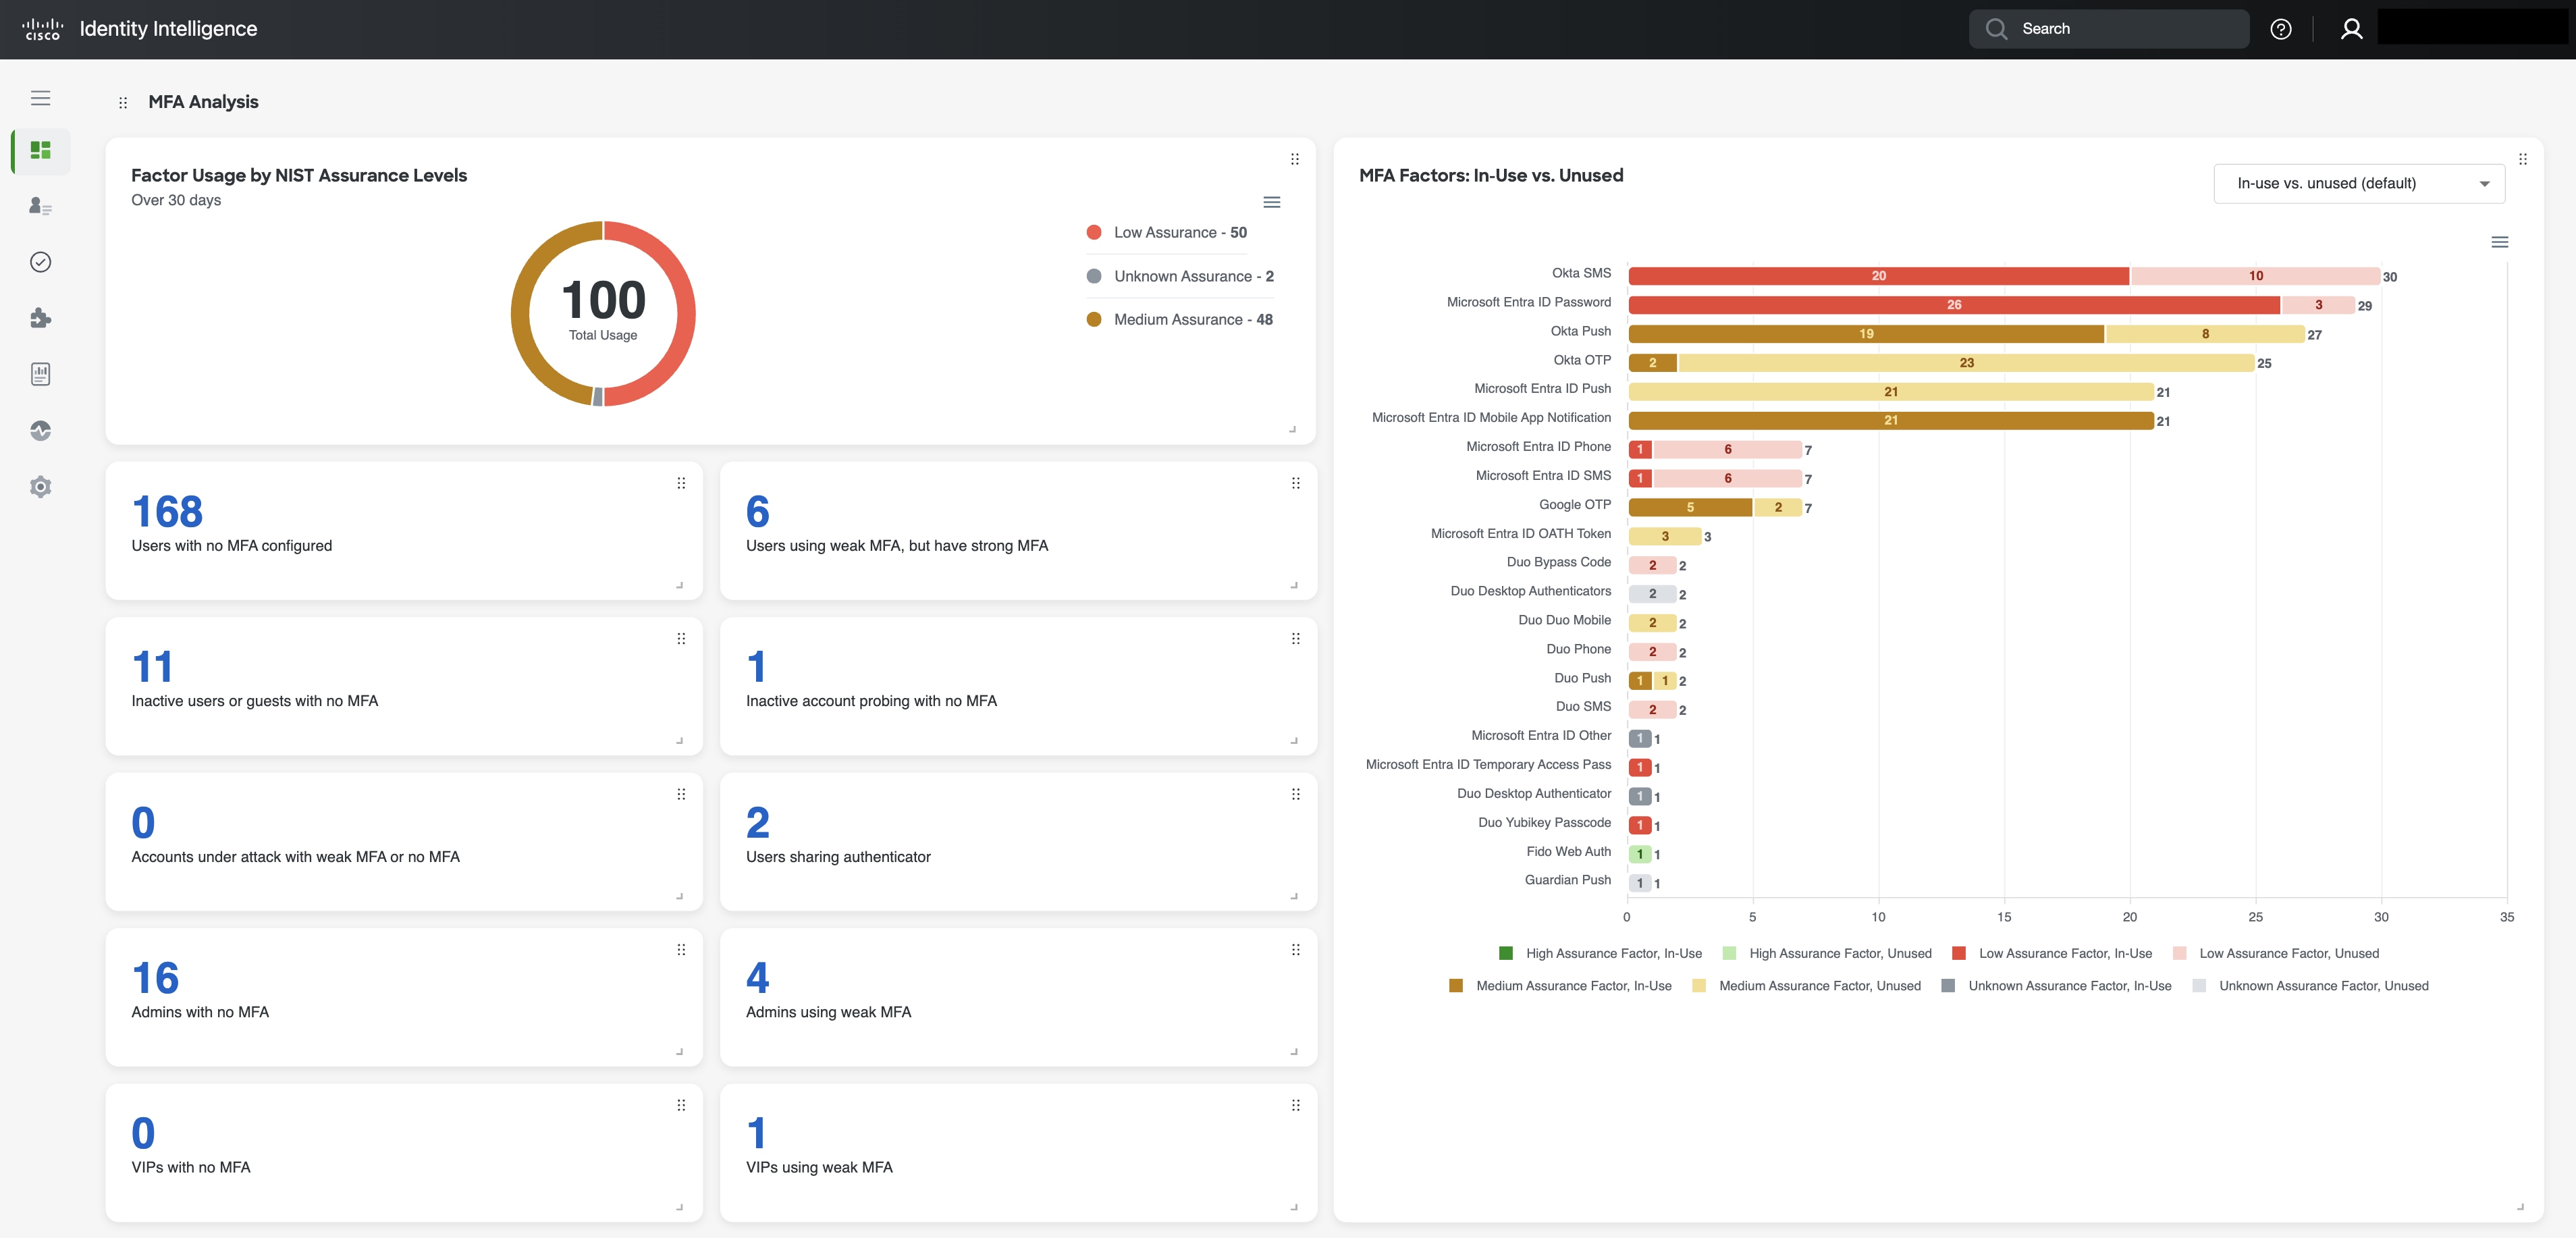
- Multi-factor (MFA) Analysis
- Threat Insights & Unusual Activity
You can drill into the value in any of the counters and certain visualizations to see more details, such as the list of impacted users, by clicking into the item of interest. You can either use the default ISA Reports Dashboard or you can tailor it to your preferences.
IAM Hygiene
This section emphasizes the critical role of maintaining strong Identity and Access Management (IAM) practices to enhance your organization's identity security and proactively combat threats. This includes managing user access effectively, auditing permissions regularly, and removing dormant accounts to reduce security risks and prevent unauthorized access.
You can select values from certain
MFA Analysis
This section provides an overview of your organization's Multi-Factor Authentication (MFA) adoption and assesses the effectiveness of the MFA methods in use, based on the NIST guidelines. It offers a clear evaluation of the security strength of each authentication method, helping organizations understand the robustness and reliability of their MFA implementation, while also surfacing any gaps or areas to improve.
Threats Insights & Unusual Activity
This section of the dashboard centers on identifying suspicious activities associated with user trust levels. Each check can be explored in detail to review failure criteria, recommended remediation steps, affected users, and additional context.
By associating these checks with user trust levels, this data provides meaningful insight into active security risks, and the related security gaps, enabling you to prioritize and focus your efforts effectively. This approach helps clarify where vulnerabilities exist and guides targeted actions to proactively enhance the organization's identity security.
Customizing and Sharing Your ISA Report
Like the other Dashboard tabs, the ISA Reports Dashboard can be customized to meet your needs, and exported for easy sharing. Please refer to our Dashboard overview article for more info.
Posture
Identity posture in cybersecurity means continuously assessing, monitoring, and optimizing an organization's digital identities to prevent unauthorized access and mitigate risks like credential theft, account takeovers, or privilege abuse.
For more information, see:
- Identities Dashboard
- Non-Human Identities Dashboard
- MFA Dashboard
- Devices Dashboard
- Applications Dashboard
Identities Dashboard
The Identities dashboard provides a high-level view into your key metrics about the identities present in your connected Identity Sources. This article provides details on each of the sections or widgets in the Identities dashboard.
The Identities dashboard displays metrics and visualizations on areas of interest including:
- Posture Score
- Posture Score Trend
- User per Trust Level
- Risky Users Distribution Over Time
- Identities
- Administrators
Posture Score
Cisco Identity separates posture into three scores. Each score ranges from 0 to 100. Higher scores indicate stronger posture. The Identity Dashboard highlights the Users Score, specifically.
See Identity Posture Scores for more info on the other category scores, score calculation details, and remediation guidance.
Posture score recommendations
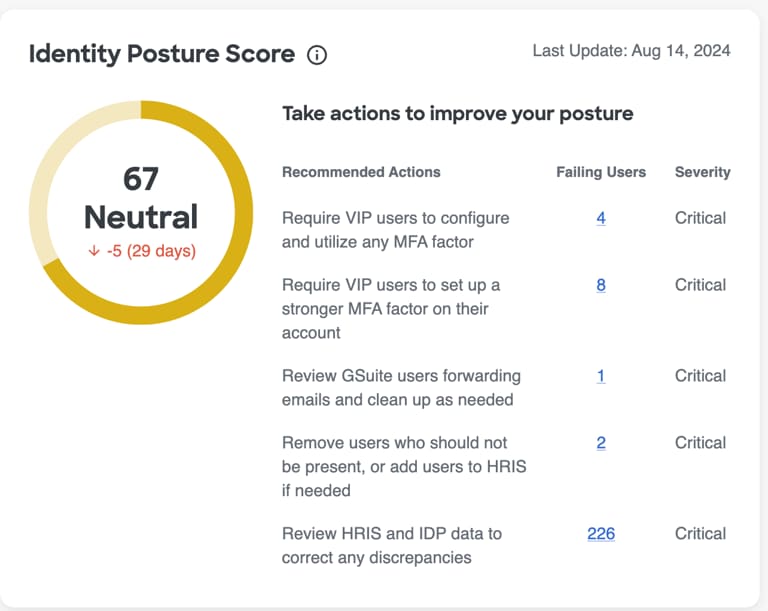
The Posture Score widget provides the current score for the given posture area. It also shows:
- the score threshold level
- the score change over the last 30 days (+ to indicate an increase and - to indicate a decrease)
- the last date the score was calculated
- prioritized recommendations, including
- the number of entities failing the check associated with the recommendation
- the severity of the issue that is being recommended for remediation
Recommendations are ordered by expected impact on the relevant score. Fully remediating the first recommendation produces the greatest improvement to the given category's score. Although other recommendations may have more entities failing, fully resolving "Priority 1" will lead to a bigger improvement in the score than fully resolving "Priority 4", for example.
Select the number of entities in the 'Failing Entities' counter to go to the Checks page or the inventory page, pre-filtered for the entities failing the selected check, so that you can take action to improve your posture score.
You may see Configure HRIS when required HRIS data is missing. Select it to configure HRIS data through Integrations.
You may see View Check when a contributing check is disabled or fails on settings, rather than entities. Select the View Check to review the results or enable the check as needed.
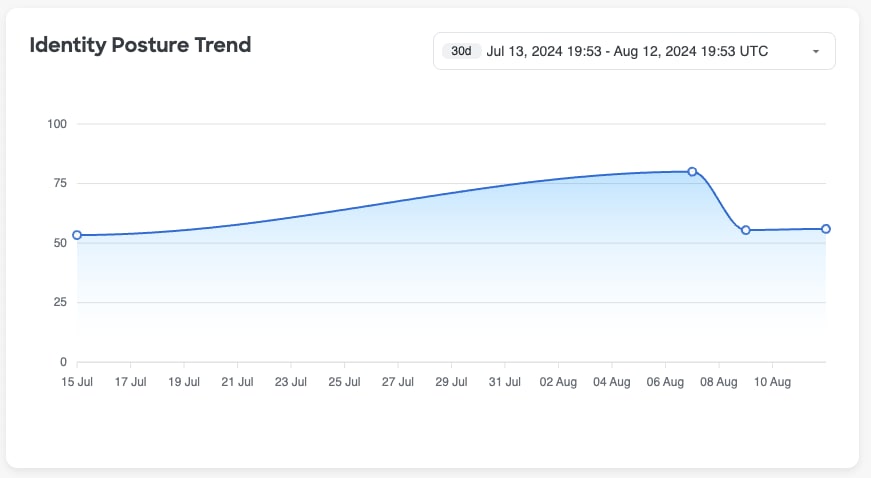
Posture score trend
The trend widget shows changes to the given posture score over time to depict changes to the category-level posture score over time so that you can see and report on your progress, as well as better understand how different events may have impacted the given Posture Score positively or negatively over time.
Hover over a data point, which are marked by a dot on the trend line, to see explainability about why the score may have increased or decreased. The 3 attributes that contributed most to the score change will be displayed when you hover on a specific data point.
By default, this widget looks at the last 30 days; however, you can use the timeframe filter in the top right-hand corner of the widget to change the widget's timeframe to be longer or shorter depending on your needs.
User Trust Level
User Trust Level looks at different components that make up user risk, such as on a user's context, behavior and common tendencies, to calculate a single User Trust Level. Trust Levels allow you to quickly and easily pick the riskiest users out of the crowd, so that you can investigate with urgency and remediate the situation as quickly as possible, reducing the attack timeframe or even preventing an attack from happening in the first place.
To learn more about User Trust Levels, what factors are included in the calculation, how it is calculated, and more, see our documentation about User Trust Levels.
There are two widgets in the Dashboard related to User Trust Levels which are described below.
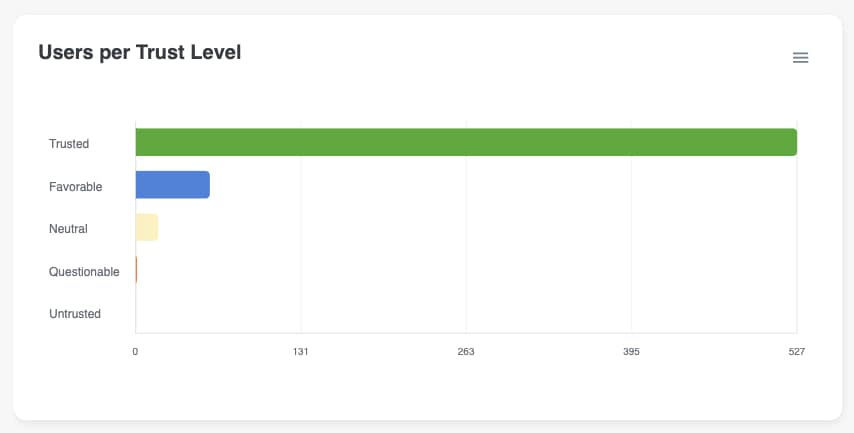
Users per Trust Level
The Users Per Trust Level widget displays the current breakdown of the number of identities in each Trust Levels across your organization.
Not only does this graph give you a sense of where your users are at today, but it is also a quick and easy way to find users for investigations. Selecting one of the bars in this visualization will take you to the Users page, pre-filtered for the Trust Levels selected, so you can see all users who currently have a particular Trust Level.
Risky Users Distribution Over Time
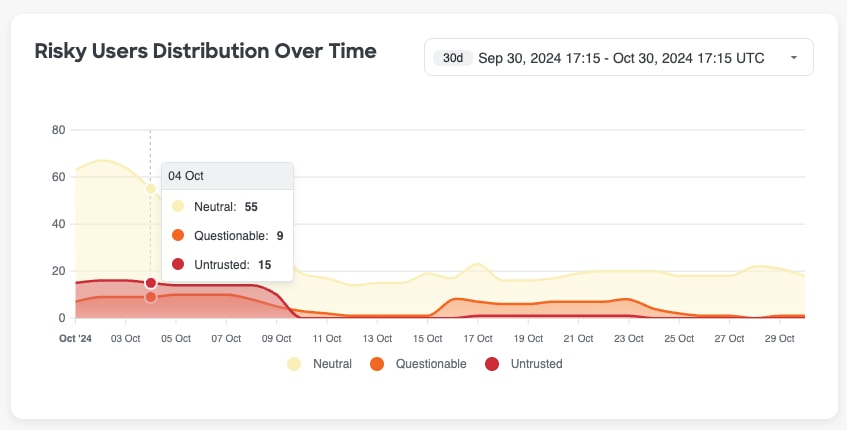
The second widget, Risky Users Distribution Over Time, depicts fluctuations to the trust levels of the users in your organization over time. This widget can be useful to identify sudden spikes in User Trust Levels.
If you hover over a data point in this widget, which are marked by a dot on the trend line, you will see a tooltip with the count of users, segmented by Trust Level, for that given date.
By default, this widget looks at the last 30 days; however, you can use the timeframe filter in the top right-hand corner of the widget to change the widget's timeframe to be longer or shorter depending on your needs.
Selecting a value in the legend below the graph will remove the corresponding data points from the visualization.
Identities
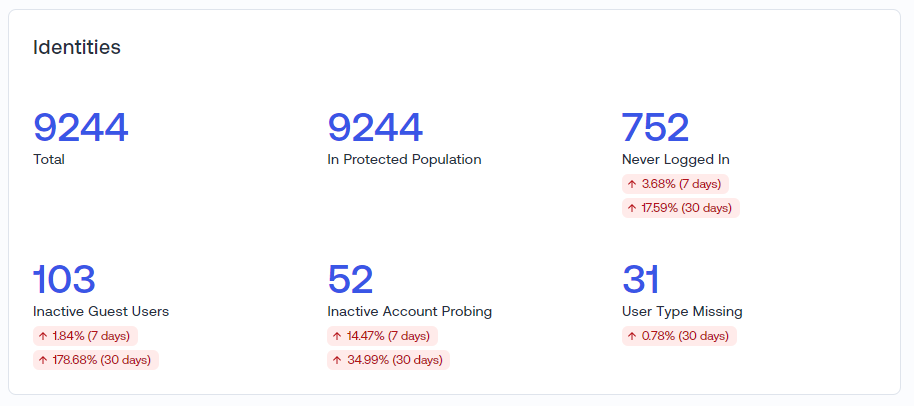
Purpose & Benefit: Multiple Identity themed widgets to make it easy to quickly assess the size of your total identity estate, as well as recent trends in your identity hygiene and security posture.
Identity Security Snapshot
The Identities widget provides total identities, protected population metrics, and key metrics around identity hygiene and threats, such as -
- Inactive Guest Accounts
- Never Logged In accounts
- Inactive Account Probing
- User Type Missing in user profile
You can select any of these numbers and it will take you to the corresponding Check details page or to a pre-filtered Users Page for further investigation.
Users per Source
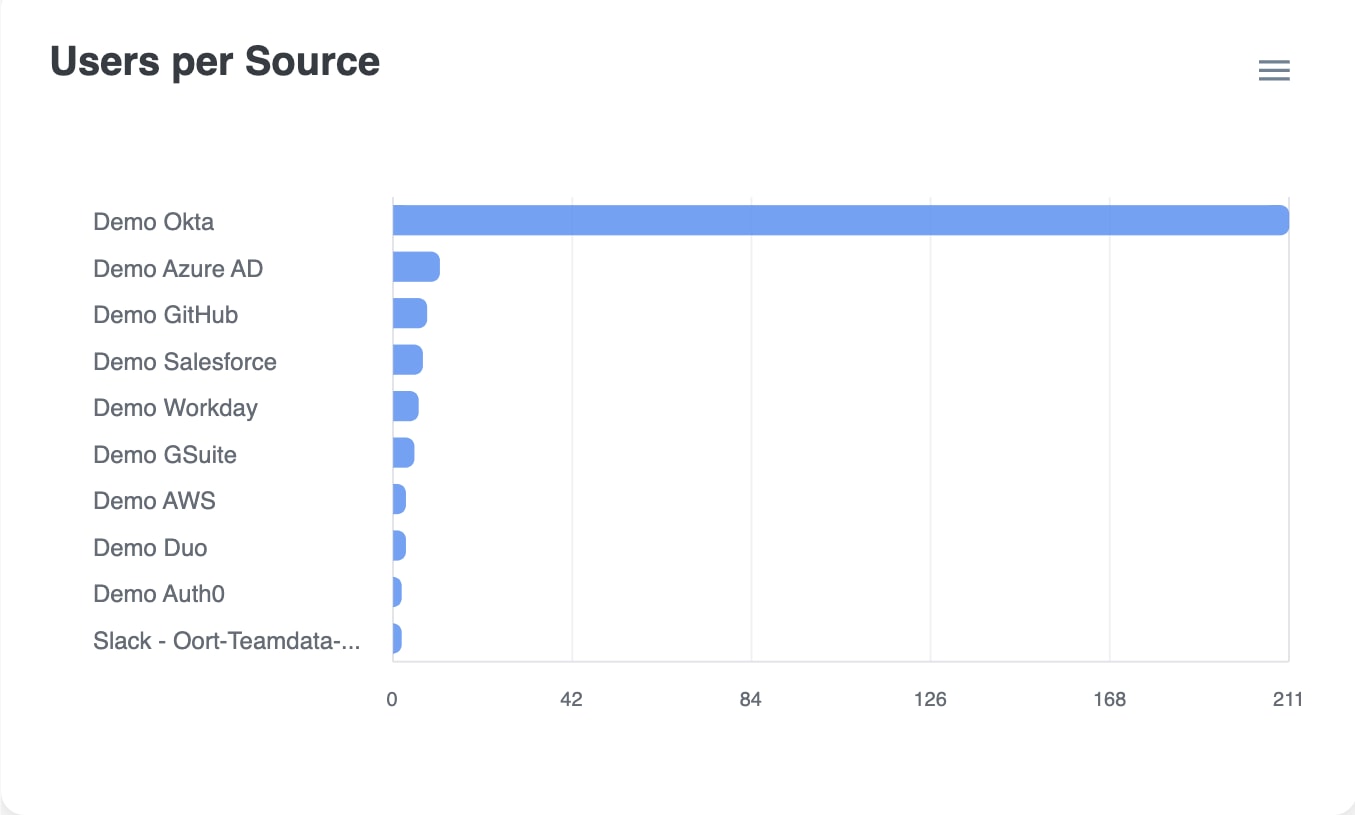
The Users per Source widget further down the dashboard provides a breakdown of the number of identities in each connected identity platform.
Selecting one of the bars in this visualization will take you to the Users page, pre-filtered for the users derived from the selected integration.
Monthly Sign-ins
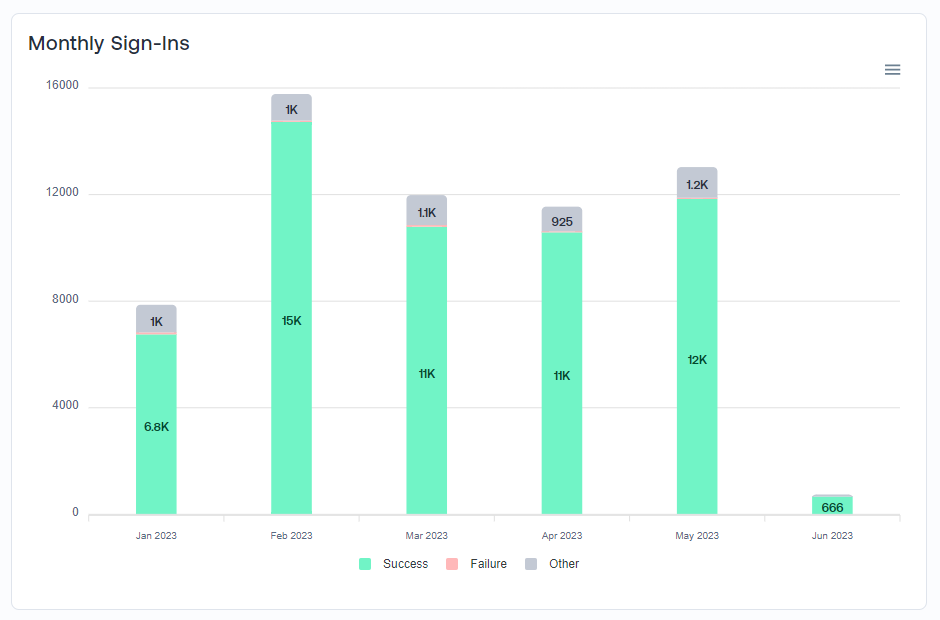
This widget provides details on the total number of monthly sign-ins, including a breakdown of success, failure, and other types of sign-in events.
Trends can be analyzed for changes, such as a high spike in failures or overall sign-in events.
Administrators
Purpose & Benefit: Quickly answer an often difficult question for organizations - how many administrators do I have in each platform and where are they logging in from recently?
The Dashboard contains a couple widgets to highlight the administrators within your environment, as well as their recent activity, since these users have higher privileged access to your IDPs and present a higher security risk if their accounts were to be compromised.
Administrators per Source
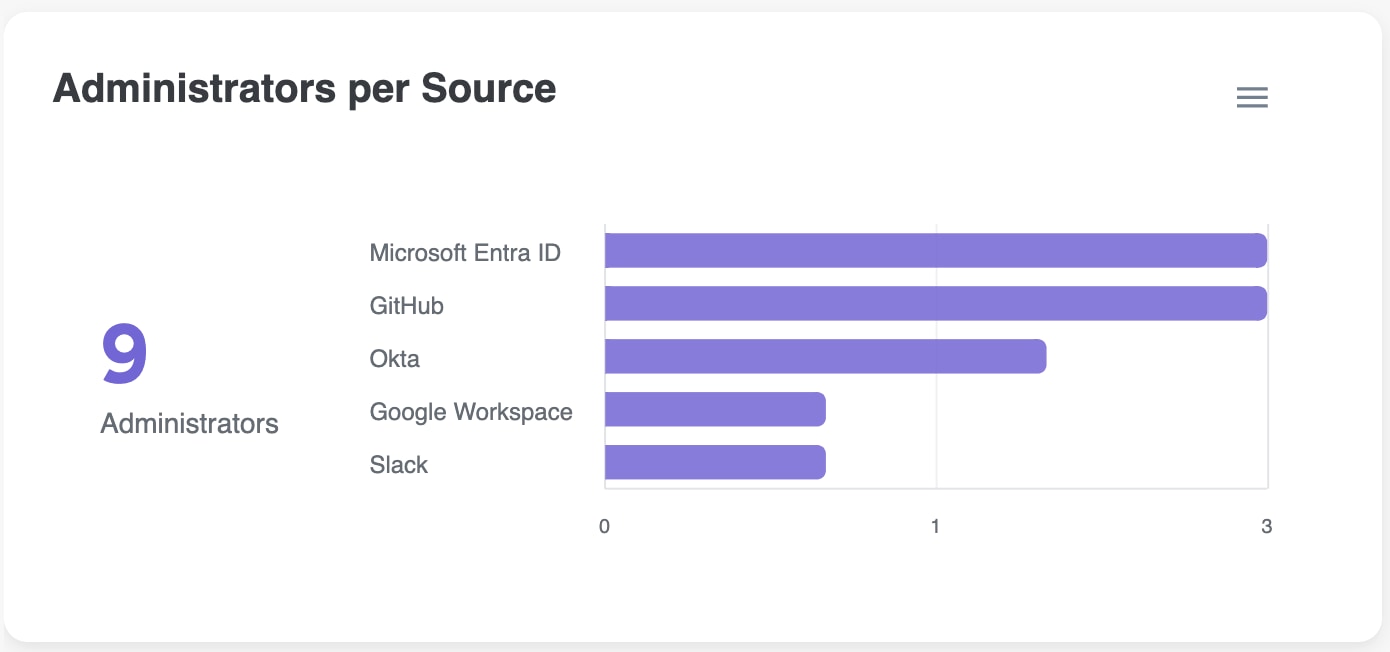
The Administrators per Source widget provides a breakdown of the number of Admin users in each connected identity platform.
Selecting any of the bars in this visualization will take you to the Users page, pre-filtered for administrators of that specific integration.
Administrator Logins
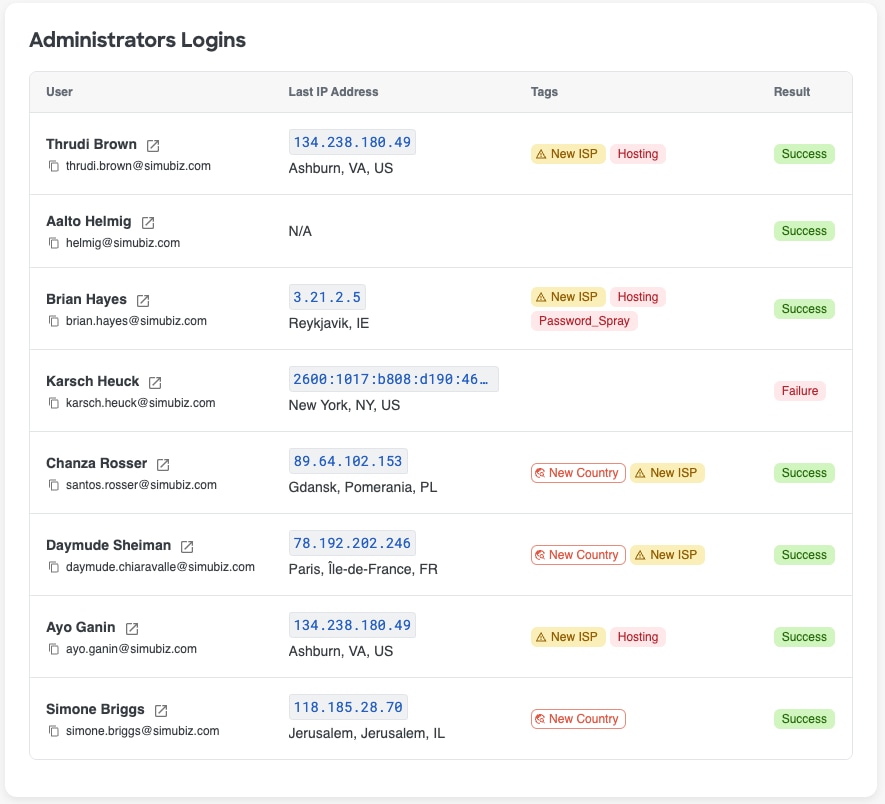
Purpose & Benefit: Quickly monitor activity and spot admin account logins from unexpected networks and locations, including ones that have been tagged with a poor IP reputation or other alerts.
The Administrators logins widget shows a log of each Administrators most recent log in activity, including the user's name, email address, the IP address for their last login and the IP location, any tags for that IP address, and the sign in result - Success, Failure, etc
Selecting the blank space of a row or the 'open in new tab' icon next to the Admin's name will open the Admin's User360 in the same window or a new tab, depending on what is selected.
Non-Human Identities Dashboard
Overview
This dashboard gives you a comprehensive view of your Non-Human Identities (NHIs), focusing on important areas like security, compliance, and operational efficiency. By checking these metrics regularly, you can quickly spot and fix potential risks, keep everything running smoothly, and make sure your NHIs are well managed.
To use the Non-Human Identities dashboard, simply open the Cisco Identity dashboard and select the Non-Human Identities tab. Here, you will find easy-to-understand information about your NHIs, including their status, risks, usage, and activity, so you can keep your organization secure and organized.
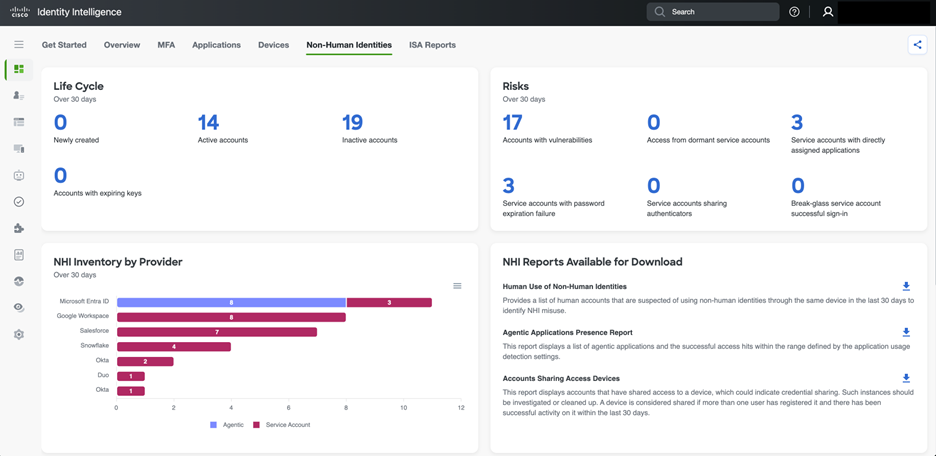
Life Cycle (Past 30 days)
This section tracks the status of NHI accounts over the last 30 days.
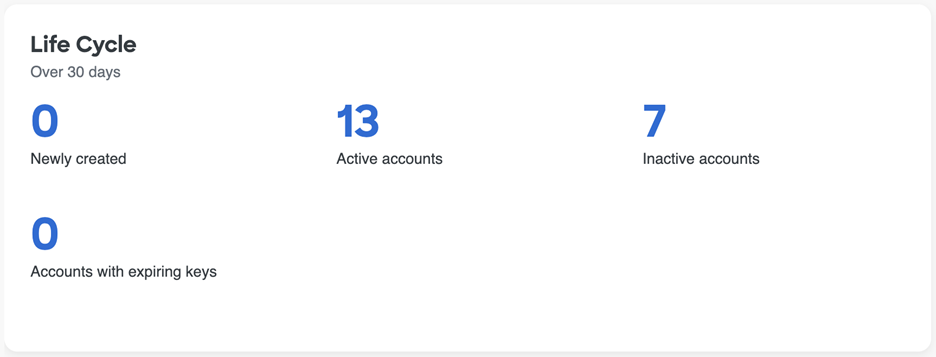
- Newly created: This count shows how many new NHI accounts have been provisioned in the past month. In the example provided, zero NHIs were created in the last month. While this may indicate stability in the existing NHI infrastructure or a temporary pause in onboarding, an unexpected zero could also signal a potential process issue if new NHIs were anticipated.
- Active accounts: These are NHI accounts that have recorded activity within the past 30 days. Monitoring active accounts helps ensure they are functioning as intended and that their activity is legitimate. A large number of active NHIs may require increased management and oversight.
- Inactive accounts: These NHI accounts have not shown any activity in the past 30 days. Inactive NHIs can present a security risk if they still have access permissions, as they may be exploited without prompt detection. Regularly reviewing and deprovisioning inactive NHIs is essential to minimize potential security vulnerabilities.
- Accounts with expiring keys: This count represents the number of NHI accounts with keys that are nearing expiration. If these keys are not rotated in advance, it may result in service disruptions. Regular key rotation is considered the best practice for maintaining NHI security.
NHI Risks (Over 30 days)
This section highlights potential security vulnerabilities and risky behaviors associated with NHIs. Selecting any of the numbers within this widget will take you to the relevant page, pre-filtered on the selection you made.
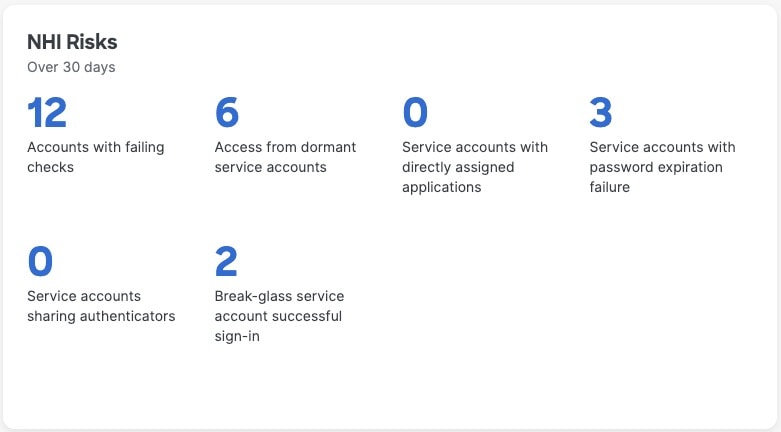
- Accounts with vulnerabilities: This is a critical metric, as NHI accounts with vulnerabilities can serve as potential entry points for attackers. Such vulnerabilities may include misconfigurations, unpatched software, or weak credentials. Prompt investigation and remediation are essential to prevent security breaches.
- Access from dormant service accounts: This indicates that dormant service accounts have accessed resources, which is a high-risk situation. Dormant accounts are often overlooked but may still have extensive permissions. Any activity from these accounts should be validated to determine whether it is legitimate or a sign of potential compromise.
- Service accounts with password expiration failure: This indicates that service accounts have failed because their passwords expired. If not resolved, this can cause service outages and may highlight weaknesses in password management policies or automated rotation processes for these NHIs.
- Service accounts with directly assigned applications: Directly assigning applications to service accounts can result in NHIs with excessive privileges and complicated permission management. It is best practice for NHIs to receive access through roles or groups, following the principle of least privilege.
- Service accounts sharing authenticators: Sharing authenticators, such as API keys or certificates, between multiple NHIs or with human users creates a single point of failure and makes activity attribution challenging. This significantly increases security risks and should be avoided.
- Break-glass service account successful sign-in: A successful sign-in by a break-glass service account means that a highly privileged account has been used. While this may be necessary in certain situations, each use should be carefully audited and justified to ensure it was authorized and not a misuse or unauthorized attempt.
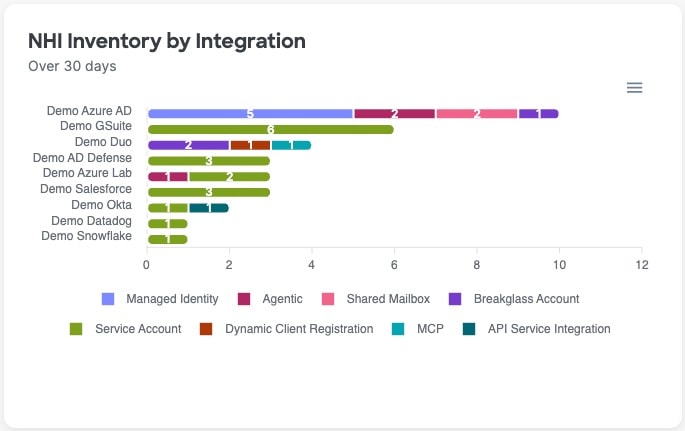
NHI Inventory by Integration (Over 30 days)
This chart displays the distribution of different NHI types across various cloud and identity providers, offering a clear view of where NHIs are located and their functional roles. This inventory helps organizations understand their overall NHI footprint, spot potential shadow IT, and ensure consistent security policies are enforced across all platforms. It also highlights the prevalence of specific NHI types, such as "Agentic," which refers to applications that act on behalf of users or other systems.
Posture Score
Cisco Identity separates posture into three scores. Each score ranges from 0 to 100. Higher scores indicate stronger posture. The NHI Dashboard highlights the NHI Score, specifically.
See Identity Posture Scores for more info on the other category scores, score calculation details, and remediation guidance.
Posture score recommendations
The Posture Score widget provides the current score for the given posture area. It also shows:
- the score threshold level
- the score change over the last 30 days (+ to indicate an increase and - to indicate a decrease)
- the last date the score was calculated
- prioritized recommendations, including
- the number of entities failing the check associated with the recommendation
- the severity of the issue that is being recommended for remediation
Recommendations are ordered by expected impact on the relevant score. Fully remediating the first recommendation produces the greatest improvement to the given category's score. Although other recommendations may have more entities failing, fully resolving "Priority 1" will lead to a bigger improvement in the score than fully resolving "Priority 4", for example.
Select the number of entities in the 'Failing Entities' counter to go to the Checks page or the relevant inventory page, pre-filtered for the entities failing the selected check, so that you can take action to improve your posture score.
You may see View Check when a contributing check is disabled or fails on settings, rather than entities. Select the View Check to review the results or enable the check as needed.
Posture score trend
The trend widget shows changes to the given posture score over time to depict changes to the category-level posture score over time so that you can see and report on your progress, as well as better understand how different events may have impacted the given Posture Score positively or negatively over time.
Hover over a data point, which are marked by a dot on the trend line, to see explainability about why the score may have increased or decreased. The 3 attributes that contributed most to the score change will be displayed when you hover on a specific data point.
By default, this widget looks at the last 30 days; however, you can use the timeframe filter in the top right-hand corner of the widget to change the widget's timeframe to be longer or shorter depending on your needs.
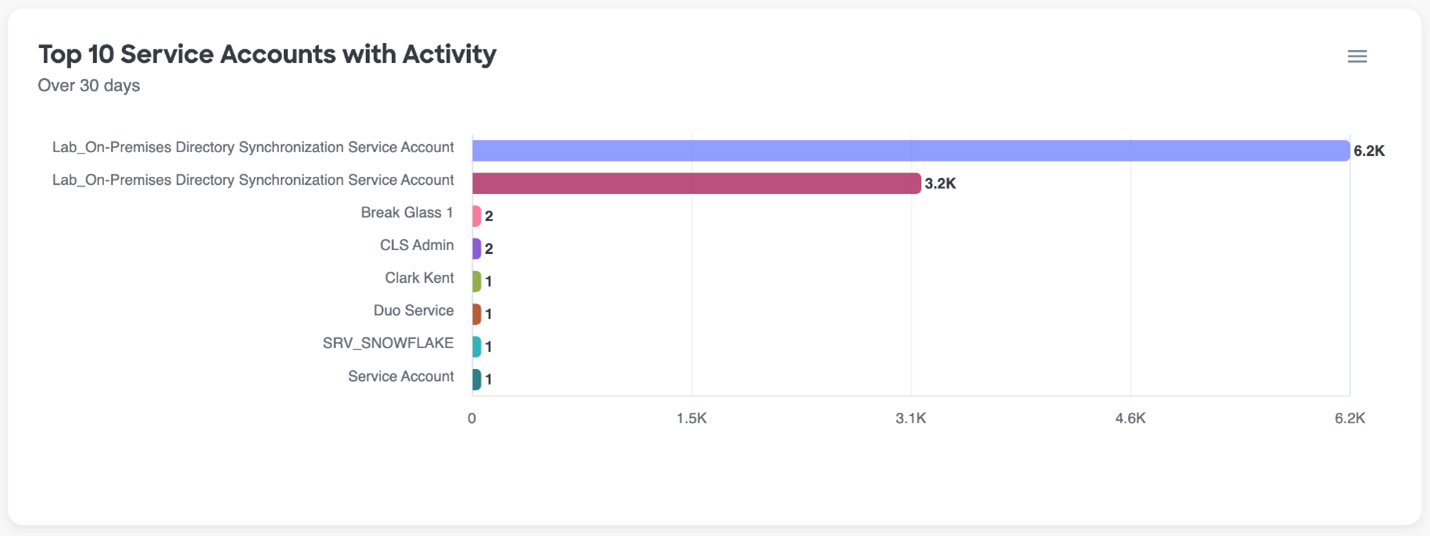
Top 10 Service Accounts with Activity (Over 30 days)
This chart highlights the NHI accounts with the highest activity over the past 30 days. High activity levels often indicate that these NHIs play a critical role in operations. Regularly monitoring these accounts for unusual spikes or changes in activity is important for identifying potential compromises or misconfigurations. Even low activity on critical accounts should be reviewed to confirm all usage is legitimate.
Reports
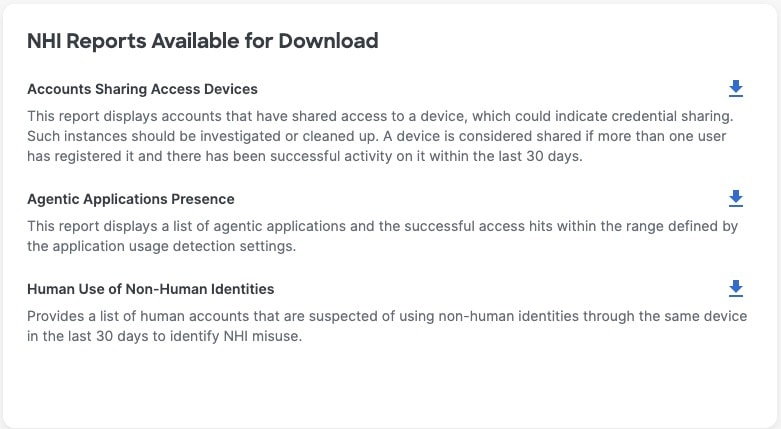
The NHI dashboard includes a new feature that allows you to download reports directly from the dashboard, offering important insights for effective NHI management. Key reports include Human Use of Non-Human Identities, which uncovers security risks when people use NHI credentials, the Agentic Applications Presence Report, which monitors autonomous application activity for compliance with security policies, and Accounts Sharing Access Devices, which identifies potential credential sharing and access control concerns that need prompt attention.
MFA Dashboard
It is often difficult for organizations to understand the full picture around their end users' Multi-factor (MFA) behavior. Collecting and analyzing MFA data across multiple identity sources to identify gaps in coverage, unintended user behaviors, and to report on internal MFA rollouts or initiatives can be a difficult process, that is sometimes needed on a recurring basis. Identity teams are then left gluing together different reports in a very time consuming and manual way, just to make simple reports and visualizations that can be used to share updates with different internal stakeholders.
The MFA tab in the Cisco Identity Dashboard aims to make this type of tracking and reporting easier with some pre-made widgets that provide insight into the MFA and Passwordless enrollment and usage activity across your connected identity sources, allowing you to quickly identify gaps and trends in adoption, which can contribute to potential security risks.
The MFA Dashboard displays metrics and visualizations on areas of interest including:
- MFA Hygiene and Threats
- Factor Usage and Enrollment
- Passwordless Usage and Enrollment
For information on functionality that exists across all Dashboard tabs, please refer back to our Dashboard documentation.
MFA Metrics
Purpose & Benefit: All organizations have an urgent need to understand their MFA posture across their various IAM platforms. These widgets provide current stats on coverage and trends of key MFA metrics.
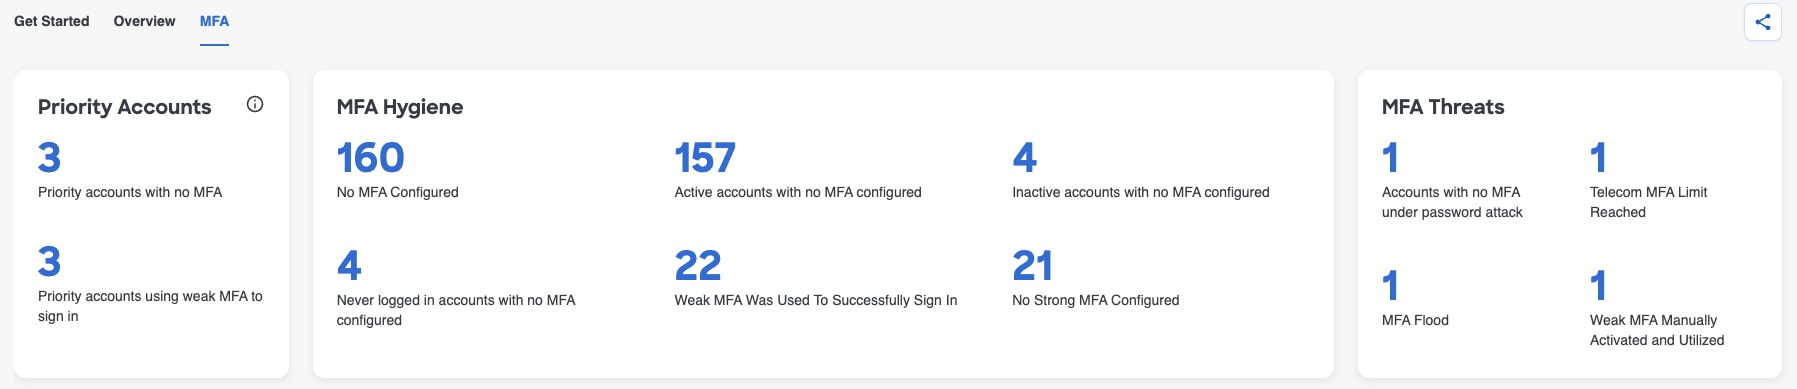
There are 3 widgets, separated by them, that provide key metrics around MFA hygiene and threats
- Priority Accounts - allows you to better understand the MFA adoption gaps for critical accounts (Admins and VIPs) in your organization that should be addressed immediately. Read more about priority accounts in our documentation
- MFA Hygiene - highlights key MFA posture issues across your entire environment to help you prioritize and identify users to take action on so that you can reduce the risk of account compromise
- MFA Threats - surfaces risky behavior related to MFA adoption that should be investigated and remediated
Selecting any of these numbers will take you to the corresponding Check Details page or to a pre-filtered Users page for further investigation on the specific users making up each value.
Factor Usage and Enrollment
When it comes to MFA Adoption, it is crucial to understand both enrollment AND usage patterns within your organization to be able to tell the full story.
Enrollment is Step 1, but it is not enough for a user to simply enroll an MFA factor. They also need to get to Step 2 - using their factors regularly to ensure they are securely authenticating into your environment.
Many organizations can have near perfect MFA enrollment across their user base, but when they look into it, they see that the MFA usage numbers do not match. Other organizations will swear that they have completely blocked the use of weak MFA factors like SMS and Phone calls, but when they look into it, they see that there are still users actively utilizing these factors regularly. These examples, and many others like it, often indicate a configuration issue that must be addressed which is why it is important to look at the holistic picture of enrollment and usage to get the most accurate sense of an organization's MFA adoption.
The MFA Dashboard tab has a few widgets to help understand current usage, as well as enrollment trends over time.
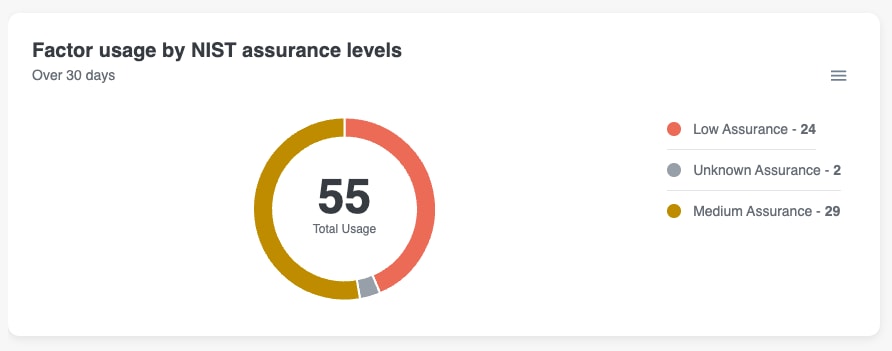
Factor usage by NIST assurance levels
This pie chart displays a breakdown of all factor usage per user, categorized by NIST Assurance Level, over the last 30 days. For example, in the screenshot below, we can see that 29 users have used a Medium assurance factor at least 1 time over the last 30 days.
Hovering over a segment in the pie chart will display a tool tip with the given assurance level and the count of users making up that segment.
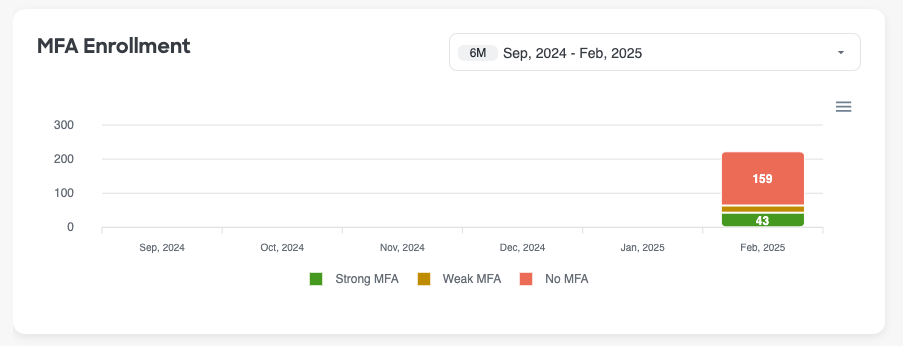
MFA Enrollment
This bar graph provides a look into MFA Enrollment trends over time, categorized by NIST Assurance Level. A user must enroll an MFA method to be reflected in this graph.
Hovering over any item in the graph will display a tool tip with the month and the count of users who enrolled a factor for each assurance level.
By default, this graph will show the MFA Enrollment metrics for the last 6 months, but you can modify the timeframe to also look at the last 2, 3, or 12 months if needed. Note: you may see blank months in the past, which reflects that Cisco Identity was not yet collecting data for these months (ex: newly created tenants or tenants that existed before this feature was released)
MFA Factors: In Use vs Unused
Purpose & Benefit: Quickly assess and compare the status of enrolled and in-use MFA factors and track migrations to stronger factors or other MFA usage anomalies.
An enabled factor is one that is available on a user's account and could be used (ie: user has enrolled this factor in their account) but is not necessarily being used. In use factors are those that have been used in the last 30 days. All In-use factors are enabled factors, but not all enabled factors are in use.
The MFA Factors: In Use vs Unused graph provides a visualization of the total count of users per MFA Factor, broken down by factors enabled versus in use, and color coded by factor assurance level, to help you better understand which MFA factor types are most frequently configured and used across your organization, identify any unexpected behavior, and highlight users who could be utilizing more secure methods but are not.
Hovering over any item in the graph will display a tool tip with the factor name, assurance level, count of users using a given factor, count of users enabled but not using a given factor, and the total count of users enabled with this factor (ie: in use + unused users)
Selecting a given segment (enabled but unused or in use) of one of the bars in this visualization will take you to the Users page, pre-filtered for that specific factor type and usage type.
By default, this widget is filtered to show In use and Enabled but unused Factor data. However, you can also use the available filter to change the graph to see either In Use factors only or Enabled but unused factors only. Selecting a value in the legend below the graph will remove the corresponding data points from the visualization entirely. Select the removed value in the legend to re-add it to the visualization.
Posture Score
Cisco Identity separates posture into three scores. Each score ranges from 0 to 100. Higher scores indicate stronger posture. The MFA Dashboard highlights the MFA Score, specifically.
See Identity Posture Scores for more info on the other category scores, score calculation details, and remediation guidance.
Posture score recommendations
The Posture Score widget provides the current score for the given posture area. It also shows:
- the score threshold level
- the score change over the last 30 days (+ to indicate an increase and - to indicate a decrease)
- the last date the score was calculated
- prioritized recommendations, including
- the number of entities failing the check associated with the recommendation
- the severity of the issue that is being recommended for remediation
Recommendations are ordered by expected impact on the relevant score. Fully remediating the first recommendation produces the greatest improvement to the given category's score. Although other recommendations may have more entities failing, fully resolving "Priority 1" will lead to a bigger improvement in the score than fully resolving "Priority 4", for example.
Select the number of entities in the 'Failing Entities' counter to go to the Checks page or the relevant inventory page, pre-filtered for the entities failing the selected check, so that you can take action to improve your posture score.
You may see View Check when a contributing check is disabled or fails on settings, rather than entities. Select the View Check to review the results or enable the check as needed.
Posture score trend
The trend widget shows changes to the given posture score over time to depict changes to the category-level posture score over time so that you can see and report on your progress, as well as better understand how different events may have impacted the given Posture Score positively or negatively over time.
Hover over a data point, which are marked by a dot on the trend line, to see explainability about why the score may have increased or decreased. The 3 attributes that contributed most to the score change will be displayed when you hover on a specific data point.
By default, this widget looks at the last 30 days; however, you can use the timeframe filter in the top right-hand corner of the widget to change the widget's timeframe to be longer or shorter depending on your needs.
Passwordless Usage and Enrollment
The MFA Dashboard also has widgets that look specifically at passwordless Adoption trends to help organization's understand the progress made, as well as an areas that are lagging behind expected adoption levels. Passwordless MFA methods are considered the most secure method for authentication as they are much more difficult for bad actors to compromise.
Like with general MFA Adoption, for a successful passwordless rollout, organizations need to compare passwordless factor enrollment rates to passwordless usage rates to get a full understanding of their organization's adoption and progress. If users have enrolled these more secure factors but continue to utilize weaker factors to authenticate, the organization has not successfully deployed passwordless.
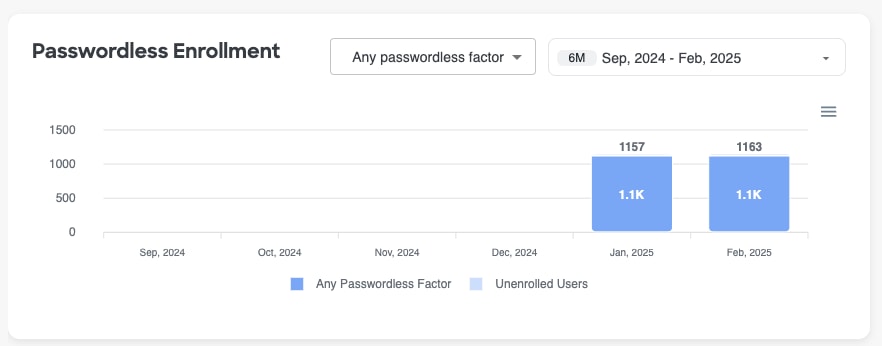
Passwordless Enrollment
Similar to the general MFA Enrollment widget, the Passwordless Enrollment widget helps visualize the first step of any passwordless rollout project - user enrollment - and how the numbers change over time throughout the rollout. A user must enroll a passwordless authentication factor to be reflected in this graph.
Hovering over any item in the graph will display a tool tip with the month the count of users who enrolled a passwordless factor and the count of users who did not enroll a passwordless factor.
By default, this widget is filtered to show the number of users who have enrolled in any factor that is considered passwordless. However, you can also use the available filter to change the graph to see the enrollment numbers for specific passwordless factors that your users have enrolled in.
Selecting on a value in the legend below the graph will remove the corresponding data points from the visualization entirely. Select the removed value in the legend to re-add it to the visualization.
By default, this graph will show the Passwordless Enrollment metrics for the last 6 months, but you can modify the timeframe to also look at the last 2, 3, or 12 months if needed. Note: you may see blank months in the past, which reflects that Cisco Identity was not yet collecting data for these months (ex: newly created tenants or tenants that existed before this feature was released)
Passwordless Adoption
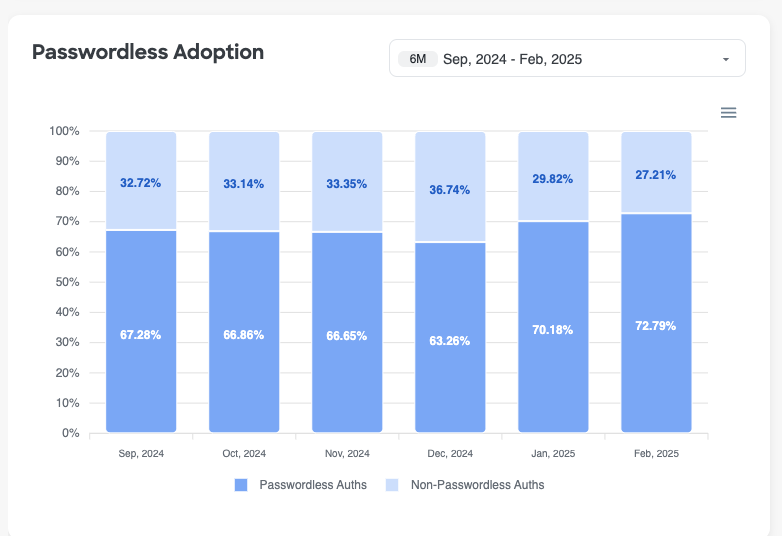
The Passwordless Adoption widget helps visualize the second step of any passwordless rollout project - passwordless usage - and how the numbers change over time throughout the rollout. It is important to understand the volume of authentications that utilize a passwordless method compared to non-passwordless methods to identify if users are actually adopting the new, more secure methods, or if they continue to utilize old methods out of habit or because they are not being forced to move over.
Passwordless auths refer to active authentications done by an end user, utilizing a passwordless method. Non-Passwordless auths refer to all other active authentications done by an end user using other factors that are not passwordless. Non-active authentications done where the user is NOT prompted to authenticate are not included in either category (for ex: Auths via remembered devices or sessions)
Hovering over any item in the graph will display a tool tip with the month the percentage of active authentications that used a passwordless factor and the percentage of active authentications that used a non-passwordless factor.
Selecting on a value in the legend below the graph will remove the corresponding data points from the visualization entirely. Select the removed value in the legend to re-add it to the visualization.
By default, this graph will show the Passwordless Adoption metrics for the last 6 months, but you can modify the timeframe to also look at the last 2, 3, or 12 months if needed. Note: you may see months in the past which show 100% for non-passwordless auths, which may reflect that Cisco Identity was not yet collecting data for these months (ex: newly created tenants or tenants that existed before this feature was released)
Sensitive App Authentication
When going through passwordless deployments, many organizations choose to start by enforcing these factor methods on the applications that are most critical to the business to ensure that the applications are well protected.
With the Sensitive App Authentication widget, it is now much easier to understand how often these applications are being accessed using passwordless methods and how often they are not, so that you can track adoption progress and remediate any gaps that are allowing non-passwordless authentications.
Note: If you have not configured any sensitive applications for your organization, we recommend reading our Sensitive Apps documentation so that you can add in important applications for your organization. Configuring your sensitive apps list is important as this info is re-used in many ways across Cisco Identity and will impact the data and results the platform provides.
This widget shows authentication data for these apps over the last 30 days. It uses the same definitions for passwordless auths and non-passwordless auths as the Passwordless Adoption widget. Please refer to the documentation above for that widget to read the definitions.
Hovering over any item in the graph will display a tool tip with the application name, the count of active passwordless authentications and the count of active non-passwordless authentications.
Selecting on a value in the legend below the graph will remove the corresponding data points from the visualization entirely. Select the removed value in the legend to re-add it to the visualization.
Note: This widget only displays a maximum of 10 sensitive applications. If there are more than 10 sensitive apps configured for your organization, the widget will display the 10 applications that have the highest number of total authentications.
Devices Dashboard
The Devices dashboard provides insights and key metrics about the devices present in your environment based on the data Cisco Identity receives from your connected Identity Sources. This data can be used to identify device clean up opportunities, surface device hygiene gaps to address, provide insight into the impact of an organization wide policy change, and more.
This article provides details on each of the sections or widgets, specifically available in the Devices dashboard.
Please refer to the high-level Dashboard documentation for information on functionality that is available on every Dashboard pages, such as exporting widgets or raw data, customizing the dashboard pages, sharing links or PDFs, etc.
The Devices dashboard displays metrics and visualizations on areas of interest including:
- Shared, orphan, and stale devices by Source
- Device Metrics
- Devices by Source
- OS Status
- Outdated Devices by Endpoint Type
- Managed Devices Usage
- Stale Devices Count
- Devices by Type
- Operating System Usage
Shared, Orphan and Stale Devices by Source
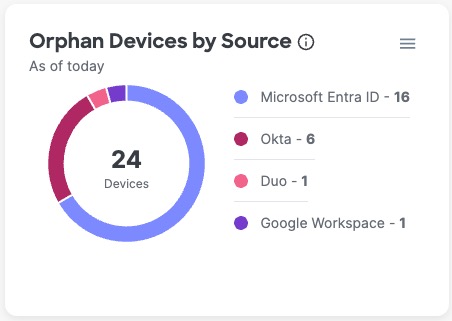
These 3 pie charts display similar information and provide similar options. All pie charts show the total number of devices in the center with a breakdown of the number per identity source.
Definitions:
- Shared Devices by Source: Number of devices that are assigned to or used by more than one user as detected by each identity source
- Orphan Devices by Source: Number of devices not associated with any user detected by each identity source.
- Stale Devices by Source: Number of devices not associated with any user and 90 or more days inactive per identity source.
Example:
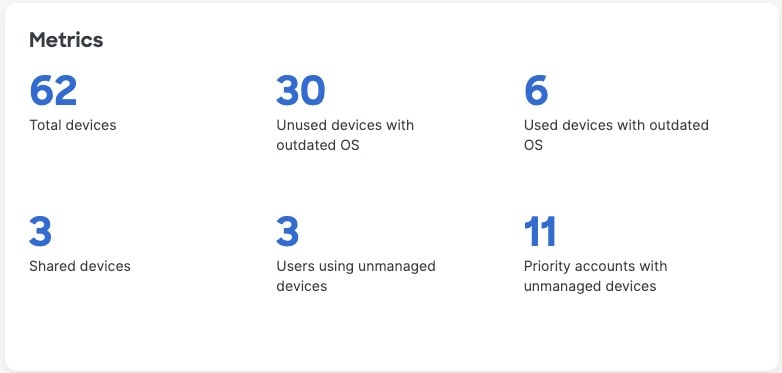
Metrics
Provides high level counts and insights, including the total number of devices and the number of devices in the indicated categories. Select either the number or the text to navigate to the Devices tab page, pre-filtered on your selection, to view more details.
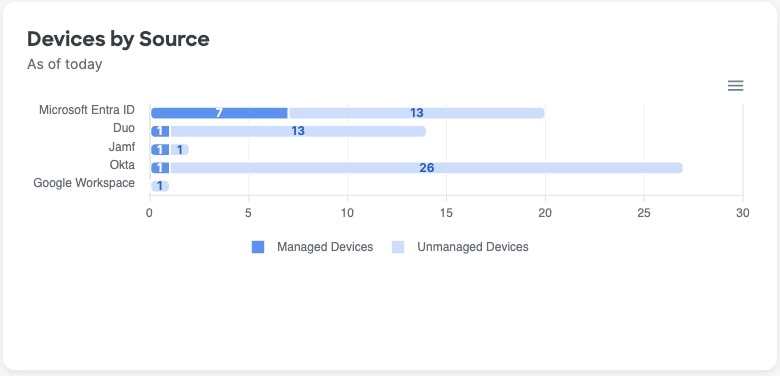
Devices by Source
The current number of devices per identity source, divided into managed and unmanaged devices.
Selecting any of the segments in the bars of this visualization will take you to the Devices page, pre-filtered for the Source and Device status (managed/unmanaged), so you can see all the devices that currently make up that segment and take action accordingly.
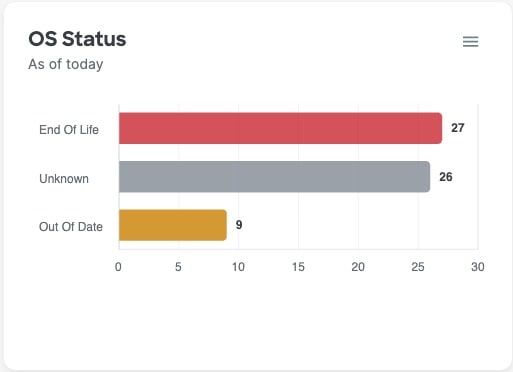
OS Status
Devices that are running operating systems (OS) versions that are End of Life or Out of Date introduce risk to your organization as they can have security vulnerabilities that bad actors can take advantage of. You should contact the assigned users of these devices immediately to upgrade their OS, or remove the device record from your systems if it is not associated with any users. Your organization should also implement access policies to block the device from connecting to your organization's network or resources.
This widget shows the total number of devices per current operating system status:
- End of Life: Operating system version that is longer supported, maintained, or patched by the vendor
- Out of Date: Operating system version that is missing critical patches
- Supported: Operating system version that is still maintained by the vendor
- Latest: Operating system version that is the most recently released by the vendor
- Unknown: Cisco Identity couldn't determine the operating system version, and therefore the status
Selecting one of the bars in this visualization will take you to the Devices page, pre-filtered for the chosen OS Status, so you can see all the devices that currently make up a particular segment and take action accordingly.
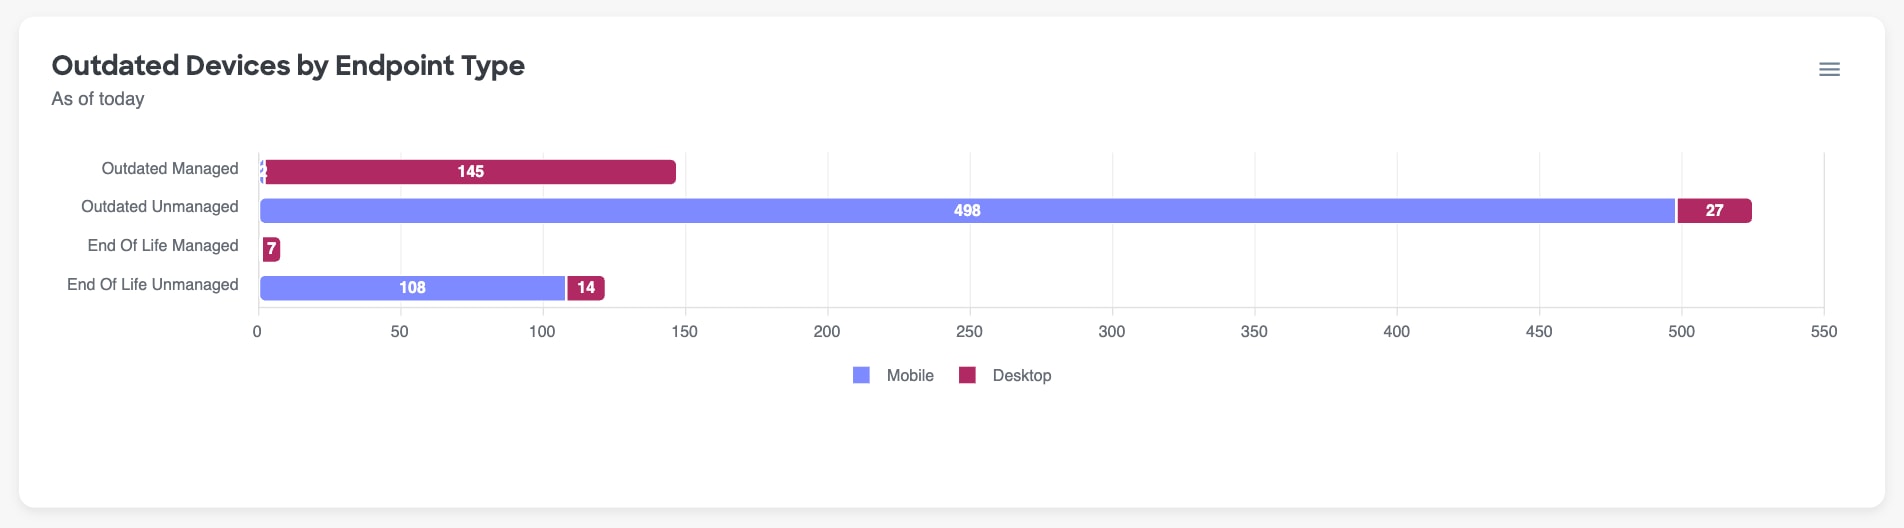
Outdated Devices by Endpoint Type
Endpoint type means either desktop or mobile. Managed is described in Devices.
Number of devices whose operating system is outdated according to the vendor, broken down and grouped by:
- End of Life Managed devices
- End of Life Unmanaged devices
- Outdated Managed devices
- Outdated Unmanaged devices
Selecting any of the segments in the bars of this visualization will take you to the Devices page, pre-filtered for the chosen OS Status, so you can see all the devices that currently make up a particular segment and take action accordingly.
Managed Devices Usage
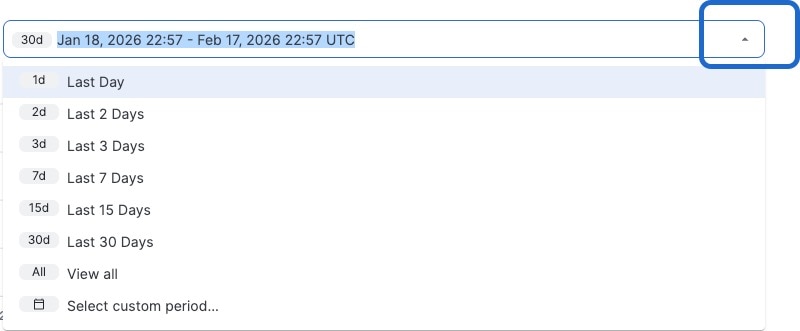
If your organization is working on rolling out Managed Devices, enforcing managed device usage, or working on cleaning up unmanaged device access, this widget will make it easy to track adoption and visualize the progress made over time so that it is easier to understand and communicate the improvements made being made by this effort.
This widget looks at device usage to track the total number of managed devices compared to unmanaged devices, that have been used over time. To change the time period, select the timeframe filter in the top right corner of the widget and follow the prompts on your screen.
Stale Devices Count
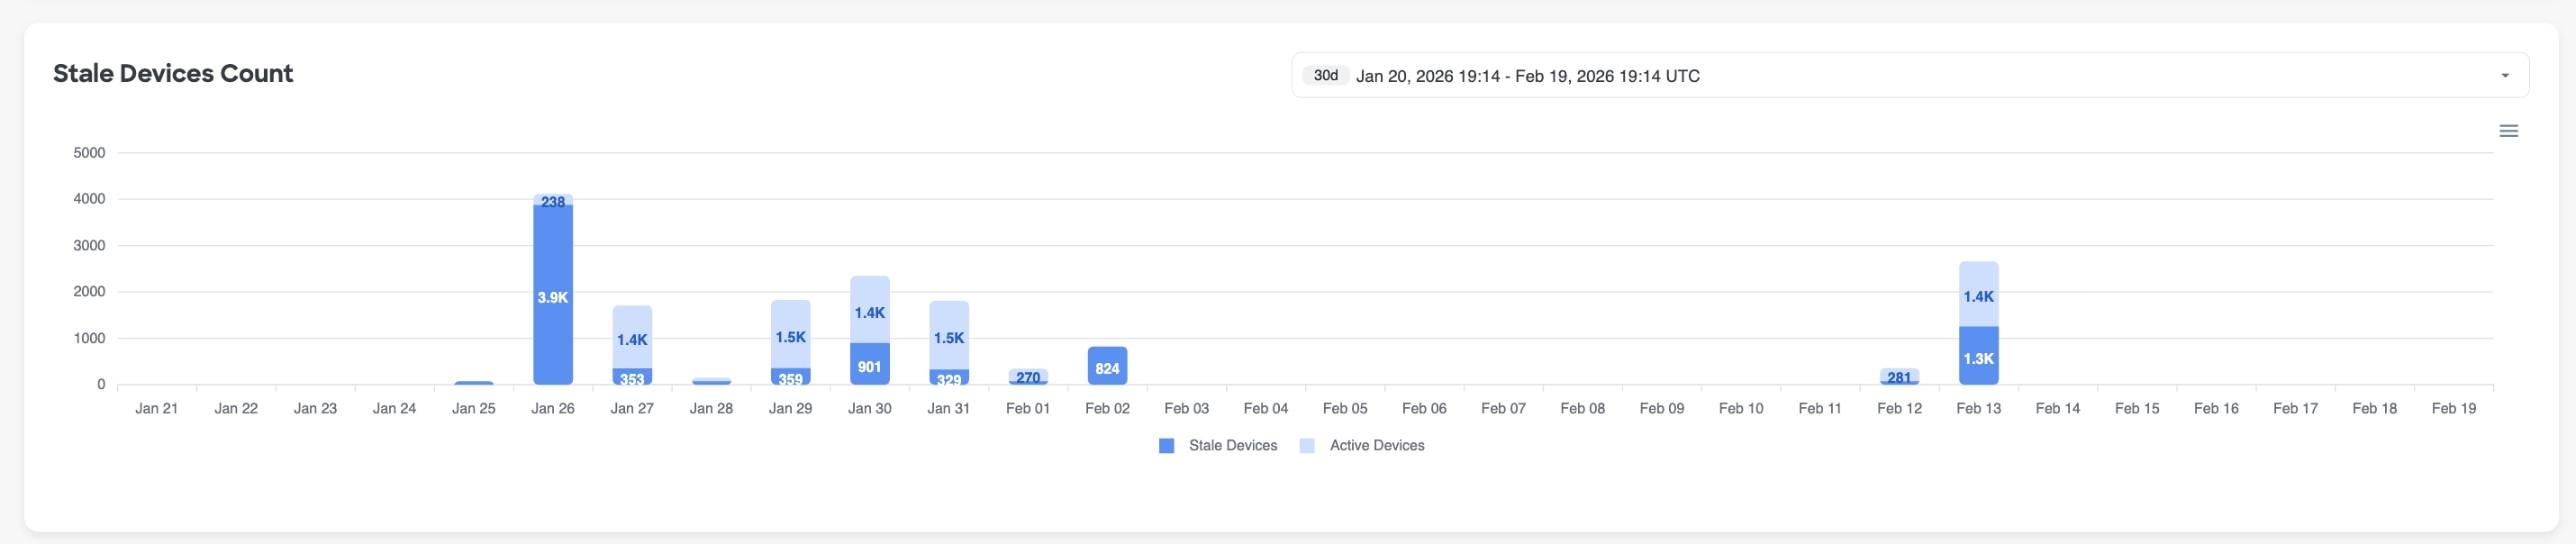
Similar to the "Managed Devices Usage" widget, the Stale Devices count aims to help your organization understand and visualize the progress that is being made with cleaning up stale devices in your environment.
A stale device is not associated with any user and has been inactive for 90 or more days as determined by the identity source. Number of managed and unmanaged devices by day. To change the time period, click the list and follow the prompts on your screen.
This widget compares the total number of stale devices to active devices seen in your environment, over time. To change the time period, select the timeframe filter in the top right corner of the widget and follow the prompts on your screen.
Devices by Type
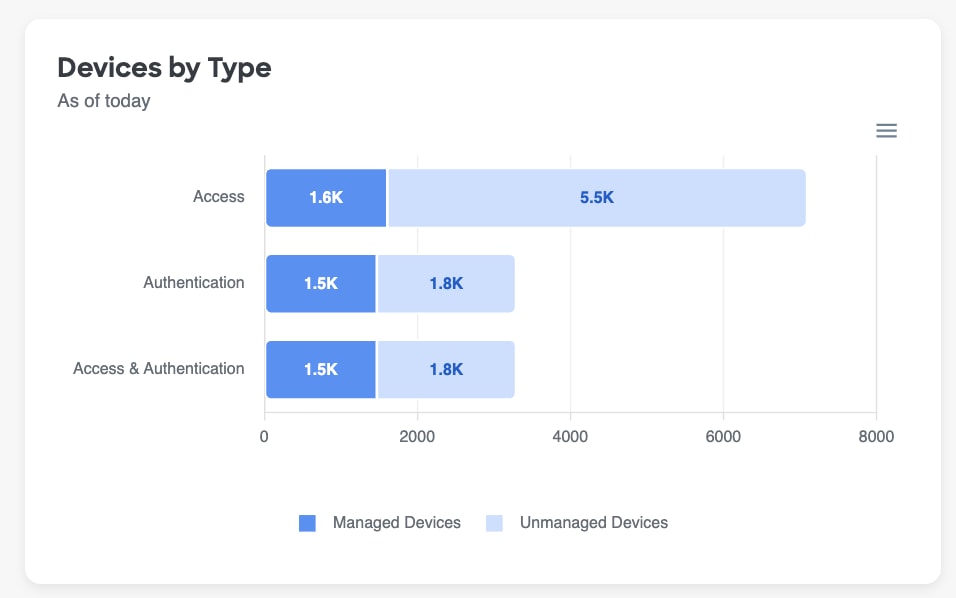
The current number of managed and unmanaged devices broken down by Device Type:
- Access: Typically a computer.
- Authentication: Typically a mobile device that must be enrolled using an app like Duo Push.
- Access & Authentication: A device that can be used for both access and authentication, such as a laptop with a biometric, fingerprint scanner that is enrolled as an MFA factor
Selecting any of the segments in the bars of this visualization will take you to the Devices page, pre-filtered for the chosen Device Type and Managed Status, so you can see all the devices that currently make up a particular segment and take action accordingly.
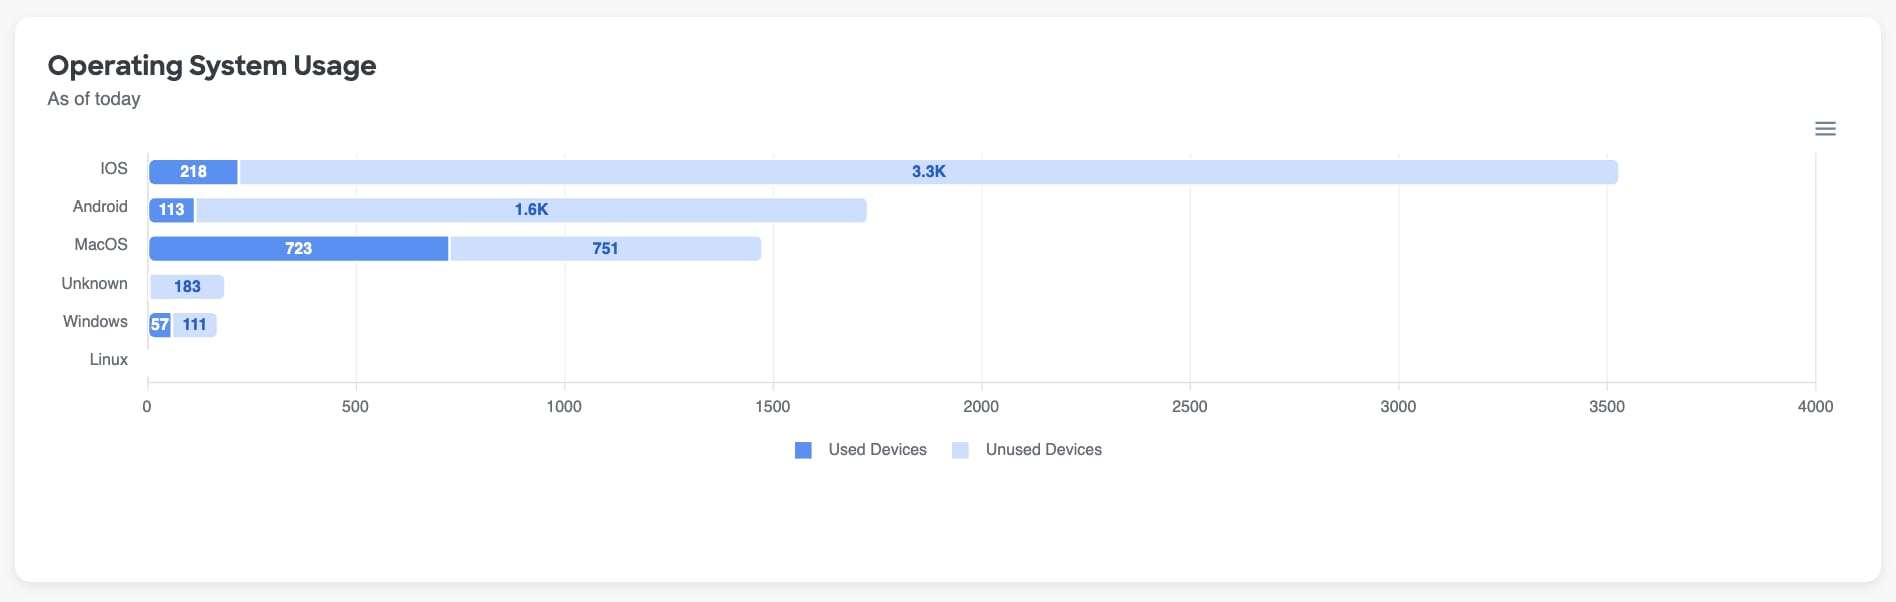
Operating System Usage
A comparison of used and unused devices, per type of operating system.
Selecting any of the segments in the bars of this visualization will take you to the Devices page, pre-filtered for the chosen OS Type and usage status, so you can see all the devices that currently make up a particular segment and take action accordingly.
Applications Dashboard
The Applications Dashboard contains information focused on application usage within your environment. Removing user access from unused applications, especially for sensitive or critical business applications, can not only help your organization save on licensing costs, but also improves its security posture by reducing the "blast radius" associated with malicious access to unnecessary applications in the event of an account compromise.
The Applications Dashboard aggregates data from the Applications page to surface insights regarding your org's app hygiene. Refer to Applications for more details about the Apps page and the data displayed there.
Life Cycle
This widget acts as a health check of the organization's application inventory. Rather than serving as a simple count of apps, it helps show how much of the environment is actively governed, how much has been formally brought under visibility and review, and how much may be inactive or ready for cleanup.
Highlights whether application management is keeping pace with change. A healthy lifecycle picture supports stronger oversight, reduces the chance that forgotten or retired applications continue to create access risk, and helps teams focus review efforts on the parts of the application landscape that may need onboarding, validation, or deprovisioning.
Select any of the numbers in this widget to drill down into the relevant Applications.
Displays:
- Total number of applications
- Number of onboarded applications - Apps that have been newly brought into Cisco Identity via your connected identity sources and are still in their early monitoring window
- Number of deactivated applications - Apps that have been deactivated at the identity source and can no longer be used
- Number of applications that have keys that are about to expire
- Number of applications with expired secrets
Access & Entitlement
Shows how application access is being granted across your environment, and where that access might no longer match real usage. Rather than just counting applications, it helps surface patterns that matter for governance: applications that are broadly available, applications with explicit user assignments, and applications that appear assigned or available but are not being used.
Use this data to spot potential over-entitlement, stale access, weak access controls, or process and automations issues before they become security problems. It helps answer questions like: Which apps may be exposed more widely than intended? Where are users retaining access they do not need? In that sense, the graph supports least-privilege decisions, access reviews, and overall reduction of unnecessary risk.
Select any of the numbers in this widget to drill down into the relevant Applications.
Displays:
- Not accessed applications - Apps that have 0 activity over the last 30 days (by default). The inactivity threshold can be modified using the custom detection settings on the "Applications with Limited Adoption" check
- Applications with no assignment required - Access to these apps is not restricted to certain groups. These apps can be accessed by any user in your organization
- Assigned but unused applications - Apps that have been used by fewer than 90% of the assigned users within 30 days (by default). The usage threshold can be modified using the custom detection settings on the "Applications with Limited Adoption" check
- Applications with Limited Adoption
- Applications with Directly Assigned Users
Application Utilization
This chart shows how assigned applications are being used in your organization in the last 30 days so you can easily visualize your org's current state as it relates to app usage. Its value is not just in showing activity levels, but in helping separate applications that are actively supporting the business from those that might be over-provisioned, neglected, or carrying access that no longer reflects real need and require remediation action.
Low-utilization or unused applications can indicate unnecessary entitlements, stale assignments, procedural issues with new account onboarding or lateral employee movement, or forgotten integrations. These apps can increase the attack surface without delivering much operational value. Use this data to help you prioritize where to review access, validate ownership, tighten application hygiene, and focus cleanup efforts on the applications most likely to present avoidable risk.
To restrict the visualization to only sensitive application data, slide the toggle above the chart to Enabled.
Hovering over a segment in the pie chart will display a tool tip with the given utilization level and the count of apps making up that segment. To see which apps make up a given utilization level, select either the desired "slice" from within the pie chart or select the desired utilization level from the chart's key to navigate to the App page pre-filtered on your selection
Application Reports Available for Download
Download a report in CSV format that shows applications with multiple keys. This report can also be accessed and downloaded via the Reports page found in the left hand menu.
Least Used Applications
Displays the applications that are widely assigned but seeing little real activity in the last 30 days, by comparing the number of accounts assigned vs utilized. At a high level, this widget surfaces your lowest adoption apps (largest deltas between utilized and assigned) so that they can be prioritized for removal so that you can reduce your org's attack surface and tighten access hygiene.
Because of their incredibly low usage levels, and their high assignment levels, these apps are typically lower risk to remove because the change will not impact a large segment of users. They are also likely incurring high license costs that can be recovered by removing the app and ending the agreement with the vendor.
Selecting either segment - 'using the application' or 'not using the application' - of one of the bars in the visualization will take you to the Users page, pre-filtered for the selected application and accounts associated with your selection. Using this granular data can help inform the appropriate remediation action such as removing dormant accounts completely, revoking unused access, or confirming whether an entire application is still needed.
Application Types by Source
Shows how the organization's application footprint is distributed across your connected identity sources. Instead of viewing all applications as one undifferentiated inventory, this widget shows where different kinds of applications are coming from so you can spot how much of your environment is centrally managed versus being harder-to-govern or service-driven. It can also highlight possible configuration issues that allow end users to add unapproved apps to your environment, unintentionally introducing an additional data risk vector.
A source with a large share of unmanaged or service-oriented applications can indicate weaker visibility, less consistent governance, or more opportunities for non-human or indirect access to accumulate without review. You can use this graph to identify which sources deserve closer attention, prioritize cleanup and access reviews, harden IdP configuration settings, validate onboarding coverage, and focus security controls where application sprawl or governance gaps are most likely to create risk.
Selecting a given segment of one of the bars in this visualization will take you to the Apps page, pre-filtered for that specific source and app type. Selecting a value in the legend below the graph will remove the corresponding data points from the visualization entirely. Select the removed value in the legend again to add it back to the visualization.
Application Access by Source
Helps you understand how application usage is distributed across your identity sources, not just how many applications exist in each. At a glance, it shows which sources are driving real user activity and which are mainly contributing stale, low-value, or potentially unnecessary application access.
This matters because application sprawl often hides in disconnected systems. By comparing access patterns across sources, an administrator can quickly identify where to focus cleanup, access reviews, and source validation efforts. In a security-conscious environment, that makes it easier to reduce unnecessary exposure, spot areas where access may be over-provisioned or poorly governed, and make better decisions about which sources and applications deserve closer attention.
Selecting a given segment of one of the bars in this visualization will take you to the Apps page, pre-filtered for that specific source and app type. Selecting a value in the legend below the graph will remove the corresponding data points from the visualization entirely. Select the removed value in the legend again to add it back to the visualization.
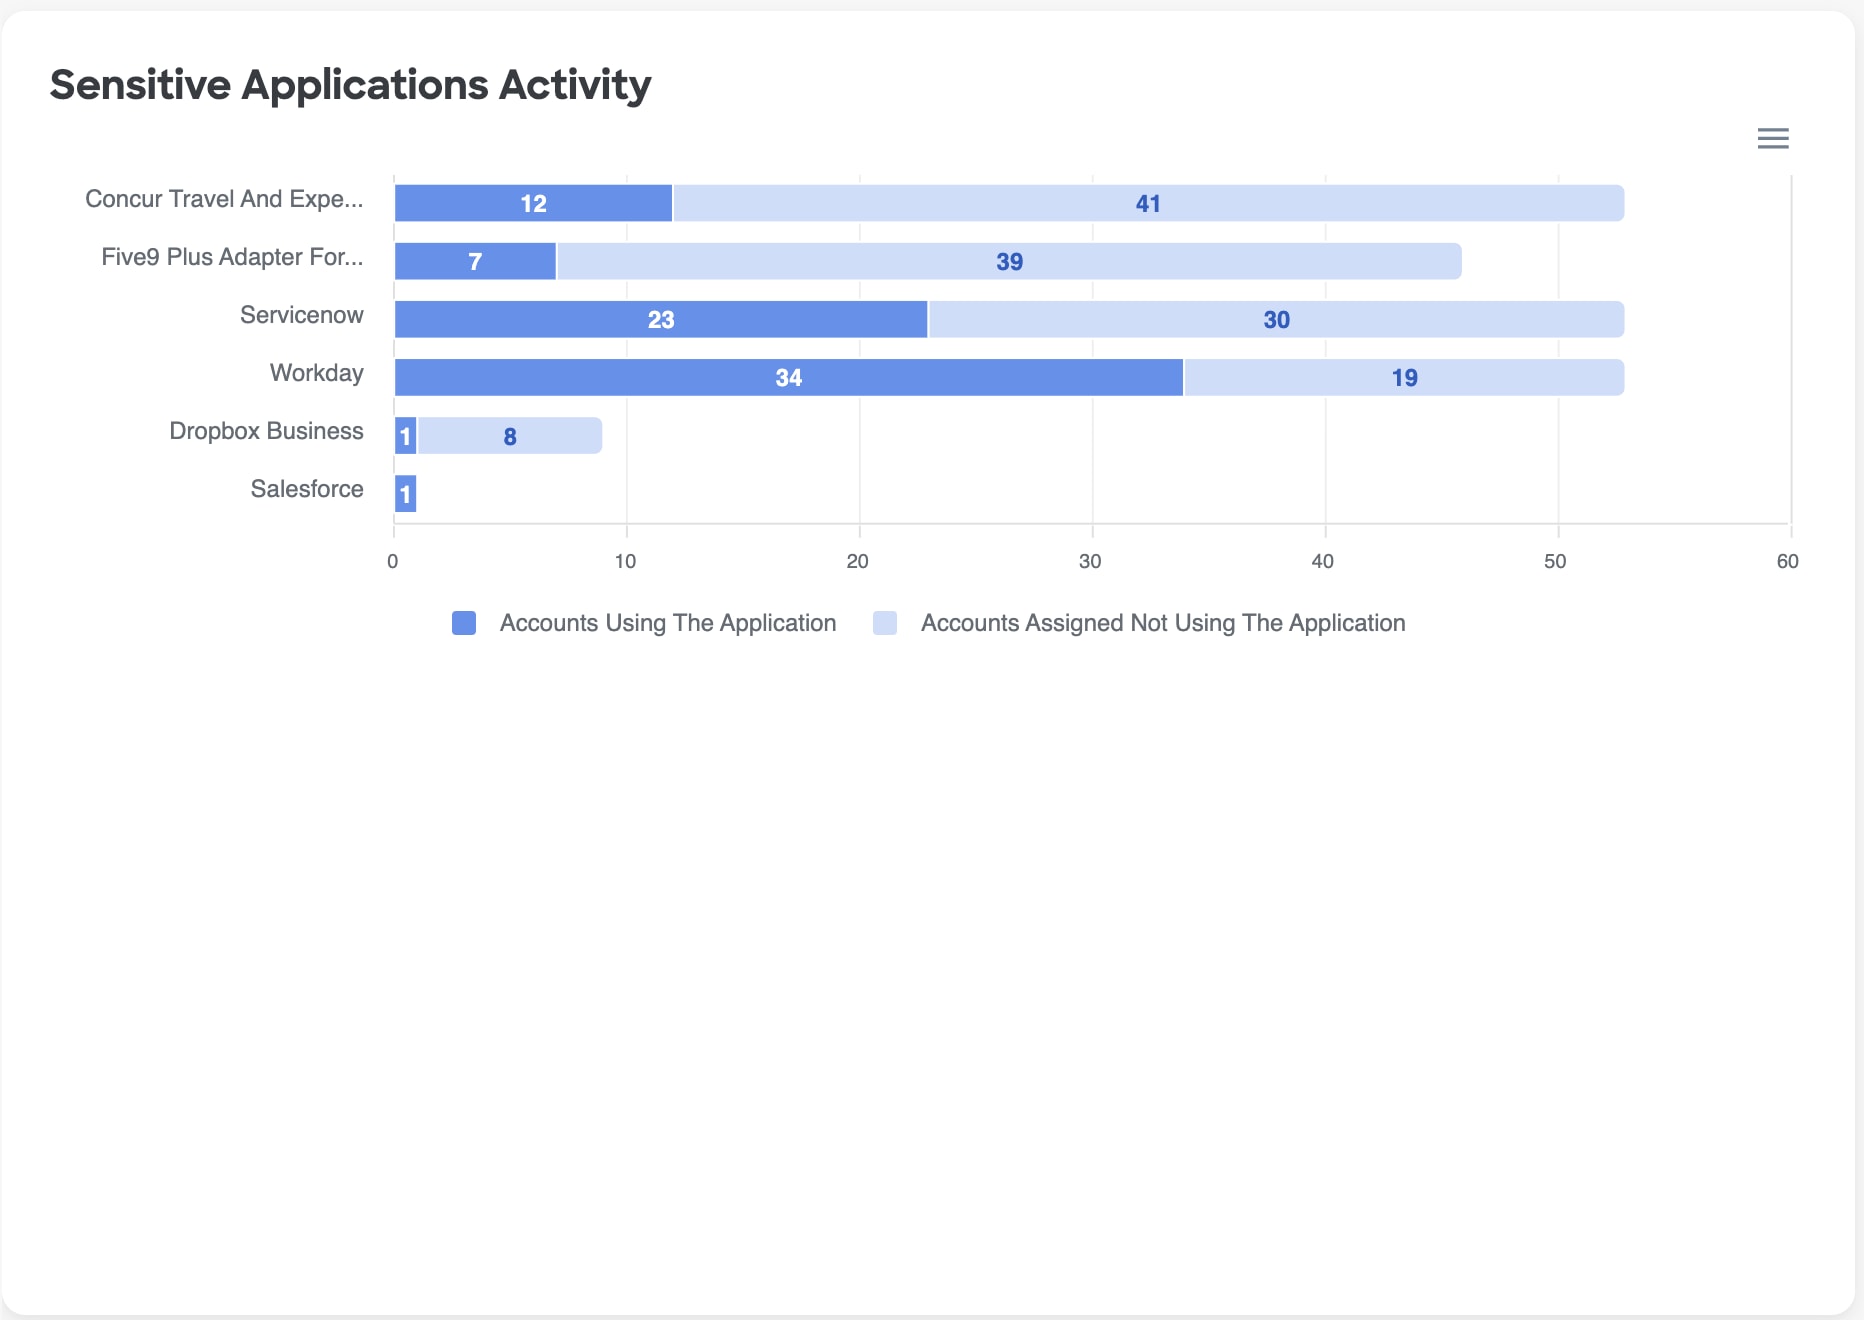
Sensitive Applications Activity
Purpose & Benefit: Highlights users who could be deprovisioned from sensitive applications, reducing the overall attack surface and the blast radius for a given account should it be compromised, while also reducing license costs for your organization.
The Sensitive Applications Activity widget provides a breakdown of the number of accounts who are assigned an application and are using that application compared to accounts not using the application.
To customize the list of sensitive applications to align with your organization's preferences, go to the Applications page within the platform. Documentation on how to configure your sensitive applications list can be found in the Apps page documentation.
Selecting either segment - 'using the application' or 'not using the application' - of one of the bars in the visualization will take you to the Users page, pre-filtered for the selected application and user segment. Selecting a value in the legend below the graph will remove the corresponding data points from the visualization entirely. Select the removed value in the legend again to add it back to the visualization.
Risky Users Accessing Sensitive Applications
This widget depicts the number of users with neutral, questionable, and untrusted trust level that are accessing sensitive applications over time.
Users with lower trust levels should be investigted if they have accessed sensitive applications because there are indicators of risky behavior associated with their accounts. For example, an untrusted user might have a compromised account. This user, in turn, might be leaking customer data, modifying employee personally identifiable information (PII), or downloading sensitive company info like financial records or intellectual property, from sensitive apps as part of their attack.
By default, this widget looks at the last 30 days; however, you can use the timeframe filter in the top righthand corner of the widget to change the widget's timeframe to be longer or shorter depending on your needs.
Not Accessed Applications Over Time
Tracks the number of applications that remain assigned, connected, or visible in the environment but are no longer being actively used. You can use this trend to easily track and demonstrate your org's progress with removing applications that have not been accessed from its app inventory, as well as monitor if the number of unused apps is starting to increase again - warranting another clean up effort.
This view is useful for improving both security hygiene and access governance. A rising or consistently high trend can signal opportunities to review whether applications should still be onboarded, assigned, or monitored as active parts of the environment. It helps you prioritize conversations about deprovisioning, ownership validation, licensing efficiency, and the removal of dormant access paths before they become overlooked risk rather than treating unused access as harmless clutter.
Directly Assigned Applications Over Time
Tracks the number of users that are directly assigned to applications over time so you can track your org's progress with remediating this issue and monitor for sudden spikes or gradual increases that require attention. Use this data to identify growing access-management risk, prioritize cleanup toward group-based access, and watch whether exceptions are becoming more common, especially for sensitive applications.
It is best practice to manage app access using automated, scalable group or policy-based controls rather than one-off user assignments to reduce the manual overhead associated with off-boarding users, managing lateral org shifts or IT help desk tasks to grant user access. If your organization has automated workflows upon user termination, these will often fail when direct access to an app is granted, potentially leaving an unprotected, backdoor account open that bad actors can leverage access your environment.