Risk Score Definition
A risk score is an indicator of the good health and criticality level of a device. The scale is from 0 to 100 with a color
code indicating the level of risk.
|
Score
|
Color
|
Risk level
|
|
From 0 to 39
|
Green
|
Low
|
|
From 40 to 69
|
Orange
|
Medium
|
|
From 70 to 100
|
Red
|
High
|
Risk scores apply to the following:
Risk Score Use
Risk score helps you easily identifying which devices are the most critical within the overall network. It provides limited
and simple information on the cybersecurity of the monitored system. It is a first step in security management by showing
values and providing solutions to reduce them. The goal: minimize values and keep risk scores as low as possible.
Proposed solutions are:
-
Patch a device to reduce the surface of attack
-
Remove vulnerabilities
-
Update firmware
-
Remove unsafe protocols whenever possible (e.g., FTP, TFTP, Telnet),
-
Install a firewall
-
Limit communications with the outside by removing external IPs
Cyber Vision allows you to define the importance of the devices in your system by grouping them and setting an industrial
impact. This function increases or decreases the risk score, allowing you to focus on the most critical devices.
All these actions reduce the risk score which affect its variables, i.e., the impact and the likelihood of a risk. For example,
removing unsafe protocols will affect the likelihood of the risk, but patching a device will act on the impact of the risk.
Risk score presents an opportunity to update usage and maintenance habits. However, it is NOT intended to replace a security
audit.
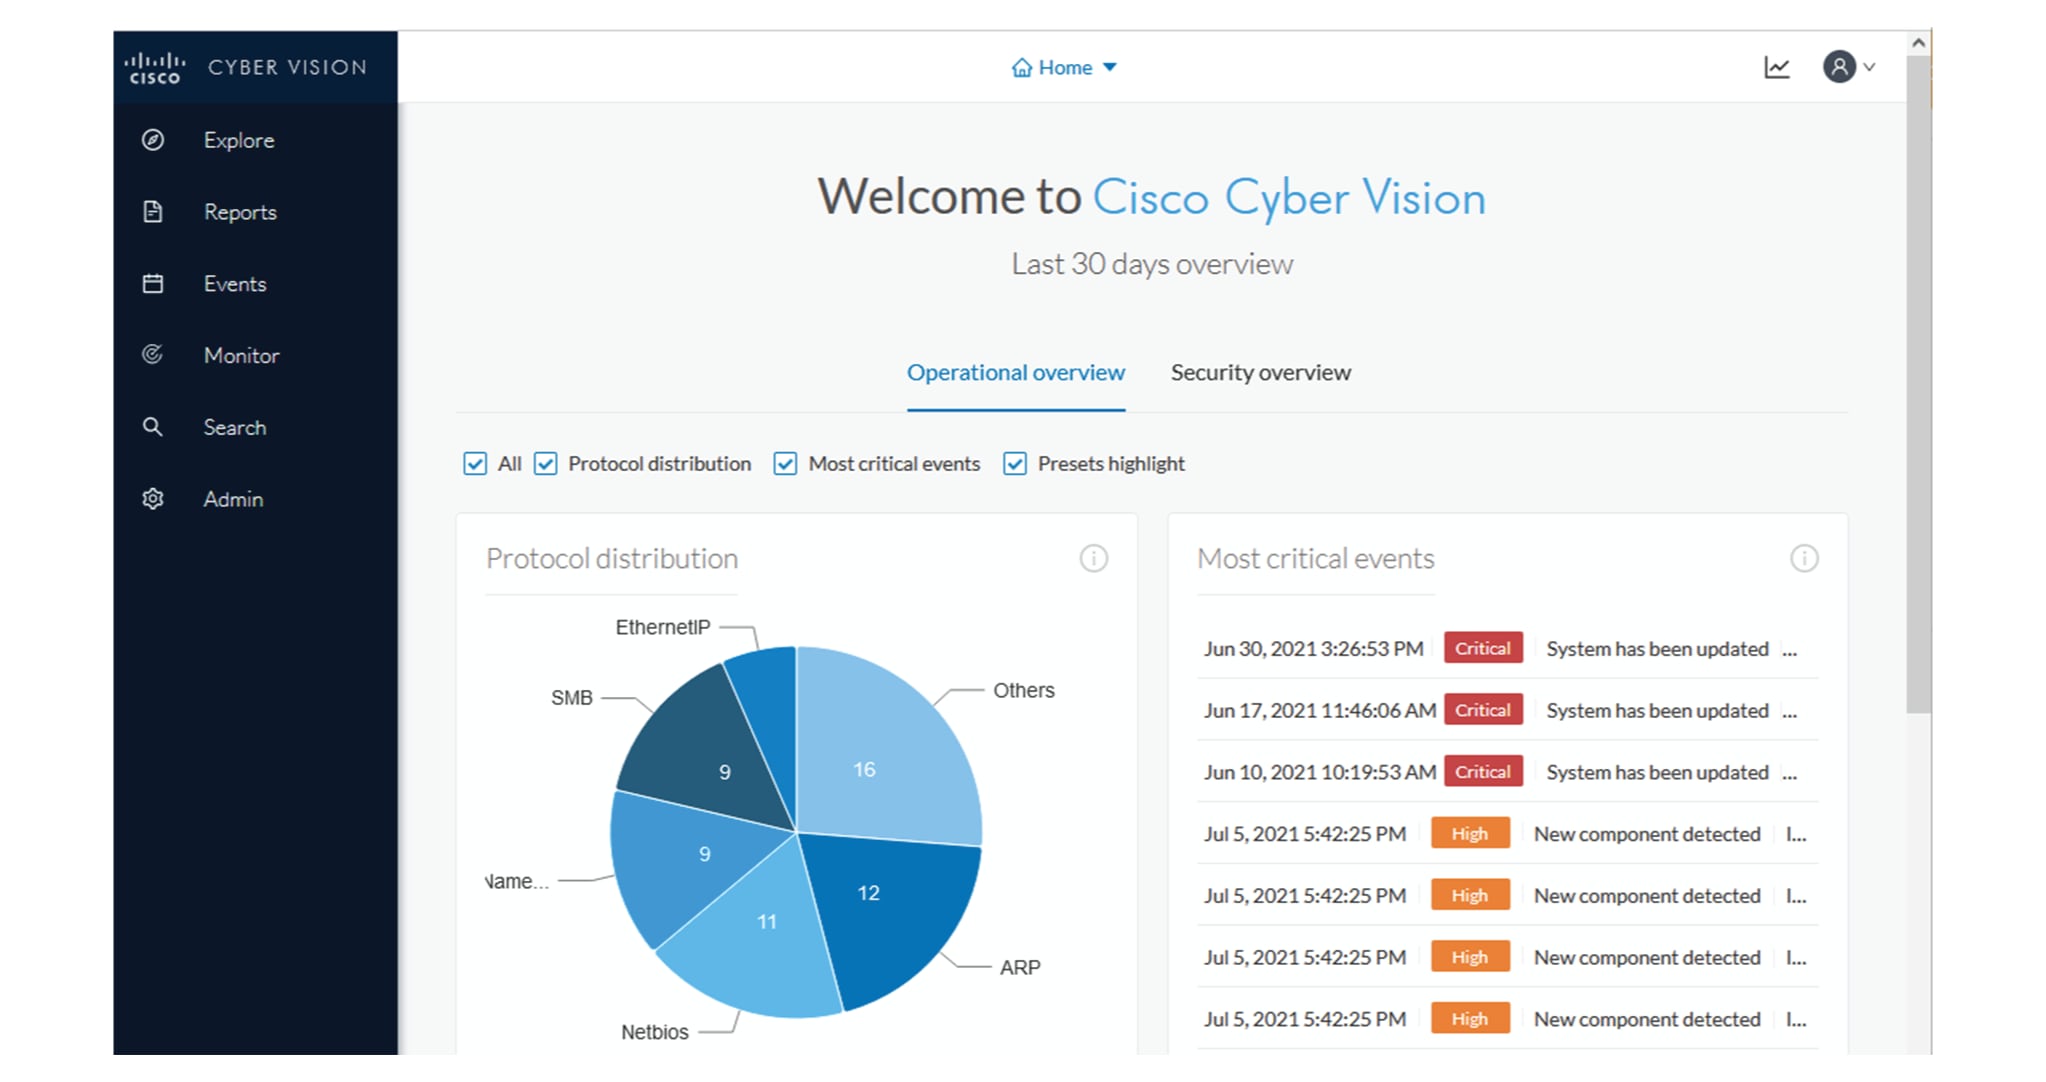
In addition, risk scores are used in Cisco Cyber Vision to sort out information by ordering and filtering criteria in lists
and to create presets.
Risk Score Computation
Risk score is computed as follows:
Risk = Impact x Likelihood
Impact is the device “criticality”, that is, what is its impact on the network? Does the device control a small, non-significant
part of the network, or does it control a large, critical part of the network? Impact depends on:
-
Device tags: Some device types are more critical. Each device type (or device tag) or device tag category is assigned an industrial
impact score by Cisco Cyber Vision. For example, the device is a simple IO device that controls a limited portion of the system
or it is a Scada that controls the entire factory. These will not have the same impact if they are compromised.
-
You effect the device impact by moving it into a group and setting the group's industrial impact (from very low to very high).
Likelihood is the probability of this device being compromised Likelihood of risk depends on the following:
-
Device activies and the activity tags. Some protocols are less secure than others. For example, Telnet is less secure than
ssh.
-
The exposure of the device communicating with an external subnet.
-
Device vulnerabilities, taking into account their CVSS scoring.
For detailed information about a risk, see Details tab inside the technical sheet.
How to take action:
-
From the main menu, choose Explore.
-
Click the drop-down arrow in the top navigation bar and select All Data under Basics.
-
Click the drop-down arrow in the third filter of the top navigation bar and select Device List.
-
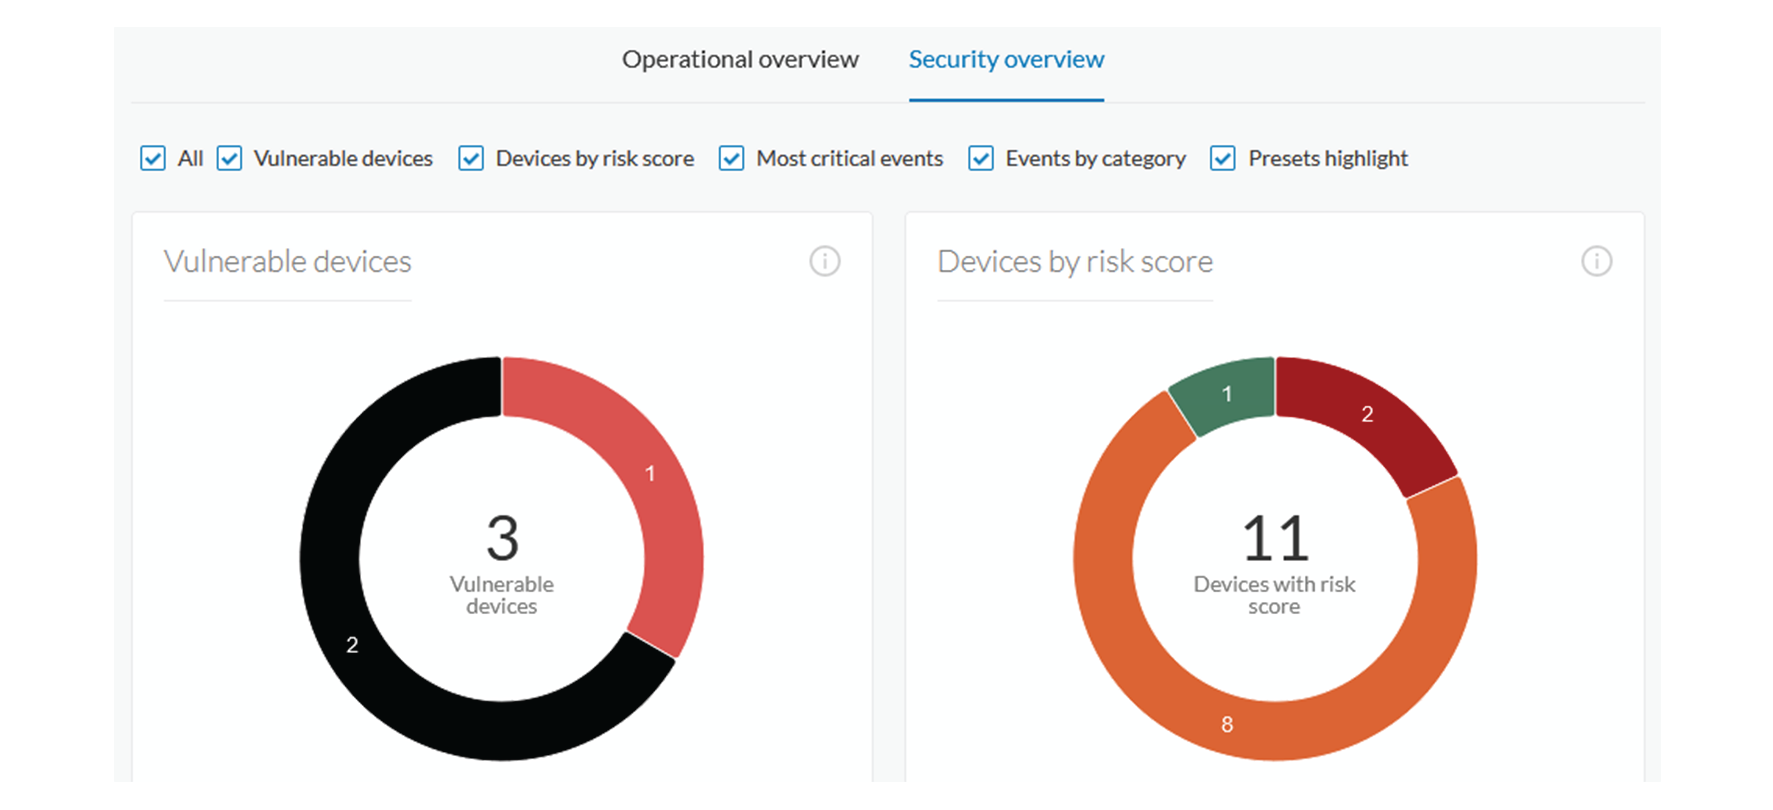
In the Risk score column, click the sort arrow to display the highest risk scores.
-
Click a device name under the Device column.
The right-side panel appears.
-
In the Risk score, click See details.
The technical sheet appears.
In the Overview tab, the Current risk score and the Achievable risk are displayed.
The achievable risk score is the best score you can reach if you patch all vulnerabilities on the device and remove all potential
insecure network activities. The score cannot be zero because devices have intrinsic risks coming from their device type and,
if applicable, their group industrial impact.
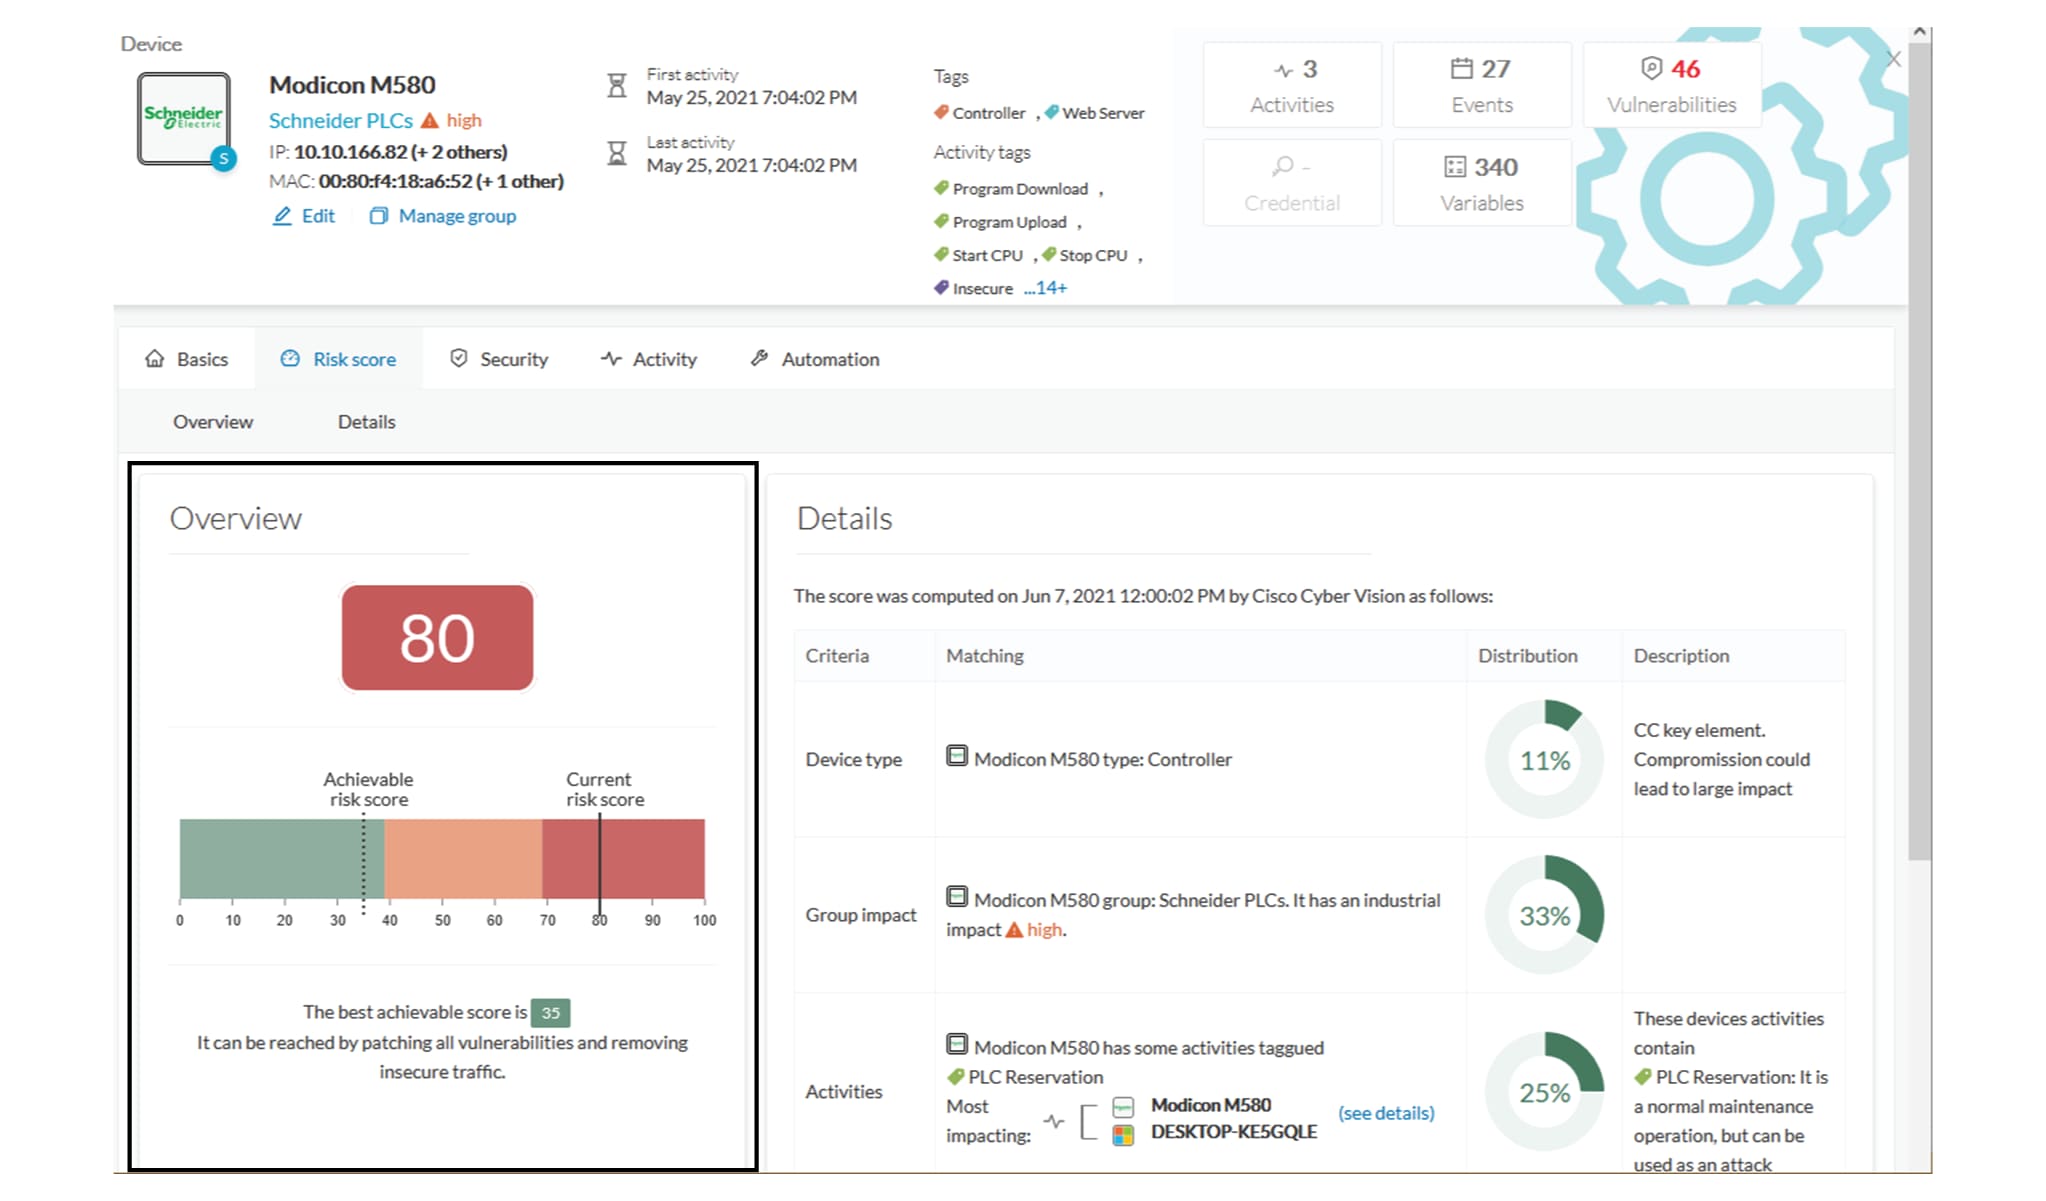
The Details tab shows further information about the different risks impacting the device, the percentage of the risk they represent within
a total risk score, and the solutions to reduce or even eliminate them.
Device type and Group impact affect the risk impact variable. Activities and Vulnerabilities affect the risk likelihood.
This page shows the last time the risk score was computed by Cisco Cyber Vision. Risk score computation occurs once an hour.
To force immediate computation, use the following command on the Center shell prompt:
sbs-device-engine
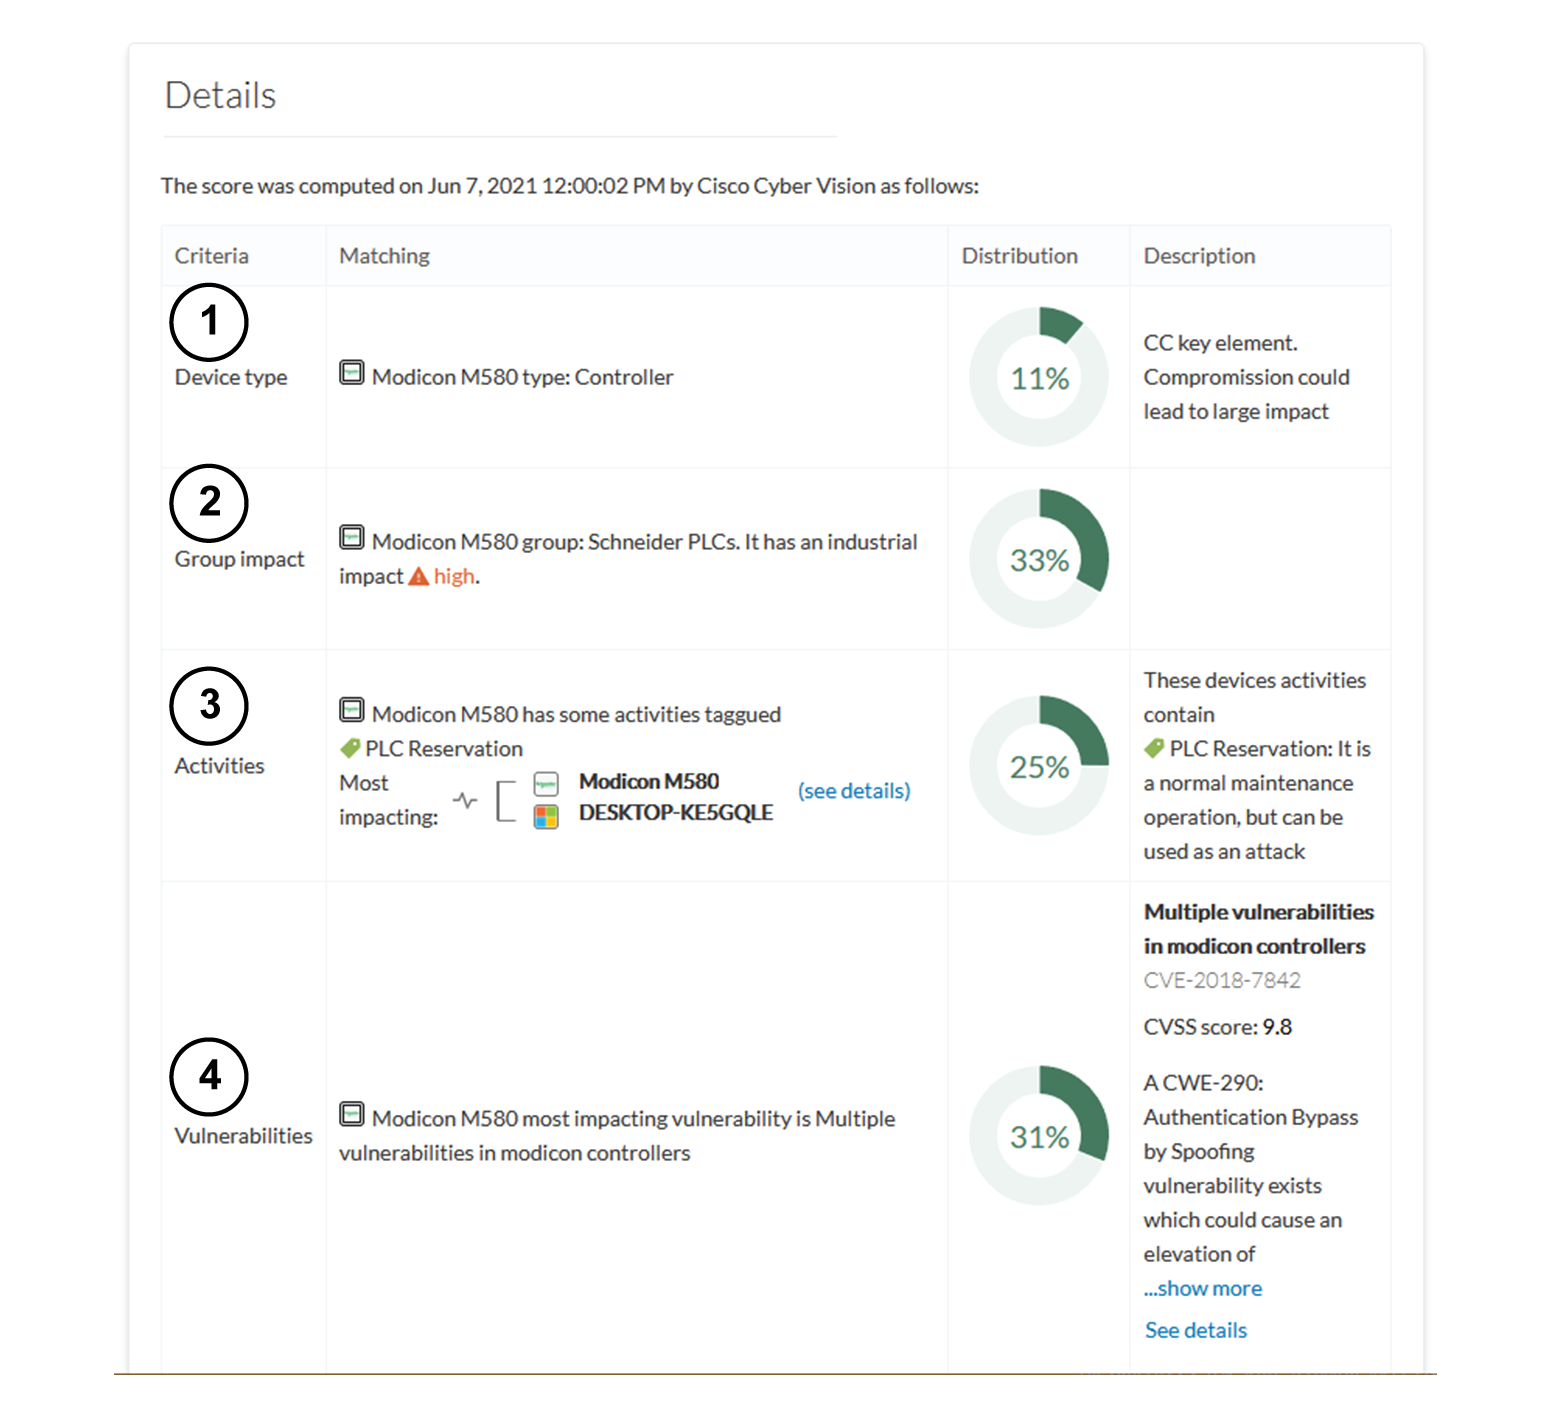
Below is an example of the information retrieved during the last computation.
-
Device type: Each device type corresponds to a device tag detected by Cisco Cyber Vision. No action is required at the device type level because each device tag is assigned a risk
score by default.
-
Group impact: Action is possible if the device belongs to a group. Decrease the impact by lowering the industrial impact of the group
that the device belongs to.
For example, if you set the group industrial impact to very low (previously high), the overall risk score decreases from 80
to 54.
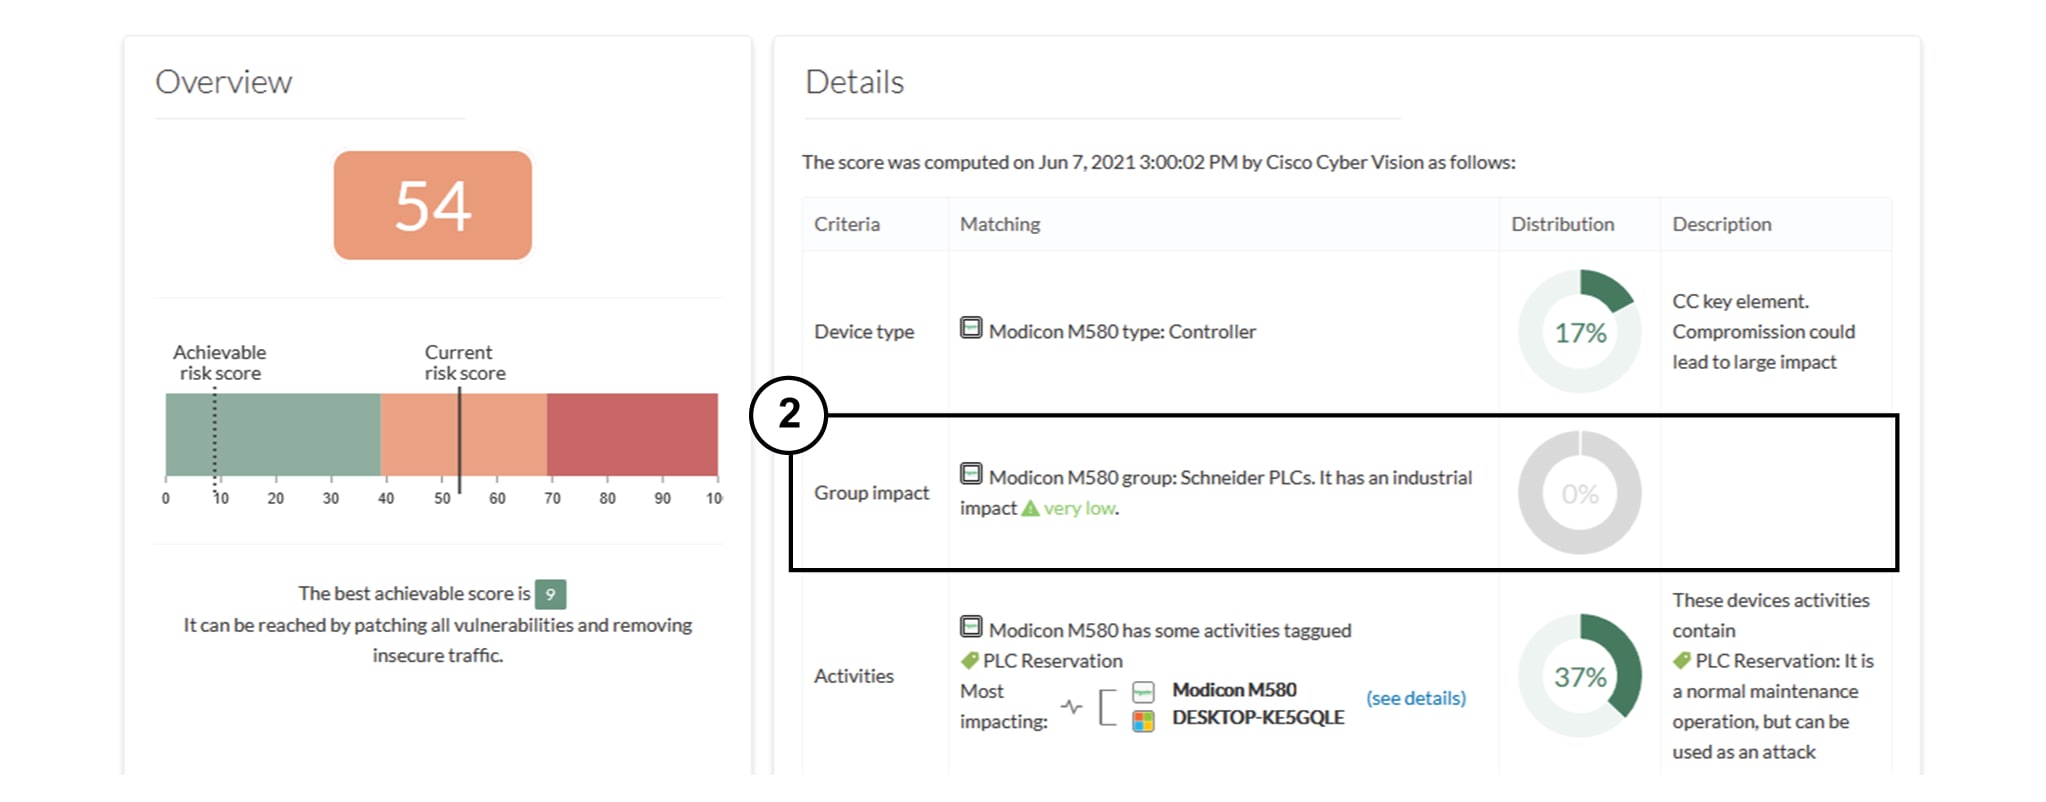

Note
|
The new industrial impact will factor into the next risk score computation (once an hour).
|
-
Activities: The most impactful activity tag displays. To lower the risk, remove all potential insecure network activities.
-
Vulnerabilities: Click the See details link for more information about how to patch the vulnerabilities and so reduce the device risk score.
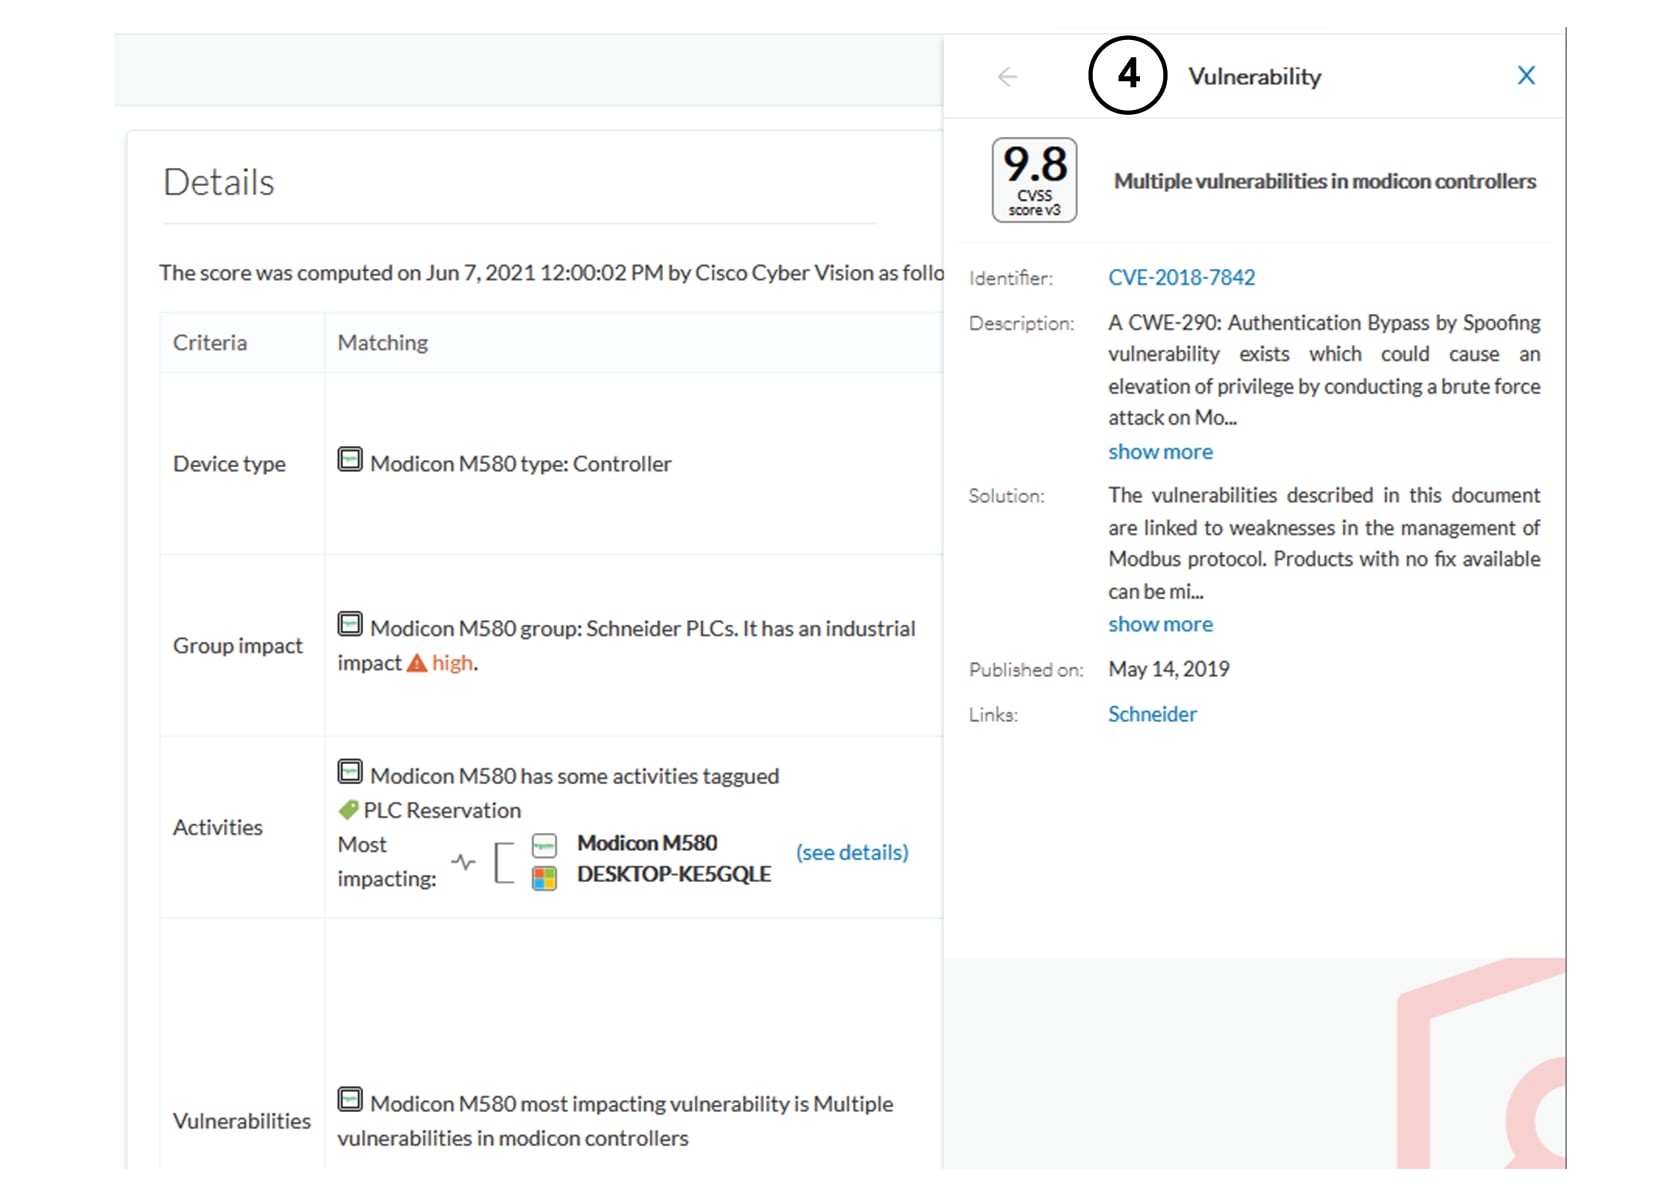
By taking these actions, the risk score should decrease considerably.


 Feedback