- About this Guide
- Chapter 1, Install Shelf and Common Control Cards
- Chapter 2, Connect the PC and Log Into the GUI
- Chapter 3, Turn Up a Node
- Chapter 4, Perform Acceptance Tests
- Chapter 5, Turn Up a Network
- Chapter 6, Provision Channels and Circuits
- Chapter 7, Manage Alarms
- Chapter 8, Monitor Performance
- Chapter 9, Manage Node Settings
- Chapter 10, Change Card Settings
- Chapter 11, Maintain the Node
- Chapter 12, Power Down the Node
- Chapter 13, Shelf Hardware Reference
- Chapter 14, Card Reference
- Chapter 15, Node Reference
- Chapter 16, Network Reference
- Chapter 17, CTC Operation Reference
- Chapter 18, Security and Timing Reference
- Chapter 19, Network Connectivity Reference
- Chapter 20, Alarm Management Reference
- Appendix A, CTC Information and Shortcuts
- Appendix B, Shelf Specifications
- Appendix C, DWDM Extended State Model
- Before You Begin
- NTP-G73 Change the PM Display
- DLP-G131 Refresh PM Counts at 15-Minute Intervals
- DLP-G132 Refresh PM Counts at One-Day Intervals
- DLP-G133 View Near-End PM Counts
- DLP-G134 View Far-End PM Counts
- DLP-G135 Reset Current PM Counts
- DLP-G136 Clear Selected PM Counts
- DLP-G137 Set Auto-Refresh Interval for Displayed PM Counts
- DLP-G138 Refresh PM Counts for a Different Port
- NTP-G74 Monitor DWDM Card Performance
- DLP-G139 View Optical Service Channel PM Parameters
- DLP-G140 View Optical Amplifier PM Parameters
- DLP-G141 View PMs for 32MUX-O, 32-WSS, 32-DMX-O, and 32DMX Cards
- DLP-G142 View Channel Filter Optical Add/Drop Multiplexer PM Parameters
- DLP-G143 View Band Filter Optical Add/Drop Multiplexer PM Parameters
- NTP-G75 Monitor Transponder and Muxponder Performance
- DLP-G144 Enable/Disable OTN ITU-T G.709 Performance Monitoring
- DLP-G145 Enable/Disable OTN FEC Performance Monitoring
- DLP-G146 View Optics PM Parameters
- DLP-G147 View Payload PM Parameters
- DLP-G148 View OTN PM Parameters
- DLP-G149 View Payload Statistics PM Parameters
- DLP-G150 View Payload Utilization PM Parameters
- DLP-G151 View Payload History PM Parameters
- DLP-G152 View Payload SONET PM Parameters
- DLP-G153 Create RMON Alarm Thresholds
- DLP-G154 Delete RMON Alarm Thresholds
Monitor Performance
This chapter explains how to enable and view performance monitoring statistics for the Cisco ONS 15454. Performance monitoring (PM) parameters are used by service providers to gather, store, and set thresholds and report performance data for early detection of problems. For more PM information, details, and definitions, refer to the Cisco ONS 15454 SONET and DWDM Troubleshooting Guide.

Note ![]() Unless otherwise specified, "ONS 15454" refers to both ANSI and ETSI shelf assemblies.
Unless otherwise specified, "ONS 15454" refers to both ANSI and ETSI shelf assemblies.
Before You Begin
Before performing any of the following procedures, investigate all alarms and clear any trouble conditions. Refer to the Cisco ONS 15454 SONET and DWDM Troubleshooting Guide as necessary.
This section lists the chapter procedures (NTPs). Turn to a procedure for applicable tasks (DLPs).
1. ![]() G73 Change the PM Display—Complete as needed to change the displayed PM counts.
G73 Change the PM Display—Complete as needed to change the displayed PM counts.
2. ![]() G74 Monitor DWDM Card Performance—Complete as needed to monitor dense wavelength division multiplexing (DWDM) performance.
G74 Monitor DWDM Card Performance—Complete as needed to monitor dense wavelength division multiplexing (DWDM) performance.
3. ![]() G75 Monitor Transponder and Muxponder Performance—Complete as needed to monitor multirate transport performance.
G75 Monitor Transponder and Muxponder Performance—Complete as needed to monitor multirate transport performance.

Note ![]() For additional information regarding PM parameters, refer to Telcordia's GR-1230-CORE, GR-499-CORE, and GR-253-CORE documents and GR-820-CORE document titled Generic Digital Transmission Surveillance, and in the ANSI T1.231 document entitled Digital Hierarchy - Layer 1 In-Service Digital Transmission Performance Monitoring.
For additional information regarding PM parameters, refer to Telcordia's GR-1230-CORE, GR-499-CORE, and GR-253-CORE documents and GR-820-CORE document titled Generic Digital Transmission Surveillance, and in the ANSI T1.231 document entitled Digital Hierarchy - Layer 1 In-Service Digital Transmission Performance Monitoring.
NTP-G73 Change the PM Display
Purpose |
This procedure enables you to change the display of PM counts by selecting drop-down list or radio button options in the Performance window. |
Tools/Equipment |
None |
Prerequisite Procedures |
Before you monitor performance, be sure you have created the appropriate circuits and provisioned the card according to your specifications. For more information, see Chapter 6, "Create Channels and Circuits" and Chapter 10, "Change Card Settings." |
Required/As Needed |
As needed |
Onsite/Remote |
Onsite or remote |
Security Level |
Retrieve or higher |
Step 1 ![]() Complete the "DLP-G46 Log into CTC" task on page 2-25 at the node that you want to monitor. If you are already logged in, continue with Step 2.
Complete the "DLP-G46 Log into CTC" task on page 2-25 at the node that you want to monitor. If you are already logged in, continue with Step 2.
Step 2 ![]() In node view, double-click the DWDM or multirate card where you want to view PM counts. The card view appears.
In node view, double-click the DWDM or multirate card where you want to view PM counts. The card view appears.
Step 3 ![]() As needed, use the following tasks to change the display of PM counts:
As needed, use the following tasks to change the display of PM counts:
•![]() G131 Refresh PM Counts at 15-Minute Intervals
G131 Refresh PM Counts at 15-Minute Intervals
•![]() G132 Refresh PM Counts at One-Day Intervals
G132 Refresh PM Counts at One-Day Intervals
•![]() G136 Clear Selected PM Counts
G136 Clear Selected PM Counts
•![]() G137 Set Auto-Refresh Interval for Displayed PM Counts
G137 Set Auto-Refresh Interval for Displayed PM Counts
•![]() G138 Refresh PM Counts for a Different Port
G138 Refresh PM Counts for a Different Port
Stop. You have completed this procedure.
DLP-G131 Refresh PM Counts at 15-Minute Intervals
Step 1 ![]() In node view, double-click the card where you want to view PM counts. The card view appears.
In node view, double-click the card where you want to view PM counts. The card view appears.
Step 2 ![]() Click the Performance tab.
Click the Performance tab.
Step 3 ![]() Click the 15 min radio button.
Click the 15 min radio button.
Step 4 ![]() Click Refresh. Performance monitoring parameters appear in 15-minute intervals synchronized with the time of day.
Click Refresh. Performance monitoring parameters appear in 15-minute intervals synchronized with the time of day.
Step 5 ![]() View the Curr column to find PM counts for the current 15-minute interval.
View the Curr column to find PM counts for the current 15-minute interval.
Each monitored performance parameter has corresponding threshold values for the current time period. If the value of the counter exceeds the threshold value for a particular 15-minute interval, a threshold crossing alert (TCA) is raised. The number represents the counter value for each specific performance monitoring parameter.
Step 6 ![]() View the Prev-n columns to find PM counts for the previous 15-minute intervals.
View the Prev-n columns to find PM counts for the previous 15-minute intervals.

Note ![]() If a complete 15-minute interval count is not possible, the value appears with a yellow background. An incomplete or incorrect count can be caused by monitoring for less than 15 minutes after the counter started, changing the node timing settings, changing the time zone settings, replacing a card, resetting a card, or changing port service states. When the problem is corrected, the subsequent 15-minute interval appears with a white background.
If a complete 15-minute interval count is not possible, the value appears with a yellow background. An incomplete or incorrect count can be caused by monitoring for less than 15 minutes after the counter started, changing the node timing settings, changing the time zone settings, replacing a card, resetting a card, or changing port service states. When the problem is corrected, the subsequent 15-minute interval appears with a white background.
Step 7 ![]() Return to your originating procedure (NTP).
Return to your originating procedure (NTP).
DLP-G132 Refresh PM Counts at One-Day Intervals
Step 1 ![]() In node view, double-click the card where you want to view PM counts. The card view appears.
In node view, double-click the card where you want to view PM counts. The card view appears.
Step 2 ![]() Click the Performance tab.
Click the Performance tab.
Step 3 ![]() Click the 1 day radio button.
Click the 1 day radio button.
Step 4 ![]() Click Refresh. Performance monitoring appears in 1-day intervals synchronized with the time of day.
Click Refresh. Performance monitoring appears in 1-day intervals synchronized with the time of day.
Step 5 ![]() View the Curr column to find PM counts for the current 1-day interval.
View the Curr column to find PM counts for the current 1-day interval.
Each monitored performance parameter has corresponding threshold values for the current time period. If the value of the counter exceeds the threshold value for a particular 1-day interval, a TCA is raised. The number represents the counter value for each specific performance monitoring parameter.
Step 6 ![]() View the Prev-n columns to find PM counts for the previous 1-day intervals.
View the Prev-n columns to find PM counts for the previous 1-day intervals.

Note ![]() If a complete count over a 1-day interval is not possible, the value appears with a yellow background. An incomplete or incorrect count can be caused by monitoring for less than 24 hours after the counter started, changing node timing settings, changing the time zone settings, replacing a card, resetting a card, or changing port service states. When the problem is corrected, the subsequent 1-day interval appears with a white background.
If a complete count over a 1-day interval is not possible, the value appears with a yellow background. An incomplete or incorrect count can be caused by monitoring for less than 24 hours after the counter started, changing node timing settings, changing the time zone settings, replacing a card, resetting a card, or changing port service states. When the problem is corrected, the subsequent 1-day interval appears with a white background.
Step 7 ![]() Return to your originating procedure (NTP).
Return to your originating procedure (NTP).
DLP-G133 View Near-End PM Counts
Step 1 ![]() In node view, double-click the card where you want to view PM counts. The card view appears.
In node view, double-click the card where you want to view PM counts. The card view appears.
Step 2 ![]() Click the Performance tab.
Click the Performance tab.
Step 3 ![]() Click the Near End radio button.
Click the Near End radio button.
Step 4 ![]() Click Refresh. All PM parameters occurring for the selected card on the incoming signal appear. For PM parameter definitions, refer to the Cisco ONS 15454 SONET and DWDM Troubleshooting Guide.
Click Refresh. All PM parameters occurring for the selected card on the incoming signal appear. For PM parameter definitions, refer to the Cisco ONS 15454 SONET and DWDM Troubleshooting Guide.
Step 5 ![]() View the Curr column to find PM counts for the current time interval.
View the Curr column to find PM counts for the current time interval.
Step 6 ![]() View the Prev-n columns to find PM counts for the previous time intervals.
View the Prev-n columns to find PM counts for the previous time intervals.
Step 7 ![]() Return to your originating procedure (NTP).
Return to your originating procedure (NTP).
DLP-G134 View Far-End PM Counts
Step 1 ![]() In node view, double-click the card where you want to view PM counts. The card view appears.
In node view, double-click the card where you want to view PM counts. The card view appears.
Step 2 ![]() Click the Performance tab.
Click the Performance tab.
Step 3 ![]() Click the Far End radio button.
Click the Far End radio button.
Step 4 ![]() Click Refresh. All PM parameters recorded by the far-end node for the selected card on the outgoing signal appear. For PM parameter definitions, refer to the Cisco ONS 15454 SONET and DWDM Troubleshooting Guide.
Click Refresh. All PM parameters recorded by the far-end node for the selected card on the outgoing signal appear. For PM parameter definitions, refer to the Cisco ONS 15454 SONET and DWDM Troubleshooting Guide.
Step 5 ![]() View the Curr column to find PM counts for the current time interval.
View the Curr column to find PM counts for the current time interval.
Step 6 ![]() View the Prev-n columns to find PM counts for the previous time intervals.
View the Prev-n columns to find PM counts for the previous time intervals.
Step 7 ![]() Return to your originating procedure (NTP).
Return to your originating procedure (NTP).
DLP-G135 Reset Current PM Counts
Step 1 ![]() In node view, double-click the card where you want to view PM counts. The card view appears.
In node view, double-click the card where you want to view PM counts. The card view appears.
Step 2 ![]() Click the Performance tab.
Click the Performance tab.
Step 3 ![]() Click Baseline.
Click Baseline.

Note ![]() The Baseline button clears the PM counts displayed in the current time interval but does not clear the PM counts on the card. When the current time interval expires or the window view changes, the total number of PM counts on the card and on the window appears in the appropriate column. The baseline values are discarded if you change views to a different window and then return to the Performance window.
The Baseline button clears the PM counts displayed in the current time interval but does not clear the PM counts on the card. When the current time interval expires or the window view changes, the total number of PM counts on the card and on the window appears in the appropriate column. The baseline values are discarded if you change views to a different window and then return to the Performance window.
Step 4 ![]() View the current statistics columns to observe changes to PM counts for the current time interval.
View the current statistics columns to observe changes to PM counts for the current time interval.
Step 5 ![]() Return to your originating procedure (NTP).
Return to your originating procedure (NTP).
DLP-G136 Clear Selected PM Counts

Step 1 ![]() In node view, double-click the card where you want to view PM counts. The card view appears.
In node view, double-click the card where you want to view PM counts. The card view appears.
Step 2 ![]() Click the Performance tab.
Click the Performance tab.
Step 3 ![]() Click Clear.
Click Clear.
Step 4 ![]() From the Clear Statistics dialog box, click one of the following radio buttons:
From the Clear Statistics dialog box, click one of the following radio buttons:
•![]() Displayed statistics: Clearing displayed statistics erases all PM counts associated with the current combination of statistics on the selected port from the card and the window. This means that the selected time interval, direction, and signal type counts are erased from the card and the window.
Displayed statistics: Clearing displayed statistics erases all PM counts associated with the current combination of statistics on the selected port from the card and the window. This means that the selected time interval, direction, and signal type counts are erased from the card and the window.
•![]() All statistics for port x: Clearing all statistics for port x erases all PM counts associated with all combinations of the statistics on the selected port from the card and the window. This means that all time intervals, directions, and signal type counts are erased from the card and the window.
All statistics for port x: Clearing all statistics for port x erases all PM counts associated with all combinations of the statistics on the selected port from the card and the window. This means that all time intervals, directions, and signal type counts are erased from the card and the window.
•![]() All statistics for card: Clearing all statistics for card erases all PM counts for all ports from the card and the window.
All statistics for card: Clearing all statistics for card erases all PM counts for all ports from the card and the window.
Step 5 ![]() From the Clear Statistics dialog box, click OK to clear the selected statistics.
From the Clear Statistics dialog box, click OK to clear the selected statistics.
Step 6 ![]() Verify that the selected PM counts have been cleared.
Verify that the selected PM counts have been cleared.
Step 7 ![]() Return to your originating procedure (NTP).
Return to your originating procedure (NTP).
DLP-G137 Set Auto-Refresh Interval for Displayed PM Counts
Step 1 ![]() In node view, double-click the card where you want to view PM counts. The card view appears.
In node view, double-click the card where you want to view PM counts. The card view appears.
Step 2 ![]() Click the Performance tab.
Click the Performance tab.
Step 3 ![]() From the Auto-refresh drop-down list, choose one of the following options:
From the Auto-refresh drop-down list, choose one of the following options:
•![]() None: This option disables the auto-refresh feature.
None: This option disables the auto-refresh feature.
•![]() 15 Seconds: This option sets the window auto-refresh to 15-second time intervals.
15 Seconds: This option sets the window auto-refresh to 15-second time intervals.
•![]() 30 Seconds: This option sets the window auto-refresh to 30-second time intervals.
30 Seconds: This option sets the window auto-refresh to 30-second time intervals.
•![]() 1 Minute: This option sets the window auto-refresh to 1-minute time intervals.
1 Minute: This option sets the window auto-refresh to 1-minute time intervals.
•![]() 3 Minutes: This option sets the window auto-refresh to 3-minute time intervals.
3 Minutes: This option sets the window auto-refresh to 3-minute time intervals.
•![]() 5 Minutes: This option sets the window auto-refresh to 5-minute time intervals.
5 Minutes: This option sets the window auto-refresh to 5-minute time intervals.
Step 4 ![]() Click Refresh. The PM counts for the newly selected auto-refresh time interval appear.
Click Refresh. The PM counts for the newly selected auto-refresh time interval appear.
Depending on the selected auto-refresh interval, the displayed PM counts automatically update when each refresh interval completes. If the auto-refresh interval is set to None, the PM counts that appear are not updated unless you click Refresh.
Step 5 ![]() Return to your originating procedure (NTP).
Return to your originating procedure (NTP).
DLP-G138 Refresh PM Counts for a Different Port
Step 1 ![]() In node view, double-click the card where you want to view PM counts. The card view appears.
In node view, double-click the card where you want to view PM counts. The card view appears.
Step 2 ![]() Click the Performance tab.
Click the Performance tab.
Step 3 ![]() In the Port drop-down list, choose a port.
In the Port drop-down list, choose a port.
Step 4 ![]() Click Refresh. The PM counts for the newly selected port appear.
Click Refresh. The PM counts for the newly selected port appear.
Step 5 ![]() Return to your originating procedure (NTP).
Return to your originating procedure (NTP).
NTP-G74 Monitor DWDM Card Performance
Purpose |
This procedure enables you to view, transmit, and receive performance information about an Optical Service Channel, Multiplexer/Demultiplexer, Amplifier, and OADM card and port during selected time intervals to detect possible performance problems. |
Tools/Equipment |
None |
Prerequisite Procedures |
Before you monitor performance, be sure you have created the appropriate circuits and provisioned the card according to your specifications. For more information, see Chapter 6, "Create Channels and Circuits" and Chapter 10, "Change Card Settings." |
Required/As Needed |
As needed |
Onsite/Remote |
Onsite or remote |
Security Level |
Retrieve or higher |
Step 1 ![]() Complete the "DLP-G46 Log into CTC" procedure on page 2-25 at the node that you want to monitor. If you are already logged in, continue with Step 2.
Complete the "DLP-G46 Log into CTC" procedure on page 2-25 at the node that you want to monitor. If you are already logged in, continue with Step 2.
Step 2 ![]() Complete the following tasks as needed:
Complete the following tasks as needed:
•![]() G139 View Optical Service Channel PM Parameters.
G139 View Optical Service Channel PM Parameters.
•![]() G140 View Optical Amplifier PM Parameters.
G140 View Optical Amplifier PM Parameters.
•![]() G141 View PMs for 32MUX-O, 32-WSS, 32-DMX-O, and 32DMX Cards.
G141 View PMs for 32MUX-O, 32-WSS, 32-DMX-O, and 32DMX Cards.
•![]() G142 View Channel Filter Optical Add/Drop Multiplexer PM Parameters.
G142 View Channel Filter Optical Add/Drop Multiplexer PM Parameters.
•![]() G143 View Band Filter Optical Add/Drop Multiplexer PM Parameters.
G143 View Band Filter Optical Add/Drop Multiplexer PM Parameters.

Note ![]() To refresh, reset, or clear PM counts, see the "G73 Change the PM Display" procedure.
To refresh, reset, or clear PM counts, see the "G73 Change the PM Display" procedure.
Stop. You have completed this procedure.
DLP-G139 View Optical Service Channel PM Parameters
Step 1 ![]() In node view, double-click the OSCM or OSC-CSM card where you want to view PM counts. The card view appears.
In node view, double-click the OSCM or OSC-CSM card where you want to view PM counts. The card view appears.
Step 2 ![]() Click the Performance > OC3 Line tabs (Figure 8-1).
Click the Performance > OC3 Line tabs (Figure 8-1).
Figure 8-1 OC3 Line Tab in the Optical Service Channel Card View Performance Window
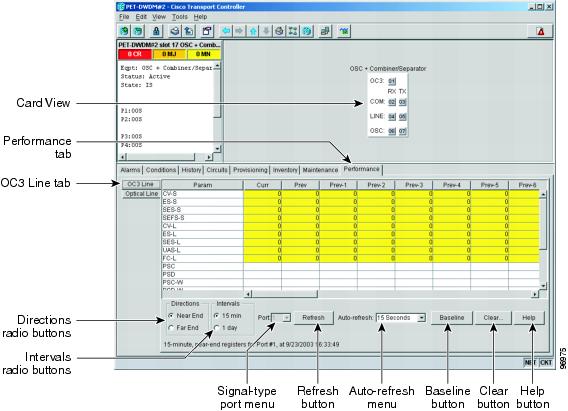
Step 3 ![]() Click Refresh. OC3 line performance monitoring statistics for the selected port appear.
Click Refresh. OC3 line performance monitoring statistics for the selected port appear.
Step 4 ![]() Click the Optical Line tab.
Click the Optical Line tab.
Step 5 ![]() Click Refresh. Optical line performance monitoring statistics for the selected port appear.
Click Refresh. Optical line performance monitoring statistics for the selected port appear.
Step 6 ![]() Return to your originating procedure (NTP).
Return to your originating procedure (NTP).
DLP-G140 View Optical Amplifier PM Parameters
Step 1 ![]() In node view, double-click the optical amplifier card where you want to view PM counts. The card view appears.
In node view, double-click the optical amplifier card where you want to view PM counts. The card view appears.
Step 2 ![]() Click the Performance > Optical Line tabs (Figure 8-2).
Click the Performance > Optical Line tabs (Figure 8-2).
Figure 8-2 Optical Line Tab in the Optical Amplifier Card View Performance Window
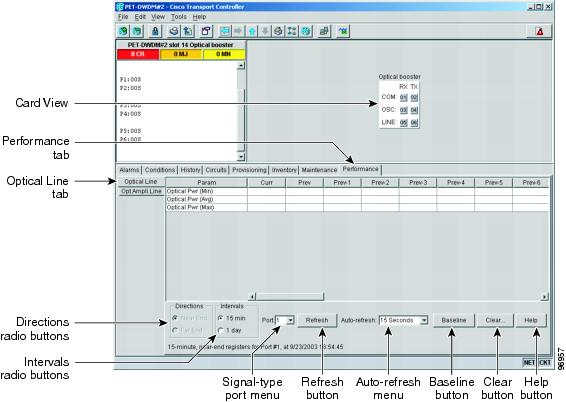
Step 3 ![]() Click Refresh. Optical line performance monitoring statistics for the selected port appear.
Click Refresh. Optical line performance monitoring statistics for the selected port appear.
Step 4 ![]() Click the Opt. Ampli. Line tab.
Click the Opt. Ampli. Line tab.
Step 5 ![]() Click Refresh. Optical amplifier line performance monitoring statistics for the selected port appear.
Click Refresh. Optical amplifier line performance monitoring statistics for the selected port appear.
Step 6 ![]() Return to your originating procedure (NTP).
Return to your originating procedure (NTP).
DLP-G141 View PMs for 32MUX-O, 32-WSS, 32-DMX-O, and 32DMX Cards
Step 1 ![]() In node view, double-click the 32MUX-O, 32-WSS, 32-DMX-O, or 32DMX card where you want to view PM counts. The card view appears.
In node view, double-click the 32MUX-O, 32-WSS, 32-DMX-O, or 32DMX card where you want to view PM counts. The card view appears.
Step 2 ![]() Click the Performance > Optical Chn tabs (Figure 8-3).
Click the Performance > Optical Chn tabs (Figure 8-3).
Figure 8-3 Optical Channel Tab in the Multiplexer/Demultiplexer Card View Performance Window
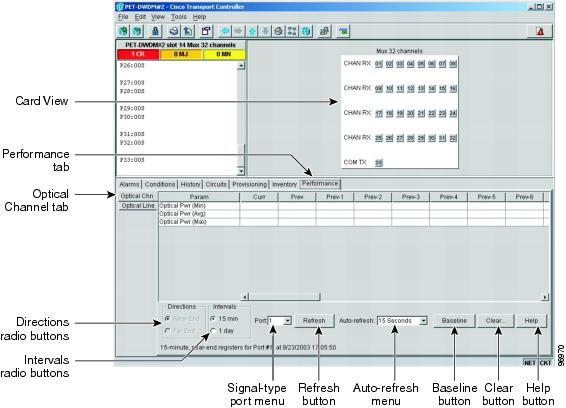
Step 3 ![]() Click Refresh. Optical channel performance monitoring statistics for the selected port appear.
Click Refresh. Optical channel performance monitoring statistics for the selected port appear.
Step 4 ![]() Click the Optical Line tab.
Click the Optical Line tab.
Step 5 ![]() Click Refresh. Optical line performance monitoring statistics for the selected port appear.
Click Refresh. Optical line performance monitoring statistics for the selected port appear.
Step 6 ![]() Return to your originating procedure (NTP).
Return to your originating procedure (NTP).
DLP-G142 View Channel Filter Optical Add/Drop Multiplexer PM Parameters
Step 1 ![]() In node view, double-click the optical AD-xC-xx.x card where you want to view PM counts. The card view appears.
In node view, double-click the optical AD-xC-xx.x card where you want to view PM counts. The card view appears.
Step 2 ![]() Click the Performance > Optical Line tabs (Figure 8-4).
Click the Performance > Optical Line tabs (Figure 8-4).
Figure 8-4 Optical Line Tab in the Channel Filter OADM Card View Performance Window
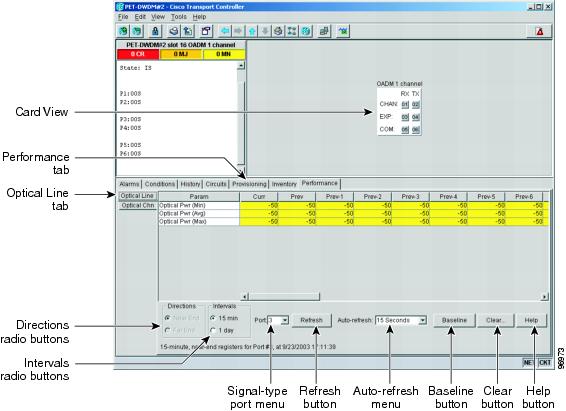
Step 3 ![]() Click Refresh. Optical line performance monitoring statistics for the selected port appear.
Click Refresh. Optical line performance monitoring statistics for the selected port appear.
Step 4 ![]() Click the Optical Chn tab.
Click the Optical Chn tab.
Step 5 ![]() Click Refresh. Optical channel performance monitoring statistics for the selected port appear.
Click Refresh. Optical channel performance monitoring statistics for the selected port appear.
Step 6 ![]() Return to your originating procedure (NTP).
Return to your originating procedure (NTP).
DLP-G143 View Band Filter Optical Add/Drop Multiplexer PM Parameters
Step 1 ![]() In node view, double-click the AD-xB-xx.x or the 4MD-xxx card where you want to view PM counts. The card view appears.
In node view, double-click the AD-xB-xx.x or the 4MD-xxx card where you want to view PM counts. The card view appears.
Step 2 ![]() Click the Performance > Optical Chn tabs (Figure 8-5).
Click the Performance > Optical Chn tabs (Figure 8-5).
Figure 8-5 Optical Channel Tab in the Band Filter OADM Card View Performance Window
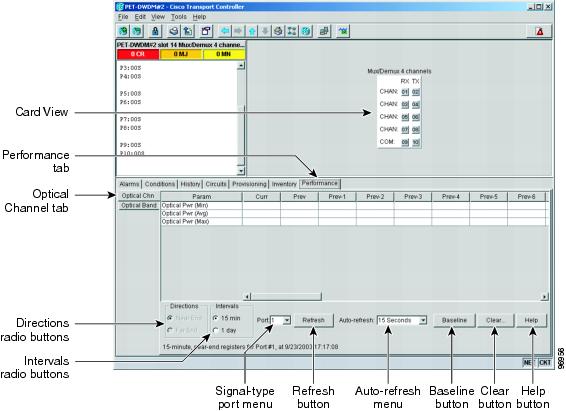
Step 3 ![]() Click Refresh. Optical channel performance monitoring statistics for the selected port appear.
Click Refresh. Optical channel performance monitoring statistics for the selected port appear.
Step 4 ![]() Click the Optical Band tab.
Click the Optical Band tab.
Step 5 ![]() Click Refresh. Optical band performance monitoring statistics for the selected port appear.
Click Refresh. Optical band performance monitoring statistics for the selected port appear.
Step 6 ![]() Return to your originating procedure (NTP).
Return to your originating procedure (NTP).
NTP-G75 Monitor Transponder and Muxponder Performance
Purpose |
This procedure enables you to view node near-end or far-end performance during selected time intervals on a transponder (TXP_MR_10G, TXP_MR_2.5G, TXPP_MR_2.5G, TXP_MR_10E), or a muxponder (MXP_2.5G_10E, MXP_MR_2.5G, MXPP_MR_2.5G, MXP_2.5G_10G) card and port to detect possible performance problems. |
Tools/Equipment |
None |
Prerequisite Procedures |
Before you monitor performance, be sure you have created the appropriate circuits and provisioned the card according to your specifications. For more information, see Chapter 6, "Create Channels and Circuits" and Chapter 10, "Change Card Settings." |
Required/As Needed |
As needed |
Onsite/Remote |
Onsite or remote |
Security Level |
Retrieve or higher |
Step 1 ![]() Complete the "DLP-G46 Log into CTC" task on page 2-25 at the node that you want to monitor. If you are already logged in, continue with Step 2.
Complete the "DLP-G46 Log into CTC" task on page 2-25 at the node that you want to monitor. If you are already logged in, continue with Step 2.
Step 2 ![]() Complete the "DLP-G144 Enable/Disable OTN ITU-T G.709 Performance Monitoring" task as needed to enable or disable optical transport network (OTN) ITU-T G.709 monitoring.
Complete the "DLP-G144 Enable/Disable OTN ITU-T G.709 Performance Monitoring" task as needed to enable or disable optical transport network (OTN) ITU-T G.709 monitoring.
Step 3 ![]() Complete the "DLP-G145 Enable/Disable OTN FEC Performance Monitoring" task as needed to enable or disable OTN forward error correction (FEC) monitoring.
Complete the "DLP-G145 Enable/Disable OTN FEC Performance Monitoring" task as needed to enable or disable OTN forward error correction (FEC) monitoring.
Step 4 ![]() Complete the following tasks as needed to view PM parameters:
Complete the following tasks as needed to view PM parameters:
•![]() G146 View Optics PM Parameters.
G146 View Optics PM Parameters.
•![]() G147 View Payload PM Parameters.
G147 View Payload PM Parameters.
•![]() G149 View Payload Statistics PM Parameters.
G149 View Payload Statistics PM Parameters.
•![]() G150 View Payload Utilization PM Parameters.
G150 View Payload Utilization PM Parameters.
•![]() G151 View Payload History PM Parameters.
G151 View Payload History PM Parameters.
•![]() G152 View Payload SONET PM Parameters.
G152 View Payload SONET PM Parameters.
•![]() G153 Create RMON Alarm Thresholds.
G153 Create RMON Alarm Thresholds.
•![]() G154 Delete RMON Alarm Thresholds.
G154 Delete RMON Alarm Thresholds.

Note ![]() To refresh, reset, or clear PM counts, see the "NTP-G73 Change the PM Display" task.
To refresh, reset, or clear PM counts, see the "NTP-G73 Change the PM Display" task.
Stop. You have completed this procedure.
DLP-G144 Enable/Disable OTN ITU-T G.709 Performance Monitoring
Step 1 ![]() In node view, double-click the card you want to monitor. The card view appears.
In node view, double-click the card you want to monitor. The card view appears.
Step 2 ![]() Click the Provisioning > OTN > OTN Lines tabs (Figure 8-6).
Click the Provisioning > OTN > OTN Lines tabs (Figure 8-6).
Figure 8-6 OTN Lines Tab for Enabling/Disabling OTN ITU-T G.709 Performance Monitoring
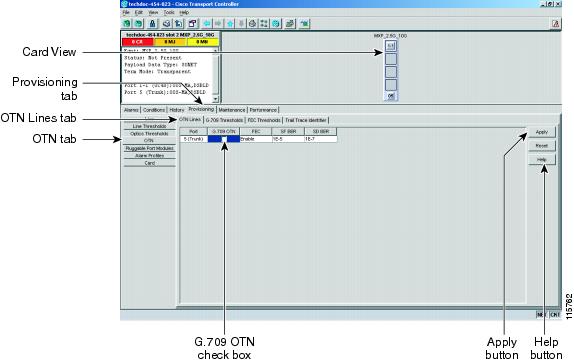
Step 3 ![]() Make an ITU-T G.709 selection based on the following rules:
Make an ITU-T G.709 selection based on the following rules:
•![]() Unchecked disables ITU-T G.709 for that port (default).
Unchecked disables ITU-T G.709 for that port (default).
•![]() Checked enables ITU-T G.709 for that port.
Checked enables ITU-T G.709 for that port.
Step 4 ![]() Click Apply.
Click Apply.
Step 5 ![]() Click the Performance tab to view PM parameters. For PM parameter definitions, refer to the Cisco ONS 15454 SONET and DWDM Troubleshooting Guide.
Click the Performance tab to view PM parameters. For PM parameter definitions, refer to the Cisco ONS 15454 SONET and DWDM Troubleshooting Guide.
Step 6 ![]() Return to your originating procedure (NTP).
Return to your originating procedure (NTP).
DLP-G145 Enable/Disable OTN FEC Performance Monitoring
Step 1 ![]() In node view, double-click the card you want to monitor. The card view appears.
In node view, double-click the card you want to monitor. The card view appears.
Step 2 ![]() Click the Provisioning > OTN > OTN Lines tabs (Figure 8-7).
Click the Provisioning > OTN > OTN Lines tabs (Figure 8-7).
Figure 8-7 OTN Lines Tab for Enabling/Disabling OTN FEC Performance Monitoring for TXP_MR_10E Cards
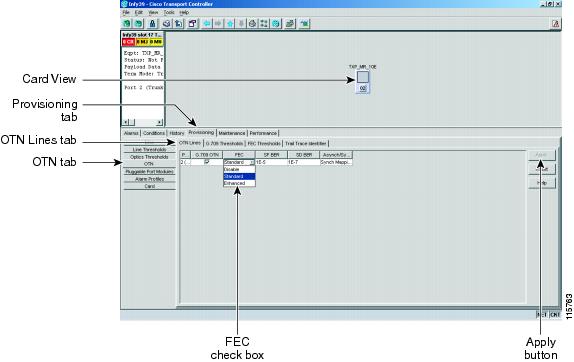
Step 3 ![]() Make an FEC selection based on the following rules:
Make an FEC selection based on the following rules:
•![]() Choose Disable to disable the OTN FEC monitoring.
Choose Disable to disable the OTN FEC monitoring.
•![]() Choose Standard to enable standard FEC monitoring for that port (default).
Choose Standard to enable standard FEC monitoring for that port (default).
•![]() Choose Enhanced to enable enhanced FEC monitoring for that port.
Choose Enhanced to enable enhanced FEC monitoring for that port.

Note ![]() For TXP_MR_10E and MXP_MR_10E cards the FEC selection options available are Disable, Standard, and Enhanced. For all the remaining transponder and muxponder cards the options available are Enable and Disable.
For TXP_MR_10E and MXP_MR_10E cards the FEC selection options available are Disable, Standard, and Enhanced. For all the remaining transponder and muxponder cards the options available are Enable and Disable.
Step 4 ![]() Click Apply.
Click Apply.
Step 5 ![]() Click the Performance tab to view PM parameters. For PM parameter definitions, refer to the Cisco ONS 15454 SONET and DWDM Troubleshooting Guide.
Click the Performance tab to view PM parameters. For PM parameter definitions, refer to the Cisco ONS 15454 SONET and DWDM Troubleshooting Guide.
Step 6 ![]() Return to your originating procedure (NTP).
Return to your originating procedure (NTP).
DLP-G146 View Optics PM Parameters
Step 1 ![]() In node view, double-click the transponder or muxponder card where you want to view PM counts. The card view appears.
In node view, double-click the transponder or muxponder card where you want to view PM counts. The card view appears.
Step 2 ![]() Click the Performance > Optics PM tabs (Figure 8-8).
Click the Performance > Optics PM tabs (Figure 8-8).
Figure 8-8 Viewing Optics Performance Monitoring Information
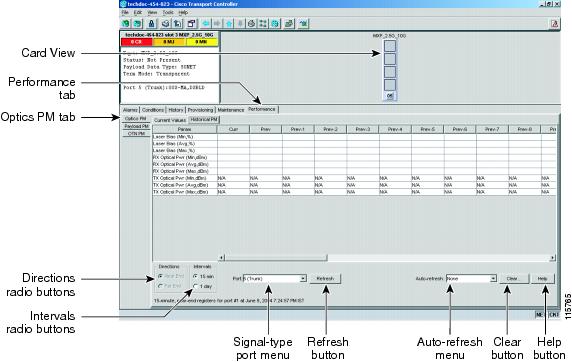
Step 3 ![]() View the PM parameter names that appear in the Param column of Current Values and History PM tabs. The PM parameter values appear in the Curr (current) and Prev-n (previous) columns. For PM parameter definitions, refer to the Cisco ONS 15454 SONET and DWDM Troubleshooting Guide.
View the PM parameter names that appear in the Param column of Current Values and History PM tabs. The PM parameter values appear in the Curr (current) and Prev-n (previous) columns. For PM parameter definitions, refer to the Cisco ONS 15454 SONET and DWDM Troubleshooting Guide.
Step 4 ![]() Return to your originating procedure (NTP).
Return to your originating procedure (NTP).
DLP-G147 View Payload PM Parameters
Step 1 ![]() In node view, double-click the transponder or muxponder card where you want to view PM counts. The card view appears.
In node view, double-click the transponder or muxponder card where you want to view PM counts. The card view appears.
Step 2 ![]() Click the Performance > Payload PM tabs (Figure 8-9).
Click the Performance > Payload PM tabs (Figure 8-9).
Figure 8-9 Viewing Payload Performance Monitoring Information
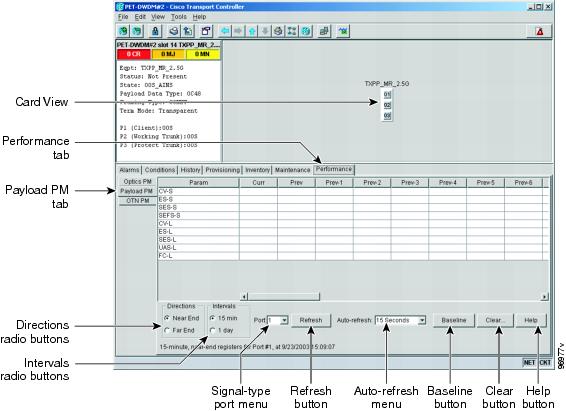
Step 3 ![]() View the PM parameter names that appear in the Param column of Current Values and History PM tabs The PM parameter values appear in the Curr (current), and Prev-n (previous) columns. For PM parameter definitions, refer to the Cisco ONS 15454 SONET and DWDM Troubleshooting Guide.
View the PM parameter names that appear in the Param column of Current Values and History PM tabs The PM parameter values appear in the Curr (current), and Prev-n (previous) columns. For PM parameter definitions, refer to the Cisco ONS 15454 SONET and DWDM Troubleshooting Guide.

Note ![]() The Payload PMs for data parameters can be viewed only after creating a pluggable port module.
The Payload PMs for data parameters can be viewed only after creating a pluggable port module.

Note ![]() The PM parameters that appear depend on the data payload and framing type provisioned on the port. Unframed data payloads such as Enterprise System Connection (ESCON), DV6000, DSI/D1 video, and HDTV do not provide payload performance monitoring information. The PM parameters that appear also depend on the PPM payload configured. The TXP_MR_10E card supports three payloads, MXP_2.5G_10G and MXP_2.5G_10E cards support OC48/STM16 payload, MXP_MR_2.5G and MXPP_MR_2.5G support 1G FC, 2G FC, 1G FICON, 2G FICON, and 1GE payloads.
The PM parameters that appear depend on the data payload and framing type provisioned on the port. Unframed data payloads such as Enterprise System Connection (ESCON), DV6000, DSI/D1 video, and HDTV do not provide payload performance monitoring information. The PM parameters that appear also depend on the PPM payload configured. The TXP_MR_10E card supports three payloads, MXP_2.5G_10G and MXP_2.5G_10E cards support OC48/STM16 payload, MXP_MR_2.5G and MXPP_MR_2.5G support 1G FC, 2G FC, 1G FICON, 2G FICON, and 1GE payloads.
Step 4 ![]() Return to your originating procedure (NTP).
Return to your originating procedure (NTP).
DLP-G148 View OTN PM Parameters
Step 1 ![]() In node view, double-click the transponder or muxponder card where you want to view PM counts. The card view appears.
In node view, double-click the transponder or muxponder card where you want to view PM counts. The card view appears.
Step 2 ![]() Click the Performance > OTN PM > G.709 tabs (Figure 8-10).
Click the Performance > OTN PM > G.709 tabs (Figure 8-10).
Figure 8-10 Viewing OTN ITU-T G.709 Performance Monitoring Information
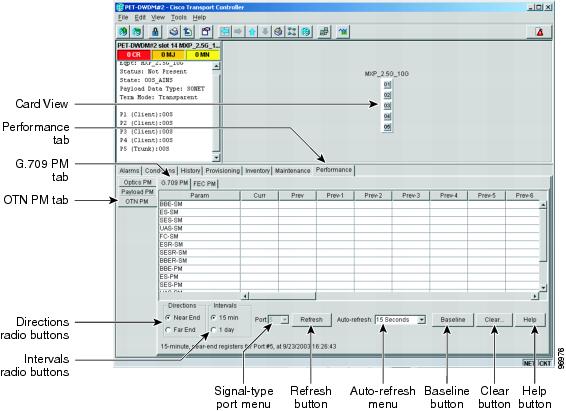
Step 3 ![]() View the PM parameter names that appear in the Param column. The PM parameter values appear in the Curr (current) and Prev-n (previous) columns. For PM parameter definitions, refer to the Cisco ONS 15454 SONET and DWDM Troubleshooting Guide.
View the PM parameter names that appear in the Param column. The PM parameter values appear in the Curr (current) and Prev-n (previous) columns. For PM parameter definitions, refer to the Cisco ONS 15454 SONET and DWDM Troubleshooting Guide.
Step 4 ![]() Click the FEC PM tab (Figure 8-11).
Click the FEC PM tab (Figure 8-11).
Figure 8-11 Viewing OTN FEC Performance Monitoring Information
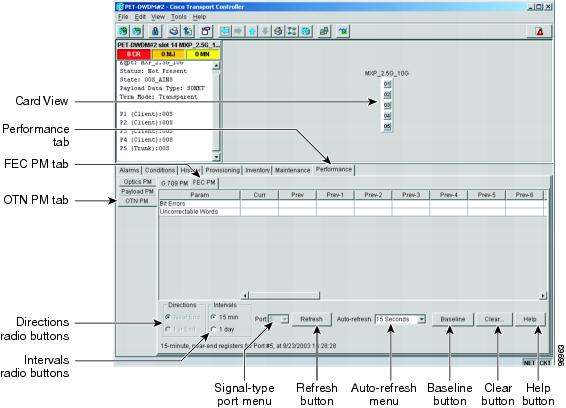
Step 5 ![]() View the PM parameter names that appear in the Param column. The PM parameter values appear in the Curr (current) and Prev-n (previous) columns. For PM parameter definitions, refer to the Cisco ONS 15454 SONET and DWDM Troubleshooting Guide.
View the PM parameter names that appear in the Param column. The PM parameter values appear in the Curr (current) and Prev-n (previous) columns. For PM parameter definitions, refer to the Cisco ONS 15454 SONET and DWDM Troubleshooting Guide.
Step 6 ![]() Return to your originating procedure (NTP).
Return to your originating procedure (NTP).
DLP-G149 View Payload Statistics PM Parameters
Step 1 ![]() In node view, double-click the MXP_MR_2.5G or MXPP_MR_2.5G card where you want to view PM counts. The card view appears.
In node view, double-click the MXP_MR_2.5G or MXPP_MR_2.5G card where you want to view PM counts. The card view appears.
Step 2 ![]() Click the Performance > Payload PM > Statistics tabs (Figure 8-12).
Click the Performance > Payload PM > Statistics tabs (Figure 8-12).
Figure 8-12 Statistics Tab on the Card View Performance Window
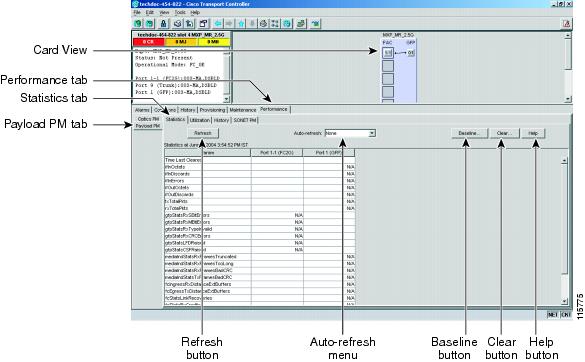
Step 3 ![]() Click Refresh. Performance monitoring statistics appear for each port on the card.
Click Refresh. Performance monitoring statistics appear for each port on the card.
Step 4 ![]() View the PM parameter names that appear in the Param column. The current PM parameter values appear in the Port # columns. For PM parameter definitions, refer to the Cisco ONS 15454 SONET and DWDM Troubleshooting Guide.
View the PM parameter names that appear in the Param column. The current PM parameter values appear in the Port # columns. For PM parameter definitions, refer to the Cisco ONS 15454 SONET and DWDM Troubleshooting Guide.

Note ![]() To refresh, reset, or clear PM counts, see the "G73 Change the PM Display" procedure.
To refresh, reset, or clear PM counts, see the "G73 Change the PM Display" procedure.
Step 5 ![]() Return to your originating procedure (NTP).
Return to your originating procedure (NTP).
DLP-G150 View Payload Utilization PM Parameters
Step 1 ![]() In node view, double-click theMXP_MR_2.5G or MXPP_MR_2.5G card where you want to view PM counts. The card view appears.
In node view, double-click theMXP_MR_2.5G or MXPP_MR_2.5G card where you want to view PM counts. The card view appears.
Step 2 ![]() Click the Performance > Payload PM > Utilization tabs (Figure 8-13).
Click the Performance > Payload PM > Utilization tabs (Figure 8-13).
Figure 8-13 Utilization Tab on the Card View Performance Window
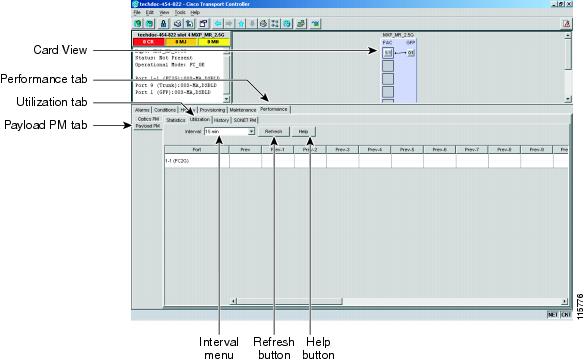
Step 3 ![]() Click Refresh. Performance monitoring utilization values appear for each port on the card.
Click Refresh. Performance monitoring utilization values appear for each port on the card.
Step 4 ![]() View the Port # column to find the port you want to monitor.
View the Port # column to find the port you want to monitor.
Step 5 ![]() The transmit (Tx) and receive (Rx) bandwidth utilization values for the previous time intervals appear in the Prev-n columns. For PM parameter definitions, refer to the Cisco ONS 15454 SONET and DWDM Troubleshooting Guide.
The transmit (Tx) and receive (Rx) bandwidth utilization values for the previous time intervals appear in the Prev-n columns. For PM parameter definitions, refer to the Cisco ONS 15454 SONET and DWDM Troubleshooting Guide.

Note ![]() To refresh, reset, or clear PM counts, see the "G73 Change the PM Display" procedure.
To refresh, reset, or clear PM counts, see the "G73 Change the PM Display" procedure.
Step 6 ![]() Return to your originating procedure (NTP).
Return to your originating procedure (NTP).
DLP-G151 View Payload History PM Parameters
Step 1 ![]() In node view, double-click the MXP_MR_2.5G or MXPP_MR_2.5G card where you want to view PM counts. The card view appears.
In node view, double-click the MXP_MR_2.5G or MXPP_MR_2.5G card where you want to view PM counts. The card view appears.
Step 2 ![]() Click the Performance > Payload PM > History tabs (Figure 8-14).
Click the Performance > Payload PM > History tabs (Figure 8-14).
Figure 8-14 History Tab on the Card View Performance Window
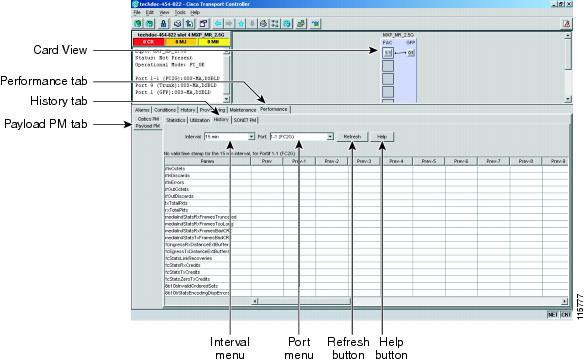
Step 3 ![]() Click Refresh. Performance monitoring statistics appear for each port on the card.
Click Refresh. Performance monitoring statistics appear for each port on the card.
Step 4 ![]() View the PM parameter names that appear in the Param column. The PM parameter values appear in the Prev-n columns. For PM parameter definitions, refer to the Cisco ONS 15454 SONET and DWDM Troubleshooting Guide.
View the PM parameter names that appear in the Param column. The PM parameter values appear in the Prev-n columns. For PM parameter definitions, refer to the Cisco ONS 15454 SONET and DWDM Troubleshooting Guide.

Note ![]() To refresh, reset, or clear PM counts, see the "G73 Change the PM Display" procedure.
To refresh, reset, or clear PM counts, see the "G73 Change the PM Display" procedure.
Step 5 ![]() Return to your originating procedure (NTP).
Return to your originating procedure (NTP).
DLP-G152 View Payload SONET PM Parameters
Step 1 ![]() In node view, double-click the MXP_MR_2.5G or MXPP_MR_2.5G card where you want to view PM counts. The card view appears.
In node view, double-click the MXP_MR_2.5G or MXPP_MR_2.5G card where you want to view PM counts. The card view appears.
Step 2 ![]() Click the Performance > Payload PM > SONET PM tabs (Figure 8-15).
Click the Performance > Payload PM > SONET PM tabs (Figure 8-15).
Figure 8-15 SONET PM Tab on the Card View Performance Window
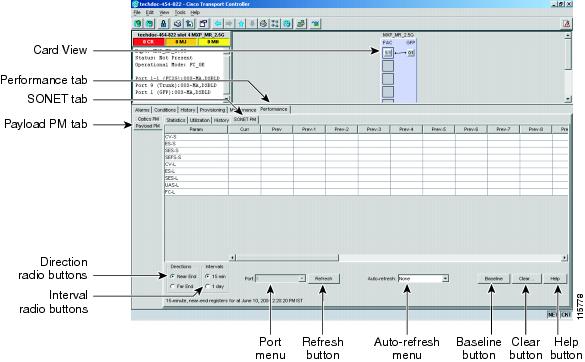
Step 3 ![]() Click Refresh. Performance monitoring statistics appear for each port on the card.
Click Refresh. Performance monitoring statistics appear for each port on the card.
Step 4 ![]() View the PM parameter names that appear in the Param column. The PM parameter values appear in the Prev-n columns. For PM parameter definitions, refer to the Cisco ONS 15454 SONET and DWDM Troubleshooting Guide.
View the PM parameter names that appear in the Param column. The PM parameter values appear in the Prev-n columns. For PM parameter definitions, refer to the Cisco ONS 15454 SONET and DWDM Troubleshooting Guide.

Note ![]() The MXP_MR_2.5G and MXPP_MR_2.5G cards support only OC48/STM16 payload. Each payload has a set of PM parameters.
The MXP_MR_2.5G and MXPP_MR_2.5G cards support only OC48/STM16 payload. Each payload has a set of PM parameters.

Note ![]() To refresh, reset, or clear PM counts, see the "G73 Change the PM Display" procedure.
To refresh, reset, or clear PM counts, see the "G73 Change the PM Display" procedure.
Step 5 ![]() Return to your originating procedure (NTP).
Return to your originating procedure (NTP).
DLP-G153 Create RMON Alarm Thresholds
Step 1 ![]() In node view, double-click the card where you want to create the RMON alarm thresholds.
In node view, double-click the card where you want to create the RMON alarm thresholds.
Step 2 ![]() In card view, click the Provisioning > Line Thresholds > RMON Thresholds tabs.
In card view, click the Provisioning > Line Thresholds > RMON Thresholds tabs.
Step 3 ![]() Click Create. The Create Threshold dialog box appears.
Click Create. The Create Threshold dialog box appears.
Step 4 ![]() From the Slot menu, choose the appropriate card.
From the Slot menu, choose the appropriate card.
Step 5 ![]() From the Port drop-down list, choose the applicable port on the card you selected.
From the Port drop-down list, choose the applicable port on the card you selected.
Step 6 ![]() From the Variable drop-down list, choose the variable. See Table 8-1 for a list of the MXP_MR_2.5G/MXPP_MR_2.5G threshold variables available in this field.
From the Variable drop-down list, choose the variable. See Table 8-1 for a list of the MXP_MR_2.5G/MXPP_MR_2.5G threshold variables available in this field.
Step 7 ![]() From the Alarm Type drop-down list, indicate whether the rising threshold, falling threshold, or both the rising and falling thresholds will trigger the event.
From the Alarm Type drop-down list, indicate whether the rising threshold, falling threshold, or both the rising and falling thresholds will trigger the event.
Step 8 ![]() From the Sample Type drop-down list, choose either Relative or Absolute. Relative restricts the threshold to use the number of occurrences in the user-set sample period. Absolute sets the threshold to use the total number of occurrences, regardless of time period.
From the Sample Type drop-down list, choose either Relative or Absolute. Relative restricts the threshold to use the number of occurrences in the user-set sample period. Absolute sets the threshold to use the total number of occurrences, regardless of time period.
Step 9 ![]() Enter the appropriate number of seconds for the Sample Period.
Enter the appropriate number of seconds for the Sample Period.
Step 10 ![]() Enter the appropriate number of occurrences for the Rising Threshold.
Enter the appropriate number of occurrences for the Rising Threshold.

Note ![]() For a rising type of alarm, the measured value must move from below the falling threshold to above the rising threshold. For example, if a network is running below a rising threshold of 1000 collisions every 15 seconds and a problem causes 1001 collisions in 15 seconds, the excess occurrences trigger an alarm.
For a rising type of alarm, the measured value must move from below the falling threshold to above the rising threshold. For example, if a network is running below a rising threshold of 1000 collisions every 15 seconds and a problem causes 1001 collisions in 15 seconds, the excess occurrences trigger an alarm.
Step 11 ![]() Enter the appropriate number of occurrences in the Falling Threshold field. In most cases, a falling threshold is set lower than the rising threshold.
Enter the appropriate number of occurrences in the Falling Threshold field. In most cases, a falling threshold is set lower than the rising threshold.

Note ![]() A falling threshold is the counterpart to a rising threshold. When the number of occurrences is above the rising threshold and then drops below a falling threshold, it resets the rising threshold. For example, when the network problem that caused 1001 collisions in 15 minutes subsides and creates only 799 collisions in 15 minutes, occurrences fall below a falling threshold of 800 collisions. This resets the rising threshold so that if network collisions again spike over a 1000 per 15-minute period, an event again triggers when the rising threshold is crossed. An event is triggered only the first time a rising threshold is exceeded (otherwise, a single network problem might cause a rising threshold to be exceeded multiple times and cause a flood of events).
A falling threshold is the counterpart to a rising threshold. When the number of occurrences is above the rising threshold and then drops below a falling threshold, it resets the rising threshold. For example, when the network problem that caused 1001 collisions in 15 minutes subsides and creates only 799 collisions in 15 minutes, occurrences fall below a falling threshold of 800 collisions. This resets the rising threshold so that if network collisions again spike over a 1000 per 15-minute period, an event again triggers when the rising threshold is crossed. An event is triggered only the first time a rising threshold is exceeded (otherwise, a single network problem might cause a rising threshold to be exceeded multiple times and cause a flood of events).
Step 12 ![]() Click OK to complete the procedure.
Click OK to complete the procedure.
Step 13 ![]() Return to your originating procedure (NTP).
Return to your originating procedure (NTP).
DLP-G154 Delete RMON Alarm Thresholds
Purpose |
This task deletes RMON threshold crossing alarms for Ethernet and Fibre Channel ports. |
Tools/Equipment |
None |
Prerequisite Procedures |
G153 Create RMON Alarm Thresholds |
Required/As Needed |
As needed |
Onsite/Remote |
Onsite or remote |
Security Level |
Provisioning or higher |
Step 1 ![]() In node view, double-click the card where you want to delete the RMON alarm thresholds.
In node view, double-click the card where you want to delete the RMON alarm thresholds.
Step 2 ![]() In card view, click the Provisioning > Line Thresholds > RMON Thresholds tabs.
In card view, click the Provisioning > Line Thresholds > RMON Thresholds tabs.
Step 3 ![]() Click the RMON alarm threshold you want to delete.
Click the RMON alarm threshold you want to delete.
Step 4 ![]() Click Delete. The Delete Threshold dialog box appears.
Click Delete. The Delete Threshold dialog box appears.
Step 5 ![]() Click Yes to delete that threshold.
Click Yes to delete that threshold.
Step 6 ![]() Return to your originating procedure (NTP).
Return to your originating procedure (NTP).
 Feedback