Monitoring IPsec VPN Performance
Available Languages
Table Of Contents
Monitoring IPsec VPN Performance
Setting Up VPN Solutions Center for Collecting Configuration Files
Setting the csm.properties File for Customized Router Prompt
Setting Up the Domain Name Server
Setting Up SNMPv1 and SNMPv2 on the Routers in the Service Provider Network
Setting the SNMPv3 Parameters on the Routers in the Service Provider Network
Setting the Server Group and Server Users Parameters
Updating Router Configuration Files
Updating Configuration Information by Collecting From Targets
Updating Configuration Information by Importing From Files
Collecting Only Changed Configuration Files
Populating Router Interface Information to the Repository
Registering for Changed Configuration File Traps
Deregistering for Changed Configuration File Traps
Monitoring Performance Through Service Level Agreements
About the Service Assurance Agent Feature
Before You Create a Service Level Agreement
Creating a Service Level Agreement
Collecting Data for SLA Monitoring
Collecting Interface Statistics
Retrieving SLA Definitions From Edge Devices
Monitoring IPsec VPN Performance
This chapter discusses how to monitor the IPsec VPNs defined in VPN Solutions Center 2.0. It contains the following topics:
•
Setting Up VPN Solutions Center for Collecting Configuration Files
•
•
•
•
•
Setting Up VPN Solutions Center for Collecting Configuration Files
The basic audit (Audit New Service Requests) does collect the configuration files. You need only set up the routers as described in this section if you are performing a customized audit procedure. This ensures that you have the most current version of the configuration files for the audit procedure.
To set up VPN Solutions Center for collecting router configuration files, implement the following tasks:
•
The csm.properties file is in the /opt/vpnadm/vpn/etc directory.
•
Setting the csm.properties File for Customized Router Prompt
When setting up configuration file collection from routers, be sure that all the routers have the same prompts as in the csm.properties file for netsys.router.loginprompt and netsys.router.passwordprompt. The default values match the default values on Cisco routers. They are as follows:
netsys.router.loginprompt = Username:
netsys.router.passwordprompt = Password:If you use nonstandard router prompts in the csm.properties file, be sure you set the same values for all the routers from which you collect information.
Setting Up the Domain Name Server
For the VPN Solutions Center collection module, enable or disable the Domain Name Server (DNS) on the routers. If DNS is not properly configured on the routers, collections fail due to a time-out.

Note
Enabling DNS
To enable DNS, enter the following commands on the router:
ip domain-lookup
ip name-server a.b.c.d
where a.b.c.d is a valid Domain Name server.
Disabling DNS
To disable DNS, it is important to enter the following command on all routers:
no ip domain-lookup
Setting Up SNMPv1 and SNMPv2 on the Routers in the Service Provider Network
The Simple Network Management Protocol (SNMP) must be configured on each router and edge device in the service provider network. To determine whether SNMP is enabled and set the SNMP community strings on a router, execute the following steps for each router.

Tips
Setting the SNMPv3 Parameters on the Routers in the Service Provider Network
Simple Network Management Protocol Version 3 (SNMPv3) is an interoperable standards-based protocol for network management. SNMPv3 provides secure access to devices by a combination of authenticating and encrypting packets over the network.
This section describes how to set the SNMPv3 parameters on the routers in the service provider network. To complete the task regarding SNMPv3 parameters, you also must set a selected set of parameters in the VPN Solutions Center software (see the "Setting the SNMPv3 Parameters for VPNSC Target Routers" section). The SNMPv3 parameters you set on the routers must match the SNMPv3 parameters you specify in the VPN Solutions Center software.
The security features provided in SNMPv3 are as follows:
•
•
•
Using SNMPv3, data can be collected securely from SNMP devices without fear of the data being tampered with or corrupted. Also, using the SNMP set command, packets that change a router's configuration can be encrypted to prevent its contents from being exposed on the network.
SNMPv3 provides for both security models and security levels. A security model is an authentication strategy that is set up for a user and the group in which the user resides. A security level is the permitted level of security within a security model. A combination of a security model and a security level determines which security mechanism is employed when handling an SNMP packet.
Three security models are available: SNMPv1, SNMPv2c, and SNMPv3. Table 7-1 identifies the combinations of security models and levels.
SNMPv3 objects have the following characteristics:
•
•
•
•
•
To check the existing SNMP configuration, use these commands:
•
•
Setting the Server Group and Server Users Parameters
To set the SNMPv3 server group and server users parameters on a router, execute the following steps:
Updating Router Configuration Files
To update router configuration files, follow these steps:
Step 1
The introductory panel displays the following information:
This wizard sets up a scheduled task that collects Cisco router configuration files directly from the selected routers. It also allows you to import Cisco router configuration files from a directory.
You can collect additional information, including router types, Frame Relay/ATM PVC information, and IP unnumbered connectivity information.
Click Next.
Figure 7-1 Specifying Configuration File Update Method
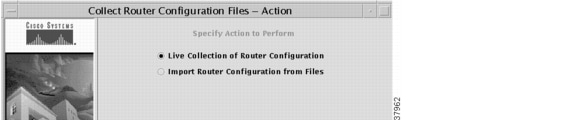
Step 2
•
This task performs a Telnet operation to the routers to collect the running configuration of each router.
•
This task imports collected configuration files that exist in a directory.
Updating Configuration Information by Collecting From Targets
To update router configuration files by collecting the information from existing targets, follow these steps:
Step 1
Step 2
As shown in Figure 7-2, all the router names in this network appear in the upper pane. If you want to sort the information, click on the column header for which you want to sort.
Figure 7-2 Updating Router Configuration Files from Selected Targets

a.
Your selections appear in the lower pane.
Note
b.
Step 3
Step 4
Step 5
Step 6
For detailed information about scheduling, refer to Chapter 12, "Scheduling," in the Cisco VPN Solutions Center: IPsec Solution User Reference (release 2.0).
Step 7
You are informed that all steps are done.
Step 8
Updating Configuration Information by Importing From Files
You can update configuration information by importing Cisco configuration files from a specified directory where the configuration files reside.
The default convention for naming configuration files is as follows:
device_name.domain.com
Tips
To update router configuration information by importing the configurations from files, follow these steps:
Note
Step 1
The introductory panel displays the following information:
This wizard sets up a scheduled task that collects Cisco router configuration files directly from the selected routers. It also allows you to import Cisco router configuration files from a directory.
Click Next.
Figure 7-3 Specifying Configuration File Collection Method
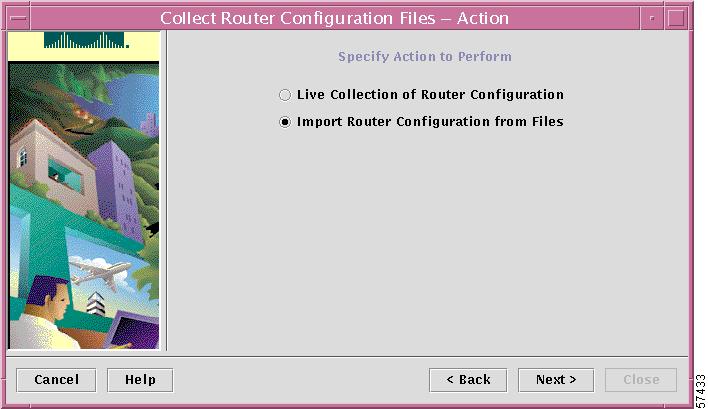
Step 2
This task imports the configuration files that exist in a specified directory.
Step 3
Step 4
Step 5
Step 6
Step 7
You are informed that all steps are done.
Step 8
Collecting Only Changed Configuration Files
Router configuration files are usually collected at regular intervals and then examined for changes that affect the way the routers function. While the routers whose configuration files have changed are the only ones that need to be collected, the normal collection process does not separate the routers whose configuration files have changed from the routers whose configuration files have not. SmartCollector finds the routers whose configuration files have changed and puts them in a group to have their configuration files collected.
With SmartCollector, VPN Solutions Center creates a task and schedules it to be run once. When the task executes, all the targeted routers are instructed to advise the VPN Solutions Center software that uses the Simple Network Management Protocol (SNMP) of any change to their configuration files. MPLS VPN Solution, through the trapcatcher daemon, notes these traps and keeps track of the routers whose configuration files have changed, and thus need to be collected. The purpose of configuring traps (through SmartCollector) is to efficiently collect router configuration files from a set of routers that can belong to more than one network.
An example of the potential substantial savings is a scenario in which a network has 200 routers, but the configuration files for only 20 of the routers have changed. In this example, SmartCollector collects only the configuration files for the 20 that have changed rather than for all 200 routers. If only 10 percent of the routers have their configuration files changed between scheduled collections, each SmartCollection takes only 10 percent of the resources of a full collection.
Note that periodically (as determined by the cycle_t variable in the csm.properties file), the scheduler ignores the reduced target list and collects from all routers in the original target list. Thus even those routers whose traps failed to reach the MPLS VPN Solution are collected periodically.
•
•
To determine whether SNMP is enabled and the SNMP community strings are set on a router, see the "Setting Up SNMPv1 and SNMPv2 on the Routers in the Service Provider Network" section and the "Setting the SNMPv3 Parameters on the Routers in the Service Provider Network" section.
Populating Router Interface Information to the Repository
Prior to registering the configuration file change traps, you must populate the router interface information in the Repository, as follows:
Step 1
Step 2
This wizard sets up a scheduled task that polls for information about router interfaces. It extracts the interface name, index number, and IP address and subnet mask for each interface. The collected interface information is stored with each router definition.
This information is used to create the various accounting reports and to map the "config-change" traps to the appropriate routers.
Registering for Changed Configuration File Traps
This section explains how to register traps for changed configuration files, which indicates the routers for which data will be collected only if the routers have changed.
Step 1
This wizard configures selected Cisco routers to send "config-change" traps to the current VPN Solutions Center workstation. This enables SmartCollection, through which configuration files are collected only from those routers whose configuration files have changed.
The cycle_t parameter clock starts when you execute this command. The next full collection will occur at the time set for the first Collect Configs task that is scheduled after the initial configuration file collection.
Note
Step 2
Deregistering for Changed Configuration File Traps
To deregister the traps for changed configuration files, follow these steps:
Step 1
This wizard configures selected Cisco routers to stop sending "config-change" traps to the current VPN Solutions Center workstation. The selected routers will no longer be part of SmartCollection, through which configuration files are collected only from those routers whose configuration files have changed.
Step 2
Monitoring Performance Through Service Level Agreements
VPN Solutions Center software monitors performance through the service-level agreement (SLA) server. An SLA defines a service provided by a service provider to any customer. VPN Solutions Center monitors the service related performance criteria by provisioning and monitoring SLAs on routers that support the Service Assurance Agent (SA Agent) management information base (MIB). To provision the SLAs and to collect statistics for each SLA, the process of creating an SLA and collecting the data requires some user input, as described in this section.
The SLA server collects the relevant performance data, stores it persistently, and presents useful reports. The SLA server is based on the Service Assurance Agent (SA Agent) MIB. The VPN Solutions Center software leverages the SA Agent MIB to monitor SLA performance. Service providers can monitor network traffic using any of the following protocols:
•
The default probe type is UDP Echo.
•
•
•
•
•
•
Since UDP Echo is the only SLA probe type configured by default, if you need to configure and run other probe types, you must specify those probe types by editing the csm.properties file to do so. For details, see the "Editing the csm.properties File to Enable Additional SLA Probe Types" section.
About the Service Assurance Agent Feature
The Service Assurance Agent (SA Agent) feature allows you to monitor network performance, network resources, and applications by measuring response times and availability. With this feature you can perform troubleshooting, problem notifications, and preventive analysis based on Service Assurance Agent statistics.
Tips
The SA Agent router uses the Cisco Round Trip Time Monitor (RTTMON) MIB. For more information on the RTTMON MIB, refer to the Cisco MIB User Quick Reference.
You can use the Service Assurance Agent feature to troubleshoot problems by checking the time delays between devices (such as between two edge device routers in a VPN) and the time delays on the path from the source device to the destination device at the protocol level.
You can use this feature to perform preventive analysis by scheduling the Service Assurance Agent and collecting the results as history and accumulated statistics. You can then use the statistics to model and predict future network topologies.
About SA Agent Traps
You can configure SA Agent traps per SLA probe. VPN Solutions Center can provision the SA Agent to send three types of probes:
•
•
•
The traps configuration encapsulates all three types of SA Agent traps.
In VPN Solutions Center, you can set traps per SLA either when you create an SLA or on an actively running SLA probe. When you configure traps during SLA creation, the traps are set before the SLA operation activates. In this case, VPNSC sends a trap in the event of a connection loss, a timeout, or threshold violation. When you configure a trap on an SLA probe that is already running, VPNSC does not send a trap after the first operation that triggers the trap until it sends the resolution trap.
An indication as to whether traps are sent on each SLA is recorded in the Repository. When a router reboots, VPNSC recreates the SLA and configures the traps according the data in the Repository.
Before You Create a Service Level Agreement
Before you create a Service Level Agreement in the VPN Solutions Center software, complete the following tasks:
1.
SNMP must be enabled and the SNMP read-only and read-write community strings must be set on all the edge devices in the service provider's network. For instructions, see these sections:
•
•
2.
The SA Agent rtr responder software must be enabled on the target routers configured as SA Agent devices. The rtr responder is not automatically enabled when VPN Solutions Center software provisions an edge device that is running SA Agent.
To collect SLA data from the edge devices in your network, you must enable SA Agent on each device from which you want to collect this data. For instructions, see the "Enabling SA Agent on an Edge Device" section.
3.
Creating a Service Level Agreement
Each Service Level Agreement (SLA) is associated with a customer, the source and destination addresses on the target edge routers, the protocol used for the SA Agent probe, and the threshold for delay.
Before you can create an SLA in the VPN Solutions Center software, the SA Agent edge router must be:
•
•
VPN Solutions Center provides a way to automate SLA probe provisioning (see "Automating SLA Probe Provisioning" section). When you enable the Automate SLA Probe Provisioning option, VPN Solutions Center automatically configures a set of user-specified SLA probe types between the peer edge devices specified in the service request. These settings are applied per edge device; that is, you can have SLA probes automatically configured on none, some, or all of the edge devices in a service request. Enabling this option makes it easier (and less error prone) to set up the standard set of probe types that you need to collect SLA data.
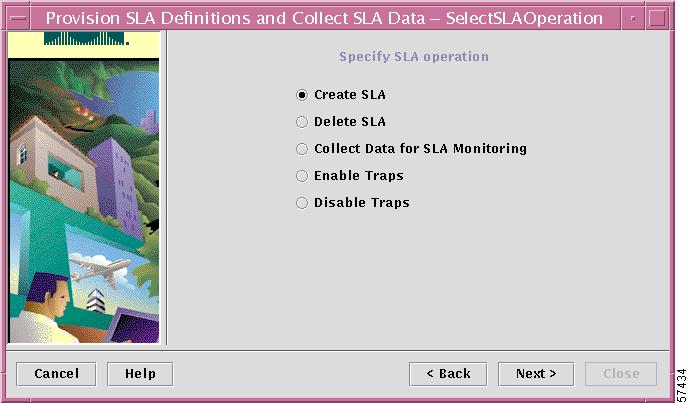
When you create an SLA, VPN Solutions Center software creates an SA Agent probe on the target edge router. To create an SLA, follow these steps:
Step 1
Step 2
The Specify SLA Operation dialog box appears (see Figure 7-4).
Figure 7-4 Specifying the SLA Operation
For information on creating, selecting, and deleting SLAs for APIs by using the command line interface, see the Cisco VPN Solutions Center: IPsec Solution API Programmer Reference.
Step 3
The dialog box shown in Figure 7-5 directs you to select the source edge router (or routers)—that is, the router you select here sends the SLA probe.
Figure 7-5 Select the Source Edge Router for the SLA Probe
Step 4
a.
b.
c.
To select multiple routers from the list, hold down the Ctrl key, then click the additional router names.
The next dialog box directs you to indicate the source IP address for the source router.
Figure 7-6 Select the Source IP Address for the SLA Probe
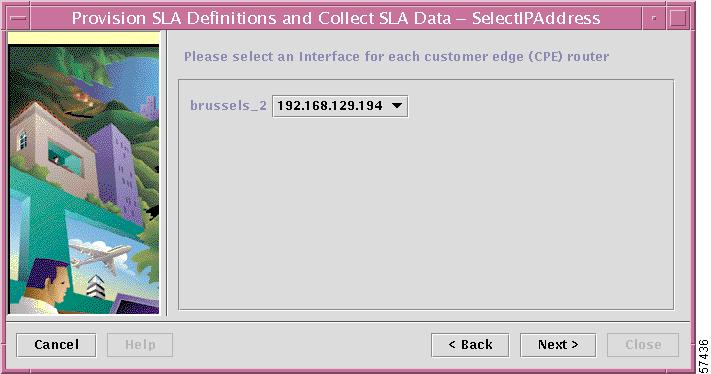
Step 5
When finished, click Next.
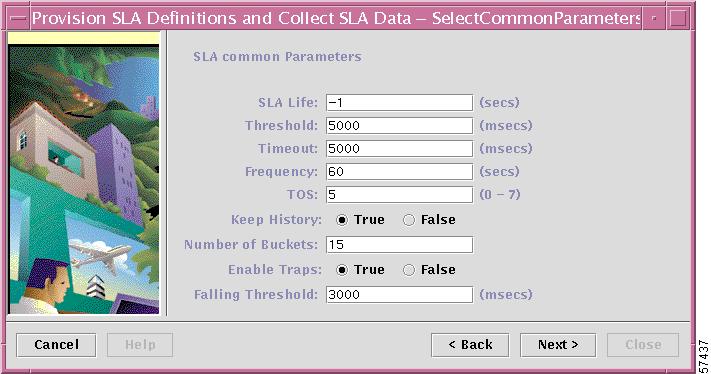
The next dialog box directs you to specify the common parameters for the SLA.
Figure 7-7 Specify SLA Common Parameters
Step 6
The fields in the SLA Common Parameters dialog box are as follows:
•
•
•
•
•
Step 7
a.
The VPN Solutions Center history table records the round trip time (that is, the delay) of operations in milliseconds. The history table does not apply to the jitter and http SLA probes.
The statistics table, which is unrelated to the history table, records the sum of the round trip times, calculates averages, and records the minimum and maximum delay values.
When you set the Keep History parameter to True, it configures the SLA probe to keep both the history table and statistics table.
b.
The Numbered Buckets parameter determines the number of samples saved for each operation. This parameter indicates the number of history delay values retained in the history table.
c.
When you set Enable Traps for a new SLA probe, the traps are set before the SLA operation activates. The SA Agent sends a trap in the event of a timeout, a connection loss, or threshold violation (see also "About SA Agent Traps" section).
d.
If you enable traps for the SLA, you must specify the Falling Threshold value, which triggers a threshold resolution trap. The default is 3000 milliseconds.
The next dialog box (see Figure 7-8) directs you to specify the type of SLA protocol and set its corresponding parameters.
Figure 7-8 Select SLA Protocol Data Parameters

Step 8
•
The default probe type is UDP Echo.
•
•
•
•
•
•
Since UDP Echo is the only SLA probe type configured by default, if you need to configure and run other probe types, you must specify those probe types by editing the csm.properties file to do so. For details, see the "Editing the csm.properties File to Enable Additional SLA Probe Types" section.
Step 9
You can add additional protocols as desired.
Step 10
For details on the parameters and values for each SLA protocol listed here, refer to "Provision SLA Definitions and Collect SLA Data" in Chapter 9 of the Cisco VPN Solutions Center: IPsec Solution User Reference.
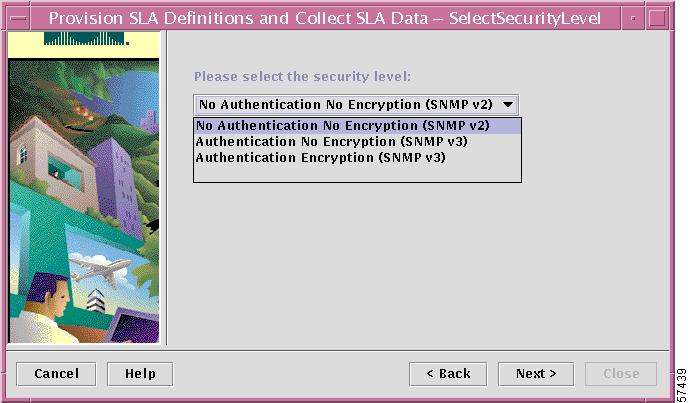
The dialog box shown in Figure 7-9 directs you to select the SNMP security level for the SLA.
Figure 7-9 Setting the SNMP Security Level
Step 11
•
•
•
When you have selected the SNMP security level for this SLA, click Next.
Step 12
To help you specify a unique task name, the Task Name drop-down list shows the list of existing task names.
The dialog box shown in Figure 7-10 asks if and when you want to schedule the task.
Figure 7-10 Specifying When to Run the Task
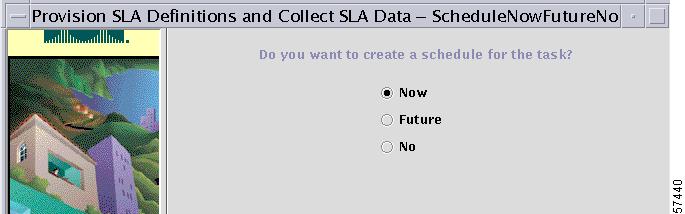
You have three options:
•
•
•
Step 13
Step 14
The SLA is added to the Schedule List (and displayed in the upper pane).
Step 15
Collecting Data for SLA Monitoring
When you collect data for SLA monitoring, VPN Solutions Center software downloads SLA statistics collected over the last hour from one or more specified routers. The specified routers must have the SA Agent probes configured on them.
Automating SLA Probe Provisioning
VPN Solutions Center provides a way to automate SLA probe provisioning (see "Automating SLA Probe Provisioning" section).
When you enable the Automate SLA Probe Provisioning option, VPN Solutions Center automatically configures a set of user-specified SLA probe types between the peer edge devices specified in the service request. For the procedure, see the "Automating SLA Probe Provisioning" section.
These automated SLA probe settings are applied per edge device; that is, you can have SLA probes automatically configured on none, some, or all of the edge devices in a service request. Enabling this option makes it easier (and less error prone) to set up the standard set of probe types that you need to collect SLA data.
Enabling SA Agent on Edge Device Routers
To collect SLA data from the edge devices in your network, you must enable SA Agent on each device from which you want to collect this data. For information on defining an edge router as a router running SA Agent, see the "Enabling SA Agent on an Edge Device" section.
Note
To collect SA Agent data for SLAs, follow these steps:
Step 1
Step 2
The Select SLA Operation dialog box is displayed. From this dialog box, you can choose the following operations:
•
•
•
•
•
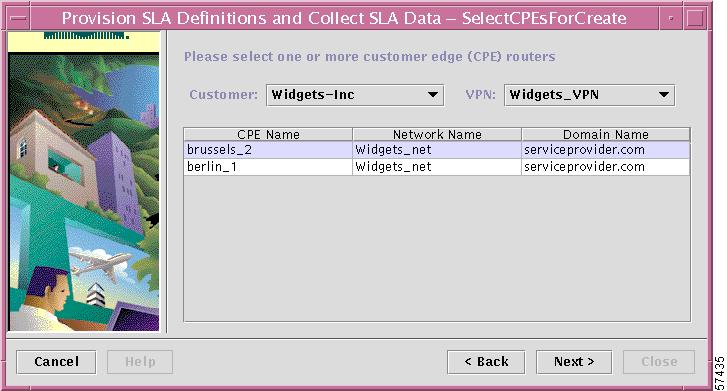
Step 3
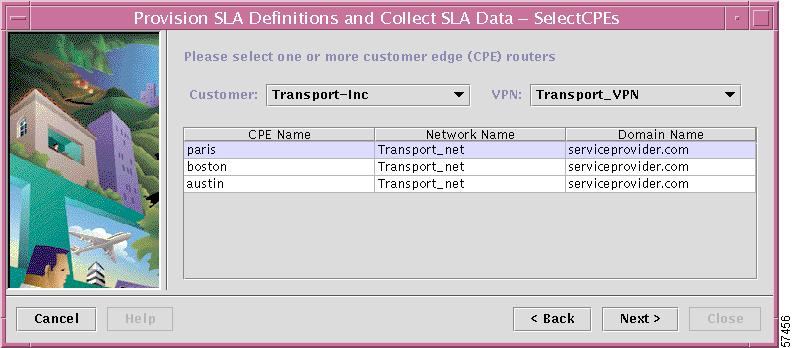
The Select CPEs dialog box shown in Figure 7-11 appears and directs you to select the source edge device for the SLA probe (or edge devices). The edge device you select here sends the SLA probe to the routers that have SA Agent enabled.
Figure 7-11 Specifying the Source Router for an SLA Probe
a.
b.
The list of edge device routers for the selected Customer and VPN are displayed in the dialog box.
c.
The next dialog box directs you to specify the SNMP security level for the SLA probe (see Figure 7-12.
Figure 7-12 Specifying the SNMP Security Level
Step 4
•
•
•
When you have selected the SNMP security level for this SLA, click Next.
Step 5
To help you specify a unique task name, the Task Name drop-down list shows the list of the last 30 existing task names for this specific task type.
The dialog box shown in Figure 7-13 asks if and when you want to schedule the task.
Figure 7-13 Specifying When to Run the Task
You have three options:
•
•
•
Step 6
Step 7
The SLA is added to the Schedule List (and displayed in the upper pane).
Step 8
Enabling Traps for SLA Data
To enable traps for SLAs, follow these steps:
Step 1
Step 2
The Select SLA Operation dialog box is displayed. From this dialog box, you can choose the following operations:
•
•
•
•
•
Step 3
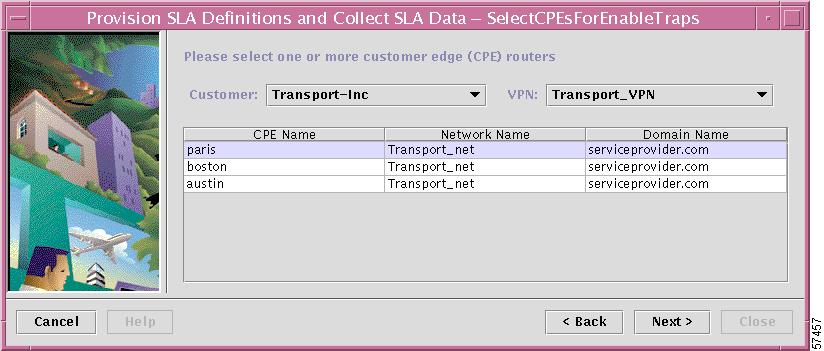
The Select CPEs dialog box shown in Figure 7-11 appears and directs you to select the source edge device for the SLA probe (or edge devices). The edge device you select here sends the SLA probe to the routers that have SA Agent enabled.
Figure 7-14 Specifying the Source Router for an SLA Probe
a.
b.
The list of edge device routers for the selected Customer and VPN are displayed in the dialog box.
c.
The next dialog box directs you to specify the SNMP security level for the SLA probe (see Figure 7-12.
Figure 7-15 Specifying the SNMP Security Level
Step 4
•
•
•
When you have selected the SNMP security level for this SLA, click Next.
Step 5
To help you specify a unique task name, the Task Name drop-down list shows the list of the last 30 existing task names for this specific task type.
The dialog box shown in Figure 7-13 asks if and when you want to schedule the task.
Figure 7-16 Specifying When to Run the Task
You have three options:
•
•
•
Step 6
Step 7
The SLA is added to the Schedule List (and displayed in the upper pane).
Step 8
Collecting Interface Statistics
VPN Solutions Center periodically collects interface statistics data and places this data in the Repository. You can access the interface statistics data through web-based data query tools. The data retrieved by the web-based data query tools is saved to a file in XML format that includes a Document Type Definition (DTD).
The data query tool collects and saves the interface statistics by router. The statistics include packet counters for router interfaces. You must identify the interfaces by index number, which is a unique and constant number, at least from one initialization of the router's network management system to another. The counters are wrapped around numbers with a maximum value of 2 to the power of 32 minus 1.
To access the interface statistics, follow these steps:
Step 1
The first screen is informational.
Step 2
The Get Devices dialog box appears (see Figure 7-17).
Figure 7-17 Specifying Devices for Interface Statistics
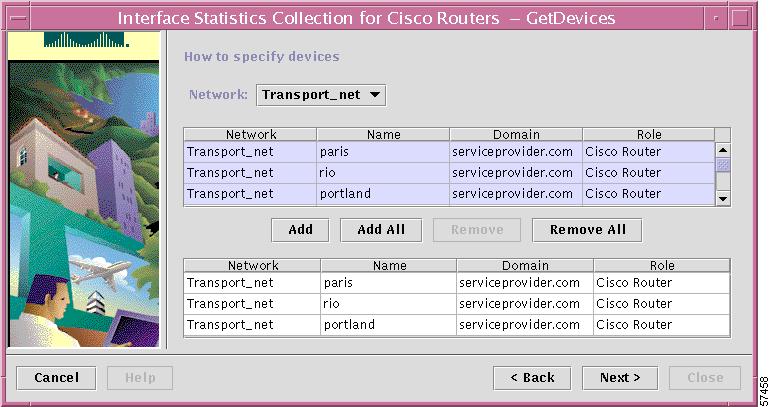
a.
The list of edge devices in the specified network are displayed. You can select any number of devices from the list.
b.
c.
The names of the devices you specified are placed in the lower area, as shown in Figure 7-17, which indicates those devices from which interface statistics will be collected.
You can also remove specific devices from the selection by selecting the devices and clicking Remove. You can remove all the devices from the selection, by clicking Remove All.
Step 3
To help you specify a unique task name, the Task Name drop-down list shows the list of the last 30 existing task names for this specific task type.
The dialog box shown in Figure 7-18 asks if and when you want to schedule the task.
Figure 7-18 Specifying When to Run the Task
You have three options:
•
•
•
Step 4
Step 5
The SLA is added to the Schedule List (and displayed in the upper pane).
Step 6
Retrieving SLA Definitions From Edge Devices
You can retrieve all the Service Level Agreement (SLA) definitions on the SA Agent-enabled routers from which data is collected. You can either retrieve all the SLA definitions on the SA Agent routers, or only the SLA definitions that are currently active.
You can access the SLA data through web-based data query tools, as well as through customized reports or through CORBA APIs. The data retrieved by the web-based XML data query tools is saved to a file in XML format that includes a Document Type Definition (DTD).
To retrieve all the SLA definitions on the SA Agent-enabled routers, follow these steps:
Step 1
The first time you access the web browser from the VPNSC software, you must log in.
Step 2
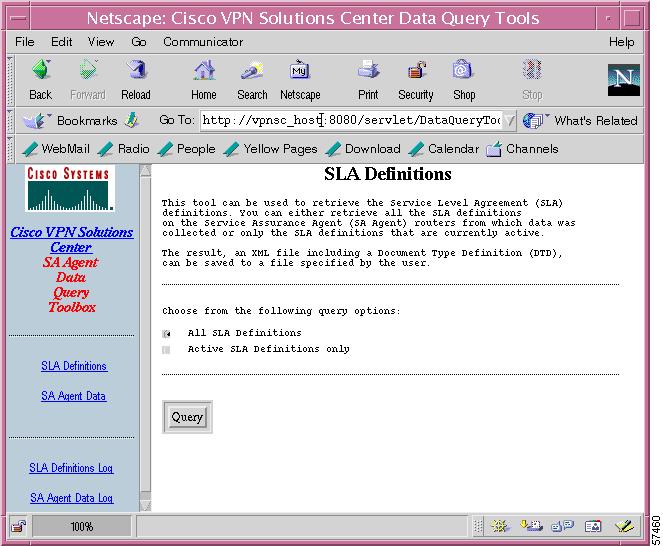
The VPN Solutions Center Data Query Tools page appears (see Figure 7-19).
Figure 7-19 VPN Solutions Center Data Query Tools Page

Step 3
The SLA Definitions Query page appears (see Figure 7-20).
Figure 7-20 SLA Definitions Query Page
Step 4
•
•
Step 5
You receive the following message:
SLA Definitions Data Query is starting. Do you really want to continue?
Step 6
To cancel the query, click Cancel.
The next page that appears gives you the following options:
•
•
Step 7
Retrieving SA Agent Data
VPN Solutions Center periodically collects Service Assurance Agent (SA Agent) performance data and places this data in the Repository. You can access the SA Agent data through web-based data query tools, as well as through customized reports or through CORBA APIs. The performance data retrieved by the web-based data query tools is saved to a file in XML format.
To access the SA Agent Data Query Tools, follow these steps:
Step 1
The Netscape browser comes up. The first time you access the web browser from the VPNSC software, you must log in.
Step 2
The VPN Solutions Center Data Query Tools page appears (see Figure 7-21).
Figure 7-21 VPN Solutions Center Data Query Tools Page
Step 3
The SA Agent Data Query page appears (see Figure 7-22).
Figure 7-22 SA Agent Data Query Page
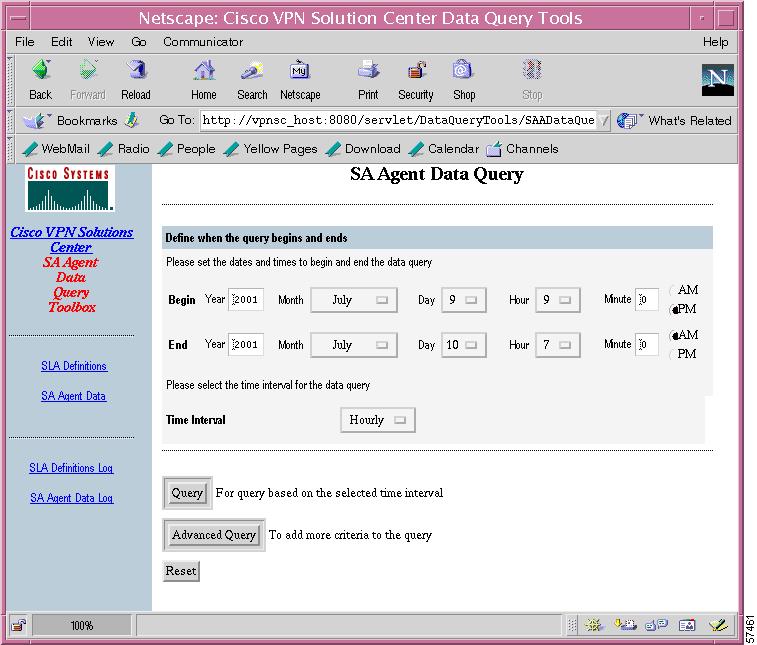
Step 4
a.
b.
c.
d.
e.
f.
Step 5
Step 6
You have the option of proceeding with the data query by clicking the Query button or adding additional criteria to the data query by clicking the Advanced Query button.
Step 7
You receive the following message:
SA Agent Data Query is starting; it may take some time. Do you really want to continue?
Step 8
To cancel the query, click Cancel.
If you click OK, the another page appears that provides the following options:
•
•
•
Step 9
Viewing Monitoring Reports
VPN Solutions Center provides the following monitoring reports:
•
You can generate three types of Data report: by device, by network, and by dataset type. For details, see "View Data Reports" in Chapter 8, "VPN Console: Monitoring Menu," in the Cisco VPN Solutions Center: IPsec Solution User Reference.
•
See the next section, "Viewing SLA Reports."
•
See the "Viewing Verification Reports" section.
Viewing SLA Reports
After collecting SA Agent data for SLA, choose Monitoring > View SLA Reports, then select the specific type of report you require.
Note
The specific report types you can generate are as follows:
•
These reports are time-based reports that show the following parameters: Connectivity as a percentage, Maximum Delay in milliseconds, and Threshold Violation as a percentage. These parameters are available in annual, monthly, weekly, daily, and hourly reports. For each parameter, you can generate detailed reports that show more related parameters. The reports can be organized by source router (of the SLA), SLA identifier, customer name, or VPN name.
•
Displays statistics that are measured only by Voice Jitter SLAs originated in a selected router. The reports are time-based. They show hourly, daily, weekly, monthly, and annual data and can be organized by SLA ID, destination router, VPN, Customer, or Unspecified.
•
Displays statistics that are measured only by HTTP SLAs. The reports are time-based, and they show data in the following time increments: hourly, daily, weekly, monthly, and annually. Data can be organized by SLA ID, source router, VPN, or Customer.
The Summary HTTP Report displays the connectivity, maximum delay, and threshold violation (as in the Summary Report). The Stages HTTP Report displays the round trip time, timeouts, and the error distribution among different HTTP stages: DNS lookup, TCP connect, and Transaction.
•
Shows all the SLAs on the SA Agent routers from which data was collected. The SLA Definition report shows the SLA ID given to each SLA. SLAs in the report may have been deleted but are kept in the SLA Definition to match the old collected data.
Viewing Verification Reports
Verification reports track status information from executed collections. The status information is associated with each individual target. Each collection attempt generates a set of attributes and corresponding status for each target accessed by the collection. Attributes are used to track the success or failure of various operations such as accessing a target or collecting information.
These reports provide a quick way to check whether there are any connectivity problems to collected targets (for example, any bad passwords or unreachable targets).
The data is merged into a database of most current information, with newer values overwriting older values. The View Verification Report provides views of subsets of this data. A short delay may occur between when the collection completes and when the data is visible in these reports.
Step 1
The Latest Summary Verification report appears (Figure 7-23).
Figure 7-23 Example of Latest Summary Verification Report
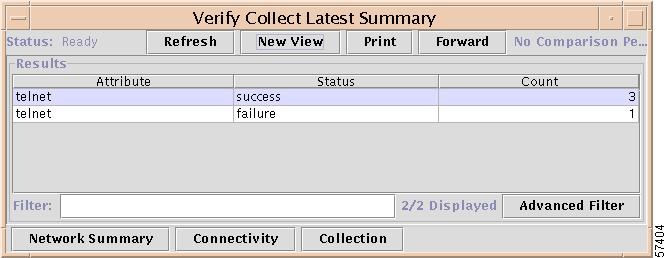
The Latest Summary Verification report provides a summary of the latest connectivity and collection information for all targets. Each row provides a count of how many targets had the listed status for the listed attribute. This report provides a quick way to determine whether there are problems with connections.
The task bar at the bottom of the report provides three buttons for their related reports: Network Summary, Connectivity, and Collection.
Network Summary Report
Step 2
The report shown in Figure 7-24 appears.
Figure 7-24 Network Summary Report
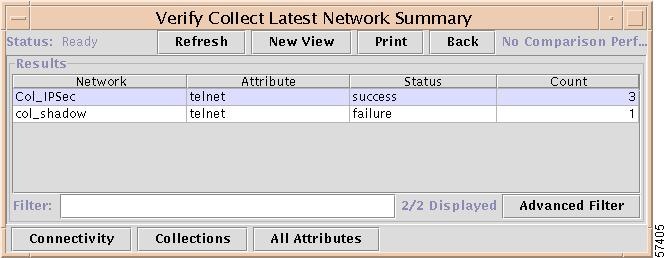
The Network Summary report provides the same information as in the Summary Verification report, but the information is organized by network.
You can click Back to return to the previous report.
Connectivity Report
Step 3
The report shown in Figure 7-25 appears.
Figure 7-25 Connectivity Report
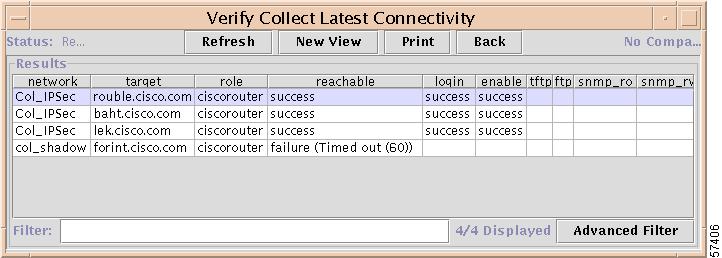
The Latest Connectivity report shows any connectivity problems encountered during collections. The first three columns identify each target; the remaining columns provide the connectivity status for the target. You can use this report, for example, to identify any invalid password problems encountered during configuration file collections.
To return to the Latest Summary Verification report, click Back.
Collections Report
Step 4
The report shown in Figure 7-26 appears.
Figure 7-26 Collections Report
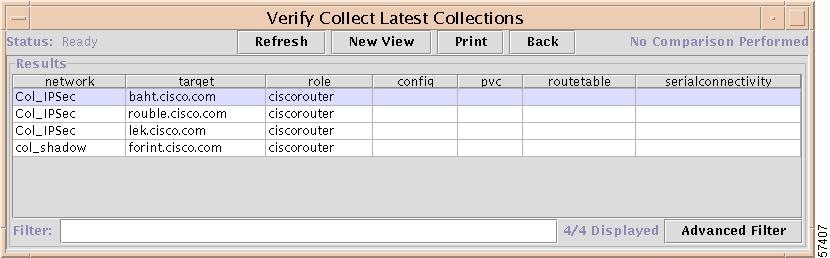
To return to the Latest Summary Verification report, click Back.
Attributes Report
Step 5
The report shown in Figure 7-27 appears.
Figure 7-27 Attributes Report
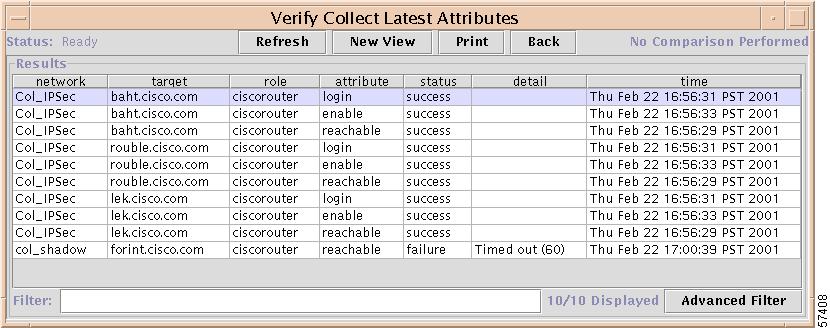
To return to the Latest Summary Verification report, click Back twice.
 Feedback
Contact Cisco
- Open a Support Case

- (Requires a Cisco Service Contract)
This Document Applies to These Products
- Collaboration Endpoints - Retired Products
- Conferencing - Retired Products
- Contact Center - Retired Products
- Optical Networking - Retired Products
- Routers - Retired Products
- Security - Retired Products
- Servers - Unified Computing (UCS) Retired Products
- Storage Networking Retired Products
- Switches - Retired Products
- Video - Retired Products
- Wireless - Retired Products