Chapter 6 Reports
Available Languages
Table Of Contents
Creating a Threshold Violation Report
Editing a Threshold Violation Report
Copying a Threshold Violation Report
Viewing a Threshold Violation Report
Understanding Threshold Violation Reports
Deleting a Threshold Violation Report
Viewing the Job Details of a Report Job
Filtering the Report Job Browser
Suspending a Scheduled Report Job
Resuming a Suspended Report Job
Reports
This chapter explains on how to create, view and manage reports. The Reports page offers two main features:
Report Management
CiscoWorks HUM offers comprehensive reporting on the data collected by polling the device and presents this data using tables and graphs. These reports help network administrators analyze the utilization and availability of devices connected to the network. Reports also provide the historical trending information of a device.
The Report Management page help you to create, schedule, view, edit and delete the following reports:
You can also add and manage your list of favorite reports to My Favorites category. For more information, see Managing My Favorites.
To access the Report Management page go to LMS Portal and select Health and Utilization Monitor > Reports > Report Management.
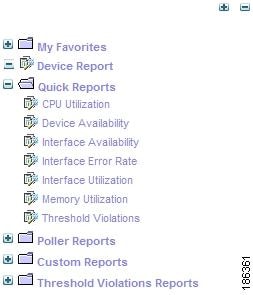
CiscoWorks HUM allows you to expand and collapse all the report categories as a tree list by clicking
(Expand) and
(Collapse), respectively.
Figure 6-1 represents the list of reports available in the Report Management page.
Figure 6-1 List of Reports
Device Report
Device Report shows all the performance parameters of a device such as memory utilization, CPU utilization, interface utilization, environmental temperature, Poller Failures and so on. The Device Report also shows the polled data for MIB variables added in the user-defined templates. CiscoWorks HUM generates Device Report based only on the data for the last 24 hours.
To view a Device Report:
Step 1
Go to LMS Portal and select Health and Utilization Monitor > Reports > Report Management.
The Reports page appears.
Step 2
The device selector pane appears, displaying the list of devices currently polled by HUM in a tree view. See User Guide for CiscoWorks Common Services 3.2 to know more about using Device Selector.
Step 3
•
Or
•
The Device Report page appears, displaying the details of the device polled by HUM. For more information, see Understanding Device Reports.
Understanding Device Reports
This report provides you the complete details of the data collected by polling a device. The information is presented using tables and graphs.
Table 6-1 describes the fields in the Device Report.
Table 6-1 Device Report Fields
Device Name
Device name. For example, 3500XL.
Click the device name to launch Device Center.
Device Description
Device information such as Model, Software Version, Copyright and so on. For example,
Cisco Systems WS-C6009 Cisco Catalyst Operating System Software, Version 8.6(2) Copyright (c) 1995-2007 by Cisco SystemsDevice Status
Status of the device in the network. The following status information are displayed:
•
•
24 Hours
Click
to launch a line graph showing device availability details for the last 24 hours.
For more information on the line graph, see Device Availability Line Graph.
One Week
Click
For more information on the line graph, see Device Availability Line Graph.
One Month
Click
For more information on the line graph, see Device Availability Line Graph.
Device Availability Line Graph
Displays the last 24 hours Device Availability percentage as a line graph.
The line graph provides the following information:
•
•
•
•
•
•
No. of Thresholds Configured
Total number of thresholds configured in the device.
No. of Violations in Last 24 hours
Total number of threshold violations occurred in the last 24 hours categorized based on the severity levels (such as Critical, Medium or Low).
For example, Low: 10, Medium: 15, Critical: 170
Threshold Name
Threshold configured in the device.
Variable Name
MIB variable name. For example, cpmCPUTotal5minRev.
Instance Name
MIB variable instance for which the threshold is configured. For example, CPU of supervisor.
Severity
Severity level of the threshold (such as Critical, Medium or Low).
Time Stamp
Time of threshold violation.
More
(link)By default, only the latest 10 MIB instances are displayed for the device in the Device Threshold Details panel.
If you click More, a pop-up window appears displaying details on all the MIB instances in the device.
Total Poll Failures
Total number of poll failures for the device during the last 24 hours.
MIB Variable
MIB variable failed during polling. For example, ifInErrors.
Instance
MIB variable instance failed during polling. For example, VLAN-1.
Failure Reason
Reason for the failure. For example, Request Timed-Out. Device may be down.
Last Failed
Time of last failure. For example, Mon, Apr 21 2008, 17:30:15.
More
(link)By default, only the latest 10 MIB failure instances are displayed for the device in the Poll Failure Details panel.
If you click More, a pop-up window appears displaying details on all the MIB failure instances in the device.
Provides environmental temperature details on the device polled using the Environmental Temperature template.
Instance Name
MIB variable instance.
Min
Minimum temperature value for the MIB variable instance in celsius.
Max
Maximum temperature value for the MIB variable instance in celsius.
Avg
Average temperature value for the MIB variable instance in celsius.
Provides CPU utilization details on the device polled using the CPU Utilization template.
Instance Name
MIB variable instance.
Min %
Minimum CPU utilization percentage value of the MIB variable instance.
Avg %
Average CPU utilization percentage value of the MIB variable instance.
Max %
Maximum CPU utilization percentage value of the MIB variable instance.
Graph
Click
CPU Utilization Line Graph
Displays the last 24 hours CPU utilization percentage summary as a line graph.
The line graph provides the following information:
•
•
•
•
•
•
•
Provides memory utilization details on the device polled using the Memory Utilization template.
Instance Name
MIB variable instance. For example, DRAM
Min %
Minimum memory utilization percentage value of the MIB variable instance.
Avg %
Average memory utilization percentage value of the MIB variable instance.
Max %
Maximum memory utilization percentage value of the MIB variable instance.
Graph
Click
Memory Utilization Line Graph
Displays the last 24 hours memory utilization percentage summary as a line graph.
The line graph provides the following information:
•
•
•
•
•
•
•
Provides interface details on the device polled using the Interface templates.
Interface Name
Interface monitored in the device.
Interface Availability
Average interface availability percentage value.
Detailed
(link)By default, only the Interface Name and Interface Availability details are displayed for the device in the Interface Summary panel.
If you click Detailed, a pop-up window appears displaying the following details for the device:
•
•
•
•
•
•
•
Provides data for MIB variables polled using a user-defined template.
Variable Name
Name of the MIB variable. For example, sysServices.
Instance Name
MIB variable instance name.
Min
Minimum value for the monitored MIB variable.
Max
Maximum value for the monitored MIB variable.
Avg
Average value for the monitored MIB variable.
Units
Displays unit information for the monitored MIB variable. The following units are displayed:
•
•
•
•
•
Quick Report
CiscoWorks HUM contains a set of predefined system generated reports called Quick Reports. These reports run periodically and are stored in the HUM server.
Quick Reports provide detailed information about all the devices polled by HUM. The Quick Reports page provides information only on the Top-10 and Bottom-10 devices. The Top-10 and Bottom-10 devices are devices that have the highest or lowest utilization or availability value.
The information for the last 24 hours is generated as a Quick Report. This information is updated every one hour, by default. You can change this frequency in the Admin page. For more information, see Administration.
Only the recently generated 24-hour report is stored in the HUM server as a Quick Report. You can also configure HUM to archive all the generated Quick Reports in a PDF, HTML and CSV format to a directory location. You need to set a directory as a default location to which these archived reports are published. For more information, see Set Report Publish Location.
By default, only the CSV and HTML version of the Quick Report is generated. The PDF format of the Quick Report is generated only on demand.
Table 6-2 describes the list of predefined Quick Reports available in HUM. A Quick Report is generated for each of the System-defined templates.
You can perform the following operations in the Quick Reports panel:
Viewing a Quick Report
You can view a Quick Report by clicking the report name. If data for a report is not available, a message appears,
Report Not Available. This message appears because information is not available for the specified duration or the report job has failed.To view a Quick Report:
Step 1
The Reports page appears.
Step 2
The list of Quick Reports appear in a tree view.
Step 3
Step 4
The corresponding report page appears, displaying the report details. For more information, see Understanding Quick Reports.
CiscoWorks HUM allows you to add your favorite reports to My Favorites category. For more information, see Managing My Favorites.
You can also copy the URL of a report to clipboard. For more information, see Copying a Report Link.
Click
Understanding Quick Reports
Quick Reports are system generated reports that are run periodically and stored in the HUM server. Quick Reports display information only on the data processed during last 24-hours.
The following report types are available as Quick Reports:
CPU Utilization
This report displays the CPU utilization data for each device polled for the CPU Utilization template. The information is presented using tables and graphs.
You can only export the report to a file of CSV. For more information, see Exporting a Report.
Use the Copy Quick Report option to generate a PDF format of the report. For more information, see Copying a Quick Report.
Table 6-3 describes the fields in the CPU Utilization report.
Table 6-3 CPU Utilization Report Fields
Report Name
Name of the report. For example, CPU Utilization
Generation Time
Time at which the report was generated.For example, Mon, Apr 21 2008, 12:44:08
No. of Devices
Number of devices included while generating the report.
No. of CPUs
Number of CPUs monitored for utilization levels.
Start Date
Start date of the report data. For example, Sun, Apr 20 2008, 12:44:03
End Date
End date of the report data. For example, Mon, Apr 21 2008, 12:44:03
Utilization in %
Distribution of CPU utilization percentage range.
The CPU utilization percentage distribution range is categorized as 0-10, 10-30, 30-80, 80-100.
No. of CPUs
Number of CPUs that fall into the corresponding utilization percentage category.
For example, 10 CPUs having 10-30% utilization, 20 CPUs having 30-80% CPU utilization and so on.
The CPU Utilization summary is also presented as a pie chart, which shows the number of CPUs that fall into the corresponding distribution percentage range.
Device Name
Displays the device name. For example, 3500XL.
Click on the device name to view the CPU utilization percentage as a line graph. For more information on the graph, see CPU Utilization Graph.
CPU
CPU monitored in the device.
Min %
Minimum utilization percentage for the corresponding CPU.
Max %
Maximum utilization percentage for the corresponding CPU.
Avg %
Average utilization percentage for the corresponding CPU.
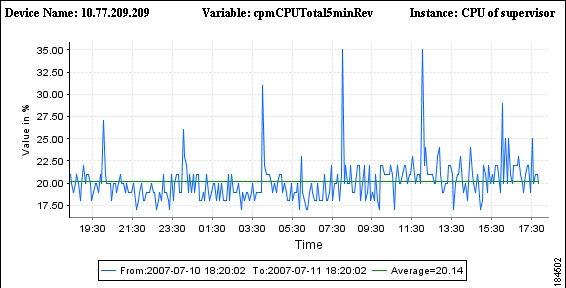
CPU Utilization Graph as shown in Figure 6-2.
X-axis
Represents the time period of the report.
The time period refers to the start and end times of the report data.
Y-axis
Represents the CPU utilization percentage.
Figure 6-2 CPU Utilization Graph
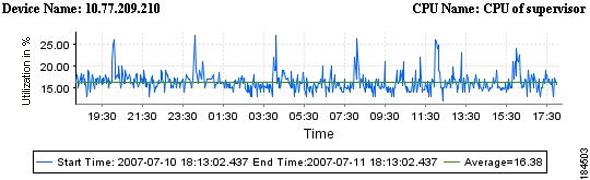
Each data point in the line graph has a tooltip that displays the value for the time period.
Device Availability
This report displays the device availability data for each device polled for the Device Availability template. The information is presented using tables and graphs.
You can only export the report to a file of CSV. For more information, see Exporting a Report.
Use the Copy Quick Report option to generate a PDF format of the report. For more information, see Copying a Quick Report.
Table 6-4 describes the fields in the Device Availability report.
Table 6-4 Device Availability Report Fields
Report Name
Name of the report.
For example, Device Availability
Generation Time
Date and time at which the report was generated.
For example, Mon, Apr 21 2008, 12:44:08
No. of Devices
Number of devices included while generating the report.
Start Date
Start date and time of the report data.
For example, Sun, Apr 20 2008, 12:44:03
End Date
End date and time of the report data. For example, Mon, Apr 21 2008, 12:44:03
Availability in %
Distribution of device availability percentage range.
The device availability percentage distribution range is categorized as 0-10, 10-50, 50-90, 90-100.
No. of Devices
Number of devices that fall into the corresponding availability percentage category.
For example, 10 devices having 50-90% availability, 20 devices having 90-100% availability and so on.
The device availability summary is also presented as a pie chart, which shows the number of devices that fall into the corresponding distribution percentage range.
Device Name
Device name. For example, 3500XL.
Click on the device name to view the respective graph. For more information on the graph, see Device Availability Graph.
Availability %
Availability percentage for the corresponding device.
Device Availability Graph as shown in Figure 6-3.
X-axis
Represents the time period of the report.
The time period refers to the start and end times of the report data.
Y-axis
Represents the device availability percentage.
Figure 6-3 Device Availability Graph
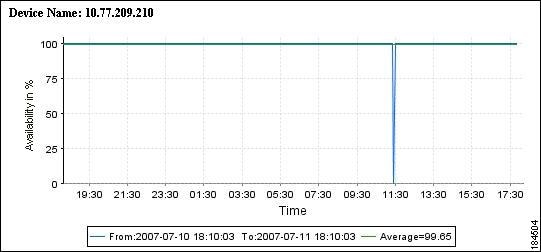
Each data point in the line graph has a tooltip that displays the value for the time period.
Memory Utilization
This report displays the memory utilization data for each device polled for the Memory Utilization template. The information is presented using tables and graphs.
You can only export the report to a file of CSV. For more information, see Exporting a Report.
Use the Copy Quick Report option to generate a PDF format of the report. For more information, see Copying a Quick Report.
Table 6-5 describes the fields in the Memory Utilization report.
Table 6-5 Memory Utilization Report Fields
Report Name
Name of the report. For example, Memory Utilization
Generation Time
Date and time at which the report was generated. For example, Mon, Apr 21 2008, 12:44:08
No. of Devices
Number of devices included while generating the report.
No. of Memory Modules
Number of memory modules monitored for utilization levels.
Start Date
Start date and time of the report data. For example, Sun, Apr 20 2008, 12:44:03
End Date
End date and times of the report data. For example, Mon, Apr 21 2008, 12:44:03
Utilization in %
Distribution of memory utilization percentage range.
The memory utilization percentage distribution range is categorized as 0-50, 50-70, 70-90 and 90-100.
No. of Instances
Number of instances that fall into the corresponding utilization percentage category.
For example, 10 instances having 50-70% utilization, 20 instances having 70-90% utilization and so on.
The memory utilization summary is also presented as a pie chart, which shows the number of instances that fall into the corresponding distribution percentage range.
Device Name
Device name. For example, 3500XL
Click on the device name to view the respective graph. For more information on the graph, see Memory Utilization Graph.
Instance Name
Instance monitored for the device. For example, FLASH
Min %
Minimum utilization percentage for the corresponding instance.
Max %
Maximum utilization percentage for the corresponding instance.
Avg %
Average utilization percentage for the corresponding instance.
Memory Utilization Graph as shown in Figure 6-4.
X-axis
Represents the time period of the report.
The time period refers to the start and end times of the report data.
Y-axis
Represents the memory utilization percentage.
Figure 6-4 Memory Utilization Graph
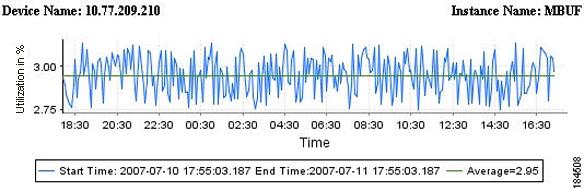
Each data point in the line graph has a tooltip that displays the value for the time period.
Interface Utilization
This report displays the interface utilization data for each device polled for the Interface Utilization template. The information is presented using tables and graphs.
You can only export the report to a file of CSV. For more information, see Exporting a Report.
Use the Copy Quick Report option to generate a PDF format of the report. For more information, see Copying a Quick Report.
Table 6-6 describes the fields in the Interface Utilization report.
Table 6-6 Interface Utilization Report Fields
Report Name
Name of the report. For example, Interface Utilization
Generation Time
Date and time at which the report was generated.For example, Mon, Apr 21 2008, 12:44:08
No. of Devices
Number of devices included while generating the report.
No. of Interfaces
Number of interfaces monitored for utilization levels.
Start Date
Start date and time of the report data. For example, Sun, Apr 20 2008, 12:44:03
End Date
End date and time of the report data. For example, Mon, Apr 21 2008, 12:44:03
Utilization in %
Distribution of interface utilization percentage range.
The interface utilization percentage distribution range is categorized as 0-50, 50-70, 70-90 and 90-100.
No. of Interfaces
Number of device interfaces that fall into the corresponding utilization percentage category.
For example, 10 interfaces having 50-70% utilization, 20 interfaces having 70-90% utilization and so on.
The device interface utilization summary is also presented as a pie chart, which shows the number of interfaces that fall into the corresponding distribution percentage range.
Device Name
Device name. For example, 3500XL
Click on the device name to view the respective graph. For more information on the graph, see Interface Utilization Graph.
Interface
Interface monitored in the device. For example, VLAN-77.
Rx Max%
Maximum Rx (received) percentage value.
Rx Avg%
Average Rx (received) percentage value.
Rx Min%
Minimum Rx (received) percentage value.
Tx Max%
Maximum Tx (transmitted) percentage value.
Tx Avg%
Average Tx (transmitted) percentage value.
Tx Min%
Minimum Tx (transmitted) percentage value.
Interface Utilization Graph as shown in Figure 6-5
X-axis
Represents the time period of the report.
The time period refers to the start and end times of the report.
Y-axis
Represents the utilization percentage value.
Figure 6-5 Interface Utilization Graph
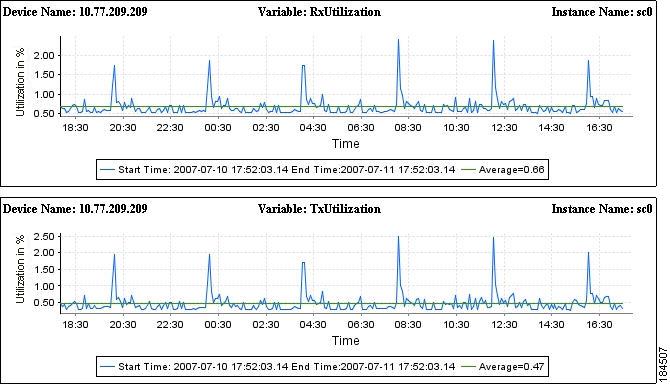
Each data point in the line graph has a tooltip that displays the value for the time period.
Interface Availability
This report displays the interface availability data for each device polled for the Interface Availability template. The information is presented using tables and graphs.
You can only export the report to a file of CSV. For more information, see Exporting a Report.
Use the Copy Quick Report option to generate a PDF format of the report. For more information, see Copying a Quick Report.
Table 6-7 describes the fields in the Interface Availability report.
Table 6-7 Interface Availability Report Fields
Report Name
Name of the report. For example, Interface Availability
Generation Time
Time at which the report was generated.For example, Mon, Apr 21 2008, 12:44:08
No. of Devices
Number of devices included while generating the report.
No. of Interfaces
Number of interfaces monitored for availability levels.
Start Date
Start date and time of the report data. For example, Sun, Apr 20 2008, 12:44:03
End Date
End date and time of the report data. For example, Mon, Apr 21 2008, 12:44:03
Availability in %
Distribution of interface availability percentage range.
The interface availability percentage distribution range is categorized as 0-10, 10-50, 50-90 and 90-100.
No. of Interfaces
Number of interfaces that fall into the corresponding availability percentage category.
For example, 10 interfaces having 50-90% availability, 20 interfaces having 10-50% availability and so on.
The interface availability summary is also presented as a pie chart, which shows the number of interfaces that fall into the corresponding distribution percentage range.
Device Name
Device name. For example, 3500XL.
Click on the device name to view the respective graph. For more information on the graph, see Interface Availability Graph.
Instance Name
Instance monitored for the corresponding device. For example, VLAN-42.
Availability %
Instance availability percentage for the corresponding device. For example, 90%.
Interface Availability Graph shown in Figure 6-6.
X-axis
Represents the time period of the report.
The time period refers to the start and end times of the report data.
Y-axis
Represents the availability percentage value.
Figure 6-6 Interface Availability Graph
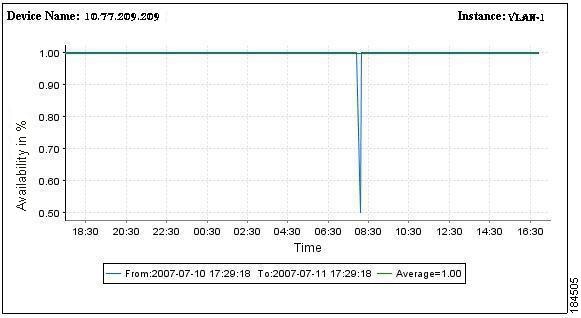
Each data point in the line graph has a tooltip that displays the value for the time period.
Interface Error Rate
This report displays the interface error and discard data for each device polled for the Interface Errors template. The information is presented using tables and graphs. Figure 6-7 shows an example of a Interface Error Rate Report graph.
You can only export the report to a file of CSV. For more information, see Exporting a Report.
Use the Copy Quick Report option to generate a PDF format of the report. For more information, see Copying a Quick Report.
Table 6-8 describes the fields in the Interface Error Rate report.
Figure 6-7 Interface Error Rate Graph
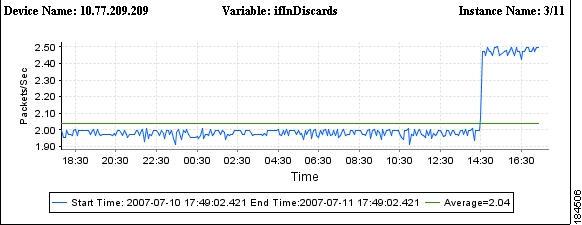
Each data point in the line graph has a tooltip that displays the value for the time period.
Threshold Violation
This report displays the Threshold Violations details for each device based on the polled data. The information is presented using tables.
You can only export the report to a file of CSV. For more information, see Exporting a Report.
This report displays only the latest 1000 Threshold violations. Generate the PDF report to view all violations.
Use the Copy Quick Report option to generate a PDF format of the report. For more information, see Copying a Quick Report.
Table 6-9 describes the fields in the Threshold Violations report.
Copying a Quick Report
You can configure Quick Reports to meet your requirements. You can create new Quick Reports from an existing Quick Report for specific set of devices using the Copy option. You can generate a PDF format of the Quick Report (along with HTML and CSV formats) by selecting Add Full Report option.

Note
For the following reports, if you have selected more than the optimal limit of 3000 interfaces the PDF format of the report might fail to generate:
•
•
•
The Copy option allows you to select devices, configure the schedule and assign a name for the report. It does not allow you to change the MIB variables for a device. This report is listed under the Quick Report tree list.
To copy a Quick Report:
Step 1
The Reports page appears.
Step 2
The list of Quick Reports appear in a tree view.
Step 3
Step 4
The Copy Quick Report dialog box appears in the right pane.
Table 6-10 describes the fields in the Copy Quick Report dialog box.
Table 6-10 Copy Quick Report Fields
Device Selector
All devices and device type groups, in a tree format.
Device Selector shows only the devices that are currently polled by HUM.
Search Input
Enter your search expression in this field. For example, enter the device name to search for devices.
Use the search icon to perform a simple search of devices, after you have entered your search input. For more information, see User Guide for CiscoWorks Common Services 3.2.
Advanced Search
Specify a set of rules to search for devices. For more information, see User Guide for CiscoWorks Common Services 3.2.
All
Click All to view all the devices that are currently being polled by HUM.
Check the checkboxes to select the devices.
Search Results
Results from Simple or Advanced Search.
Selection
Devices that you have selected using the All tab and Search Results tab.
You can do a select all, clear all, or select a few devices from the list.
Last
Enter a value in the text field and select a time frame of your report.
You can enter only full days. You cannot enter fractions of days.
Select the time frame as Days, Weeks, Months or Years from the drop-down list.
For example, 5 Days, 2 Weeks, 3 Months, 2 Years.
From
Specify the start date and time of your report.
Select the date by clicking the calendar icon and time from the drop-down list.
This field is disabled if you have selected Last as the Date Range.
To
Specify the end date and time of your report.
Select the date by clicking the calendar icon and time from the drop-down list.
This field is disabled if you have selected Last as the Date Range.
Run Type
Select one of the following Run Types from the drop-down list:
•
•
•
•
•
If From and To fields are selected in the Date Range field, only Immediate and Once are displayed in the Run Types drop-down list.
Date
Specify the date and time that the job is scheduled for.
The date should be later than the To date specified in the Date Range pane. The time should be later than the current time.
This field is disabled if you have selected Immediate as the Run Type.
Report Name
By default, the Report Name field contains the report name in the following format: Copy of XYZ.
For example, Copy of CPU Utilization, where CPU Utilization is the name of the report that you copied.
However, you can modify the name of the copied report. The report name should also be unique. The name can contain a mix of alphabets, numerals and special characters (such as -_.#@&$).
E-mail ID
Enter the e-mail address to which the job sends messages about the job status.
The E-mail address must be in the format: user@domain.com.
You can enter multiple e-mail addresses, separated by commas.
Configure the SMTP server to send e-mails in the System Preferences dialog box (Common Services > Server > Admin > System Preferences).
We recommend that you configure the CiscoWorks E-mail ID in the System Preferences dialog box (Common Services > Server > Admin > System Preferences).
When the job starts or completes, an e-mail is sent with the CiscoWorks E-mail ID as the sender's address.
Attach Report
Check this checkbox to attach the report as a PDF file. This PDF file is sent to the e-mail address specified in the E-Mail ID field.
You need to enable the E-mail Attachment checkbox and specify the Maximum Attachment size in the System Preferences dialog box (Common Services > Server > Admin > System Preferences) to send the PDF as an E-mail.
If the PDF file size exceeds the Maximum Attachment size, the URL link of the report is sent as an e-mail. You can click the URL link to view the report.
Report Publish Path
Use the Default Path checkbox to publish the report at a specific location.
•
•
–
–
A PDF format of the report (along with HTML and CSV formats) is published to the specified location.
Add Full Report
Use the Add Full Report checkbox to create a PDF format (along with HTML and CSV formats) of the report.
If Add Full Report checkbox is enabled, the PDF format of the report takes longer time to generate as it includes the report for all the polled devices.
For the following reports, if you have selected more than the optimal limit of 3000 interfaces, the PDF format of these reports might not generate:
•
•
•
Note
Step 5
Device Selector shows only the devices that are currently being polled by HUM.
Step 6
•
•
•
By default, the Report Name field contains the report name in the following format: Copy of XYZ
Here, XYZ is the name of the report that you copied. However, you can modify the name of the copied report. This report name should be unique.
See Table 6-10 for the description of fields that appear in the Copy Quick Report dialog box.
Step 7
If you click Create a message appears confirming that the job is created successfully and the Job ID is displayed. You can see the copied report in the Quick Report category tree list.
You can go to the Report Job Browser page to check the status of the Report job. For more information, see Report Job Browser.
CiscoWorks HUM allows you to add your favorite reports to My Favorites category. For more information, see Managing My Favorites.
Note
Editing a Quick Report
You can edit an existing custom Quick Report by selecting a report name and clicking the Edit option. You can edit reports only when the Report Job is in Scheduled state.
The Edit option will not be available for system generated Quick Reports. To edit a custom Quick Report:
Step 1
The Reports page appears.
Step 2
The list of Quick Reports appear in a tree view.
Step 3
Step 4
The Edit Quick Report dialog box appears in the right pane, displaying the earlier settings.
The Edit option is not available in the context menu for system generated Quick Reports.
Step 5
•
•
•
•
You cannot edit the Report Name field.
See Table 6-10 for the description of the fields that appear in the Edit Quick Report dialog box.
Step 6
A message appears confirming that the job is updated successfully.
CiscoWorks HUM allows you to add your favorite reports to My Favorites category. For more information, see Managing My Favorites.
Deleting a Quick Report
You can delete a custom Quick Report by selecting a report name and clicking the Delete option.
The Delete option will not be available for system generated Quick Reports.
To delete a custom Quick Report:
Step 1
The Reports page appears.
Step 2
The list of Quick Reports appear in a tree view.
Step 3
Step 4
A message appears, prompting you to confirm the deletion.
If the report job is periodic, all instances of the report job are also deleted.
Step 5
If you click OK, a message appears confirming that the report job is deleted successfully.
Click
Poller Report
This section explains how to create, edit, copy and view Poller Reports. You can perform the following operations in the Poller Reports panel:
Creating a Poller Report
CiscoWorks HUM allows you to create Poller Reports based on the template added in a given Poller. You can create Poller Reports for any one of the templates in a given Poller.
To create a Poller Report:
Step 1
The Reports page appears.
Step 2
Step 3
The Create Poller Report dialog box appears.
Table 6-11 describes the fields in the Create Poller Report dialog box.
Table 6-11 Create Poller Report Fields
Select Poller
Select a Poller from the drop-down list.
Select Template
Choose a template from the drop-down list. For example, CPU Utilization.
Last
Enter a value in the text field and select a time frame of your report.
You can only enter full days. You cannot enter fractions of days.
Select the time frame as Days, Weeks, Months or Years from the drop-down list.
For example, 5 Days, 2 Weeks, 3 Months, 2 Years.
From
Specify the start date and time of your report.
Select the date by clicking the calendar icon and time from the drop-down list.
This field is disabled if you have selected Last as the Date Range.
To
Specify the end date and time of your report.
Select the date by clicking the calendar icon and time from the drop-down list.
This field is disabled if you have selected Last as the Date Range.
Run Type
Select one of the following Run Types from the drop-down list:
•
•
•
•
•
If From and To fields are selected in the Date Range field, only Immediate and Once are displayed in the Run Types drop-down list.
Date
Specify the date and time the job is scheduled at.
The date should be later than the To date specified in the Date Range pane. The time should be later than the current time.
Report Name
Enter a descriptive name for your report. The name must also be unique.
The report name can contain a mix of alphabets, numerals and special characters (such as -_.#@&$).
E-Mail ID
Enter the e-mail address to which the job sends messages regarding job status.
The E-mail address must be in the format: user@domain.com.
You can enter multiple e-mail addresses, separated by comma.
Configure the SMTP server to send e-mails in the System Preferences dialog box (Common Services > Server > Admin > System Preferences).
We recommend that you configure the CiscoWorks E-mail ID in the System Preferences dialog box (Common Services > Server > Admin > System Preferences).
When the job starts or completes, an e-mail is sent with the CiscoWorks E-mail ID as the sender's address.
Attach Report
Check this checkbox to attach the report as a PDF file. This PDF file is sent to the e-mail addresses specified in the E-Mail ID field.
You need to enable the E-mail Attachment checkbox and specify the Maximum Attachment size in the System Preferences dialog box (Common Services > Server > Admin > System Preferences) to send the PDF as an E-mail.
If the PDF file size exceeds the Maximum Attachment size, the URL link of the report is sent as an e-mail. You can click the URL link to view the report.
Report Publish Path
Use the Default Path checkbox to publish the report at a specific location.
•
•
–
–
A PDF format of the report (along with HTML and CSV formats) is published to the specified location.
Add Full Report
Use the Add Full Report checkbox to create a PDF format of the report (along with HTML and CSV formats) for all devices.
If Add Full Report checkbox is enabled, the PDF format of the report takes longer time to generate as it includes the report for all the polled devices.
Note
Step 4
Step 5
You can select any one of the templates available in the drop-down list.
Step 6
•
•
•
See Table 6-11 for the descriptions of the fields that appear in the Create Poller Report dialog box.
Step 7
If you click Create a message appears confirming that the job is created successfully and the Job ID is displayed.
You can see the created report in the Poller Report category tree list.
You can go to the Report Job Browser page to check the status of the Report job. For more information, see Report Job Browser.
Note
Editing a Poller Report
You can edit an existing Poller Report by selecting a report name and clicking the Edit option. You can edit only the Date Range, Schedule and Report Information panes. You cannot edit Select Poller, Select Template and Report Name fields.
You cannot edit reports that are in Successful, Failed or Running state.
To edit a Poller Report:
Step 1
The Reports page appears.
Step 2
The list of Poller Reports appear in a tree view.
Step 3
Step 4
The Edit Poller Report dialog box appears, displaying the earlier settings.
Table 6-12 describes the fields in the Edit Poller Report dialog box.
Table 6-12 Edit Poller Report Fields
Select Poller
Displays the Poller name.
You cannot select any other Poller from the drop-down list.
Select Template
Displays the template name.
You cannot select any other template from the drop-down list.
Last
Enter a value in the text field and select a time frame of your report.
You can only enter full days. You cannot enter fractions of days.
Select the time frame as Days, Weeks, Months or Years from the drop-down list.
For example, 5 Days, 2 Weeks, 3 Months, 2 Years
From
Specify the start date and time of your report.
Select the date by clicking the calendar icon and time from the drop-down list.
This field is disabled if you have selected Last as the Date Range.
To
Specify the end date and time of your report.
Select the date by clicking the calendar icon and time from the drop-down list.
This field is disabled if you have selected Last as the Date Range.
Run Type
Select one of the following Run Types from the drop-down list:
•
•
•
•
If From and To fields are selected in the Date Range field, only Immediate and Once are displayed in the Run Types drop-down list.
Date
Specify the date and time the job is scheduled at.
The date should be later than the To date specified in the Date Range pane. The time should be later than the current time.
Report Name
You cannot edit the Report Name field.
E-Mail ID
Enter e-mail address to which the job sends messages regarding job status.
The E-mail address must be in the format: user@domain.com.
You can enter multiple e-mail addresses, separated by commas.
Configure the SMTP server to send e-mails in the System Preferences dialog box (Common Services > Server > Admin > System Preferences).
We recommend that you configure the CiscoWorks E-mail ID in the System Preferences dialog box (Common Services > Server > Admin > System Preferences).
When the job starts or completes, an e-mail is sent with the CiscoWorks E-mail ID as the sender's address.
Attach Report
Check this checkbox to attach the report as a PDF file. This PDF file is sent to the e-mail address specified in the E-Mail ID field.
You need to enable the E-mail Attachment checkbox and specify the Maximum Attachment size in the System Preferences dialog box (Common Services > Server > Admin > System Preferences) to send the PDF as an E-mail.
If the PDF file size exceeds the Maximum Attachment size, the URL link of the report is sent as an e-mail. You can click the URL link to view the report.
Report Publish Path
Use the Default Path checkbox to publish the report at a specific location.
•
•
–
–
A PDF format of the report (along with HTML and CSV formats) is published to the specified location.
Add Full Report
Use the Add Full Report checkbox to create a PDF format of the report (along with HTML and CSV formats) for all devices.
If Add Full Report checkbox is enabled, the PDF format of the report takes longer time to generate as it includes the report for all the polled devices.
Note
Step 5
•
•
•
See Table 6-12 for the description of the fields that appear in the Edit Poller Report dialog box.
Step 6
A message appears confirming that the job is updated successfully.
Copying a Poller Report
You can create a copy of an existing Poller Report by selecting a report name and clicking the Copy option. You cannot edit Select Poller and Select Template fields.
To copy a Poller Report:
Step 1
The Reports page appears.
Step 2
The list of Poller Reports appear in a tree view.
Step 3
Step 4
The Copy Poller Report dialog box appears, displaying the settings in the existing report.
Table 6-13 describes the fields in the Copy Poller Report dialog box.
Table 6-13 Copy Poller Report Fields
Select Poller
Displays the Poller name.
You cannot select any other Poller from the drop-down list.
Select Template
Displays the template name.
You cannot select any other template from the drop-down list.
Last
Enter a value in the text field and select a time frame of your report.
You can only enter full days. You cannot enter fractions of days.
Select the time frame as Days, Weeks, Months or Years from the drop-down list.
For example, 5 Days, 2 Weeks, 3 Months, 2 Years.
From
Specify the start date and time of your report.
Select the date by clicking the calendar icon and time from the drop-down list.
This field is disabled if you have selected Last as the Date Range.
To
Specify the end date and time of your report.
Select the date by clicking the calendar icon and time from the drop-down list.
This field is disabled if you have selected Last as the Date Range.
Run Type
Select one of the following Run Types from the drop-down list:
•
•
•
•
•
If From and To fields are selected in the Date Range field, only Immediate and Once are displayed in the Run Types drop-down list.
Date
Specify the date and time the job is scheduled at.
The date should be later than the To date specified in the Date Range pane. The time should be later than the current time.
Report Name
By default, the Report Name field contains the report name in the following format: Copy of XYZ.
For example, Copy of CPUPoller where CPUPoller is the name of the report that you copied.
However, you can modify the name of the copied report. This report name should be unique. The name can contain a mix of alphabets, numerals and special characters (such as -_.#@&$).
E-Mail ID
Enter e-mail address to which the job sends messages regarding job status.
The E-mail address must be in the format: user@domain.com.
You can enter multiple e-mail addresses, separated by commas.
Configure the SMTP server to send e-mails in the System Preferences dialog box (Common Services > Server > Admin > System Preferences).
We recommend that you configure the CiscoWorks E-mail ID in the System Preferences dialog box (Common Services > Server > Admin > System Preferences).
When the job starts or completes, an e-mail is sent with the CiscoWorks E-mail ID as the sender's address.
Attach Report
Check this checkbox to attach the report as a PDF file. This PDF file is sent to the e-mail address specified in the E-Mail ID field.
You need to enable the E-mail Attachment checkbox and specify the Maximum Attachment size in the System Preferences dialog box (Common Services > Server > Admin > System Preferences) to send the PDF as an E-mail.
If the PDF file size exceeds the Maximum Attachment size, the URL link of the report is sent as an e-mail. You can click the URL link to view the report.
Report Publish Path
Use the Default Path checkbox to publish the report at a specific location.
•
•
–
–
A PDF format of the report (along with HTML and CSV formats) is published to the specified location.
Add Full Report
Use the Add Full Report checkbox to create a PDF format of the report (along with HTML and CSV formats) for all devices.
If Add Full Report checkbox is enabled, the PDF format of the report takes longer time to generate as it includes the report for all the polled devices.
Note
Step 5
•
•
•
See Table 6-13 for the description of the fields that appear in the Copy Poller Report dialog box.
Step 6
If you click Create a message appears confirming that the job has been created successfully and the Job ID is displayed.
You can go to the Report Job Browser page to check the status of the Report job. For more information, see Report Job Browser.
You can see the copied report in the Poller Report category tree list.
CiscoWorks HUM allows you to add your favorite reports to My Favorites category. For more information, see Managing My Favorites.
Viewing a Poller Report
You can view a Poller Report either by clicking the report name or by clicking the Launch option.
If data for a report is not available, a message appears,
Report Not Available. This message appears because information is not available for the specified duration or the report job has failed.To view a Poller Report:
Step 1
The Reports page appears.
Step 2
The list of Quick Reports appear in a tree view.
Step 3
Step 4
The corresponding report page appears, displaying the report details. For more information, see Understanding Poller Reports.
Click
CiscoWorks HUM allows you to add your favorite reports to My Favorites category. For more information, see Managing My Favorites.
You can also copy the URL of a report to clipboard. For more information, see Copying a Report Link.
Understanding Poller Reports
This section provides you details on the fields available in a Poller Report. The information in the Poller Report is presented using tables and graphs. Figure 6-8 shows an example of a Poller Report graph displaying CPU Utilization data.
The Poller Report displays only the latest 1000 MIB variable instances for all the devices. Export the report to PDF to view data for all the MIB variable instances.
You can export the report to a file of PDF or CSV. For more information, see Exporting a Report.
Table 6-14 describes the fields in the Poller Report.
Figure 6-8 Poller Report - CPU Utilization
Each data point in the line graph has a tooltip that displays the value for the time period.
Deleting a Poller Report
You can delete a Poller Report by selecting a report name and clicking the Delete option.
To delete a Poller Report:
Step 1
The Reports page appears.
Step 2
The list of Poller Reports appear in a tree view.
Step 3
Step 4
A message appears, prompting you to confirm the deletion.
If the report job is periodic, all instances of the report job are also deleted.
Step 5
If you click OK, a message appears confirming that the report job is deleted successfully.
Click
Custom Report
CiscoWorks HUM allows you to create reports of MIB variables that are common to all Pollers or specific to a Poller polled by HUM. These reports are called Custom Reports.
This section explains how to create, edit, copy and view Custom Reports. You can perform the following operations in Custom Reports:
Creating a Custom Report
You can create a Custom Report by selecting the Custom Reports category and clicking the Create option.
To create a Custom Report:
Step 1
The Reports page appears.
Step 2
Step 3
The Create Custom Report dialog box appears.
Table 6-15 describes the fields in the Create Custom Report dialog box.
Table 6-15 Create Custom Report Fields
Device Selector
All devices and device type groups, in a tree format.
Device Selector shows only the devices that are currently being polled by HUM.
Search Input
Enter your search expression in this field.
You can enter the device name.
Search
Use the search icon to perform a simple search of devices, after you have entered your search input.
For more information on how to use Device Selector, see User Guide for CiscoWorks Common Services 3.2.
Advanced Search
Search for devices by specifying a set of rules.
For more information on Advanced Search, see User Guide for CiscoWorks Common Services 3.2.
All
Click All to view all the devices that are currently being polled by HUM.
Check the checkboxes to select the devices.
Search Results
All Simple or Advanced search results. You can do a select all, clear all, or select a few devices from the list.
Selection
Devices that you have selected using the All tab and Search Results tab.
Poller Selector
All the configured Pollers, in a tree format.
Poller Selector shows only the Pollers that are currently being polled by HUM.
You can use the search icon to perform a simple search of Pollers, after you have entered your search input. Advanced Search is not available for Poller Selector.
Show MIB Variables
(button)
Lists all the MIB variables that are common to the selected devices or Pollers in the MIB Variables pane.
Filter Source
Enter the MIB variable name or OID in the text field and click GO.
The following criteria and conditions are available as a drop-down list. Use them to filter your expression:
Criteria:
•
•
Condition:
•
•
•
Variable Name
Displays the MIB variable name. For example, ifInOctets
OID
Displays the Object Identifier of the MIB variable. For example, 1.3.6.1.2.1.2.2.1.10
Last
Enter a numeric value in the text field and select a time frame of your report.
You can only enter full days. You cannot enter fractions of days.
Select the time frame as Days, Weeks, Months or Years from the drop-down list.
For example, 5 Days, 2 Weeks, 3 Months, 2 Years.
From
Specify the start date and time of your report.
Select the date by clicking the calendar icon and time from the drop-down list.
This field is disabled if you have selected Last as the Date Range.
To
Specify the end date and time of your report.
Select the date by clicking the calendar icon and time from the drop-down list.
This field is disabled if you have selected Last as the Date Range.
Run Type
Select one of the following Run Types from the drop-down list:
•
•
•
•
•
If From and To fields are selected in the Date Range field, only Immediate and Once are displayed in the Run Types drop-down list.
Date
Specify the date and time the job is scheduled at.
The date should be later than the To date specified in the Date Range pane. The time should be later than the current time.
Report Name
Enter a name for your report. The report name should be unique.
The name can contain a mix of alphabets, numerals and special characters (such as -_.#@&$).
E-mail ID
Enter e-mail address to which the job sends messages regarding job status.
The E-mail address must be in the format: user@domain.com.
You can enter multiple e-mail addresses, separated by comma.
Configure the SMTP server to send e-mails in the System Preferences dialog box (Common Services > Server > Admin > System Preferences).
We recommend that you configure the CiscoWorks E-mail ID in the System Preferences dialog box (Common Services > Server > Admin > System Preferences).
When the job starts or completes, an e-mail is sent with the CiscoWorks E-mail ID as the sender's address.
Attach Report
Check this checkbox to attach the report as a PDF file. The PDF file is sent to the e-mail address specified in the E-mail ID field.
You need to enable the E-mail Attachment checkbox and specify the Maximum Attachment size in the System Preferences dialog box (Common Services > Server > Admin > System Preferences) to send the PDF as an E-mail.
If the PDF file size exceeds the Maximum Attachment size, the URL link of the report is sent as an e-mail. You can click the URL link to view the report.
Report Publish Path
Use the Default Path checkbox to publish the report at a specific location.
•
•
–
–
A PDF format of the report (along with HTML and CSV formats) is published to the specified location.
Add Full Report
Use the Add Full Report checkbox to create a PDF format of the report (along with HTML and CSV formats) for all devices.
If Add Full Report checkbox is selected, the PDF format of the report takes longer time to generate as it includes the report for all the polled devices.
Note
Step 4
Based on your selection either a list of devices or pollers is listed, in a tree format.
Step 5
Step 6
This lists all the MIB variables that are common to the selected devices or pollers in the MIB Variables pane.
Step 7
Step 8
You can use the Filter Source option to select MIB variables, based on the criteria available in the drop-down list.
See Table 6-15 for a description on how to use Filter Source option in MIB Variables pane.
Step 9
•
•
•
See Table 6-15 for the description of the fields that appear in the Create Custom Report dialog box.
Step 10
If you click Create a message appears confirming that the job is created successfully and the Job ID is displayed. You can see the created report in the Custom Report category tree list.
You can go to the Report Job Browser page to check the status of the Report job. For more information, see Report Job Browser. CiscoWorks HUM allows you to add your favorite reports to My Favorites category. For more information, see Managing My Favorites.
Note
Editing a Custom Report
You can edit an existing Custom Report by selecting a report name and clicking the Edit option. You can edit reports only when the Report job is in scheduled state.
You cannot edit the Report Name field.
To edit a Custom Report:
Step 1
The Reports page appears.
Step 2
The list of Custom Reports appear in a tree view.
Step 3
Step 4
The Edit Custom Report dialog box appears in the right pane, displaying the earlier settings.
Step 5
Based on your selection either a list of devices or pollers is listed, in a tree format.
Step 6
Step 7
This lists all the MIB variables that are common to the selected devices or Pollers in the MIB Variables pane.
Step 8
Step 9
You can use the Filter Source option to filter the MIB variables, based on the criteria in the drop-down list.
See Table 6-15 for a description on how to use the Filter Source option in MIB Variables pane.
Step 10
•
•
•
You cannot edit the Report Name field.
See Table 6-15 for the description of the fields that appear in the Edit Custom Report dialog box.
Step 11
A message appears confirming that the job is updated successfully and the Job ID is displayed. You can go to the Report Job Browser page to check the status of the Report job. For more information, see Report Job Browser.
Copying a Custom Report
CiscoWorks HUM allows you to create a new Custom Report from an existing Custom Report by selecting the report and clicking the Copy option.
You can modify the existing details available in the copied custom report and can also update the report name.
To copy a Custom Report:
Step 1
The Reports page appears.
Step 2
The list of Custom Reports appear in a tree view.
Step 3
Step 4
The Copy Custom Report dialog box appears, displaying the earlier settings.
Step 5
Based on your selection either a list of devices or pollers is listed, in a tree format.
Step 6
Step 7
This lists all the MIB variables that are common to the selected devices or Pollers in the MIB Variables pane.
Step 8
Step 9
You can use the Filter Source option to select MIB variables based on the criteria in the drop-down list.
See Table 6-15 for details on using the Filter Source option in the MIB Variables pane.
Step 10
•
•
•
By default, the Report Name field contains the report name in this format: Copy of XYZ. Here, XYZ is the name of the report that you copied. However, you can modify the name of the copied report by providing a descriptive name.
See Table 6-15 for the description of the fields that appear in the Copy Custom Report dialog box.
Step 11
If you click Create a message appears confirming that the job is created successfully and the Job ID is displayed. You can see the copied custom report in the Custom Report category tree list.
You can go to the Report Job Browser page to check the status of the Report job. For more information, see Report Job Browser. CiscoWorks HUM allows you to add your favorite reports to My Favorites category. For more information, see Managing My Favorites.
Note
Viewing a Custom Report
You can view a Custom Report by either clicking the report name or by clicking the Launch option.
If data for a report is not available, a message appears,
Report Not Available. This message appears because information is not available for the specified duration or the report job has failed.To view a Custom Report:
Step 1
The Reports page appears.
Step 2
The list of Custom Reports appear in a tree view.
Step 3
Step 4
The corresponding Report page appears, displaying the report details. For more information, see Understanding Custom Reports.
Click
CiscoWorks HUM allows you to add your favorite reports to My Favorites category. For more information, see Managing My Favorites.
You can also copy the URL of a report to clipboard. For more information, see Copying a Report Link.
Understanding Custom Reports
This section describes the fields available in a Custom Report. The information in the Custom Report is presented using tables and graphs. Figure 6-9 shows an example of a Custom Report graph displaying Environmental Temperature of a MIB variable.
The Custom Report displays only the latest 1000 MIB variable instances for all the devices. Export the report to PDF to view data for all the MIB variable instances.
You can export the report to a file of PDF or CSV. For more information, see Exporting a Report.
Table 6-16 describes the fields in a Custom Report.
Figure 6-9 Custom Report - Environmental Temperature
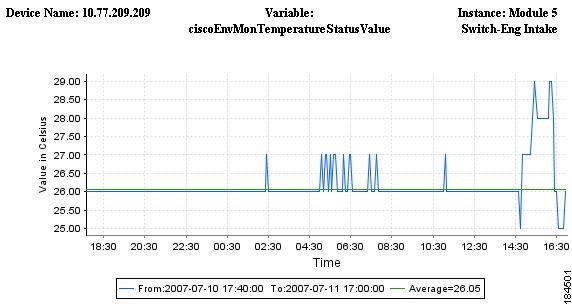
Each data point in the line graph has a tooltip that displays the value for the time period.
Deleting a Custom Report
You can delete a Custom Report by selecting a report name and clicking the Delete option. You can delete reports only when the Report Job is in Scheduled state.
To delete a Custom Report:
Step 1
The Reports page appears.
Step 2
The list of Custom Reports appear in a tree view.
Step 3
Step 4
A message appears, prompting you to confirm the deletion.
If the report job is periodic, all instances of the report job are also deleted.
Step 5
If you click OK, a message appears confirming that the report job is deleted successfully.
Click
Threshold Violations Report
CiscoWorks HUM allows you to create reports based on the threshold configured for the MIB variable. You can create, edit, copy, and view reports for specific threshold MIB variables.
You can perform the following operations in Threshold Violation Reports panel:
•
•
•
•
•
Creating a Threshold Violation Report
You can create a Threshold Violation Report by selecting the Threshold Violations Report category and clicking the Create option.
To create a Threshold Violation Report:
Step 1
The Reports page appears.
Step 2
Step 3
The Create Threshold Violation Report dialog box appears.
Table 6-17 describes the fields in the Create Threshold Violation Report dialog box.
Table 6-17 Create Threshold Violation Report Fields
Device Selector
All the devices and device type groups that are currently being polled by HUM, in a tree format.
Search Input
Enter your search expression in this field.
You can enter the device name. For example, 3500XL.
Search
Use the search icon to perform a simple search of devices, after you have entered your search input.
For more information on how to use Device Selector, see User Guide for CiscoWorks Common Services 3.2.
Advanced Search
Search for devices by specifying a set of rules.
For more information on Advanced Search, see User Guide for CiscoWorks Common Services 3.2.
All
Click All to view all the devices that are currently being polled by HUM.
Check the checkboxes to select the devices.
Search Results
Results from Search or Advanced Search.
Selection
Devices that you have selected using the All tab and Search Results tab.
Threshold Selector
All configured Thresholds, in a tree format.
Threshold Selector shows only the Thresholds that are currently being configured in HUM.
You can use the search icon to perform a simple search of Thresholds, after you have entered your search input. Advanced Search is not available for Threshold Selector.
Last
Enter a value in the text field and select a time frame of your report.
You can only enter full days. You cannot enter fractions of days.
Select the time frame as Days, Weeks, Months or Years from the drop-down list.
For example, 5 Days, 2 Weeks, 3 Months, 2 Years.
From
Specify the start date and time of your report.
Select the date by clicking the calendar icon and time from the drop-down list.
This field is disabled if you have selected Last as the Date Range.
To
Specify the end date and time of your report.
Select the date by clicking the calendar icon and time from the drop-down list.
This field is disabled if you have selected Last as the Date Range.
Run Type
Select one of the following Run Types from the drop-down list:
•
•
•
•
•
If From and To fields are selected in the Date Range field, only Immediate and Once are displayed in the Run Types drop-down list.
Date
Specify the date and time of the job schedule.
The date should be later than the To date specified in the Date Range pane. The time should be later than the current time.
This field is disabled if you have selected Immediate as the Run Type.
Report Name
Enter a name for your report. The report name should be unique.
The name can contain a mix of alphabets, numerals and special characters (such as -_.#@&$).
E-Mail ID
Enter e-mail address to which the job sends messages regarding job status.
The E-mail address must be in the format: user@domain.com.
You can enter multiple e-mail addresses, separated by comma.
Configure the SMTP server to send e-mails in the System Preferences dialog box (Common Services > Server > Admin > System Preferences).
We recommend that you configure the CiscoWorks E-mail ID in the System Preferences dialog box (Common Services > Server > Admin > System Preferences).
When the job starts or completes, an e-mail is sent with the CiscoWorks E-mail ID as the sender's address.
Attach Report
Check this checkbox to attach the report as a PDF file. The PDF file is sent to the e-mail address specified in the E-Mail ID field.
You need to enable the E-mail Attachment checkbox and specify the Maximum Attachment size in the System Preferences dialog box (Common Services > Server > Admin > System Preferences) to send the PDF as an E-mail.
If the PDF file size exceeds the Maximum Attachment size, the URL link of the report is sent as an e-mail. You can click the URL link to view the report.
Report Publish Path
Use the Default Path checkbox to publish the report at a specific location.
•
•
–
–
A PDF format of the report (along with HTML and CSV formats) is published to the specified location.
Step 4
Based on your selection either a list of devices or thresholds is listed, in a tree format.
Step 5
Step 6
•
•
•
See Table 6-17 for the description of the fields that appear in the Create Threshold Violation Report dialog box.
Step 7
If you click Create a message appears confirming that the job is created successfully and the Job ID is displayed. You can see the created report in the Threshold Violations Report category tree list.
You can go to the Report Job Browser page to check the status of the Report job. For more information, see Report Job Browser.
Note
Editing a Threshold Violation Report
You can edit an existing Threshold Violation Report by selecting a report name and clicking the Edit option.
You can edit Report Jobs only when the Run Status is in scheduled state. You cannot edit the Report Name field.
To edit a Threshold Violation Report:
Step 1
The Reports page appears.
Step 2
The list of Threshold Violations Reports appear in a tree view.
Step 3
Step 4
The Edit Threshold Violation Report dialog box appears, displaying the earlier settings.
Step 5
Based on your selection either a list of devices or thresholds is listed, in a tree format.
Step 6
Step 7
•
•
•
You cannot edit the Report Name field.
See Table 6-17 for the description of the fields that appear in the Edit Threshold Violation Report dialog box.
Step 8
A message appears confirming that the job has updated successfully.
You can go to the Report Job Browser page to check the status of the Report job. For more information, see Report Job Browser.
Copying a Threshold Violation Report
CiscoWorks HUM allows you to create a Threshold Violation report from an existing report by clicking the Copy option.
You can modify the existing details available in the copied Threshold Violation report.
To copy a Threshold Violation Report:
Step 1
The Reports page appears.
Step 2
The list of Threshold Violation Reports appear in a tree view.
Step 3
Step 4
The Copy Threshold Violation Report dialog box appears, displaying the earlier settings.
Step 5
Based on your selection either a list of devices or thresholds is listed, in a tree format.
Step 6
Step 7
•
•
•
By default, the Report Name field contains the report name in the following format: Copy of XYZ
Here, XYZ is the name of the report that you copied. However, you can modify the name of the copied report. This report name should be unique. See Table 6-17 for the description of the fields that appear in the Copy Threshold Violation Report dialog box.
Step 8
If you click Create a message appears confirming that the job is created successfully and the Job ID is displayed. You can see the copied report in the Threshold Violation Report category tree list.
You can go to the Report Job Browser page to check the status of the Report job. For more information, see Report Job Browser. CiscoWorks HUM allows you to add your favorite reports to My Favorites category. For more information, see Managing My Favorites.
Note
Viewing a Threshold Violation Report
You can view a Threshold Violation Report by either clicking the report name or by clicking the Launch option.
If data for a report is not available, a message appears,
Report Not Available. This message appears because information is not available for the specified duration or the report job has failed.To view a Threshold Violation Report:
Step 1
The Reports page appears.
Step 2
The list of Threshold Violations Reports appear in a tree view.
Step 3
Step 4
The corresponding report page appears, displaying the report details. For more information, see Understanding Threshold Violation Reports.
Click
CiscoWorks HUM allows you to add your favorite reports to My Favorites category. For more information, see Managing My Favorites.
You can also copy the URL of a report to clipboard. For more information, see Copying a Report Link.
Understanding Threshold Violation Reports
This section describes the fields available in a Threshold Violation Report. The information in the Threshold Violation Report is presented using tables.
The Threshold Violation Report displays data only for the latest 1000 Threshold violations. Export the report to PDF to view all violations.
You can export the report to a file of PDF or CSV. For more information, see Exporting a Report.
Table 6-18 describes the fields in a Threshold Violation Report.
Deleting a Threshold Violation Report
You can delete a Threshold Violation Report by selecting a report name and clicking the Delete option. You can delete reports only when the Report Job is in Scheduled state.
To delete a Threshold Violation Report:
Step 1
The Reports page appears.
Step 2
The list of Threshold Violations Reports appear in a tree view.
Step 3
Step 4
A message appears, prompting you to confirm the deletion.
If the report job is periodic, all the instances of the report job are also deleted.
Step 5
If you click OK, a message appears confirming that the report job is deleted successfully.
Click
Managing My Favorites
CiscoWorks HUM allows you to manage your list of favorites reports from My Favorites category.
You can perform the following operations to your list of favorite reports:
Viewing a Report
CiscoWorks HUM allows you to launch and view a report added to My Favorites category.
To view a report from My Favorites:
Step 1
The Reports page appears.
Step 2
The list of reports added to My Favorites appear in a tree view.
Step 3
Step 4
The corresponding report page appears, displaying the report details.
Click
Editing a Report
CiscoWorks HUM allows you to edit the properties of a report added to My Favorites category. You can edit reports only when the Report Job is in Scheduled state.
The Edit option will not be available for system generated Quick Reports.
To edit a report from My Favorites:
Step 1
The Reports page appears.
Step 2
The list of reports added to My Favorites appear in a tree view.
Step 3
Step 4
The corresponding Edit Report dialog box appears, displaying the earlier settings.
Click
Removing a Report
CiscoWorks HUM allows you to use the Remove From Favorites option to remove a report from My Favorites category. This option will not remove the report from the actual report category node.
To remove a report from My Favorites:
Step 1
The Reports page appears.
Step 2
The list of reports added to My Favorites appear in a tree view.
Step 3
Step 4
A message appears, prompting you to confirm the operation.
Step 5
If you click OK, the report is removed from My Favorites category node.
Click
Deleting a Report
CiscoWorks HUM allows you to use the Delete option to delete a report from My Favorites category. This option will also delete the report from the actual report category node.
To delete a report from My Favorites:
Step 1
The Reports page appears.
Step 2
The list of reports added to My Favorites appear in a tree view.
Step 3
Step 4
A message appears, prompting you to confirm the deletion.
If the report job is periodic, all instances of the report job are also deleted.
Step 5
If you click OK, a message appears confirming that the report job is deleted successfully.
Click
Note
Copying a Report Link
CiscoWorks HUM allows you to copy the URL of a report by using the Copy Link option.
Note
To copy a report link:
Step 1
The Reports page appears.
Step 2
The list of reports appear in a tree view.
Step 3
Step 4
The URL for the corresponding report is copied to the clipboard. You can paste this URL to a Web browser, text editor or to an e-mail.
Click
Exporting a Report
CiscoWorks HUM allows you to export the report to a file of CSV or PDF format. By default, HUM exports the report to a file of CSV format. To export the report in PDF format, you must enable the Add Full Report option while generating the report.
To export a report:
Step 1
The Exporting Report dialog box appears.
Step 2
Step 3
The generated report in either CSV or PDF format is exported to the specified location.
Note
Report Job Browser
Report Job Browser allows you to view the list of report jobs scheduled to generate reports. From the Report Job Browser, you can perform report job management activities such as viewing the details of a report job, deleting a report job, suspending a report job, resuming a report job and viewing a report.
System jobs are not shown in the Report Job Browser.
To access the Report Job Browser page go to LMS Portal and select Health and Utilization Monitor > Reports > Report Job Browser.
Table 6-19 describes the fields and buttons in the Report Job Browser dialog box.
Table 6-19 Report Job Browser Fields and Buttons
Job ID
Unique ID assigned for a Report job by HUM.
For periodic jobs such as Daily, Weekly, Monthly and Yearly, the Job IDs are in the number.x format. The x represents the number of instances of the job.
For example, 1001.3 indicates that it is the third instance of the Job ID 1001.
Description
Name of the report.
Type
Report type such as:
•
•
•
•
Run Status
Status of a Report job.
The following status is displayed against each Job ID:
•
•
•
•
•
•
•
Schedule Type
Type of schedule assigned to generate the report:
•
•
•
•
•
Scheduled Time
Date and time the job is scheduled at.
Completed
Date and time at which the job was completed.
Delete
(button)
Deletes a Report job. See Deleting a Report Job.
Suspend
(button)
Suspends the scheduled job. See Suspending a Scheduled Report Job.
Resume
(button)
Resumes the suspended job. See Resuming a Suspended Report Job.
View Output
(button)
Shows the generated report for the job. See Viewing the Generated Report.
Filter
(button)
Filters information based on the criteria that you select from the drop-down list. The drop-down list contain the following criteria:
•
•
•
You can perform the following tasks from the Report Job Browser dialog box:
•
•
•
•
Viewing the Generated Report
You can view the report for a Report job using the View Output button on the Report Job Browser dialog box.
To view a report:
Step 1
The Report Job Browser dialog box appears.
Step 2
You can view the report only for the Report job that have partially or successfully completed.
Step 3
The corresponding report page appears, displaying the details of the report using tables and graphs.
If there is no information available for the specific duration or the report job failed to generate the report, a message appears,
Report Not Available.
Viewing the Job Details of a Report Job
You can view the configuration and the results of a Report job by clicking on the Job ID (a hyperlink) on the Report Job Browser dialog box.
To view the configuration of a Report job:
Step 1
The Report Job Browser dialog box appears.
Step 2
A pop-up appears, displaying the configuration details for the Report job.
Table 6-20 describes the fields in the Configuration Details page.
Step 3
Filtering the Report Job Browser
This section describes how to use the filter option to display the Report job information based on specific criteria.
To filter a Report job:
Step 1
The Report Job Browser dialog box appears.
Step 2
Table 6-21 describes on the criteria you can use to filter.
Step 3
If you select the Run Status as the criteria, a corresponding drop-down list displays various options to filter.
Step 4
The Report Job Browser dialog box appears, displaying the Report job information based on the filter criteria.
Suspending a Scheduled Report Job
You can suspend a scheduled job by using the Suspend button on the Report Job Browser dialog box.
To suspend a Report job:
Step 1
The Report Job Browser dialog box appears.
Step 2
You can select multiple report jobs with scheduled status by checking their respective Job ID checkboxes.
Step 3
A message appears, prompting you to confirm the operation.
Step 4
If you click OK, a message appears confirming that the Report job is suspended.
The Report Job Browser dialog box appears.
Resuming a Suspended Report Job
You can resume a suspended job by using the Resume button on the Report Job Browser dialog box.
To resume a Report job:
Step 1
The Report Job Browser dialog box appears.
Step 2
You can select multiple Report jobs with suspended status by checking their respective Job ID checkboxes.
Step 3
A message appears, prompting you to confirm the operation.
Step 4
If you click OK, a message appears confirming that the Report job is resumed.
The Report Job Browser dialog box appears.
Deleting a Report Job
You can delete one or more Report jobs using the Delete button on the Report Job Browser dialog box.
Before a Report job is deleted, you are prompted to confirm the deletion because you cannot restore a Report job that you have deleted from the database. If you delete a Report job, you need to recreate the report again and schedule it in the Report Job Browser to generate reports.
To delete a Report job:
Step 1
The Report Job Browser dialog box appears.
Step 2
You can select multiple Job IDs by checking their respective checkboxes.
You can delete Report jobs that are in the following Run Status:
•
•
•
•
•
•
Step 3
A message appears, prompting you to confirm the deletion.
If periodic jobs are selected, a pop-up message appears prompting you to confirm the deletion of all the instances of the report job.
Step 4
If you click OK, a message appears that the Report job is deleted successfully.
The Report Job Browser dialog box appears.
 Feedback
Contact Cisco
- Open a Support Case

- (Requires a Cisco Service Contract)