|
Time list
|
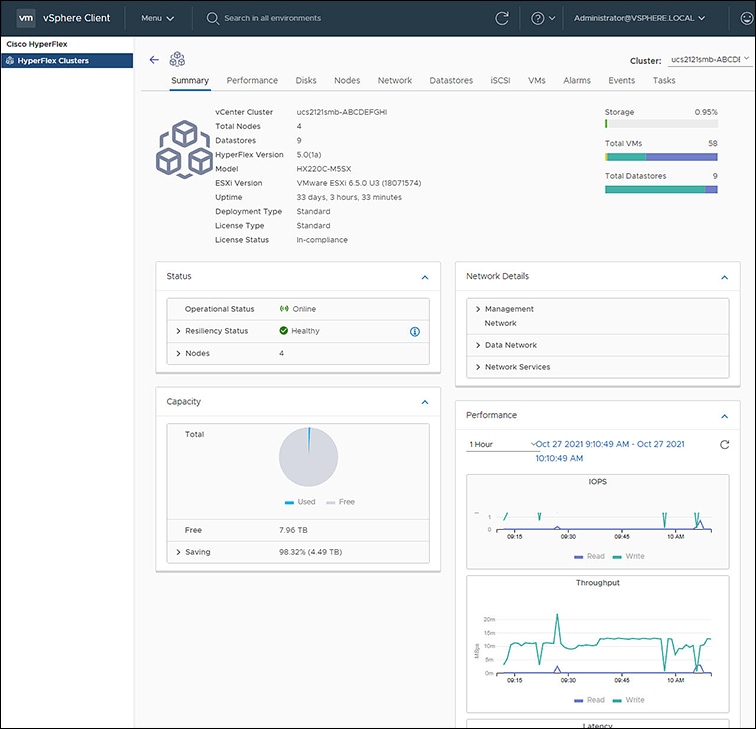
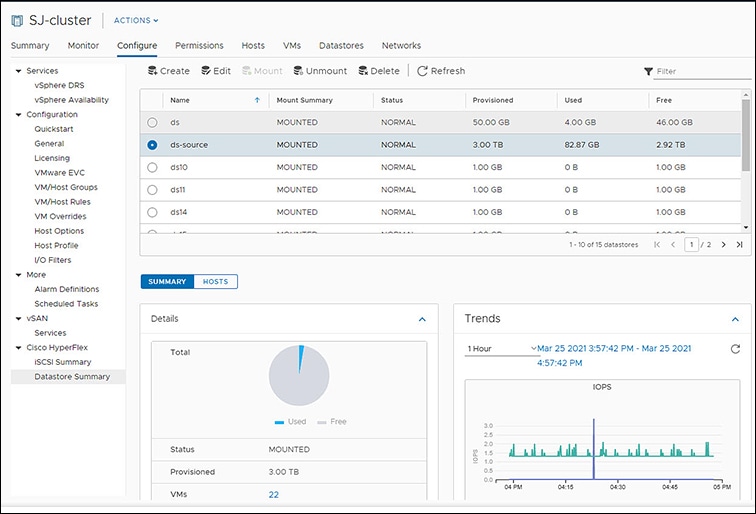
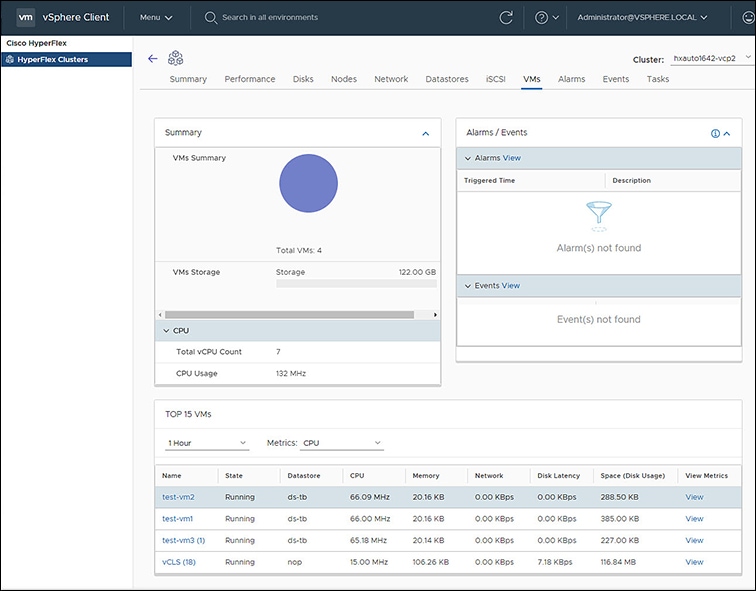
Specify the measurement of time to show the top 15 VMs. List options include: 1 Hour, 1 Day, or 1 Week.
|
|
Metrics List
|
Select the metric type used to populate the table. Options include: CPU, Memory, Disk Latency, Network, and Space.
-
CPU, Memory, Disk Latency, Network - only report metrics for VMs in a running condition. VMs that are switched off are not
included.
-
Space - counts all VMs regardless of their state.
|
|
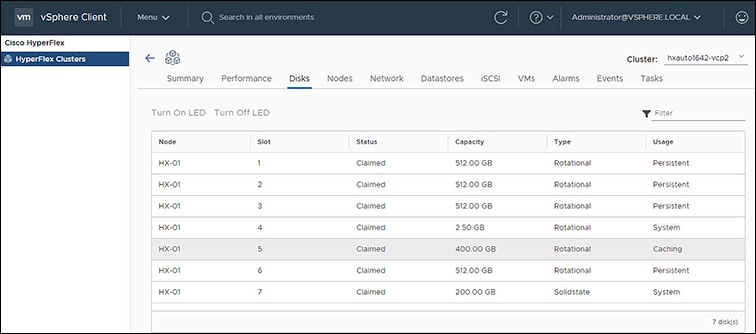
Name
|
VM Name - Clicking on the VM name redirects users to the graph or monitoring page of VM being viewed in vCenter.
|
|
State
|
Current state of the VM. Valid values are Running, Off and Suspended.
|
|
Datastore
|
Datastore Name
|
|
CPU
|
CPU usage in megahertz used durineg the interval.
|
|
Memory
|
Amount of host physical memory consumed for backing up guest physical memory pages.
|
|
Disk Latency
|
Highest latency value across all disks used by the host
|
|
Network Throughput
|
Network utilization during the interval (combined transmit and receive rates).
|
|
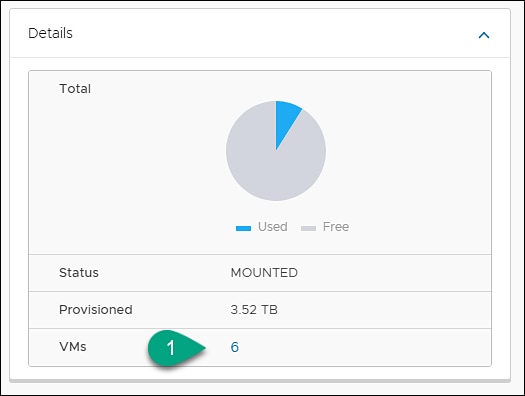
Space (Disk Usage)
|
Amount of disk space the VM is using
|
|
View Metrics
|
Link to view CPU, Memory, Disk Latency, and Network Throughput performance tables for that specified VM. The usage values
displayed are for the five-minute average for all.
Use the hover feature to display the matrices simultaneously and evaluate any visible spikes in the data.
|


 Feedback