Smart Monitoring and Alerting on Cisco MDS 9000 Series Switches
Available Languages
Bias-Free Language
The documentation set for this product strives to use bias-free language. For the purposes of this documentation set, bias-free is defined as language that does not imply discrimination based on age, disability, gender, racial identity, ethnic identity, sexual orientation, socioeconomic status, and intersectionality. Exceptions may be present in the documentation due to language that is hardcoded in the user interfaces of the product software, language used based on RFP documentation, or language that is used by a referenced third-party product. Learn more about how Cisco is using Inclusive Language.
- US/Canada 800-553-2447
- Worldwide Support Phone Numbers
- All Tools
 Feedback
 Feedback
Existing Monitoring Mechanisms in a Cisco SAN Fabric
Smart Monitoring and Alerting (SMA)
Benefits of Smart Monitoring and Alerting
Creating a User-defined SMA Policy
The Cisco MDS 9000 series of storage networking switches offer a variety of features designed to monitor fabric health, switch health, hardware components, and multiple counters. Both hardware and software sensors gather real-time metrics and logs, with hardware sensors embedded within all components.
As a progressive step, a complete overhaul has been implemented to unify and simplify the configuration and monitoring across MDS SAN switches, extending from the overall switch down to the individual interfaces or port level. This new unified capability has been introduced as Smart Monitoring and Alerting (SMA).
This document provides step-by-step guidance to set up automated monitoring and alerting in a Cisco SAN fabric using the new Smart Monitoring and Alerting feature made production-ready in MDS NX-OS release 9.4(4). The primary audience is users of Cisco MDS 9000 switches, and NX-OS.
The command outputs, and capabilities that are described in this document are based on Cisco NX-OS 9.4(4) for MDS 9000 switches. Although the procedures and recommendations that are outlined in this document apply to MDS NX-OS releases from 9.4(1) onwards, we recommend referring to the release notes and the configuration guides for up-to-date information. Also, it is an overview document, primarily aimed at new users of SMA. For details on specific topics, please refer to the white papers and configuration guides that are listed in the references section.
Existing Monitoring Mechanisms in a Cisco SAN Fabric
Before getting into the details of the new Smart Monitoring and Alerting feature, let’s look at the existing monitoring and alerting mechanisms in a Cisco SAN fabric that are built using MDS 9000 switches. There are three features which are used to track and monitor MDS switch health. These tools describe the counters, the techniques employed to monitor them, the monitoring capabilities available, and the configurable threshold limits for the counters, etc.
Remote Monitoring (RMON) is an IETF SNMP standard specification that enables network agents and console systems to exchange monitoring data. In MDS NX-OS, RMON provides support for alarms, events, and logs, thereby enabling systematic monitoring of devices.
An alarm observes a designated MIB object at specified intervals, and each alarm can be associated with an event, such as the generation of an SNMP notification or the creation of a system log entry. Notably, RMON functionality is disabled by default.
Port Monitor (PMON) is a monitoring capability designed to track critical counters associated with physical ports and to notify external monitoring systems of potential anomalies.
This feature provides flexibility by allowing users to define and customize policies for monitoring both core and edge logical-type ports. PMON can be used to generate events and alarms on the ports.
Cisco Embedded Event Manager (EEM) is an integral NX-OS component designed to monitor and respond to system events on the switch. Beyond event detection, EEM enables automated actions that assist in troubleshooting and maintaining system stability. Event Manager policies are configured on the supervisor module and can extend monitoring to parameters on additional modules and line cards.
An EEM policy operates by waiting for a predefined event to occur. When the event is triggered, the policy can execute a range of programmed actions, such as generating a syslog message, reloading the supervisor, sending an SNMP trap, or executing a VSH CLI command. This functionality provides administrators with a flexible and proactive framework for event handling and automation.
While Cisco NX-OS provides management, monitoring, and alerting capabilities at the individual switch level, Cisco Nexus Dashboard extends these functions across multiple switches and fabrics. It features an intuitive, HTML5-based web interface for comprehensive visibility into the underlying SAN fabric.
Cisco Nexus Dashboard ingests hardware and software sensor data collected by Cisco MDS NX-OS firmware running on Cisco MDS 9000 switches, enabling the analysis of long-term trends and seasonal patterns. In addition, it receives event notifications generated by the switches and can forward these alerts to compatible third-party applications.
Smart Monitoring and Alerting (SMA)
Smart Monitoring and Alerting is a feature that enables real-time monitoring and detection of important events or conditions which include various port level metrics like Fibre Channel primitive sequences, congestion signals and notifications, scalability limits for FCID, zone, etc. It proactively recognizes deviations from normal or expected behavior, facilitating timely alerts and enabling prompt responses.
Benefits of Smart Monitoring and Alerting
This new monitoring feature brings multiple benefits for users. Some of them are listed below.
● Unified Monitoring Infrastructure: A centralized platform to configure various monitoring settings on the switch and view the overall system health.
● Per Interface configuration: SMA allows monitoring at the granularity of an interface. Interfaces can be categorized into different groups based on logical-type (edge/core/all) or a group of interfaces.
● Port and Protocol counters: SMA provides ease of use by grouping different types of entities monitored under the same policy.
● Customizable Thresholds and Priorities: SMA allows users to set personalized thresholds, priorities, and conditions based on their specific needs. This enables tailored monitoring and alerting, such as per-interface configurations, guided by user expertise.
● Real-Time Detection: SMA continuously analyzes data streams and system attributes for errors and anomalies in counters.
● Proactive Alerts: Upon detecting significant events, SMA generates notifications or alerts and triggers appropriate actions. These alerts can be delivered as syslogs, SNMP notifications, or Onboard Failure Logging (OBFL) logs.
● Event History and Reporting: SMA keeps a record of past events and provides comprehensive reports on overall system health.
The Smart Monitoring and Alerting feature is supported on the below MDS platforms:
● Cisco MDS 9700 with 64 Gbps, 32 Gbps Fibre Channel modules and 24/10 SAN Extension module
● Cisco MDS 9396V 64 Gbps 96-port Fibre Channel switch
● Cisco MDS 9148V 64 Gbps 48-port Fibre Channel switch
● Cisco MDS 9124V 64 Gbps 24-port Fibre Channel switch
● Cisco MDS 9396T 32 Gbps 96-port Fibre Channel switch
● Cisco MDS 9148T 32 Gbps 48-port Fibre Channel switch
● Cisco MDS 9132T 32 Gbps 32-port Fibre Channel switch
● Cisco MDS 9220i switch
This section outlines the core components or building blocks of the Smart Monitoring and Alerting feature. A clear understanding of these components is essential for configuring the feature on the MDS 9000 switches.
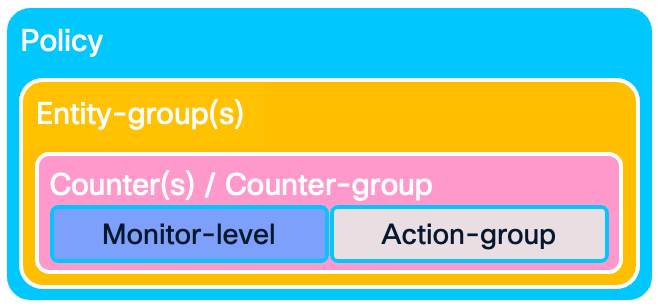
An SMA policy is composed of entity groups categorized by entity type. Within a given entity type, priority is determined by the order in which the entity groups are defined, with those appearing earlier in the policy assigned higher precedence. There is one default SMA policy, and the feature allows four user-defined policies.
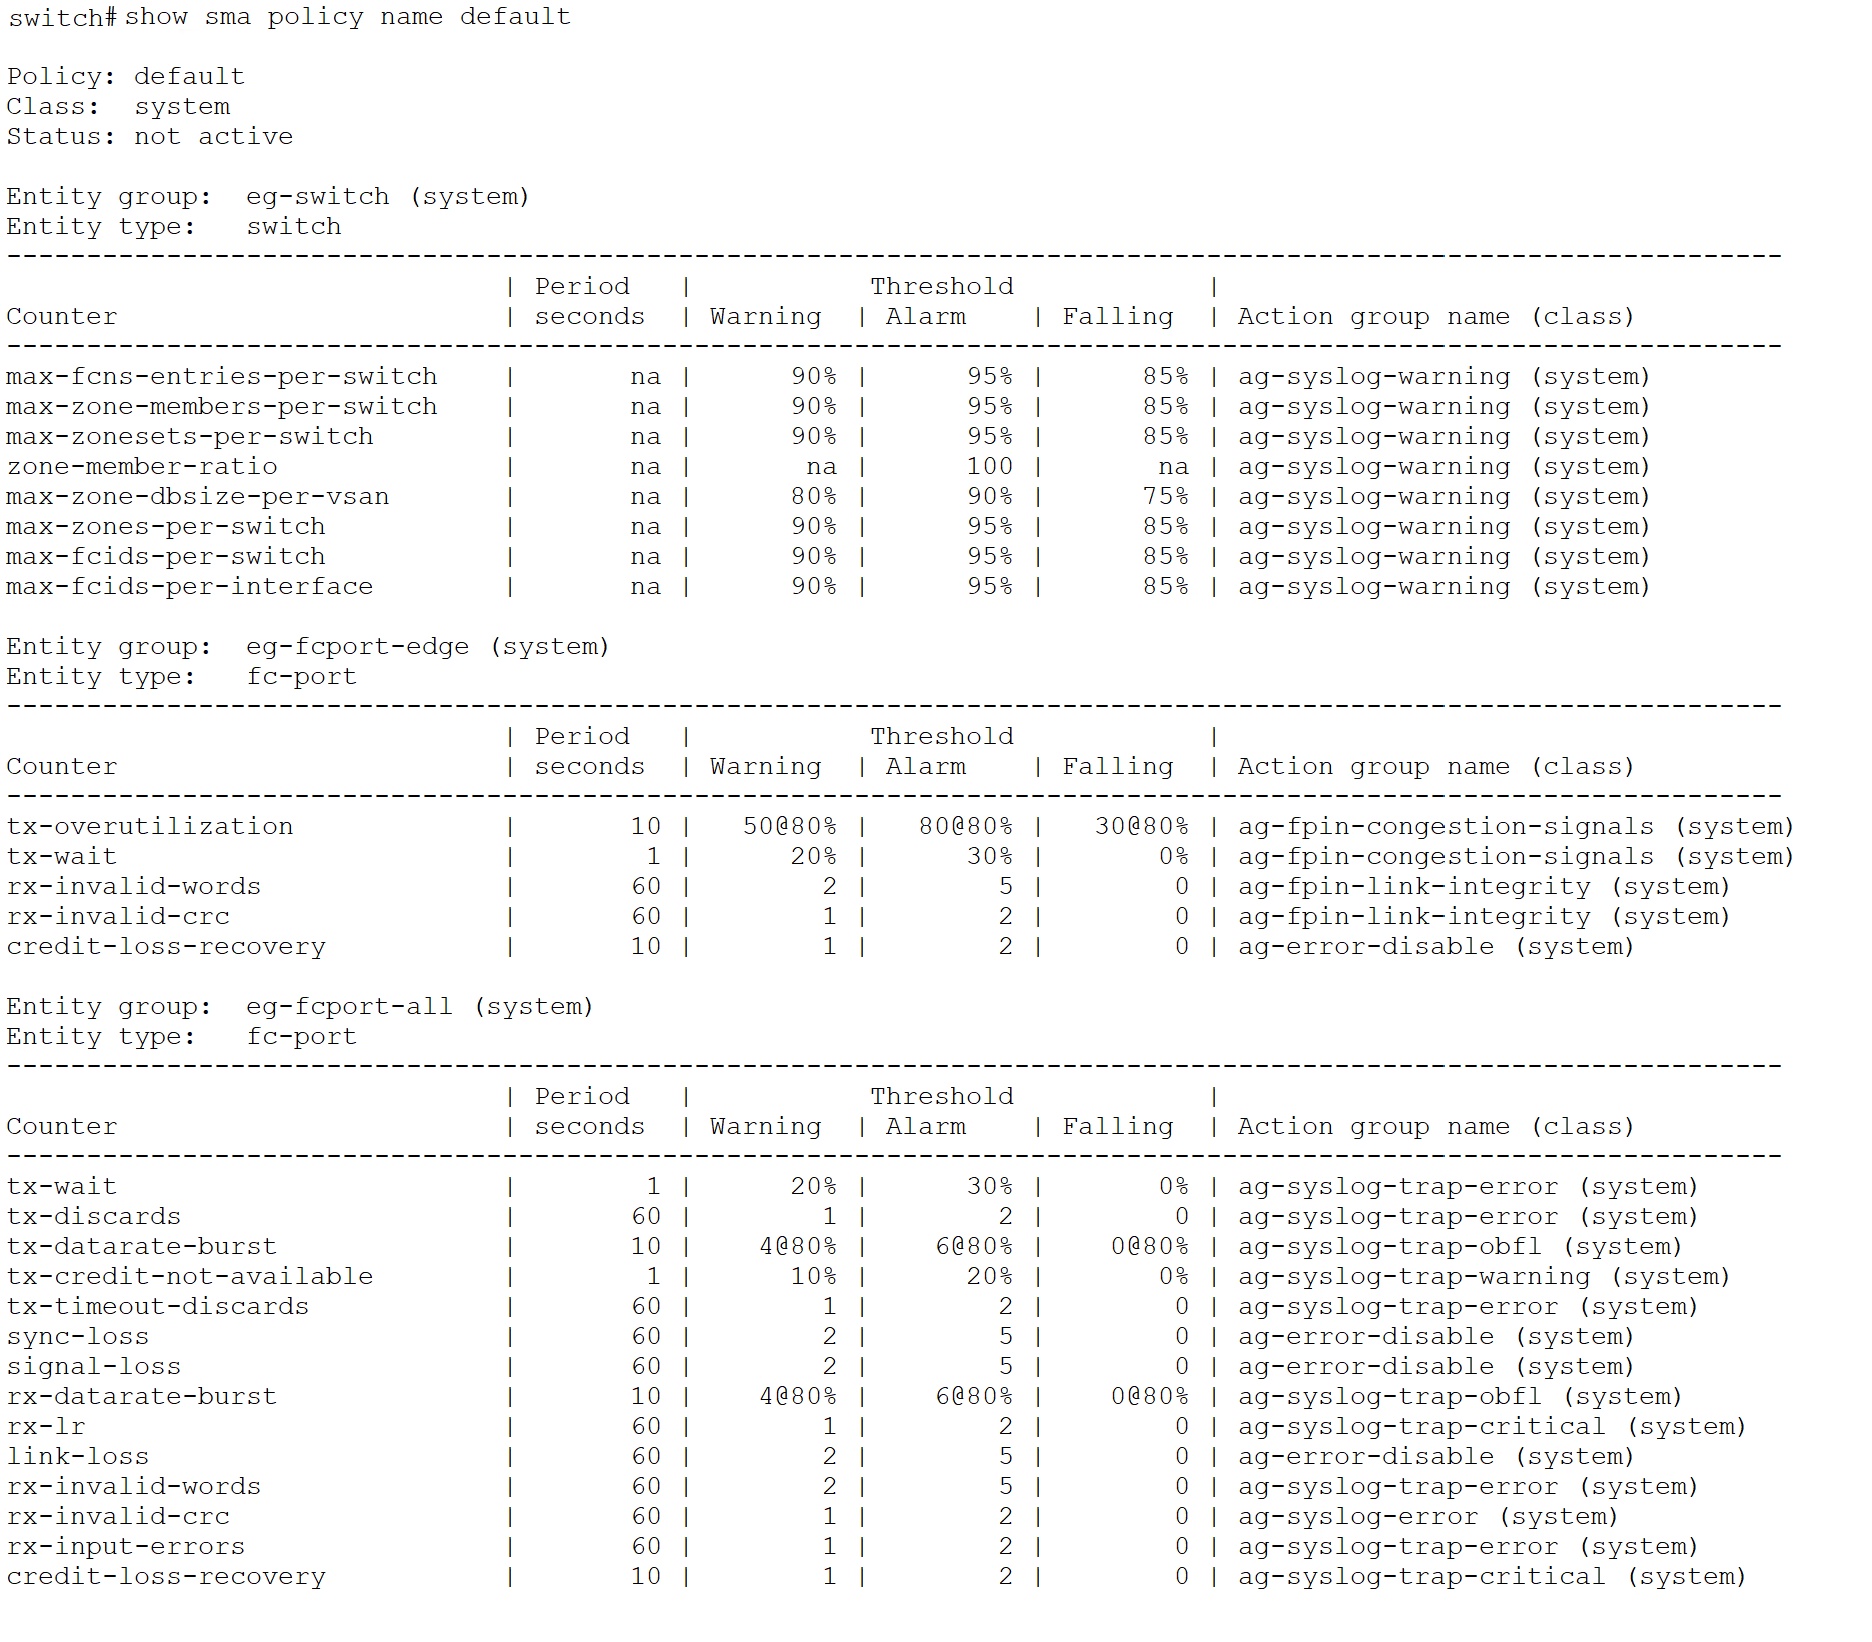
SMA maintains a system-defined default policy that incorporates supported counters. In MDS NX-OS version 9.4(4), this policy includes protocol counters and Port Monitoring (PMON) counters. In the upcoming firmware versions, the default policy will be enhanced to incorporate additional counters, ensuring broader monitoring coverage. To preserve consistency and reliability, the default policy is not user-editable.
Below is a snippet of the default SMA policy. Note that the policy is not active by default, and the user needs to activate it.
Users can create a custom, user-defined policy either by cloning the system-defined default policy or by authoring a new policy from the ground up. In MDS NX-OS version 9.4(4), support is limited to four user-defined policies.
An entity group is a collection of entities defined by an entity type and, optionally, by sub-entity types. A set of predefined entity groups is available, and users also have the flexibility to create custom groups as needed. Predefined entity groups, such as eg-fcport-all, eg-fcport-edge, and eg-fcport-core, are used for configuring port counters. Similarly, the predefined entity group eg-switch is used for configuring protocol counters.
Below snippet lists the four-default entity-groups – eg-fcport-all, eg-fcport-core, eg-fcport-edge and eg-switch.
switch# show sma entity-group class system
Entity group: eg-fcport-all
Class: system
Entity type: fc-port
Subentity type: all
Configured entity list: fc1/1-48,fc3/1-48,fc4/1-48,fc7/1-48,fc8/1-48,fc9/1-48,fc11/1-48
Entity group: eg-fcport-core
Class: system
Entity type: fc-port
Subentity type: core
Configured entity list: fc1/4-10,fc1/17,fc1/20,fc1/28,fc1/33,fc1/37-39,
fc3/1-2,fc3/7,fc3/15,fc4/1-2,fc4/7,fc4/15,fc7/1-3,
fc9/5-8,fc10/40-48
Entity group: eg-fcport-edge
Class: system
Entity type: fc-port
Subentity type: edge
Configured entity list: fc4/42,fc9/1-6,fc9/17-22,fc9/33-38,fc10/39,fc11/3-8
Entity group: eg-switch
Class: system
Entity type: switch
Subentity type: -
Configured entity list: switch
switch#
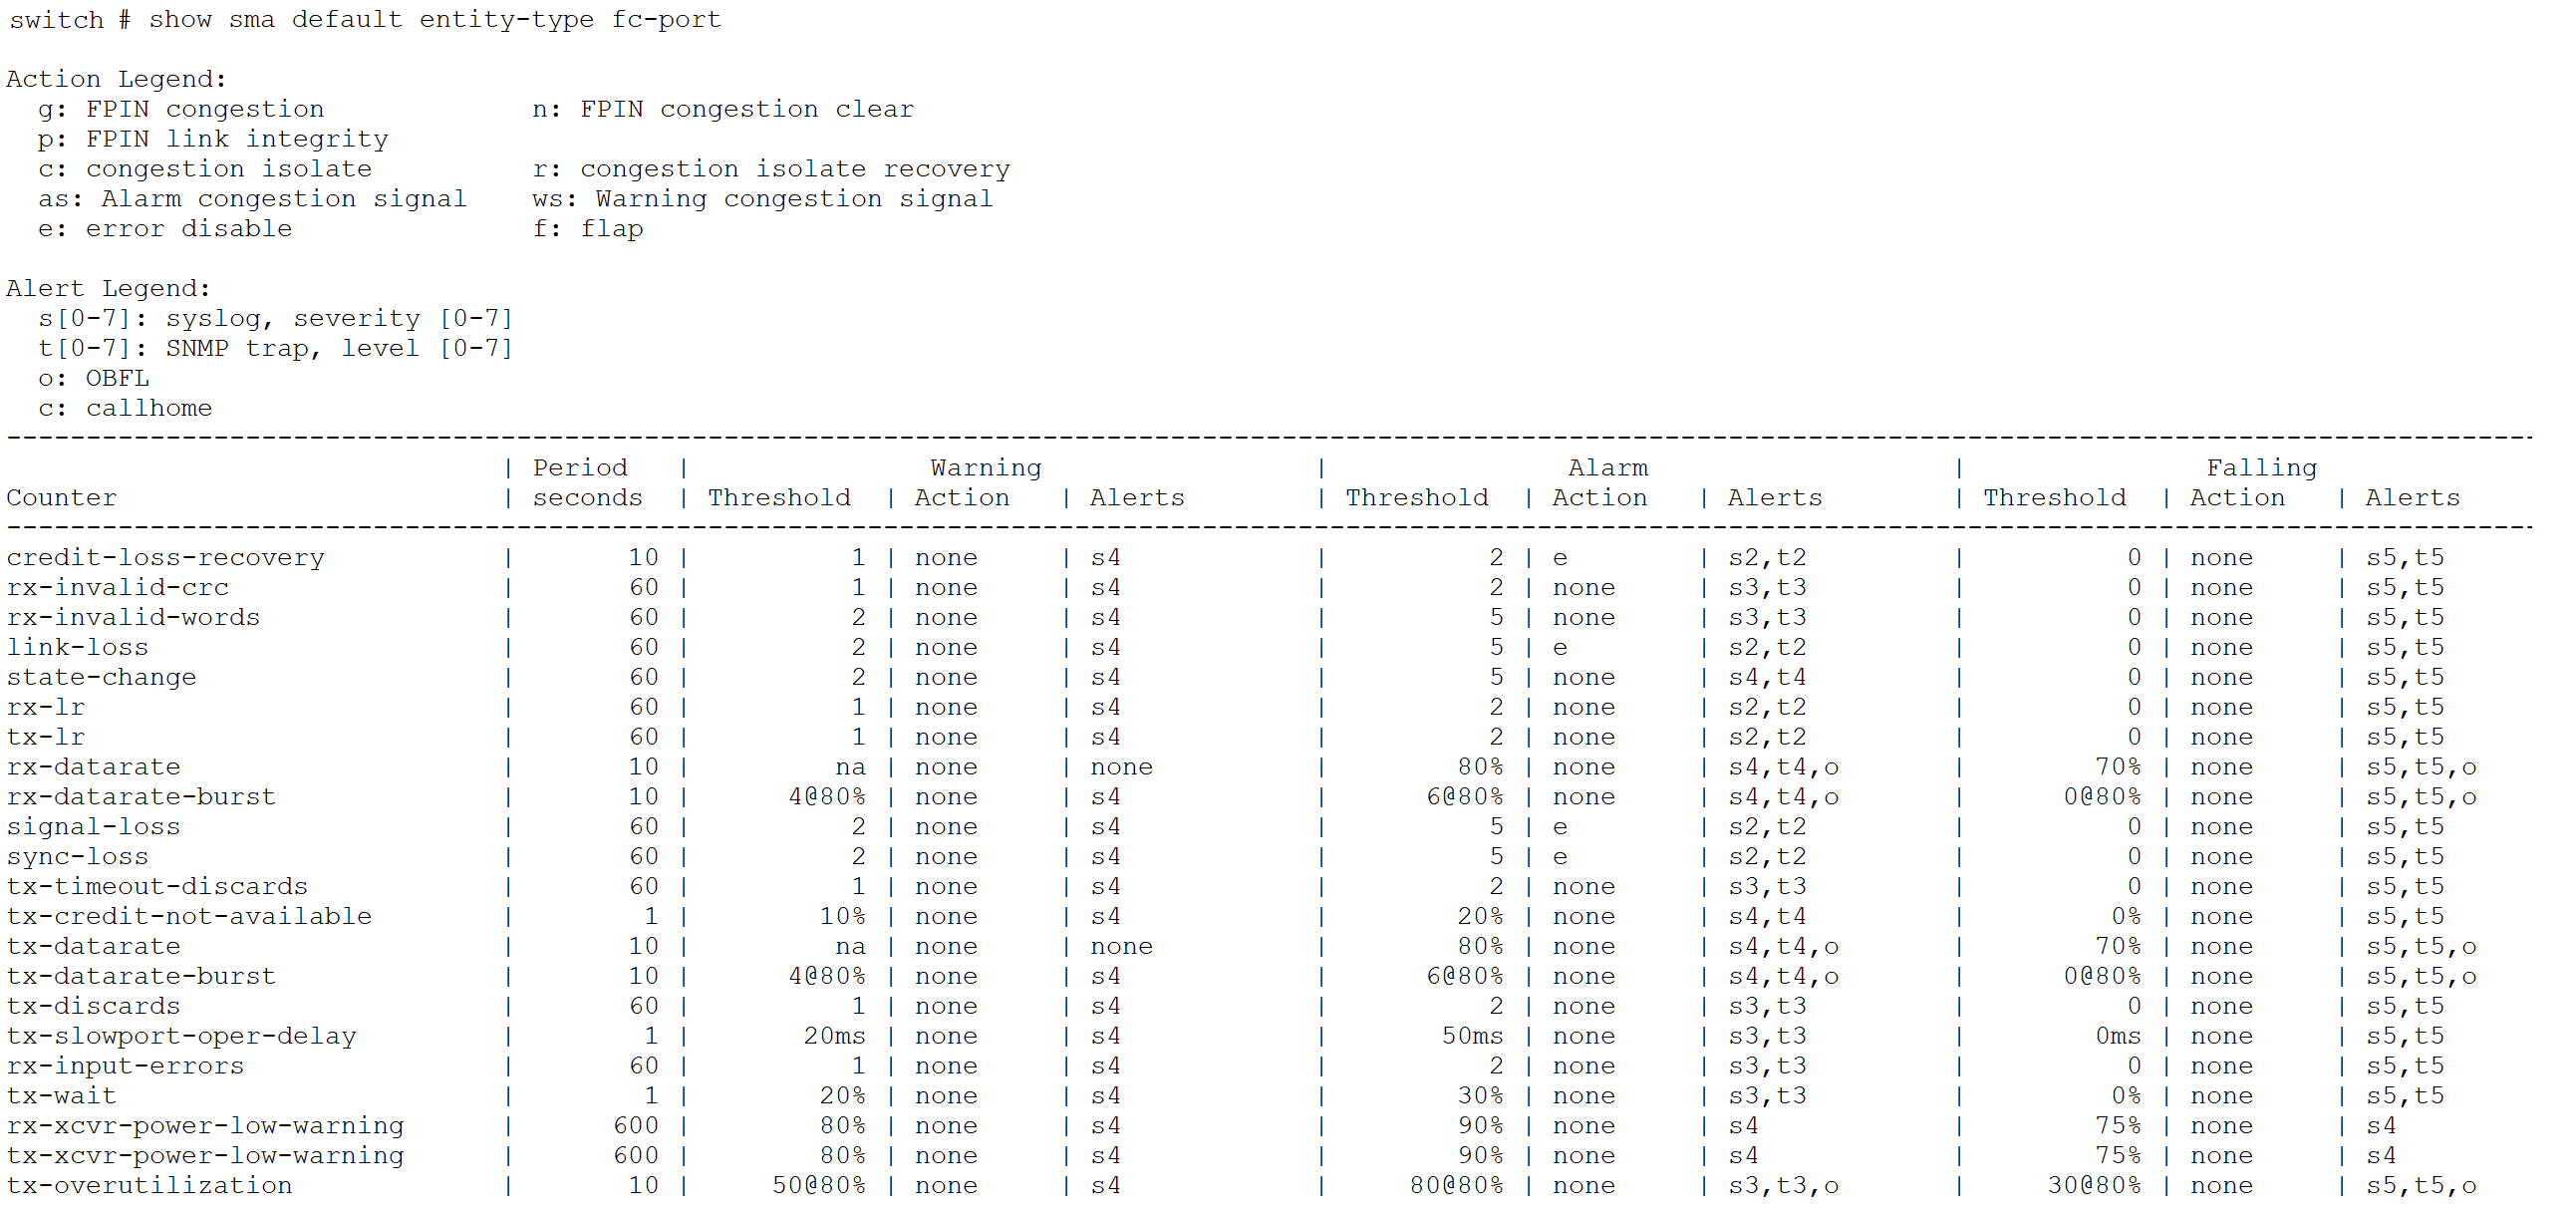
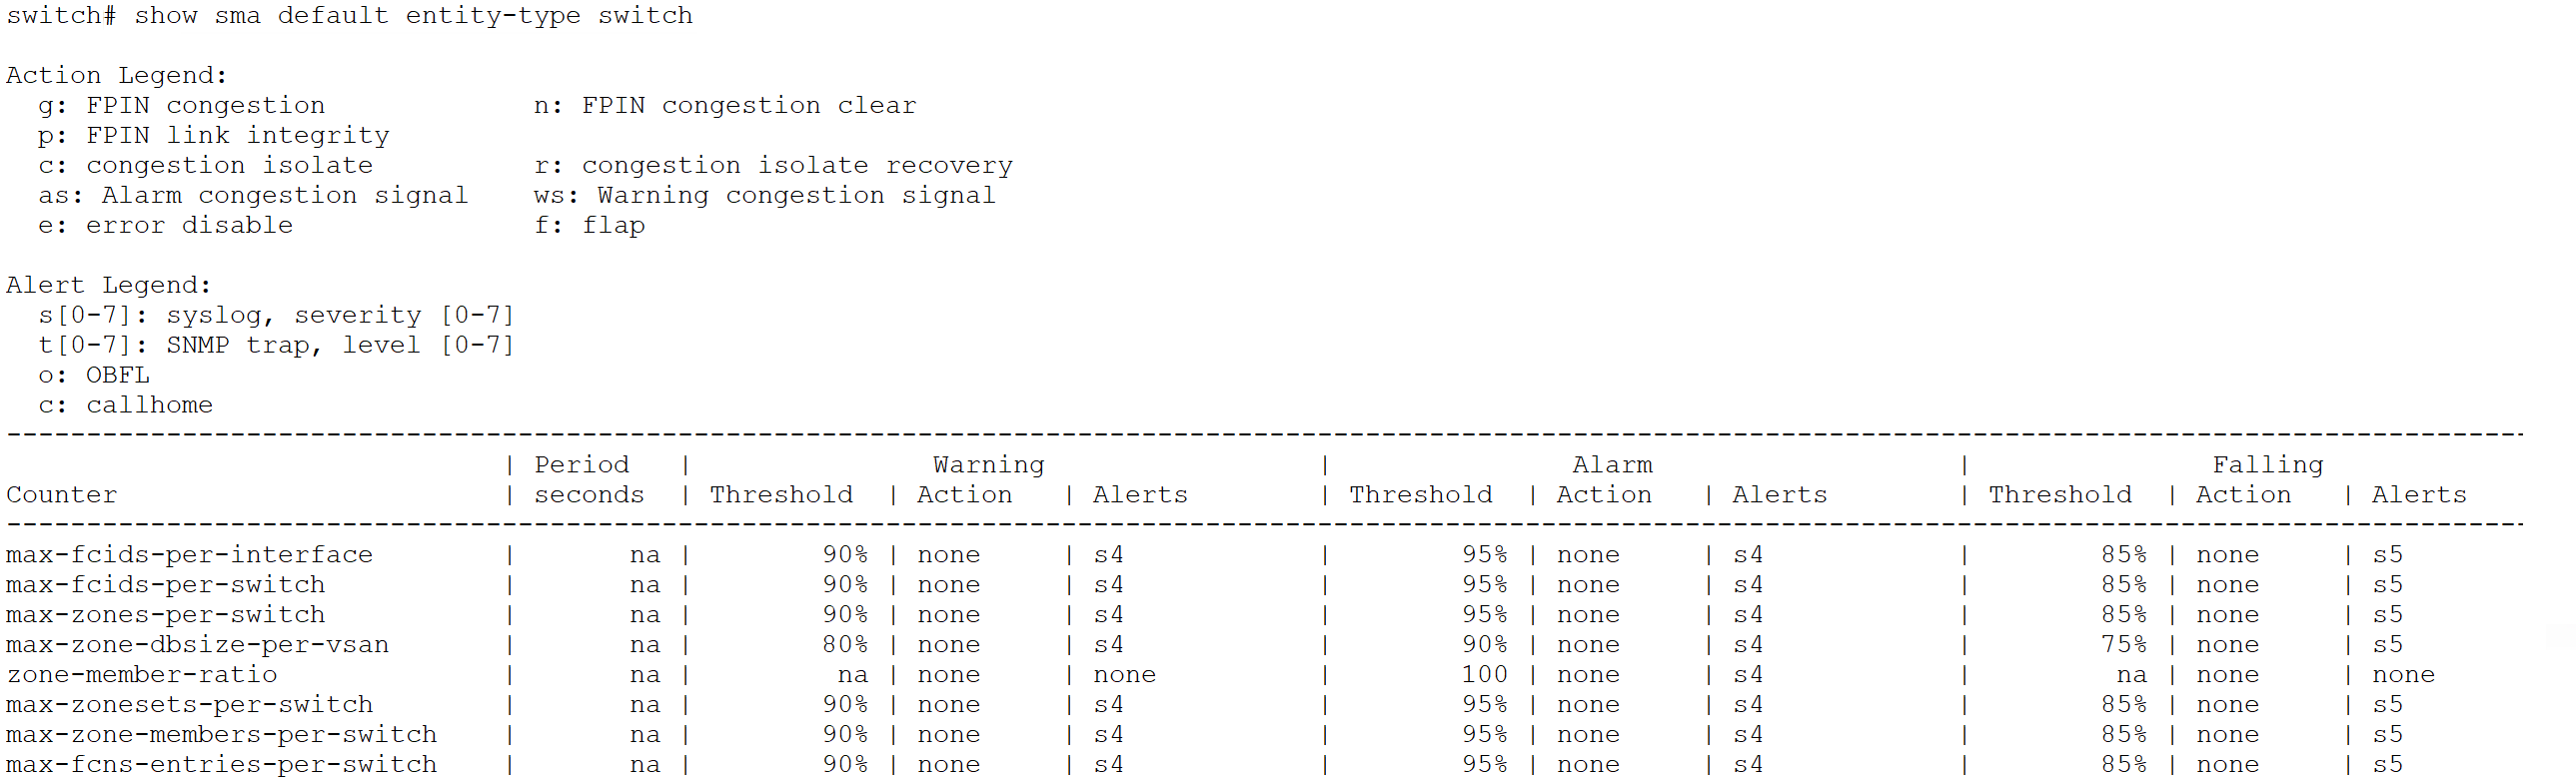
An Entity-type defines an object which needs to be monitored. This is where the SMA policy will be applied. fc-port and switch are the currently supported entity-types. Under the fc-port entity-type, users have an option to configure the subentity-types – interface, core, edge or all.
Below snippet lists the two, default, entity-types – fc-port and switch.
Counter groups are used to define consistent or common behavior across a set of counters. A set of predefined counter groups is available for use. Users cannot create custom counter groups.
Users have the option to monitor an individual counter too. In that case, the feature will only allow the actions and monitor level which are applicable for that counter.
Below snippet lists the default counter groups available under SMA. Table 1 lists the counters which constitute the default counter-groups.
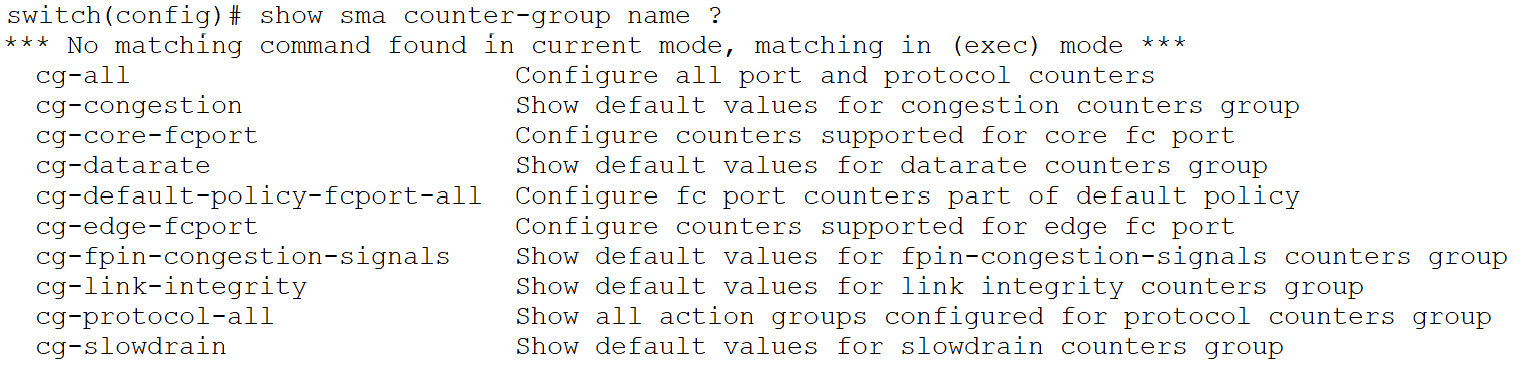
Table 1. Default Counter-groups under SMA
| SI No. |
Counter-group |
Counters |
| 1 |
cg-default-policy-fcport-all |
credit-loss-recovery rx-input-errors rx-invalid-crc rx-invalid-words link-loss rx-lr rx-datarate-burst signal-loss sync-loss tx-timeout-discards tx-credit-not-available tx-datarate-burst tx-discards tx-wait |
| 2 |
cg-core-fcport |
credit-loss-recovery rx-input-errors rx-invalid-crc rx-invalid-words link-loss rx-lr tx-lr rx-datarate rx-datarate-burst signal-loss state-change sync-loss tx-timeout-discards tx-credit-not-available tx-datarate tx-datarate-burst tx-discards tx-slowport-oper-delay tx-wait rx-xcvr-power-low-warning tx-xcvr-power-low-warning |
| 3 |
cg-edge-fcport |
credit-loss-recovery rx-input-errors rx-invalid-crc rx-invalid-words link-loss rx-lr tx-lr rx-datarate rx-datarate-burst signal-loss state-change sync-loss tx-timeout-discards tx-credit-not-available tx-datarate tx-datarate-burst tx-discards tx-slowport-oper-delay tx-wait rx-xcvr-power-low-warning tx-xcvr-power-low-warning tx-overutilization |
| 4 |
cg-link-integrity |
link-loss sync-loss signal-loss rx-invalid-words rx-invalid-crc |
| 5 |
cg-datarate |
tx-datarate tx-datarate-burst rx-datarate rx-datarate-burst tx-overutilization |
| 6 |
cg-congestion |
tx-wait tx-datarate tx-datarate-burst tx-overutilization |
| 7 |
cg-slowdrain |
tx-credit-not-available credit-loss-recovery tx-wait tx-slowport-oper-delay |
| 8 |
cg-fpin-congestion-signals |
tx-wait tx-overutilization |
| 9 |
cg-protocol-all |
max-fcns-entries-per-switch max-fcids-per-switch max-fcids-per-interface max-zone-dbsize-per-vsan zone-member-ratio max-zone-members-per-switch max-zones-per-switch max-zonesets-per-switch |
| 10 |
cg-all |
All the port and protocol counters |
Monitor levels define the threshold values and sampling periods for different conditions, such as warning, alarm, and falling states. Each counter is assigned default monitor levels appropriate for the counter; however, users have the option to configure custom values as required.
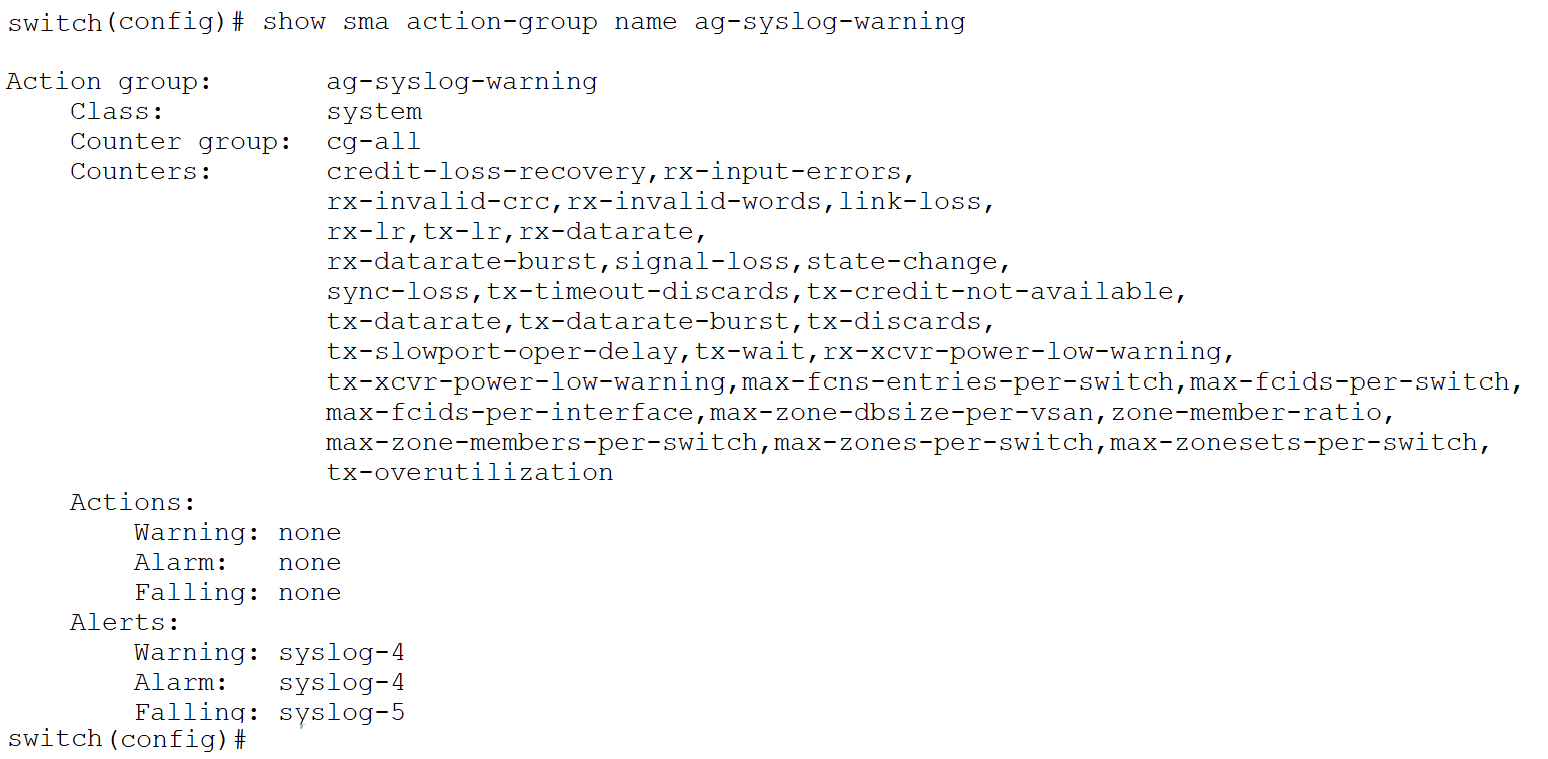
Action groups define the alerts and responses/actions associated with various threshold levels. A set of predefined action groups is available, and each counter is assigned a default action group. Users also have the flexibility to create custom action groups as needed. These groups are reusable and can be applied across multiple counters within different entity groups. Some valid actions include flap, error-disable, congestion-signal, FPIN (Fabric Performance Impact Notification), etc. SNMP trap, syslog, OBFL (Onboard Failure Logging) are some alerts.
Below is a snippet for the default action-group: ag-syslog-warning.
The priority of an entity group within a policy is determined by its position. For a given entity type, groups defined earlier in the policy are assigned higher precedence. When the same entity is included in multiple groups, the configuration associated with the highest-priority entity group is applied to that counter.
In the below example, SMA policy “test-sma” has three entity-groups. One entity-group named eg-switch for protocol counters. And 2 entity-groups, eg-fcport-edge and eg-fcport-all for FC ports. Entity-group eg-fcport-edge includes only those fc ports that are of logical-type edge. For credit-loss-recovery counter, the action is different only for edge ports, so it is added to eg-fcport-edge. Entity-group eg-fcport-all includes all fc ports with a counter-group cg-fcport-all which includes all counters for FC ports.
Since entity-group eg-fcport-edge appears above entity-group eg-fcport-all in the policy, credit-loss-recovery counter config under entity-group eg-fcport-edge take precedence for the edge ports over the same counter configured in eg-fcport-all. As a result, when credit-loss-recovery counter threshold is hit for an edge port or F-port, error-disable action will be applied on that port. Whereas for core ports or E-ports, a syslog warning message will be logged.
sma policy name test-sma
entity-group name eg-switch
counter-group cg-protocol-all monitor-level default action-group ag-default
entity-group name eg-fcport-edge
counter credit-loss-recovery monitor-level default action-group ag-error-disable
entity-group name eg-fcport-all
counter-group cg-fcport-all monitor-level default action-group ag-syslog-warning
Creating a User-defined SMA Policy
This section describes the detailed step-by-step procedure for creating a user-defined Smart Monitoring and Alerting (SMA) policy that includes a custom entity group, a custom action group, and a default counter group. The custom entity group and action group must be created independently before they are referenced within an SMA policy.
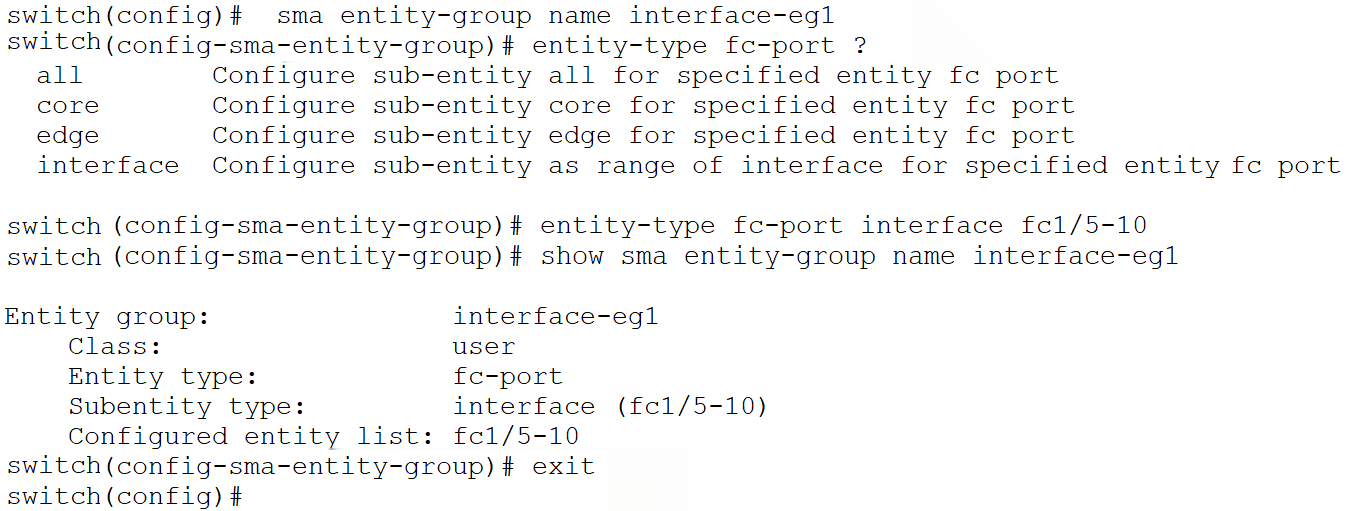
1. Entity-group configuration
a. Create an entity-group with a valid name
b. Under the config-sma-entity-group mode, add entity-type along with subentity-types for the entity-group
2. Action-group configuration
a. Create an action-group with an appropriate name
b. Under config-action-group mode, configure actions for each threshold level (alarm, warning and falling)
3. SMA policy creation
a. Create an SMA policy with an appropriate name
b. Under config-sma-policy mode, configure entity-group (pre-defined or user-defined from Step 1)
c. Under config-sma-policy-entity mode, configure counters for entity-group
4. Activate the SMA policy
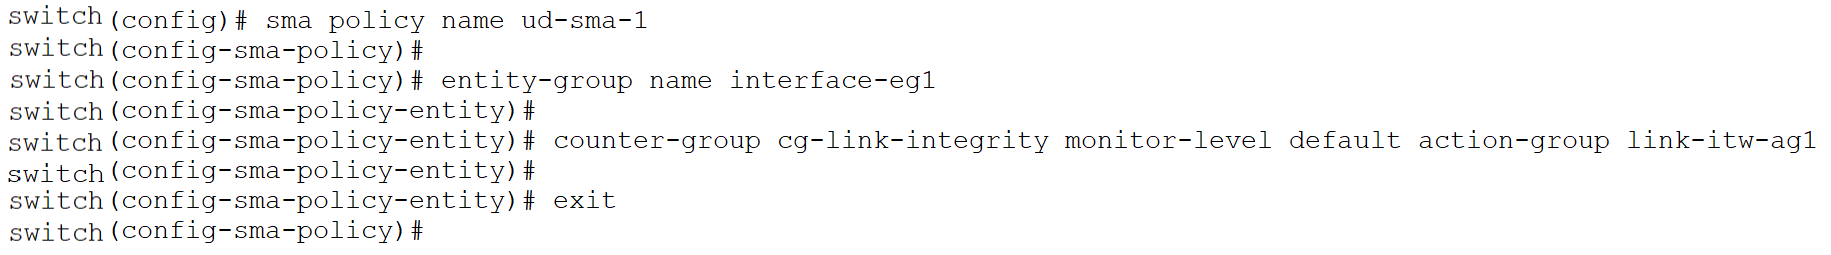
The following CLI commands illustrate how to create a user-defined SMA policy. This policy monitors a set of port counters on specific interfaces of a Cisco 9000 Series switch. Configuring an MDS 9000 switch requires read-write access privileges.
A user-defined entity-group “interface-eg1” is created and then for entity-type fc-port, interfaces fc 1/5 – 10 are added as subentity-type.
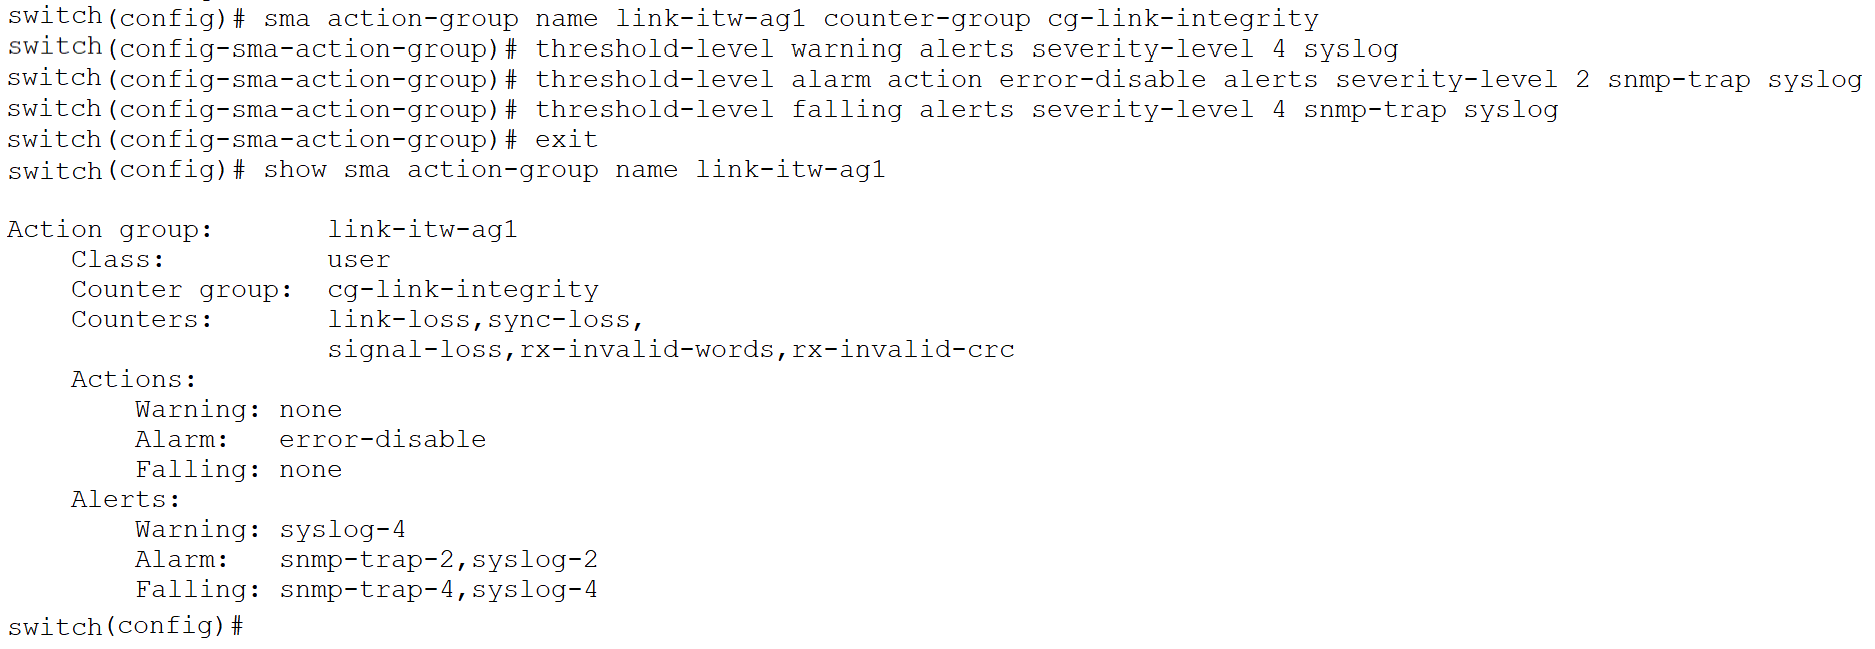
Next, a user-defined action-group named “link-itw-ag1” is created to monitor the counter-group “cg-link-integrity”. The action-group can be configured with alerts as well as actions for the warning, alarm and falling threshold levels. In this example, once the threshold level reaches the alarm value, an “error-disable” action will be executed on the monitored interface. Note that a user-defined action-group cannot be created without associating it with a counter or counter-group.
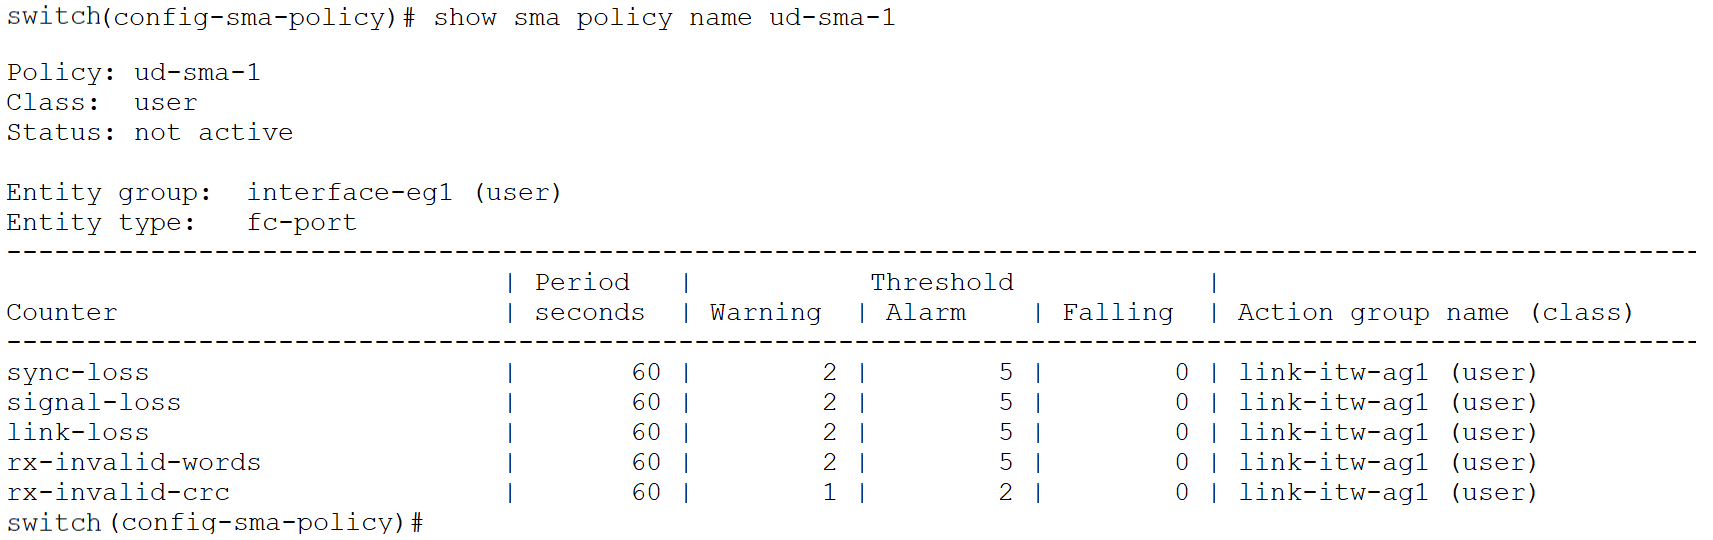
In this step, a user-defined SMA policy named “ud-sma-1” is created. The user-defined entity-group created in Step 1 is added to this SMA policy. The counter-group “cg-link-integrity” is then added with the default monitor level and the user-defined action-group created in the previous step. The policy alerts when there are 2 or more sync-loss, signal-loss, link-loss, invalid-words or 1 or more invalid-crc events in a 60 second period. Note that since we are monitoring a pre-defined counter-group that consists of five different port counters, the monitor-level can only be set to default, and the user cannot modify it. If the user wants to configure different values for the monitor-level, individual counters must be added to the policy. Additionally, in an SMA policy, there can be a maximum of 10 entity-groups with the entity-type fc-port and 1 entity-group with the entity-type switch, for a total of 11 entity-groups.
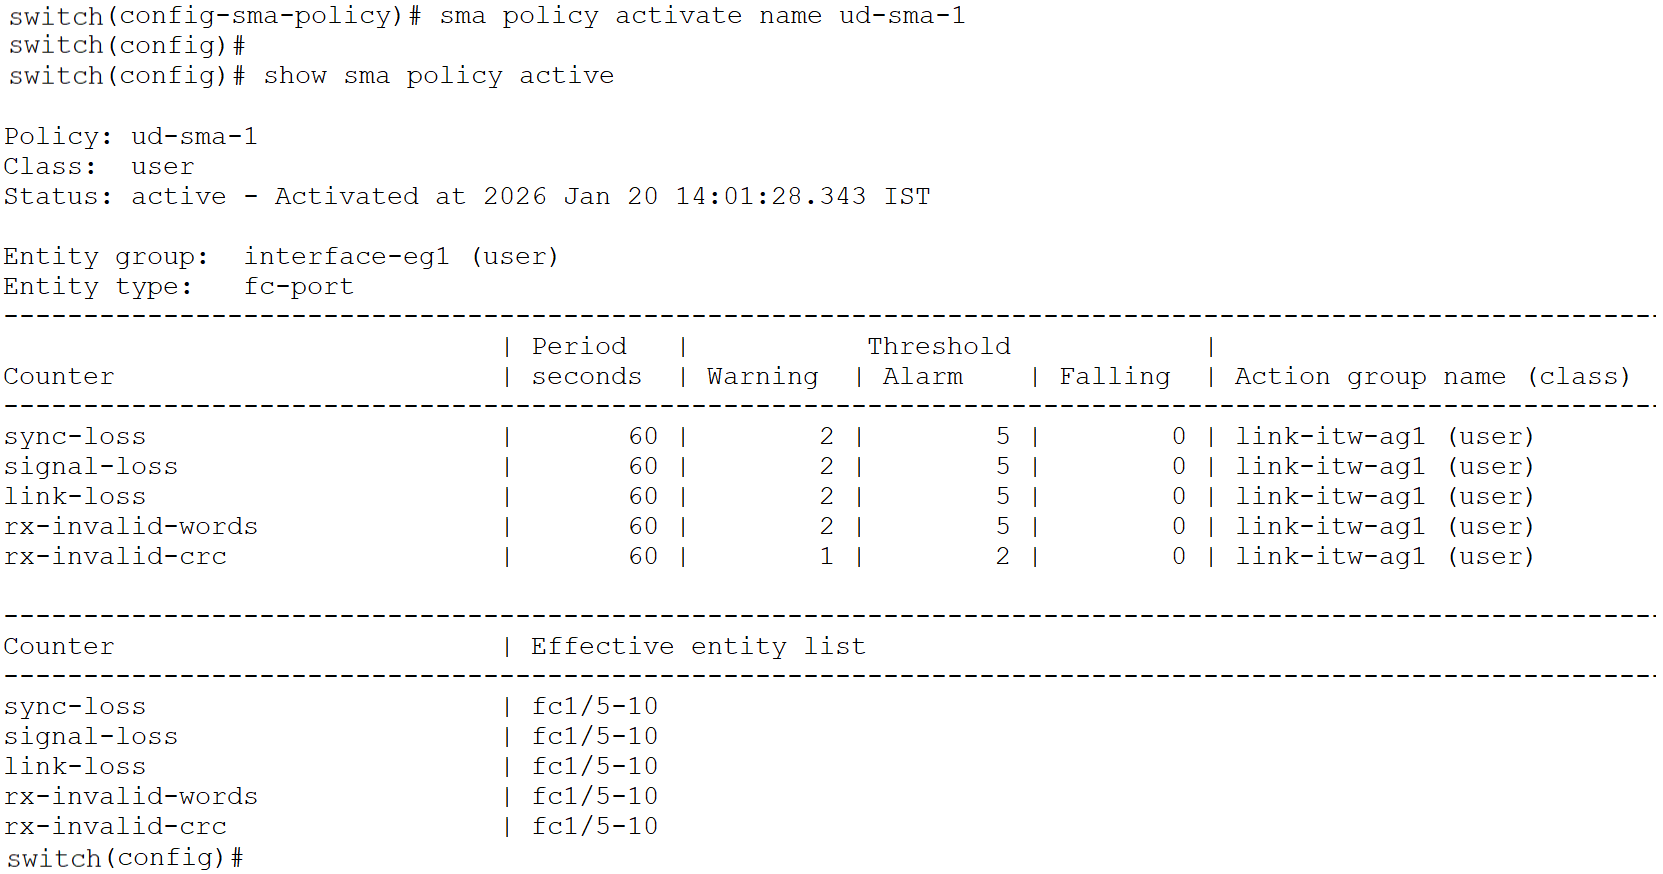
Finally, the user-defined SMA policy can be activated. Note that a port-monitor (PMON) and an SMA policy cannot be active at the same time. Any existing active port-monitor policy must be deactivated before activating the SMA policy.
switch(config-sma-policy)# exit
switch (config)# sma policy activate name ud-sma-1
Error: SMA policy is not activated. Port Monitor policy errdy is already active. SMA and Port Monitor policies cannot be active at the same time.
switch (config)#
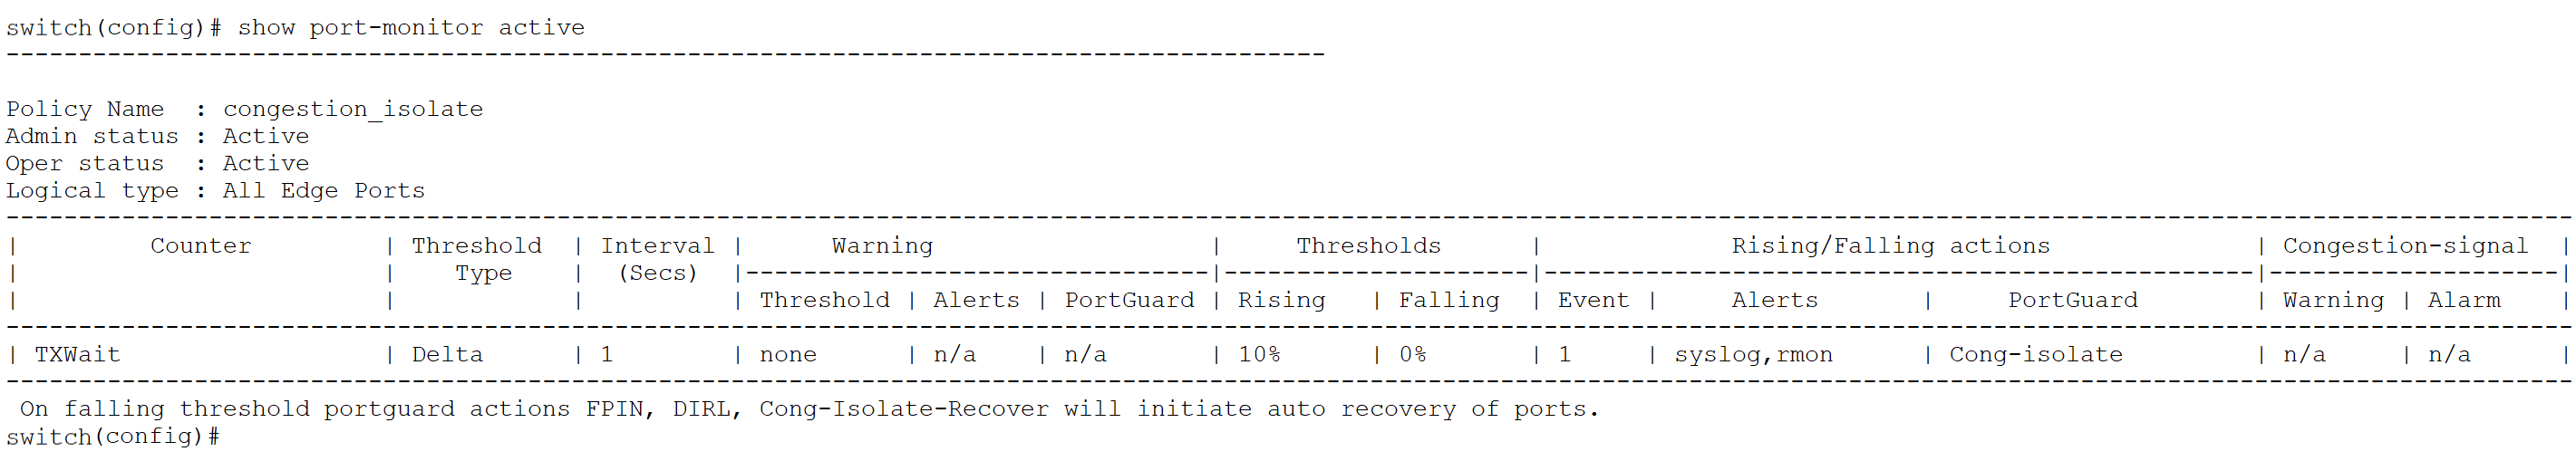
switch(config)# no port-monitor activate congestion_isolate
WARNING: Ports which are cong-isolated or either in DIRL or FPIN will be recovered.
switch (config)#
switch (config)# show port-monitor active
switch (config)#
Customers also have the option to copy the default (or a user-defined) SMA policy using the command sma policy copy default <new name> and modify it according to their requirements.
As of NX-OS release 9.4(4), up to four user-defined SMA policies and one default SMA policy are supported. The default SMA policy can be activated or deactivated but cannot be deleted. For more details about the SMA guidelines, please refer to the References section to access the Cisco MDS 9000 Series Interfaces Configuration Guide.
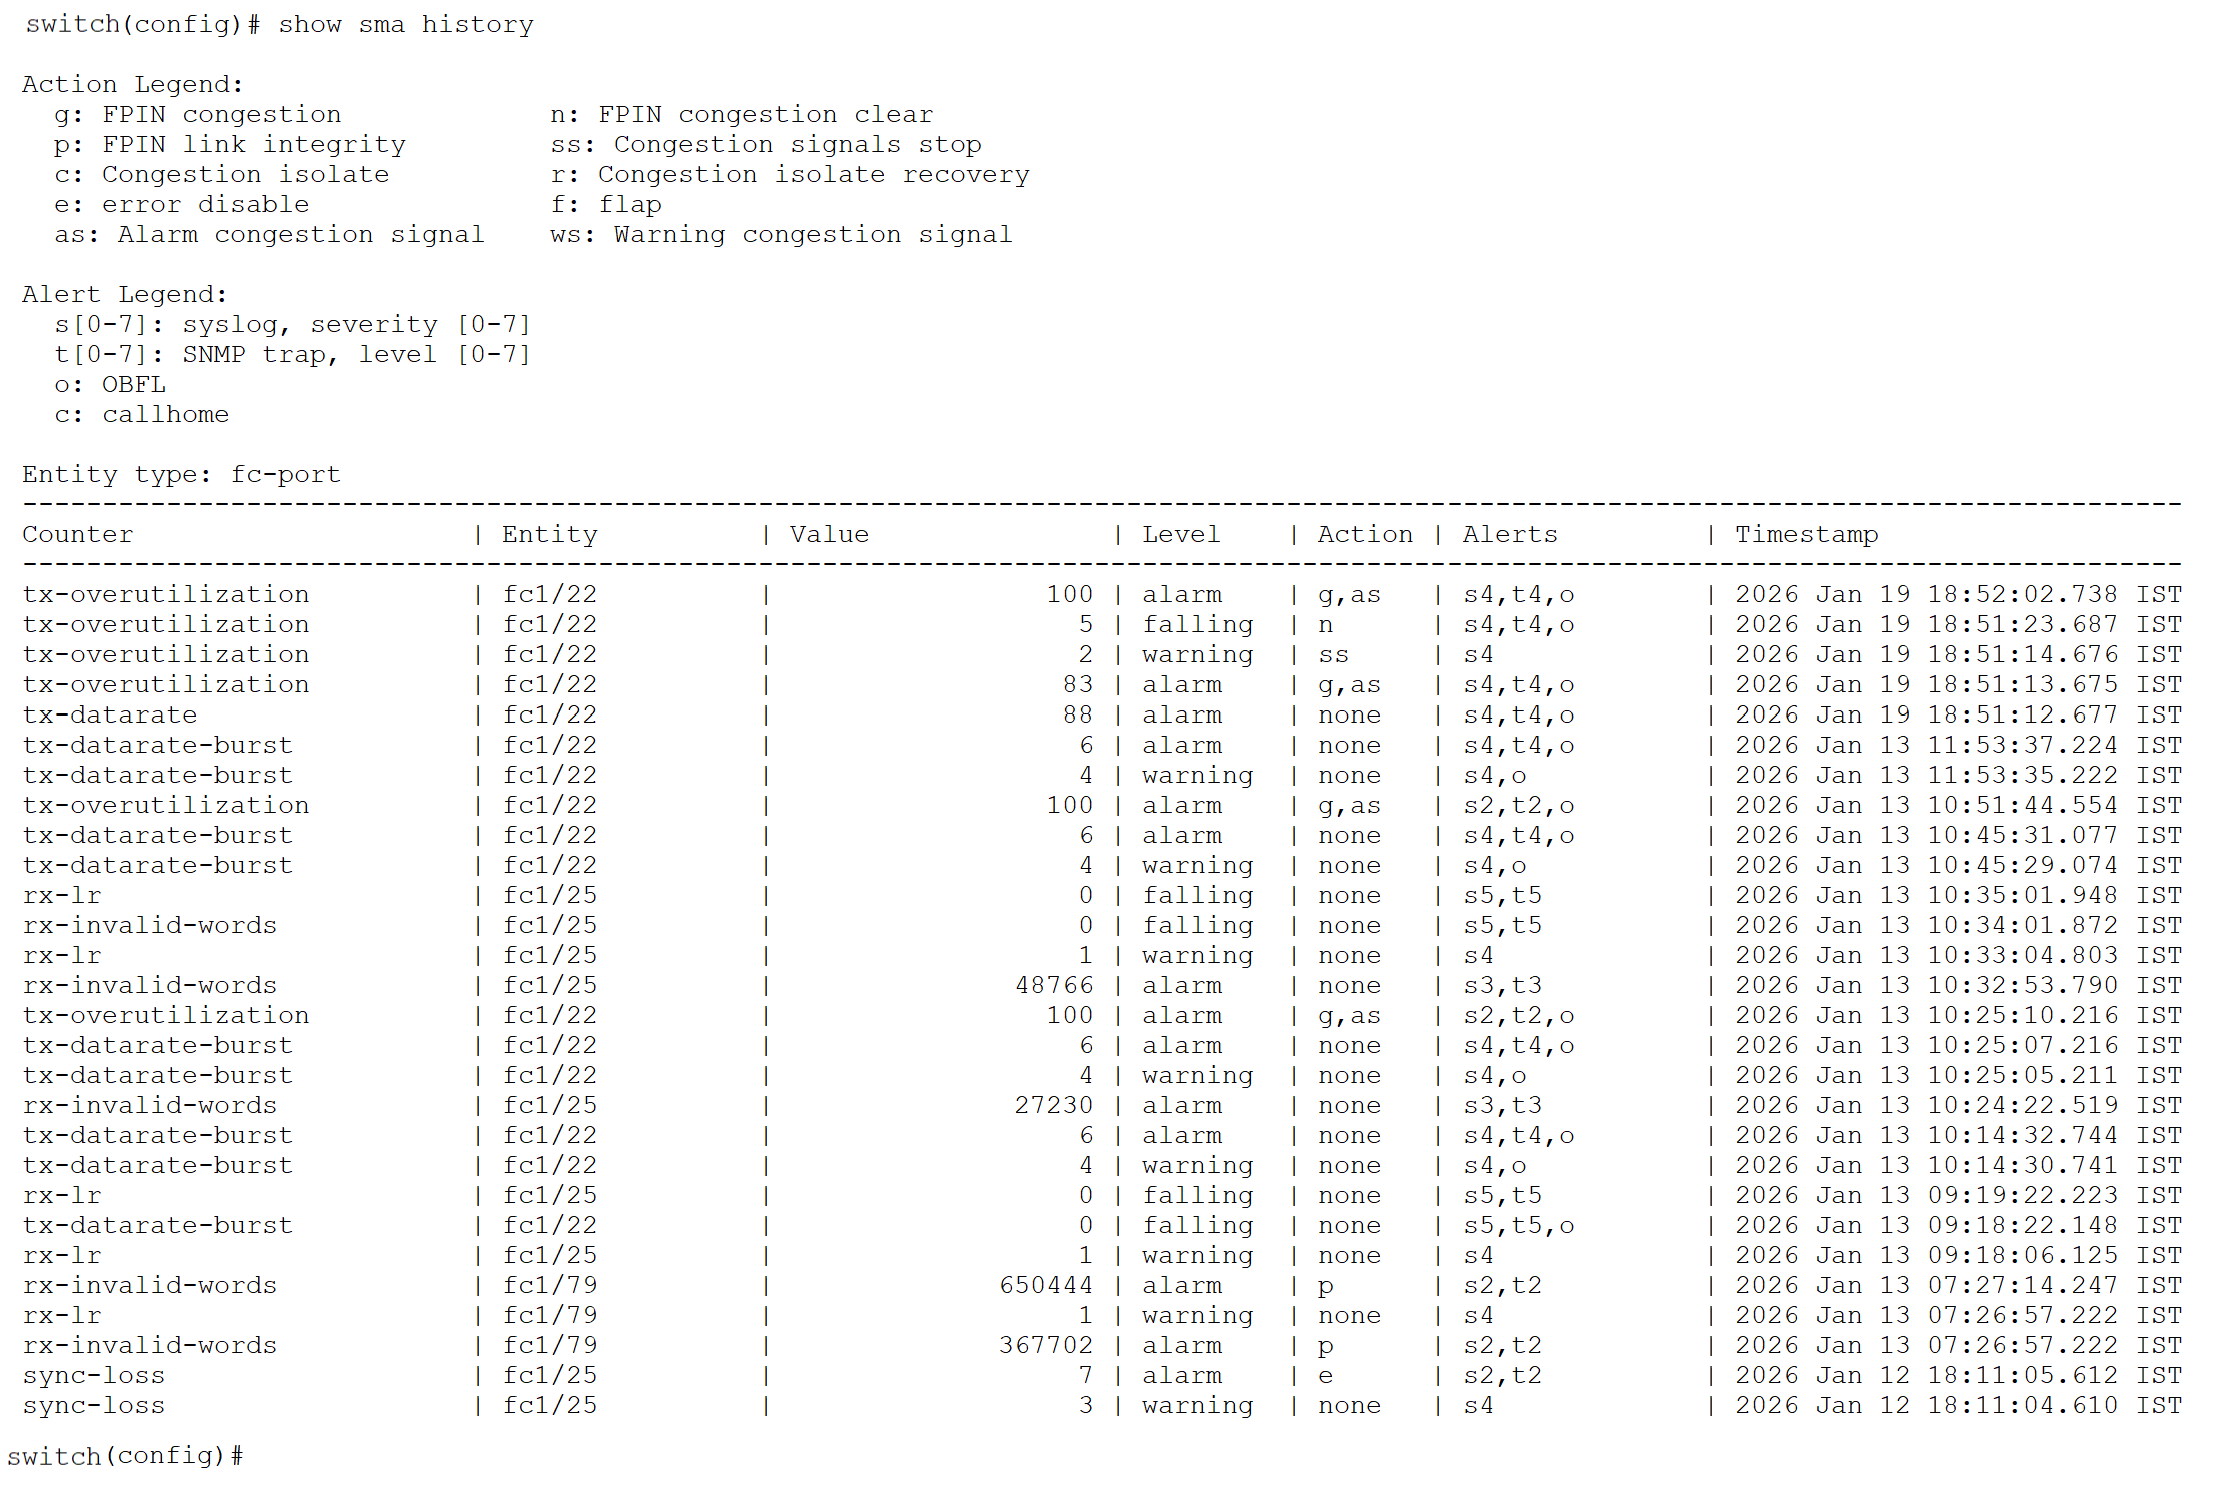
Another major benefit of SMA is its ability to maintain a historical record of past threshold events. This feature allows Storage administrators to review when specific thresholds were crossed, analyze recurring patterns, and correlate these events with network conditions or configuration changes. By preserving this event history, SMA enables more effective troubleshooting, and long-term trend analysis compared to the other monitoring methods that only provide real-time alerts.
To accelerate and simplify the adoption of SMA, Cisco MDS NX-OS provides an overlay CLI command to migrate from Port Monitoring (PMON) policies (either default or user-defined) to SMA. An overlay CLI is a Python script that acts as a wrapper around the standard NX-OS CLI command. This command converts all PMON policy configurations into an equivalent SMA policy configuration. Note that the migrated SMA policy will not be activated by default. User will need to activate the SMA policy.
This section describes how to use this feature to convert PMON policies to SMA policies. For more information about the prerequisites and constraints, please refer to the references section to access the SMA section in Cisco MDS 9000 Congestion Alerting guide.
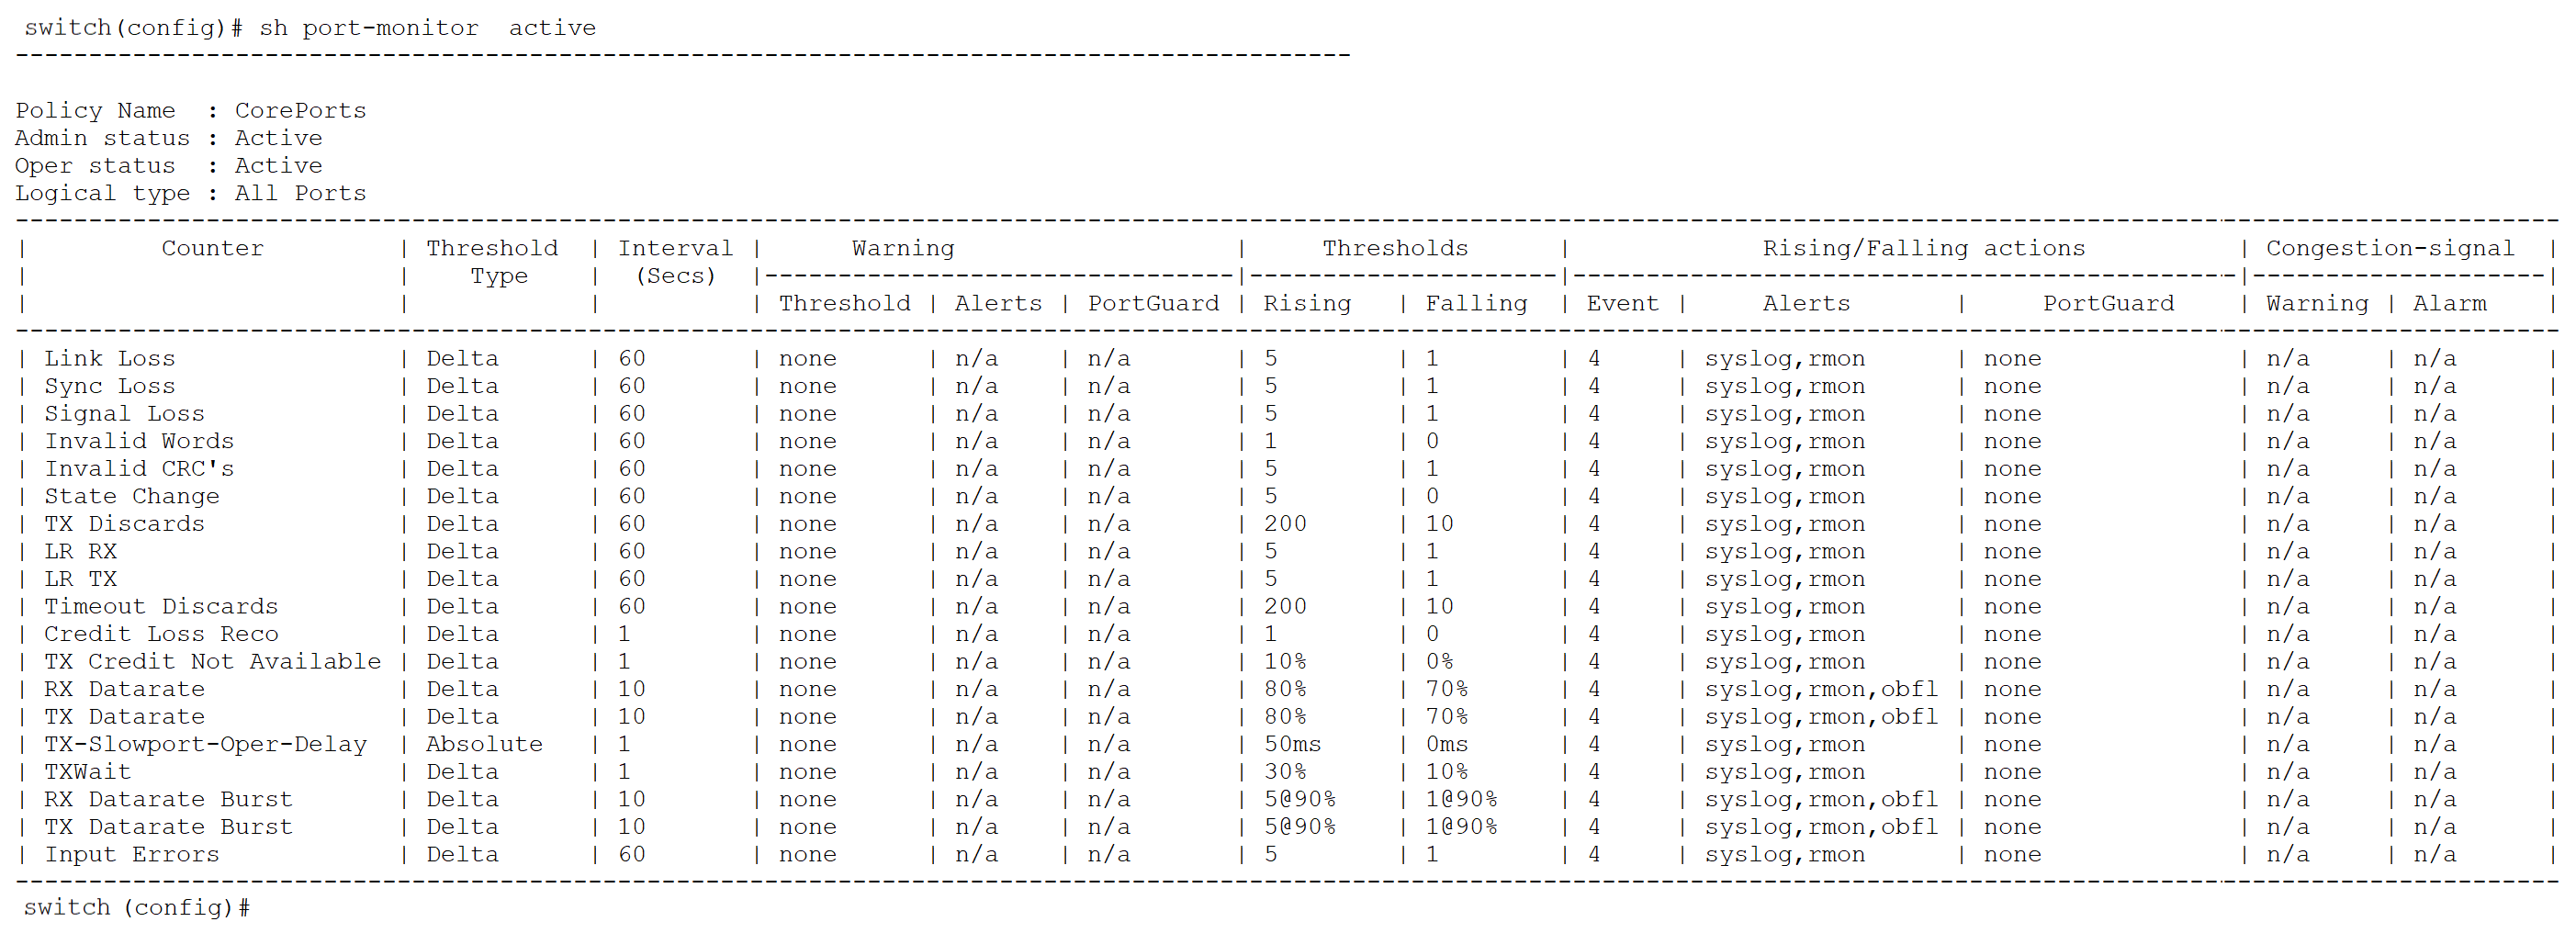
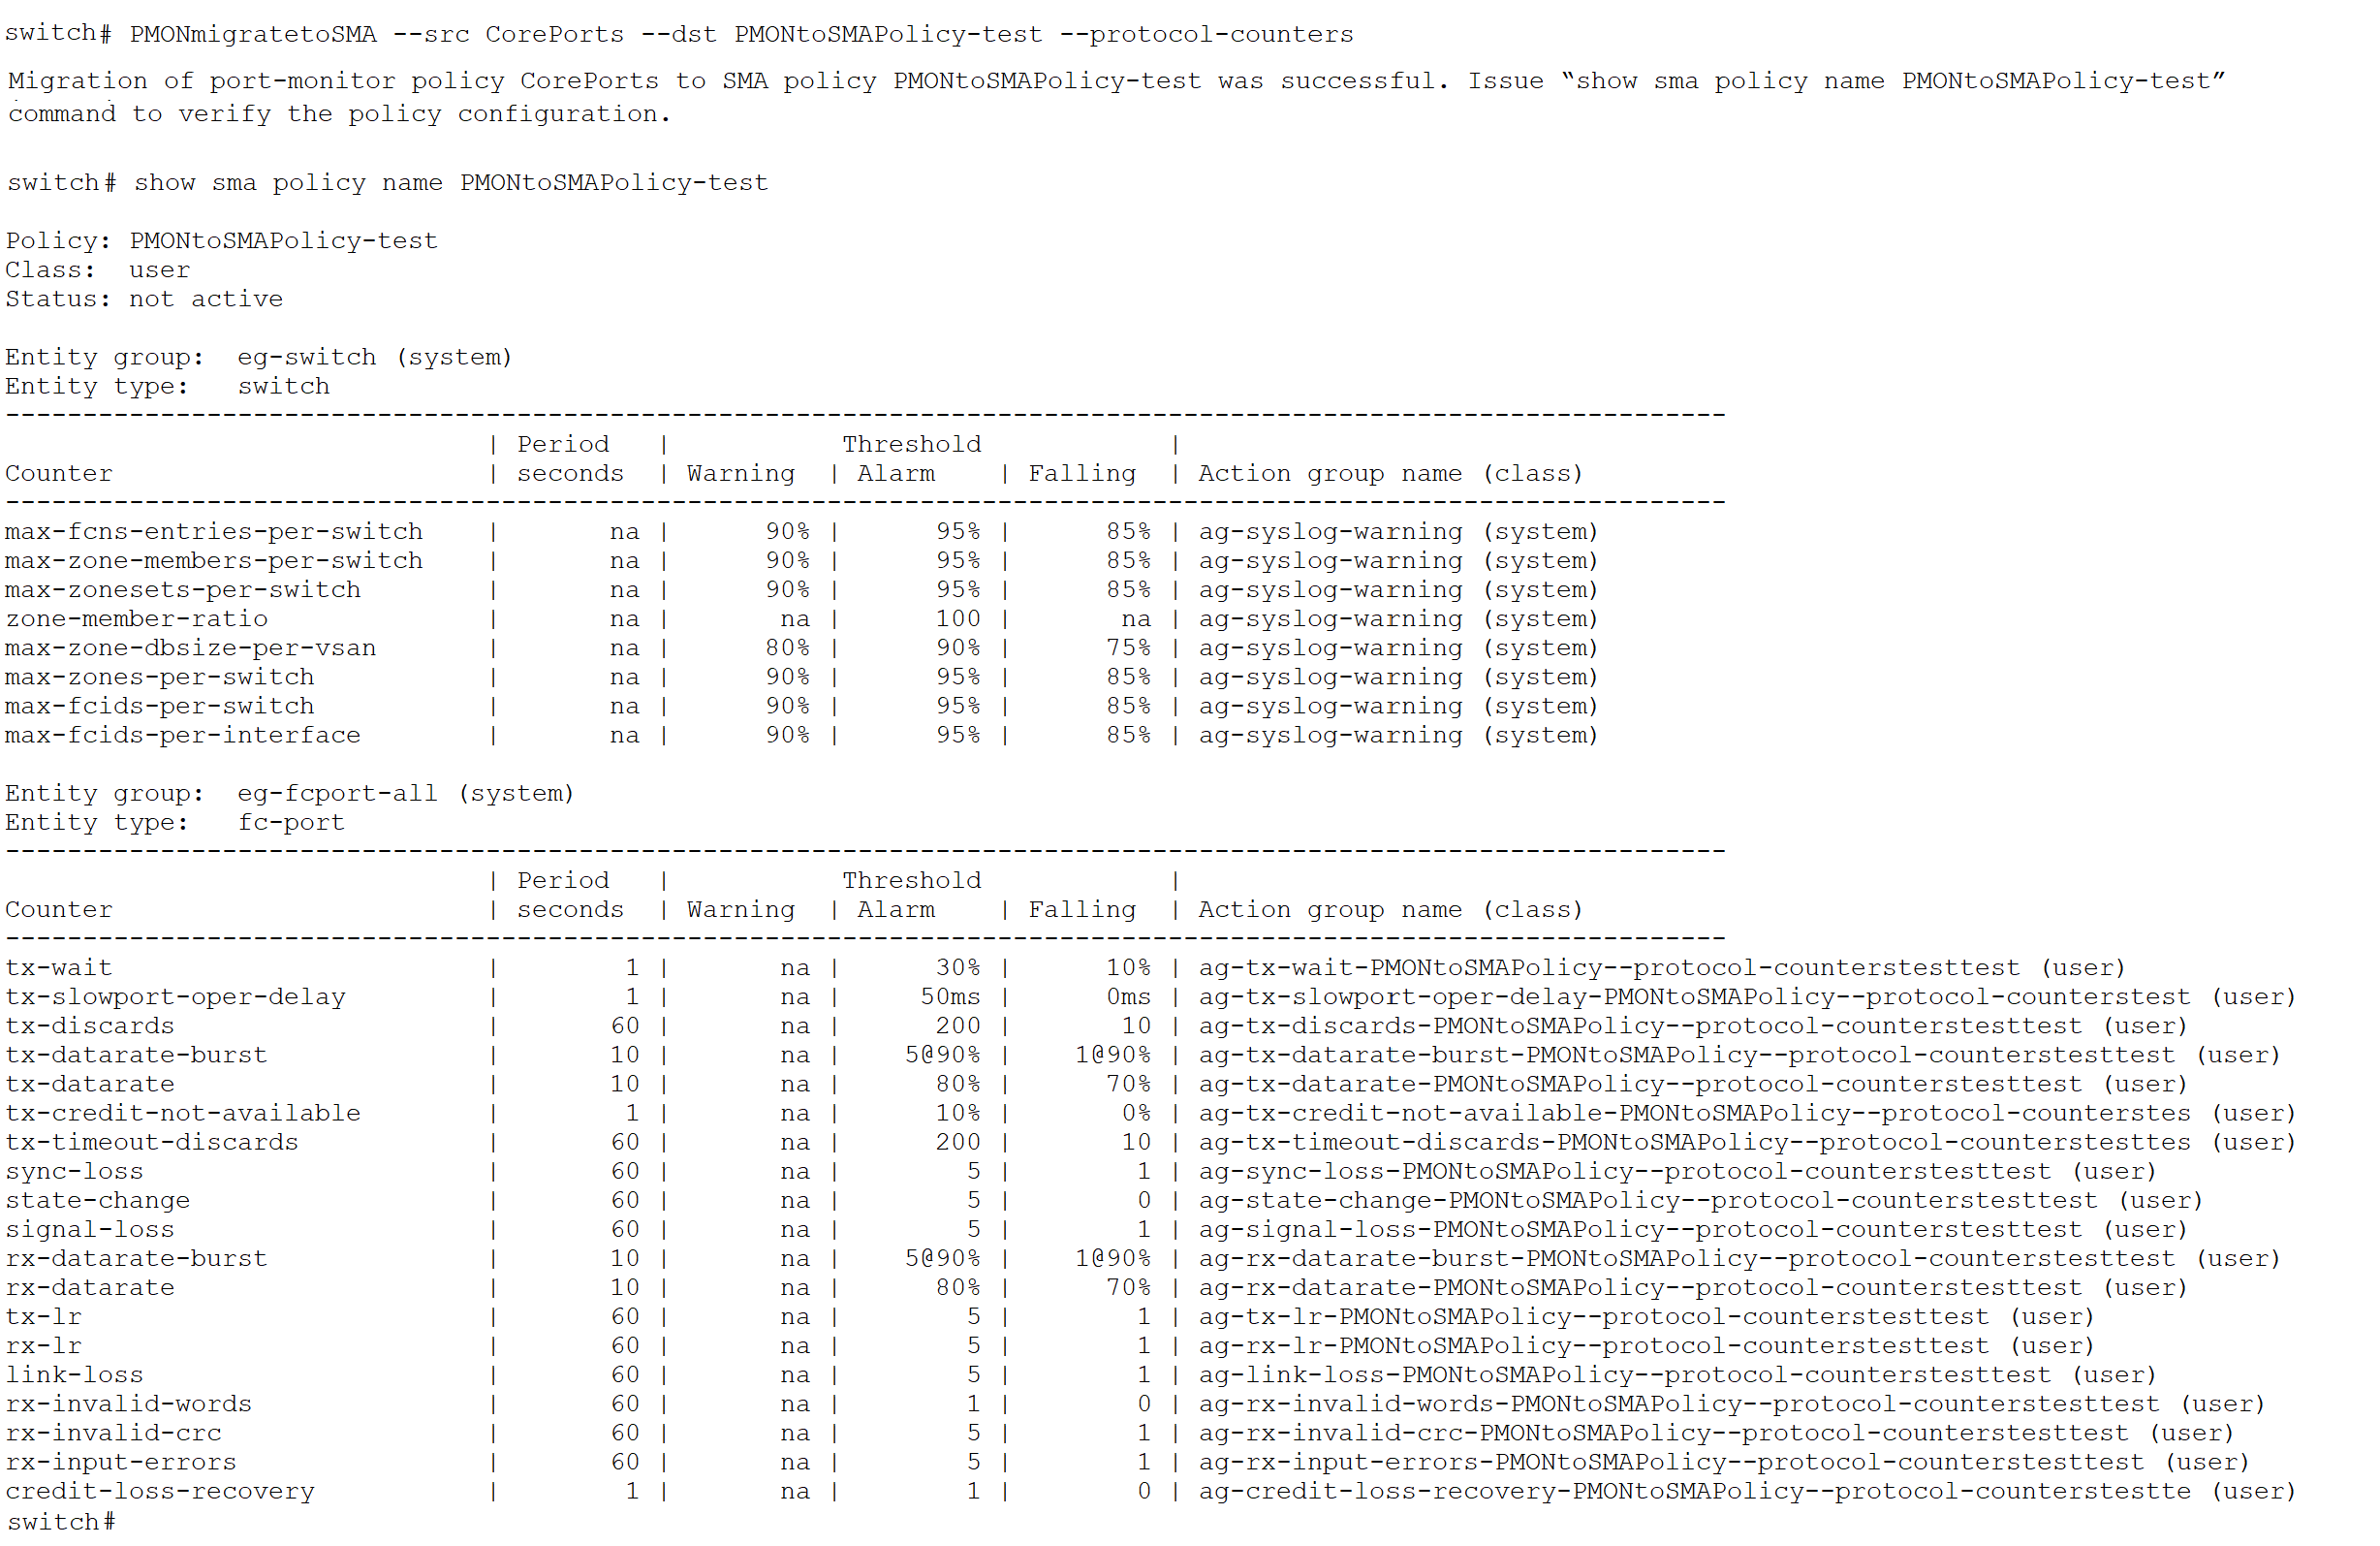
In this example, a user-defined PMON policy named “CorePorts” is active. It has multiple port counters with defined monitor-levels and associated actions or alerts. To migrate this PMON policy to a SMA policy, execute the following command: “PMONmigratetoSMA --src CorePorts --dst PMONtoSMAPolicy-test –protocol-counters”. The command also takes an argument --protocol-counters, which will create a entity-group eg-switch with the respective protocol counters.
The following section provides a detailed comparison of SMA and PMON, emphasizing the enhancements and benefits that SMA introduces. This comparison highlights how SMA not only extends visibility and control but also streamlines monitoring and alerting workflows, making it a superior solution for managing Cisco MDS 9000 storage networks.
Table 2. Comparison between SMA and PMON
| Feature |
Smart Monitoring and Alerting (SMA) |
Port Monitoring (PMON) |
| Monitoring Flexibility |
Provides granular control over monitored entities and thresholds |
Limited ability to customize monitored entities. |
| Monitoring granularity |
Enables precise interface-level monitoring |
Monitoring is restricted to logical core and edge-types |
| Policy Structure |
Unified policy for monitoring different type of entities port-level and protocol-level counters |
A single policy applies to all core and edge ports without per-group customization. EEM feature-set to be configured for protocol counters |
| Counter Grouping |
Provides a hierarchical monitoring model with individual counters and counter groups, enabling efficient organization and management of related metrics by entity group |
Flat monitoring structure with no hierarchy |
| Actions and Alerting Capabilities |
Supports multiple actions and alerts for each threshold level (Alarm/Warning/Falling) |
Single action and alert applied to all thresholds |
| Event logging and Debuggability |
Maintains event history with show SMA history, including counters, actions, alerts, and timestamps |
No support for detailed event logging |
| Entity Group Priority |
Entity group priority follows policy order; topmost group has highest priority. Matching entities adopt the highest-priority group’s configuration |
No concept of entity groups |
| Monitoring of SFP-related counters |
Only the percentage is monitored and not count simplifying the monitoring of SFP-related counters |
Count and percentage of these SFP counters are monitored |
This document provides step-by-step guidance for configuring the new Smart Monitoring and Alerting (SMA) feature in a Cisco SAN fabric. This feature establishes a unified and scalable framework for monitoring Cisco MDS switch infrastructure. It integrates port-level and protocol-level observability within a centralized platform, enabling precise configuration, proactive monitoring, and efficient system health management—resulting in reduced downtime and improved SLAs. The comparison between PMON and SMA clearly demonstrates the numerous advantages that SMA provides over PMON. SMA offers more granular control over monitored entities and thresholds, supports hierarchical organization with counters and counter groups, enables per-threshold actions and alerts, and maintains a detailed history of events, actions, and alerts. Additionally, the overlay CLI command that migrates existing Port Monitoring (PMON) policies into SMA policies ensures a seamless transition and enhances operational efficiency. Collectively, these benefits make a strong case for customers to adopt SMA as their preferred monitoring and alerting solution in Cisco SAN environments.
● Release Notes for Cisco MDS 9000 Series, Release 9.4(4)
● Cisco MDS 9000 Series Interfaces Configuration Guide
● Cisco MDS 9000 Congestion Alerting
Cisco and the Cisco logo are trademarks or registered trademarks of Cisco and/or its affiliates in the U.S. and other countries. To view a list of Cisco trademarks, go to this URL: www.cisco.com/go/trademarks. Third-party trademarks mentioned are the property of their respective owners. The use of the word partner does not imply a partnership relationship between Cisco and any other company. (1721R)
Any Internet Protocol (IP) addresses and phone numbers used in this document are not intended to be actual addresses and phone numbers. Any examples, command display output, network topology diagrams, and other figures included in the document are shown for illustrative purposes only. Any use of actual IP addresses or phone numbers in illustrative content is unintentional and coincidental.
© 2025 Cisco Systems, Inc. All rights reserved.