
Dashboard
The Cisco Nexus Dashboard Orchestrator (NDO) GUI is a browser-based graphical interface for configuring and monitoring your Cisco APIC, Cloud Network Controller, and NDFC deployments.
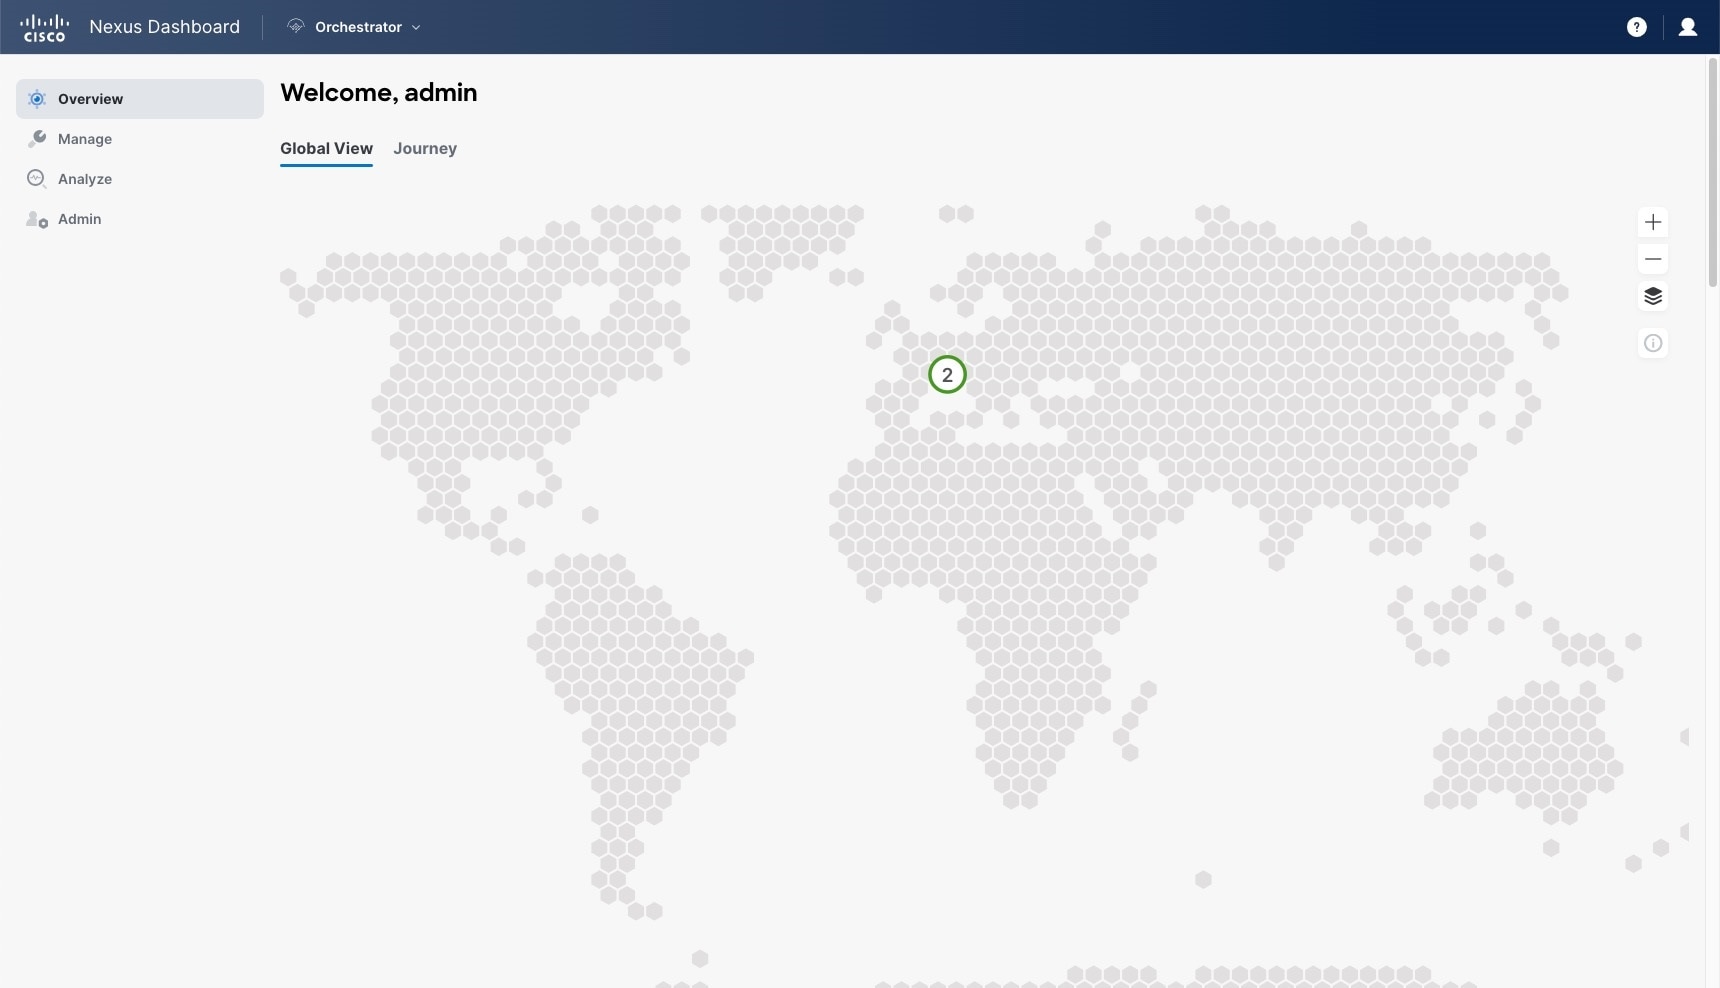
The GUI is arranged according to the functions. For example, the Overview page contains a summary of your fabrics, and their health. Toggle between the Global View map or Journey to view the Getting Started Map.
The top navigation bar contains the common Cisco Nexus Dashboard menus, such as the Nexus Dashboard home button that allows you to return to the Cisco Nexus Dashboard GUI. You can use Orchestrator drop-down list to switch between Admin-Console or to One View.
User menu has options to configure your user preferences, change password, or sign out. The Feedback link is to provide any comments or suggestions about the product, the ? menu includes help, information about the release and welcome screen.
Functions like Operate contain sites and tenants operations, and Configure contains site to site connectivity, tenant configurations, and fabric templates. The Admin category contains functions like System Configurations, Integrations, and so on. The functionality of each NDO GUI page is described in specific chapters later in this document.
Overview
The Cisco Nexus Dashboard Orchestrator Overview option displays a Global View map of your multi-site implementations in addition to their current functionality and health. The Settings icon allows you to overlay, Site to site Connectivity, Tooltips, and the Group Markers information over your map. You can zoom in or out using the + or - icons to any particular region of the map and then use the Save Layout option to save the configuration to the user profile.
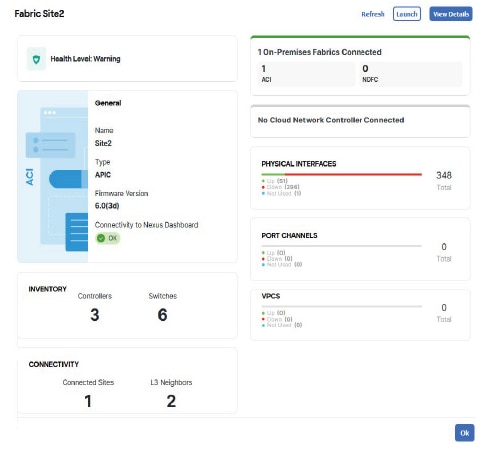
The Sites page provides general information about each site. If you hover the mouse pointer over any particular site, it animates the site to site connectivity and health status. You can click the sites to see Site Details which gives you options like Refresh to reload the details and Launch, which allows you to open the site directly from the Cisco Nexus Dashboard Orchestrator.
Colors coding denotes the fault severity and referenced in the Map Legend icon of the map. Red implies critical, yellow for degraded, and green denotes healthy state. Continuous line implies connectivity and sites or region unreachable by Cisco Nexus Dashboard Orchestrator are grayed out.
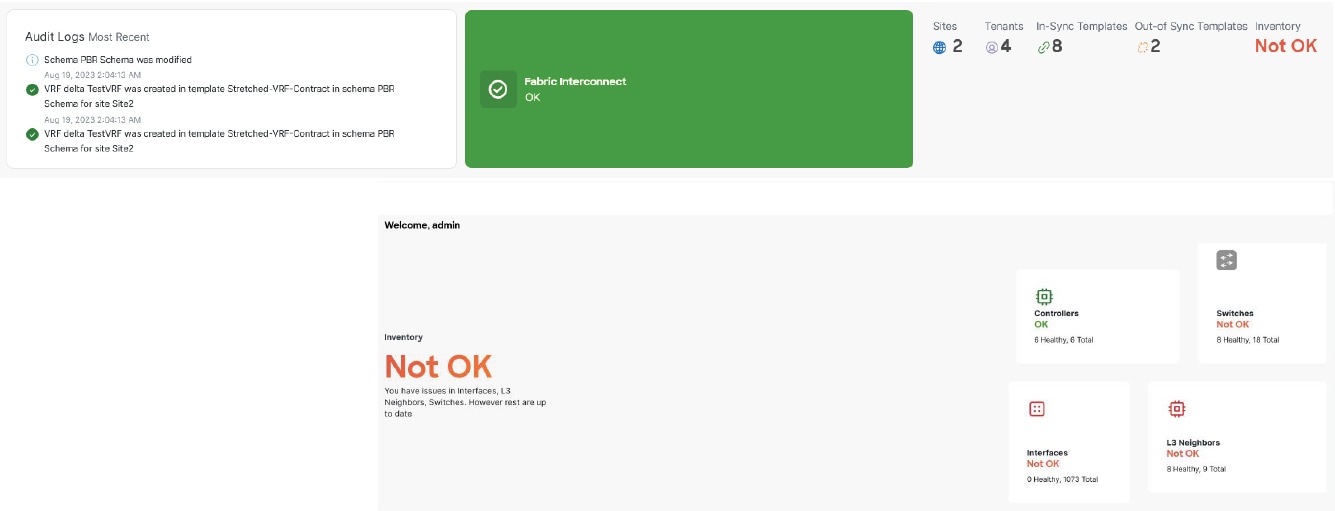
The Overview section has the following functional information:
-
Audit Logs: Captures the most recent events and faults that occur in the environment.
-
Fabric Interconnect: Shows the status of end-to-end interconnect between sites.
-
Number of Sites, Tenants, and In-Sync / Out-of Sync Templates. It also displays the Inventory status.
You can toggle between the Global View map or Journey to access several common tasks, such as adding sites or schemas, configuring specific policies, or performing administrative tasks.
As you are all set in your journey map, you can see a summary of the inventory and status of:
-
Sites: This page shows general information like site health status, connectivity, and inventory information. You can click Site Details to see Operational information about that particular site.
-
Templates: Shows health and number of templates visualized By Type, By Status, and By State.
-
Tenants: Shows health and number of tenants visualized By Policy, By Template, and By Sites.
-
Inventory: Shows inventory health status along with the health status and number of Controllers, Switches, Interfaces, and L3 Neighbors.
Operate
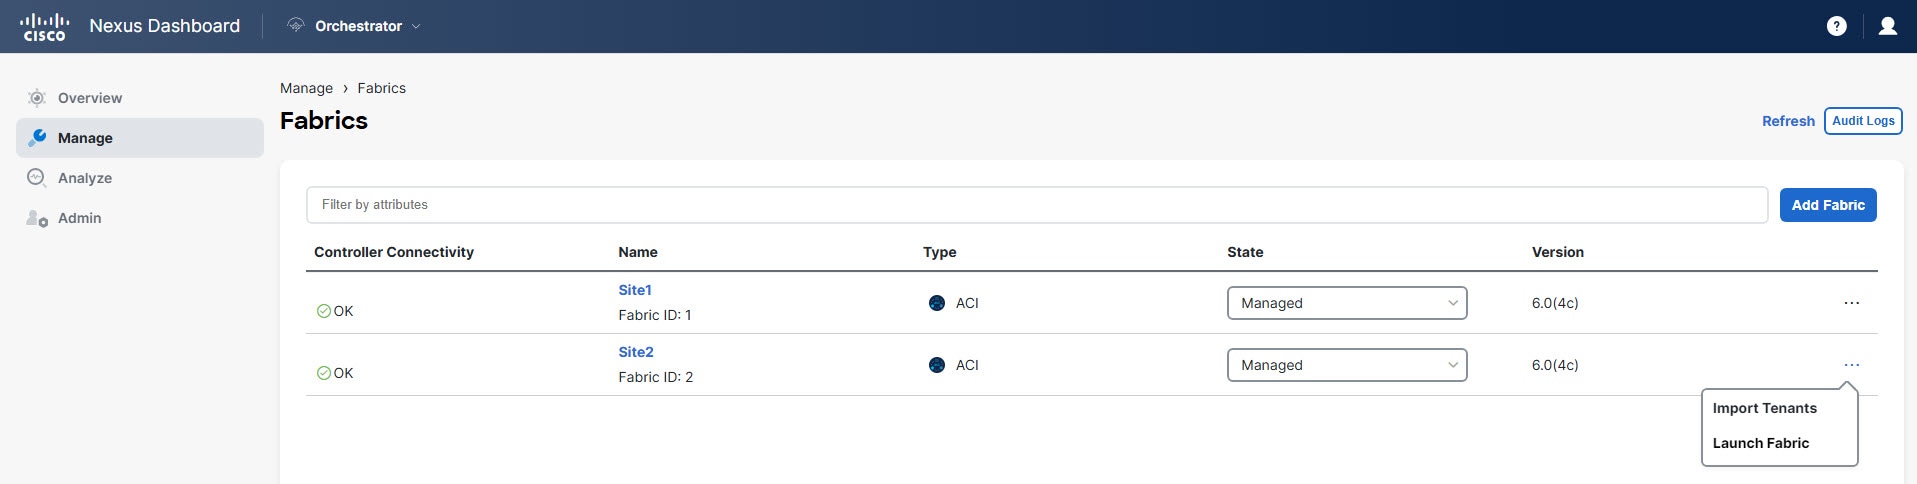
Operate menu allows you to perform operational functions at Sites and Tenants. Sites presents a list of sites in tabular form with operational information. You can filter or sort the table using the attributes like:
-
Controller Connectivity
-
Name
-
Type
-
State
-
Version
The three dots in the last column of the table allow you can open the site’s UI.
You can add a new site using the Add Site button. Click the Audit Logs to review audit logs for a set timeframe.
Configure
Configure menu allows you to configure Site to Site Connectivity and Tenant or Fabric Templates.
You can Configure:
Site to Site Connectivity
Site to Site Connectivity: Shows a global map view of your Multi-Site implementations in addition to their current functionality and health. The Sites page provides general information about each site. If you hover the mouse pointer over any particular site, it animates the site to site connectivity and health status. You can click View Details to see the sites details here you get options like Refresh to reload the details and Launch, which allows you to open the site.
The Settings icon allows you to overlay the map with information like, Site to site Connectivity, Tooltips, and the Group Markers. You can zoom in or out using the + or - icons to any particular region of the map and then use the Save Layout option to save the configuration to the user profile.
Colors coding denotes the fault severity and referenced in the Map Legend icon of the map. Red implies critical, yellow for degraded, and green denotes healthy state. Continuous line implies connectivity and sites or region unreachable by Cisco Nexus Dashboard Orchestrator are grayed out.
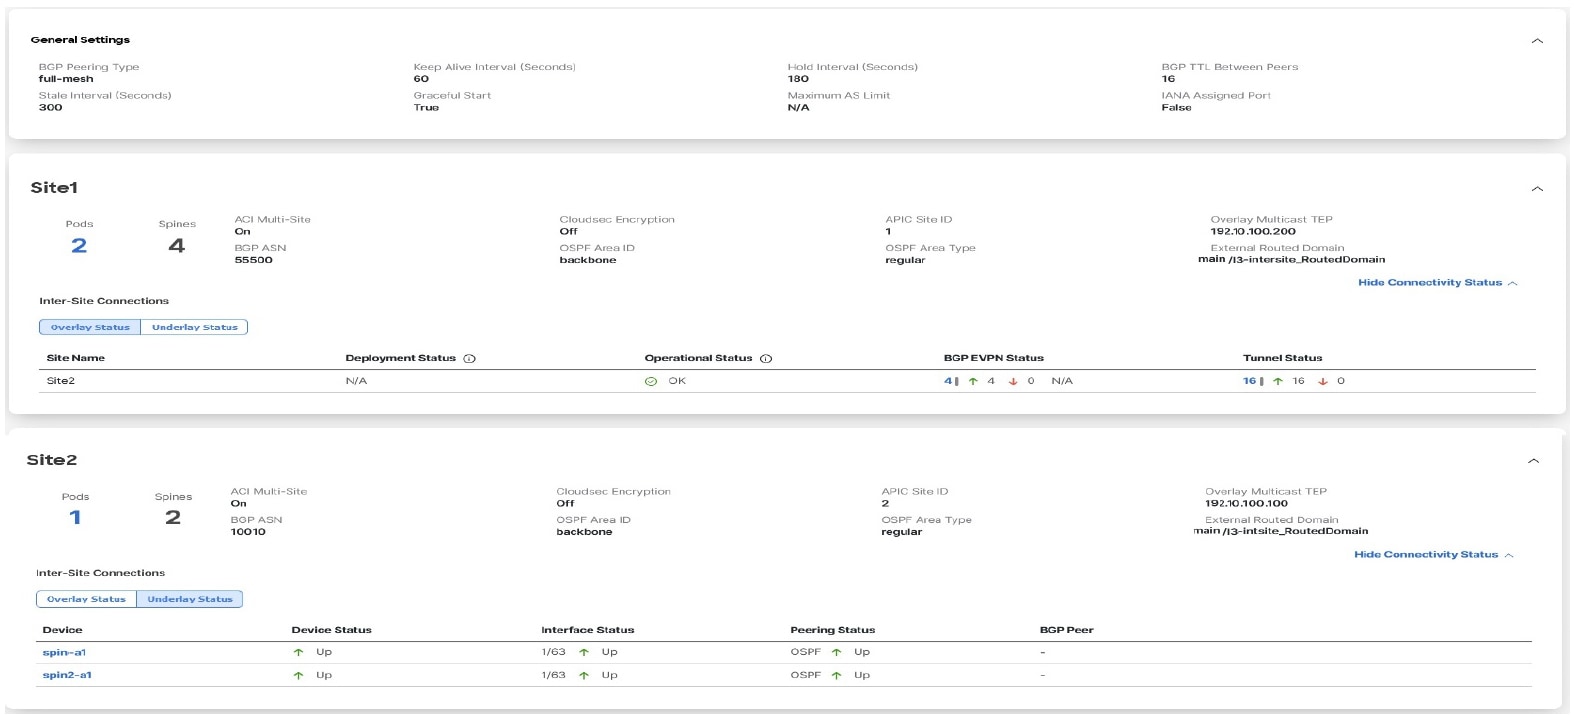
Current control plane site to site connectivity configuration is displayed under the General Settings with fields like:
-
BGP Peering Type
-
Keep alive interval (Seconds)
-
Hold Interval (Seconds)
-
Stale Interval (Seconds)
-
Graceful Restart
-
Maximum AS Limit
-
BGP TTL Between Peers
-
IANA Assigned Port
You can configure these options using the Configure button. This option allows you to review the Audit Logs and also Deploy these configurations. The Sites tab shows the deployment status of individual sites along with its health status.
Tenant Template
Tenant Template configuration has options to configure templates. The page has options for:
-
Applications: This tab shows a table of schemas, you can filter or sort the table using the attributes like templates that are deployed, tenants, and policies associated with the schema. The three dots on the last column of the table allow you to Edit, Delete, and Clone the schema. You can add a new schema using the Add Schema button. You can select an individual schema for an overview of the schema.
-
L3Out: This tab shows a tabular deployment status of the L3Out templates. You can filter or sort the table using the attributes like status, name, tenant, sites, and policies. The three dots on the last column of the table allow you to Edit or Delete the L3Out template. You can add a new L3Out template using the Create L3Out Template button. You can select each individual template to get a summary of the template. You can edit or deploy the template using the appropriate buttons under the summary. Action menu has options to perform site or template level actions.
-
Monitoring Policies: Allows you to create and edit monitoring policies templates.
-
Service Device: This tab shows a tabular deployment status of the service device template. You can filter or sort the table using the attributes like status, name, tenant, sites, and policies. The three dots on the last column of the table allow you to Edit or Delete the service device template. You can add a new Service Device template using the Create Service Device Template button. You can select each individual template to get a summary of the template properties along with each site deployed.
-
Tenant Policies: This tab shows a tabular deployment status of the tenant policy template. You can filter or sort the table using the attributes like status, name, tenant, sites, and policies. The three dots on the last column of the table allow you to Edit or Delete the tenant policy template. You can edit or deploy the template using the appropriate buttons under the Template Summary. You can add a new tenant policy template using the Create Tenant Policy Template button. Action menu has options to perform site or template level actions.
Fabric Template
Fabric Template configuration has options to configure Fabric policy templates. This menu option allows you to configure:
-
Fabric Policies: This tab shows a table of fabric policies. You can filter or sort the table using the attributes like status, name, sites, and policies. The three dots on the last column of the table allow you to Edit or Delete the fabric policy template. You can add a new fabric policy template using the Create Fabric Policy Template button. You can edit or deploy the template using the appropriate buttons under the Template Summary. Action menu has options to perform site or template level actions.
-
Fabric Resource Policies: This tab shows a table of fabric resource policy templates. You can filter or sort the table using the attributes like status, name, sites, and policies. The three dots on the last column of the table allow you to Edit or Delete the fabric resource policy template. You can add a new fabric resource policy template using the Create Fabric Resource Policy Template button. You can edit or deploy the template using the appropriate buttons under the Template Summary. Action menu has options to perform site or template level actions.
-
Monitoring Access Policies: This tab shows a table of monitoring access policy templates. You can filter or sort the table using the attributes like status, name, sites, and policies. The three dots on the last column of the table allow you to Edit or Delete the monitoring access policy template. You can add a new monitoring access policy template using the Create Monitoring Policy Template button. You can edit or deploy the template using the appropriate buttons under the Template Summary. Action menu has options to perform site or template level actions.
Admin
Admin menu allows you to perform administrative functions like system configurations, integrations, software management, tech support, and backups and restore.
Software Management
This option provides the firmware update summary for every Controllers and Nodes in the fabric summary for each site. The Overview tab accounts for status like update completed, downloading, ready to install, installing, not supported, and failed. You can set firmware updates for each site using the Set Update button in either of the tabs. Use Setup Download in the Downloads tab to set up a download firmware update image to the selected sites.
Backup & Restore
Backup and restore menu allows you to upload or create new backup and restore to a remote location. You can schedule backup or restore operations for a remote location using the No Schedule button. This menu also has option to create a new remote location.
System Configuration
The system configuration tab allows you to assign System Alias and Banners along with option to assign the severity to the banner. You can enable the Schema Work Management by editing the Change Control option. You can also view and download the logs in the Audit Logs tab.
Integration
Allows you to integrate SD-WAN domain controllers and policies and DNAC (Cisco DNA) deployment to the fabric.
Tech Support
Tech support option allows you to capture and view the audit logs or all logs with External Streaming option enabled using service like splunk or syslog. You can add a maximum of 5 servers for this operation. You can download and save system logs to your local system using the download button.
First Published: 2024-03-01
Last Modified: 2024-03-01
Americas Headquarters
Cisco Systems, Inc.
170 West Tasman Drive
San Jose, CA 95134-1706
USA
http://www.cisco.com
Tel: 408 526-4000
800 553-NETS (6387)
Fax: 408 527-0883