
Tech Support and System Logs
Cisco Nexus Dashboard Orchestrator system logging is automatically enabled when you first deploy the Orchestrator cluster and captures the events and faults that occur in the environment.
You can choose to download the logs at any time or stream them to an external log Analyzer, such as Splunk, if you want to use more tools to quickly parse, view, and respond to important events without a delay.
The tech support logs are split into two parts:
-
Original database backup files containing the same information as in prior releases
-
JSON-based database backup for ease of readability
Within each backup archive, you find the following contents:
-
x.x.x.x-One or more files in x.x.x.x format for container logs available at the time of the backup. -
msc-backup-<date>_temp-Original database backup containing the same information as previous releases. -
msc-db-json-<date>_temp-Back up contents in JSON format.For example:
msc_anpEpgRels.json
msc_anpExtEpgRels.json
msc_asyncExecutionStatus.json
msc_audit.json
msc_backup-versions.json
msc_backupRecords.json
msc_ca-cert.json
msc_cloudSecStatus.json
msc_consistency.json
...
Downloading System Logs
This section describes how to generate a troubleshooting report and infrastructure logs file for all the schemas, sites, tenants, and users that are managed by Cisco Nexus Dashboard Orchestrator.
-
Log in to your Cisco Nexus Dashboard Orchestrator GUI.
-
Open the System Logs screen.
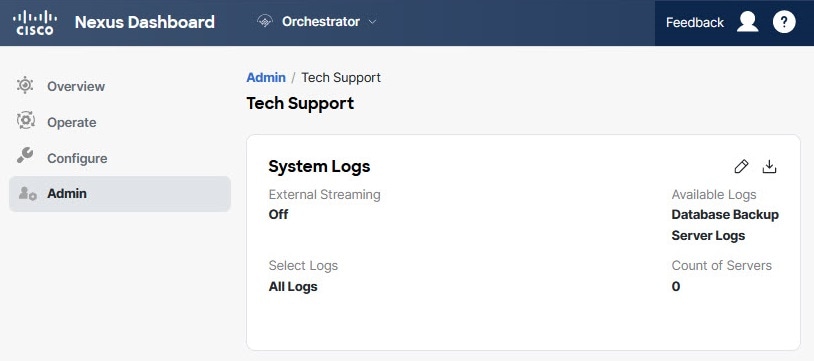 Figure 1. System Logs
-
In the main menu, select Admin > Software Management.
-
In the top-right corner of the System Logs frame, click the edit button.
-
-
Click Download download the logs.
An archive will be downloaded to your system. Containing all the information as described in the first section of this chapter.
Streaming System Logs to External Analyzer
-
This release supports only Splunk and
syslogas external log Analyzer. -
This release supports
syslogfor Cisco Nexus Dashboard Orchestrator in Nexus Dashboard deployments. -
This release supports up to 5 external servers.
-
If using Splunk, set up and configure the log Analyzer service provider.
For detailed instructions on how to configure an external log Analyzer, consult its documentation.
-
If using Splunk, obtain an authentication token for the service provider.
Obtaining an authentication token for Splunk service is detailed in the Splunk documentation, but in short, you can get the authentication token by logging into the Splunk server, selecting Settings > Data Inputs > HTTP Event Collector, and clicking New Token.
Cisco Nexus Dashboard Orchestrator allows you to send the Orchestrator logs to an external log Analyzer tool in real time. By streaming any events as they are generated, you can use the additional tools to quickly parse, view, and respond to important events without a delay.
This section describes how to enable Cisco Nexus Dashboard Orchestrator to stream its logs to an external Analyzer tool, such as Splunk or syslog.
-
Log in to your Cisco Nexus Dashboard Orchestrator GUI.
-
Open the Admin > Tech Support > System Logs screen.
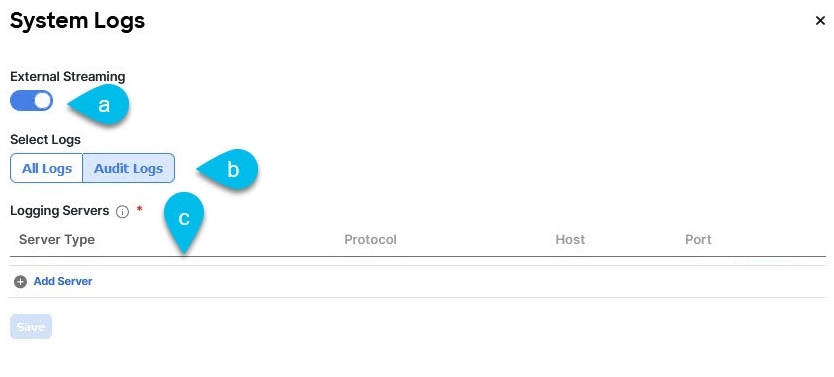
Figure 2. External Analyzer-
In the main menu, select AdminSoftware Management.
-
In the top-right corner of the System Logs frame, click the edit button.
-
-
In the System Logs window, enable external streaming and add a server.
-
Enable the External Streaming knob.
-
Choose whether you want to stream All Logs or just the Audit Logs.
-
Click Add Server to add an external log Analyzer server.
-
-
Add a Splunk server.
If you do not plan to use Splunk service, skip this step.
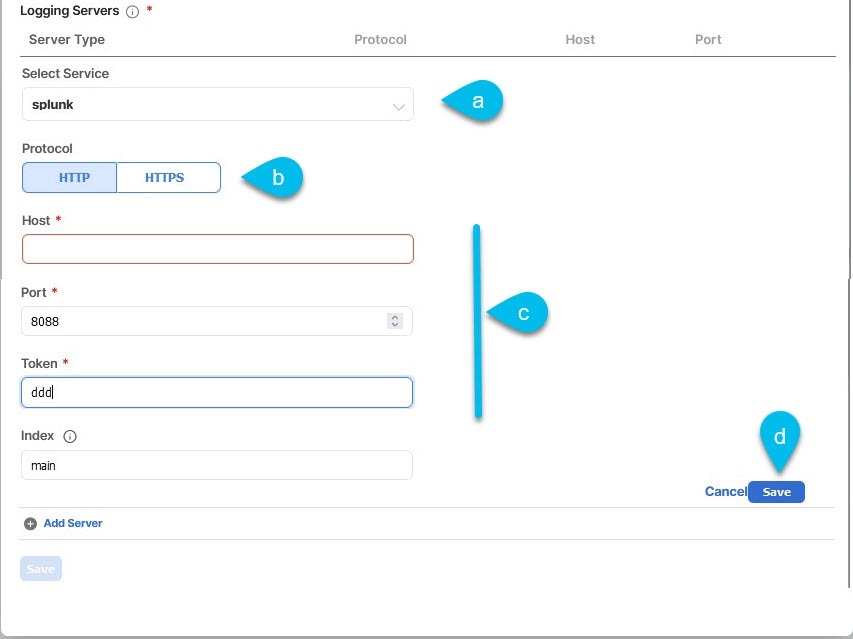 Figure 3. Splunk server
-
Choose
Splunkfor the server type. -
Choose the protocol.
-
Provide the server name or IP address, port, and the authentication token you obtained from the Splunk service.
Obtaining an authentication token for Splunk service is detailed in the Splunk documentation, but in short, you can get the authentication token by logging into the Splunk server, selecting Settings > Data Inputs > HTTP Event Collector, and clicking New Token.
-
Click the check mark icon to finish adding the server.
-
-
Add a
syslogserver.If you do not plan to use
syslog, skip this step.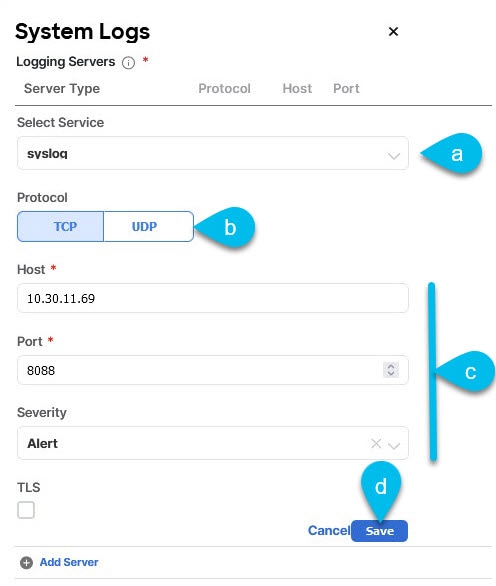 Figure 4. Syslog Server
-
Choose
syslogfor the server type. -
Choose the protocol.
-
Provide the server name or IP address, port number, and the severity level of the log messages to stream.
-
Click the check mark icon to finish adding the server.
-
-
Repeat the steps if you want to add multiple servers.
This release supports up to 5 external servers.
-
Click Save to save the changes.
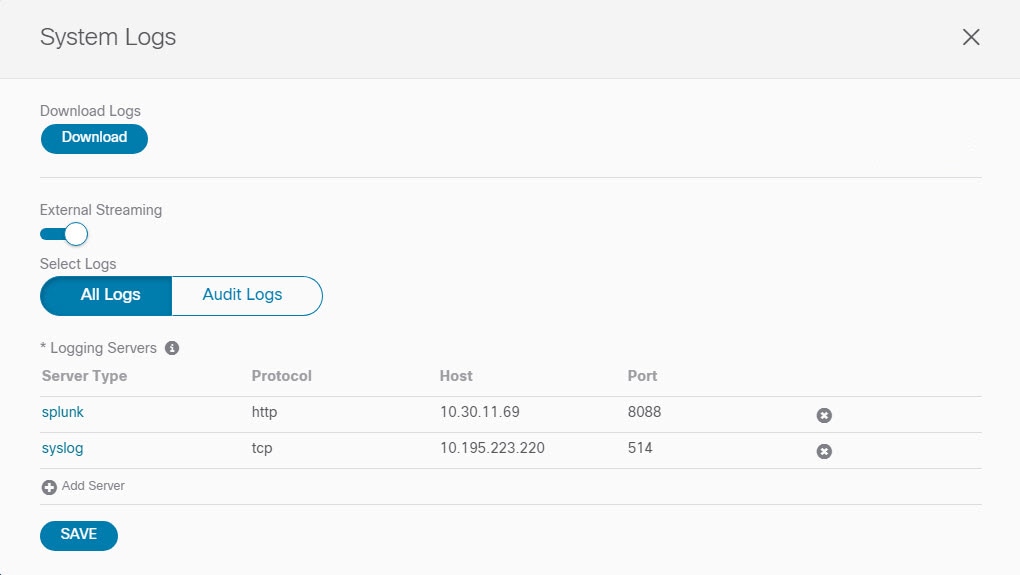 Figure 5. Save
Audit Logs
Cisco Nexus Dashboard Orchestrator system logging is automatically enabled when you first deploy the Orchestrator cluster and captures the events and faults that occur in the environment.
You can view the Cisco Nexus Dashboard Orchestrator logs directly in the GUI by selecting Admin > System Configuration > Audit Logs from the main navigation menu.
From the Audit Logs page, you can click the Time Frame (shown as a range of dates) field to select a specific time period for which you want to see the logs. For example, when you select the range from November 14, 2019 to November 17, 2019 and click Apply, the audit log details for this time period are displayed on the Audit Logs page.
You can also click the Filter icon to filter the log details using the following criteria:
-
User: Select this option to filter the audit logs by the user type, then click Apply to apply the filter.
-
Type: Select this option to filter the audit logs by the policy types (for example,
site,user,template) and click Apply. -
Action: Select this option to filter the audit logs by an action. The available actions are Created, Updated, Deleted, Added, Removed, Associated, Disassociated, Deployed, Undeployed, Downloaded, Uploaded, Restored, signed in, Logged Out, sign-in Failed. Select an action and click Apply to filter the log details according to the action.
First Published: 2024-03-01
Last Modified: 2024-03-01
Americas Headquarters
Cisco Systems, Inc.
170 West Tasman Drive
San Jose, CA 95134-1706
USA
http://www.cisco.com
Tel: 408 526-4000
800 553-NETS (6387)
Fax: 408 527-0883